Back to Journals » International Journal of General Medicine » Volume 14
Novel Ferroptosis-Related Multigene Prognostic Models for Patients with Bladder Cancer
Authors Zhang S, Wang C ![]() , Xia W, Duan H, Qian S
, Xia W, Duan H, Qian S ![]() , Shen H
, Shen H ![]()
Received 29 September 2021
Accepted for publication 11 November 2021
Published 23 November 2021 Volume 2021:14 Pages 8651—8666
DOI https://doi.org/10.2147/IJGM.S339996
Checked for plagiarism Yes
Review by Single anonymous peer review
Peer reviewer comments 2
Editor who approved publication: Dr Scott Fraser
Shun Zhang,* Cheng Wang,* Weimin Xia, Huangqi Duan, Subo Qian, Haibo Shen
Department of Urology, Xinhua Hospital, School of Medicine, Shanghai Jiao Tong University, Shanghai, 200092, People’s Republic of China
*These authors contributed equally to this work
Correspondence: Haibo Shen;Subo Qian Tel +86-13651698392
; +86-13761020575
Fax +86-21-25078095
Email [email protected]; [email protected]
Objective: Bladder cancer contributes to a serious disease burden in clinical settings. The characteristics and prognosis of patients with muscle-invasive bladder cancer (MIBC) and non-muscle-invasive bladder cancer (NMIBC) are distinctly different. The study aims to figure out the respective role of ferroptosis in MIBC and NMIBC and to construct ferroptosis-related gene signatures that could predict patients’ prognoses.
Methods: A total of 608 MIBC and 414 NMIBC RNA-seq transcriptome data with intact clinical and follow-up information were downloaded from The Cancer Genome Atlas (TCGA), ArrayExpress, and Gene expression omnibus (GEO) database. Ferroptosis-related multigene prognostic models were constructed and externally validated, respectively, in MIBC and NMIBC. Further functional enrichment analyses were also performed to explicate the underlying mechanisms and the differences between the two bladder cancer subtypes.
Results: In MIBC, a 7-gene signature for prognostic prediction was constructed. Patients were then divided into high-risk and low-risk groups according to the risk scores calculated by the 7-gene prognostic model. Patients in the high-risk group presented an impaired OS when compared with patients in the low-risk group both in the training cohort and validation cohort. Further functional analyses revealed distinctly different immune statuses between the two risk-stratification groups, speculating that exhausted immune cell function was a cause of the worst OS in the high-risk group. In NMIBC, 6 ferroptosis-related genes were identified that were significantly correlated with recurrence-free survival (RFS). Similarly, a 6-gene prognostic model was constructed and verified as an independent prognostic predictor for RFS. Functional analyses revealed significant differences in the expressions of nuclear division genes between the high-risk group and low-risk group.
Conclusion: Two novel ferroptosis-related multigene prognostic models for, respectively, predicting OS in MIBC and RFS in NMIBC were identified in this study, which indicated ferroptosis played vital roles in the oncogenesis and development of MIBC and NMIBC.
Keywords: ferroptosis, bladder cancer, MIBC, NMIBC, prognosis, gene signature
Graphical Abstract:

Introduction
Bladder cancer is the 10th most commonly diagnosed cancer and the 9th most common cause of cancer death worldwide, which accounts for estimated 573,000 new cases and 213,000 deaths in 2020.1 Generally, bladder cancer can be categorized into MIBC and NMIBC, or can be further classified into papillary urothelial neoplasms of low malignant potential (PUNLMP), low-grade, and high-grade papillary urothelial carcinoma, according to the pathological risk stratification. MIBC and NMIBC have unique pathological features and molecular characteristics, leading to different prognosis outcomes. The prognosis of MIBC is poor, with a 5-year survival rate of only 47%, while NMIBC patients have a better 5-year survival rate of around 81%.2 However, the high recurrence rate of NMIBC concerns another big deal. As reported, the 10-year recurrence rate reaches 74% in high-grade patients, which desires rigorous post-treatment surveillance and follow-up.3 Until now, the generation of treatment strategies for bladder cancer mainly relies on the clinicopathological prognostic biomarkers, like tumor grade and stage, but none are accurate enough. Therefore, we are eager to find novel biomarkers that can predict the prognosis of bladder cancer, so as to guide early and personalized interventions in clinical practice.
Ferroptosis is a novel regulated cell death pathway, which is strictly dependent upon intracellular iron, and is morphologically, biochemically, and genetically distinct from apoptosis, necrosis, and autophagy.4 When the redox homeostasis is impaired, lipid peroxides cannot be effectively metabolized by the intracellular antioxidant systems, and Fe2+ alternatively oxidizes lipids in a Fenton-like manner, a large number of reactive oxygen species (ROS) will be generated, which promotes ferroptosis.5 Despite the important role of ferroptosis in sustaining the survival of normal cells and tissues, emerging evidence implicated that ferroptosis might be also critical for eradicating cancers.6 A few studies have proved the central role of ferroptosis in hepatocellular carcinoma (HCC),7 colorectal cancer,8 triple-negative breast cancer (TNBC),9 and clear cell renal cell carcinoma (ccRCC).10 However, the regulating role of ferroptosis in bladder cancer is still unknown. Although several recent studies reported that ferroptosis-related gene signature presented significant predictive value for bladder cancer in the early of this year,11–17 they all did not differentiate MIBC and NMIBC in their research and pay enough attention on the NMIBC patients which consist of the great majority of bladder cancer patients.
In the present study, we constructed ferroptosis-related multigene prognostic models for MIBC and NMIBC, respectively, and did the external validation as well, to find out the role of ferroptosis in the tumorigenesis and development of bladder cancer. We also identified the differences in patients’ characteristics between MIBC and NMIBC patients, as well as two ferroptosis-related risk-stratification subgroups.
Materials and Methods
Data Collection
The RNA-seq transcriptome data and clinical features of 430 patients in the training cohort of MIBC were downloaded from the TCGA database (https://portal.gdc.cancer.gov/) up to May 29, 2021. After excluding 30 patients without clinical data, 400 patients were finally enrolled. The patients in the validation cohort (178 patients) of MIBC were from ArrayExpress (E-MTAB-1803, 85 patients, https://www.ebi.ac.uk/arrayexpress/) and the GEO database (GSE31684, 93 patients, https://www.ncbi.nlm.nih.gov/geo).
The data of NMIBC patients were downloaded from ArrayExpress (E-MTAB-4321, 414 patients), of which 208 patients were randomly allocated to the training cohort, and the remaining 206 patients were allocated to the validation cohort. The gene expression profiles were normalized using the scale method provided in the “limma” R package.
Construction of the Ferroptosis-Related Prognostic Models for Bladder Cancer
Sixty-one ferroptosis-related genes were collected from the previous works in the literature (Supplementary data 2). The “limma” R package was used to identify the differentially expressed genes (DEGs) between tumor tissues and para-carcinoma tissues with a false discovery rate (FDR) <0.05 in the cohorts. Univariate Cox analyses of OS or RFS were performed to screen ferroptosis-related genes with prognostic values by using the “survival” R package. Interaction networks for the overlapping prognostic DEGs were obtained from the STRING database. The correlation networks of candidate genes were generated by the “igraph” and “reshape2” R packages. LASSO-penalized Cox regression analysis was applied to construct prognostic models with the “glmnet” R package. Risk scores of the patients were calculated according to the normalized expression level of each gene and its corresponding regression coefficient. Then, all patients were divided into the high-risk group or low-risk group based on the median values of the risk score.
External Validation of the Ferroptosis-Related Prognostic Models in Bladder Cancer
The Kaplan–Meier curve was used to compare the differences in OS or RFS between patients in high-risk group and low-risk group using the Log rank test with “survival” and “survminer” R packages. The receiver operating characteristic (ROC) curve was used to evaluate the sensitivity and specificity of our models using the “survival”, “survminer”, and “timeROC” R packages. Principal component analysis (PCA) and t-distributed stochastic neighbor embedding (t-SNE) analysis were used to visualize the data in two dimensions with the “Rtsne” and “ggplot2” packages. The univariate and multivariate Cox regression analyses were used to determine the independent prognostic factors using the “survival” package. A nomogram was used to predict the survival probability of MIBC patients with the “rms” R package.
Functional Analyses of the Ferroptosis-Related Prognostic Models in Bladder Cancer
Gene ontology (GO) and Kyoto Encyclopedia of Genes and Genomes (KEGG) were conducted to investigate the potential functions of genes between high- and low-risk groups using the “clusterProfiler” R package. Single sample gene set enrichment analysis (ssGSEA) was used to evaluate the infiltrated levels of immune cell subtypes and immune functions between the two groups with “gsva” R package. Boxplots were used to show the differential expressions of immune checkpoint genes and exhausted T-cell signatures between the two groups using “ggpubr” R package. The expression correlations of the exhausted T-cell signatures and the 7 ferroptosis signatures in MIBC patients were generated by GEPIA2 (http://gepia2.cancer-pku.cn). Heatmap of nuclear division-related genes expressions in NMIBC patients was drawn by “pheatmap” R package.
Results
Enrollment and Characteristics of Bladder Cancer Patients
The diagram of this study is shown in Figure 1. For MIBC, a total of 400 patients from the TCGA cohort, 85 patients from the ArrayExpress, and 93 patients from the GEO cohort were finally enrolled. For NMIBC, a total of 414 patients from ArrayExpress were finally enrolled. Clinical characteristics of these patients were summarized in Tables 1 and 2. Detailed clinical data can be found in Supplementary Data 1.
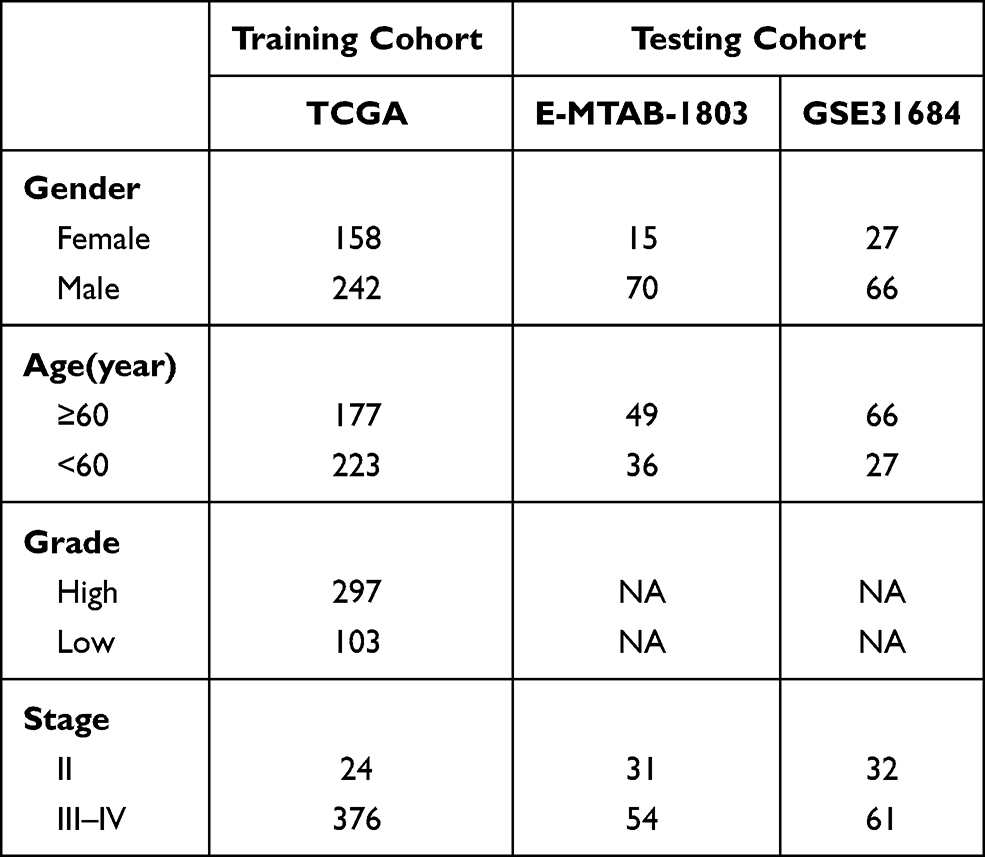 |
Table 1 Clinical Characteristics of the MIBC Patients in This Study |
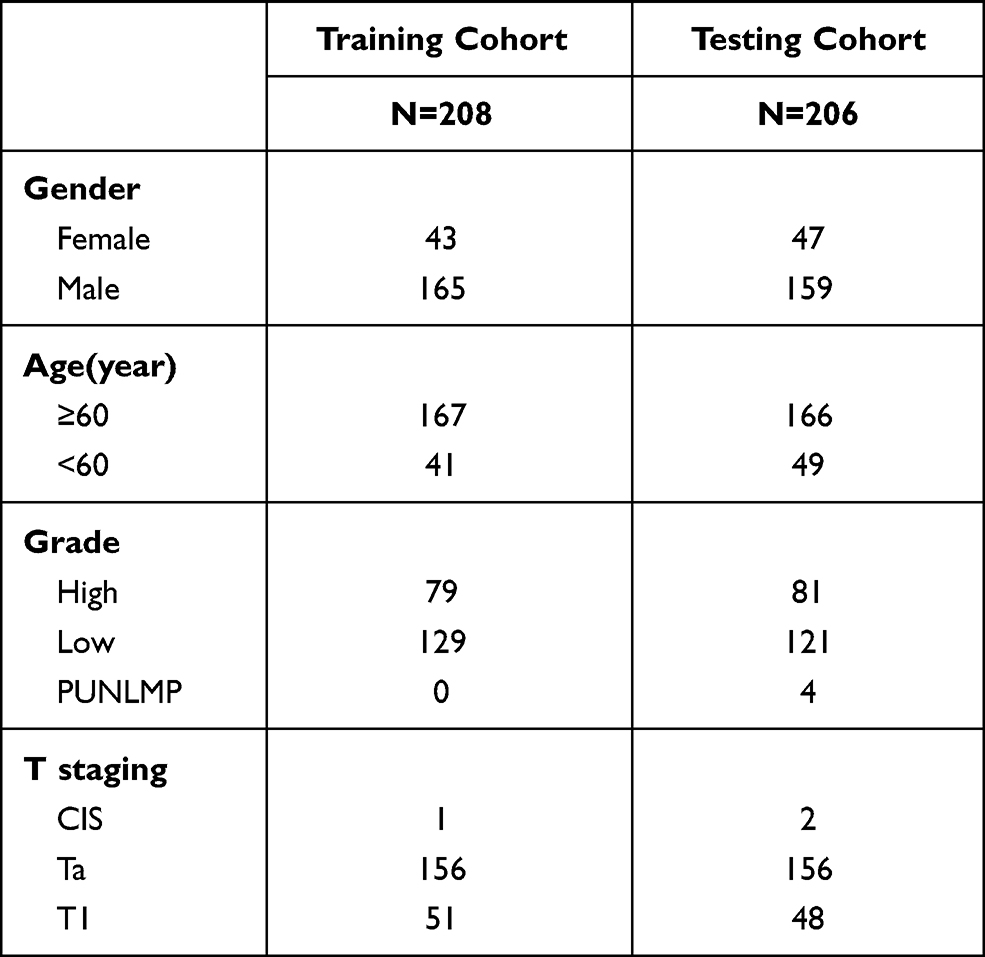 |
Table 2 Clinical Characteristics of the NMIBC Patients in This Study |
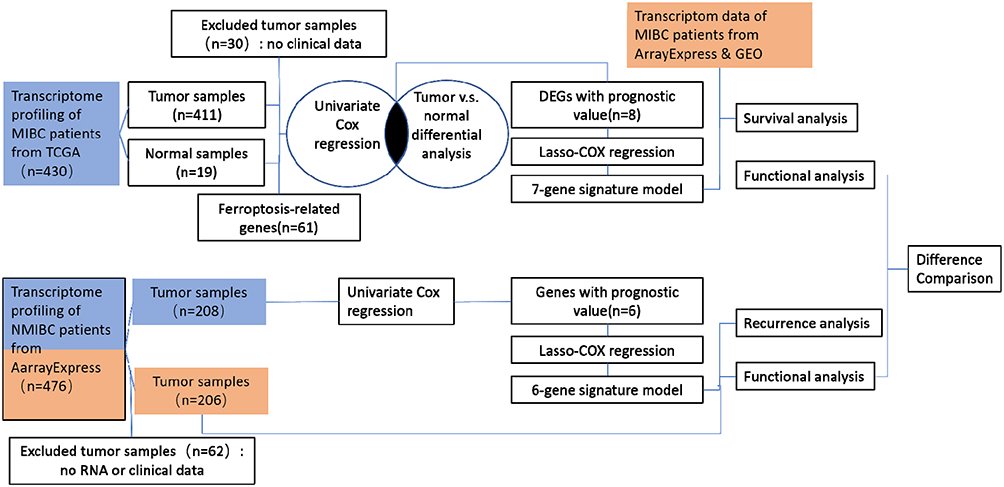 |
Figure 1 Diagram of data collection and analysis. Training cohorts were shown in blue and validation cohorts were shown in Orange. |
Identification of DEGs and Ferroptosis-Related Genes Associated with Prognosis in MIBC
A total of 61 ferroptosis-related genes were screened from the previous works in the literature18–20 (Supplementary data 2), and 16 of which were associated with OS by the univariate Cox regression analysis (Figure 2A). After overlapping with 29 ferroptosis-related genes that were differentially expressed between tumor tissues and para-carcinoma tissues, 8 genes were identified as candidates (Figures 2B and C, Supplementary data 2), ie, ZEB1, GCLM, CRYAB, SLC3A2, SQLE, G6PD, ACSF2, and TFRC. In addition to ACSF2, which showed a positive association with OS, the other 7 genes were all risk factors of OS in MIBC patients (HR > 1, p < 0.05) (Figure 2D). The interaction network and correlation analysis among these genes indicated that GCLM, G6PD, and SLC3A2 were the hub genes (Figure 2E and F).
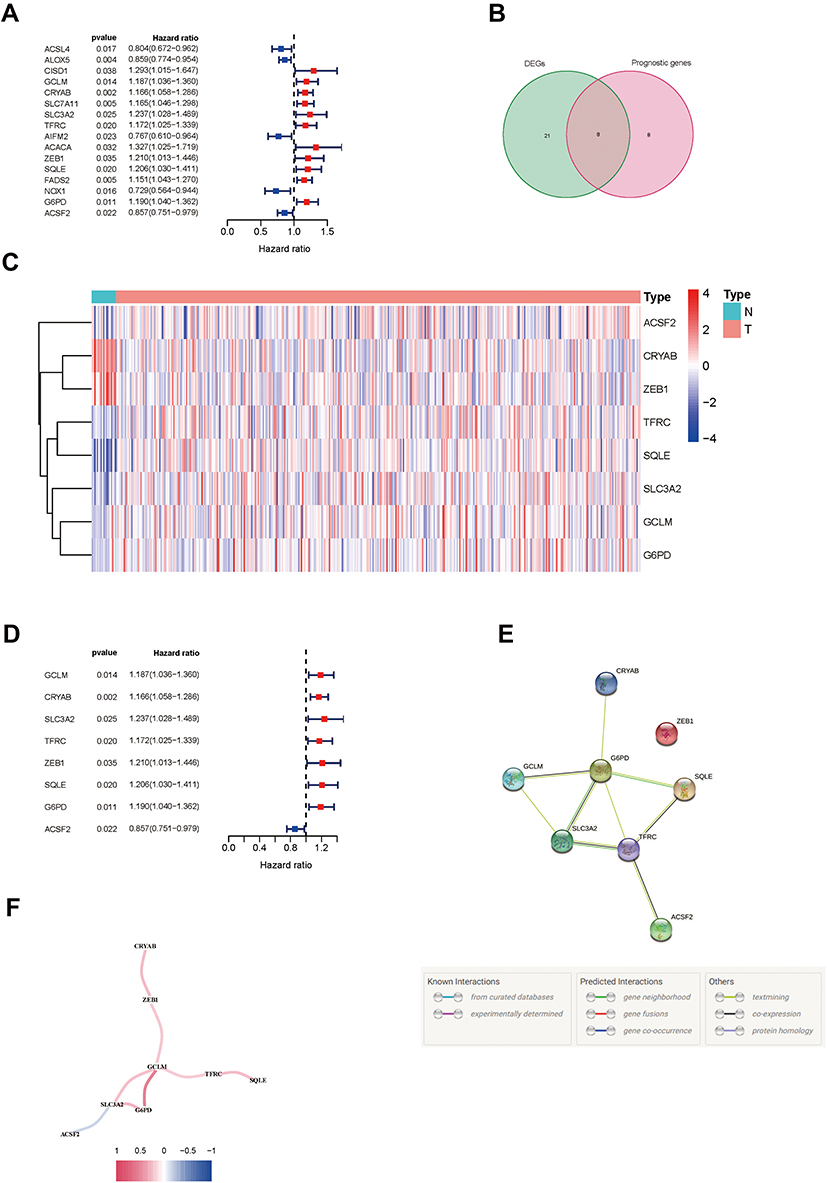 |
Figure 2 Identification of prognostic ferroptosis-related genes in MIBC. (A) Forest plots showing the results of the univariate Cox regression analysis of ferroptosis genes that were correlated with OS in MIBC. (B) Venn diagram to identify differentially expressed genes between tumor and para-carcinoma tissues that were correlated with OS. (C) Heatmap of the 8 overlapping genes expression in the TCGA cohort. (D) Forest plots showing the results of the univariate Cox regression analysis of the overlapping genes with OS. (E) The PPI network downloaded from the STRING database indicated the interactions among the candidate genes. (F) The correlation network of candidate genes. High correlation coefficients are represented in red and low correlation coefficients are represented in blue. Abbreviations: MIBC, muscle-invasive bladder cancer; OS, overall survival; TCGA, The Cancer Genome Atlas. |
Construction and External Validation of the Ferroptosis-Related Prognostic Model in MIBC
As ZEB1 showed low interactions with other genes (Figure 2E) and was not detected in the validation cohort, it was ultimately excluded from the prognostic model. LASSO Cox regression analysis was applied to establish the prognostic model using the expression profile of the rest 7 genes mentioned above. The risk score was calculated by the following formula for each patient: 0.067 * expression level of GCLM + 0.162 * expression level of CRYAB + 0.070 * expression level of SLC3A2 + 0.102 * expression level of TFRC + 0.108 * expression level of SQLE + 0.076 *expression level of G6PD - 0.054 * expression level of ACSF2. Then, all the patients were divided into a high-risk group (n = 200) or a low-risk group (n = 200) according to the median cut-off value of the risk score (Supplementary data 3). The Kaplan–Meier curve indicated that patients in the high-risk group had a significantly worse OS than those in the low-risk group (Figure 3A). To verify the efficacy of the prognostic model constructed from the TCGA cohort, we repeated the same analyses in the validation cohort. The patients in the validation cohort were also stratified into a high-risk group (n = 89) or a low-risk group (n = 89) by the median value of the risk score calculated by the same formula mentioned above (Supplementary data 4). Consistent with the TCGA cohort, patients in the high-risk group from the validation cohort showed a significantly worse OS than in the low-risk group (Figure 3B). PCA and t-SNE analyses enabled us to visualize how patients in different risk groups were distributed in two directions (Figures 3C and D). As shown in Figures 3E and F, patients with high risk had a higher probability of premature death than those with low risk.
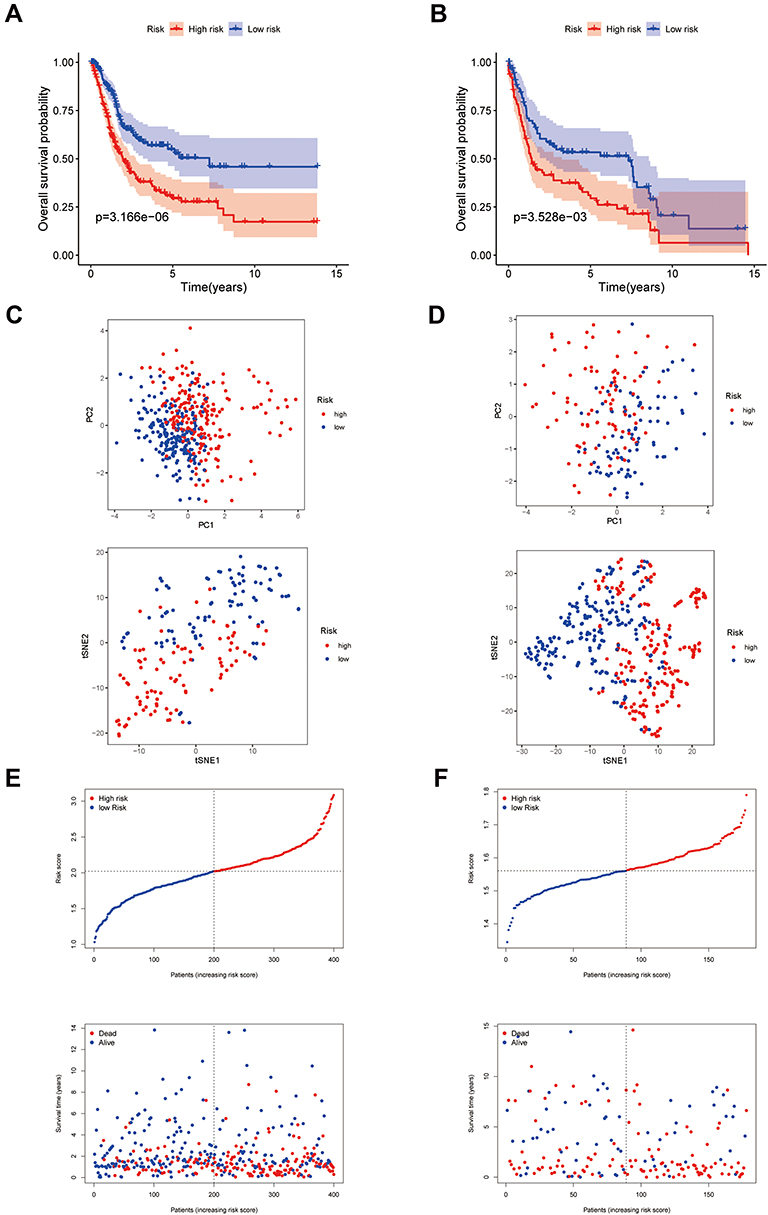 |
Figure 3 Construction of the 7-gene prognostic model in the TCGA cohort and validation cohort. (A and B) Kaplan–Meier curves for the OS of patients in the high-risk group and low-risk group in the TCGA cohort (A) and validation cohort (B). (C and D) PCA plot and t-SNE analysis of the TCGA cohort (C) and validation cohort (D). (E and F) The distribution of the risk scores, OS statues, and the correlations between OS and risk scores in the TCGA cohort (E) and validation cohort (F). Abbreviations: OS, overall survival; TCGA, The Cancer Genome Atlas; PCA, Principal Component Analysis; t-SNE, t-distributed stochastic neighbor embedding. |
Accuracy Verification of the Ferroptosis-Related Prognostic Model in MIBC
To verify the accuracy of our prognostic model, ROC curves were plotted in the training cohort and validation cohort, respectively. The area under the ROC curve (AUC) of the 7-gene signature was 0.624 at 1 year, 0.616 at 2 years, and 0.639 at 3 years in the TCGA cohort (Figure 4A). In the validation cohort, the AUC at the 1, 2, and 3 years were 0.596, 0.579, and 0.565, respectively (Figure 4B). To determine whether the risk score was an independent prognostic predictor for OS, univariate and multivariate Cox regression analyses were performed among the available variables. In univariate Cox regression analyses, the risk score was significantly associated with OS in the TCGA cohort (HR = 3.022, 95% CI = 2.002–4.563, P < 0.001) (Figure 4C). After adjusting for other confounding factors, the risk score was still proved to be an independent predictor for OS in the multivariate Cox regression analysis (adjusted HR = 2.632, 95% CI = 1.712–4.046, P < 0.001) (Figure 4D). After combining with the other four indexes including age, gender, tumor grade, and stage, which were confirmed also closely associated with OS by multivariate Cox regression analysis, a novel nomogram was constructed. For a specific bladder cancer patient in clinical practice, the 5-year survival probability could be predicted based on his/her age, gender, tumor grade, and stage, and risk score (Figure 4E).
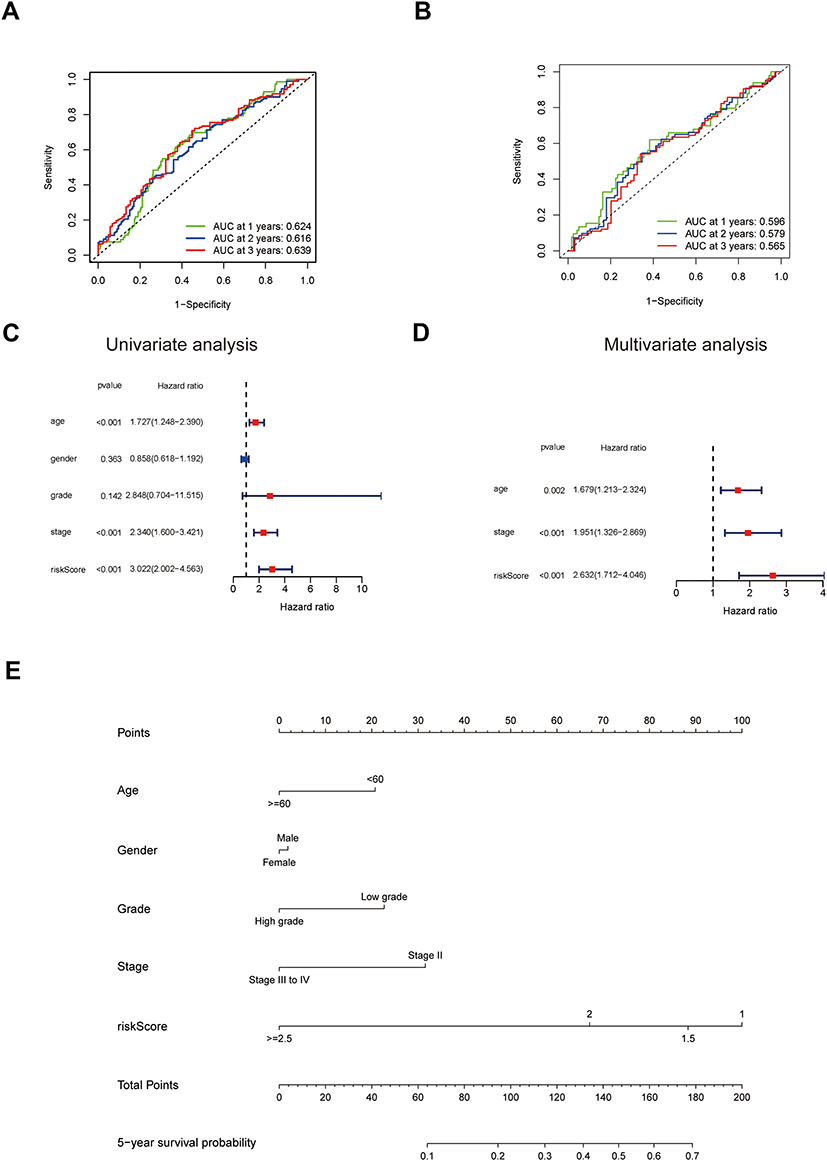 |
Figure 4 Accuracy verification of the ferroptosis-related prognostic model in MIBC. (A and B) AUC of time-dependent ROC curves verified the prognostic performance of the risk score in the TCGA cohort (A) and validation cohort (B). (C) Results of the univariate Cox regression analyses regarding OS in the TCGA cohort. The risk score is significantly associated with the survival of MIBC patients. (D) Results of the multivariate Cox regression analyses regarding OS in the TCGA cohort. The risk score is an independent prognostic factor in MIBC patients. (E) Nomogram for the prediction of 5-year survival probability in patients with MIBC. Lower total points are associated with a lower 5-year survival probability. Abbreviations: AUC, area under the curve; TCGA, The Cancer Genome Atlas; ROC, Receiver Operating Characteristic; OS, overall survival; MIBC, muscle-invasive bladder cancer. |
Functional Analyses in the TCGA Cohort
To find out the biological functions and pathways that were different in high- and low-risk groups, the DEGs between the two groups were used to perform GO enrichment and KEGG pathway analyses. Interestingly, the DEGs from the TCGA cohort were remarkably enriched in many immune-related biological processes (q value <0.05, Figure 5A). KEGG pathway analyses also enriched many immune-related pathways, including the cytokine–cytokine receptor interaction pathway, chemokine signaling pathway, IL-17 signaling pathway, NF-kappa B signaling pathway, Toll-like receptor signaling pathway, etc. (q value <0.05, Figure 5B).
 |
Figure 5 Representative results of GO and KEGG analyses. (A) The GO enrichment analysis between high-risk and low-risk groups in MIBC. Red box: Immune-related biological processes. (B) The KEGG pathway analysis between high-risk and low-risk groups in MIBC. Red boxes: Immune-related pathways. Abbreviations: GO, Gene Ontology; KEGG, Kyoto Encyclopedia of Genes and Genomes. |
To further explore the association between risk score and immune status, the expression of metagenes was then used to analyze statistical enrichment using ssGSEA. Surprisingly, 13 immune-related functions all showed higher scores in the high-risk group compared with the low-risk group (Figure 6A). Moreover, both the scores of widely accepted anti-tumor immune cells like CD8+T cells, TILs, DCs, and immunosuppressive cells like Tregs were higher in the high-risk group (Figure 6B). As a result, we presumed that it was the function but not the proportion of the immune cells that contributed to the impaired OS in the high-risk group. To further confirm our presumption, the expressions of immune checkpoint genes and exhausted T-cell signatures (PDCD1, CD274, CTLA4, HAVCR2, LAG3, TIGIT, TOX) were compared between the two groups (Figure 6C–I). The expressions of all these immunosuppressive genes were higher in the high-risk group, respectively (p < 0.001). Multi-signature correlation analysis also demonstrated that the expressions of the 7 immune checkpoint genes and exhausted T-cell signatures were positively correlated with the 7 ferroptosis signatures (GCLM, CRYAB, SLC3A2, TFRC, SQLE, G6PD, ACSF2) (p < 0.001) (Figure 6J).
 |
Figure 6 The different immune statuses between high risk and low risk in MIBC patients. (A and B) Comparison of the ssGSEA scores between different risk groups in the TCGA cohort. The scores of 13 immune-related functions (A) and 16 immune cells (B) and are displayed in boxplots. (C–I) Comparison of each of the immune checkpoint genes and exhausted T-cell signatures expression (PDCD1, CD274, CTLA4, HAVCR2, LAG3, TIGIT, TOX) between different risk groups in the TCGA cohort. (J) Co-expression analysis of the immune checkpoint genes and exhausted T-cell signatures (PDCD1, CD274, CTLA4, HAVCR2, LAG3, TIGIT, TOX) and the 7 ferroptosis signatures (GCLM, CRYAB, SLC3A2, TFRC, SQLE, G6PD, ACSF2). ns no significance; *P <0.05; **P <0.01; ***P <0.001. Abbreviations: MIBC, muscle-invasive bladder cancer; ssGSEA, Single sample gene set enrichment analysis; TCGA, The Cancer Genome Atlas. |
Brief sum up, the risk score calculated by our prognostic model was an independent prognostic factor for predicting the OS of MIBC patients. Exhausted immune cell function was the main cause of the worst OS in the high-risk group of MIBC patients.
Construction and Verification of the Prognostic Model in NMIBC
Using the same strategy as in MIBC, we identified 6 ferroptosis-related genes associated with RFS by the univariate Cox regression analysis (Figure 7A), ie FANCD2, PTGS2, AIFM2, ACSL3, FADS2, ABCC1. The interaction network is shown in Figure 7B. Then, a LASSO Cox regression analysis was applied to establish a prognostic model in both the training cohort and validation cohort. The patients were categorized into a high-risk group or a low-risk group according to the median cut-off value of the risk score calculated by the following formula: 0.175 * expression level of FANCD2 −0.096 * expression level of PTGS2 + 0.165*expression level of AIFM2 −0.181 * expression level of ACSL3 + 0.074 * expression level of FADS2 + 0.238 * expression level of ABCC1 (Supplementary data 5). As shown in Figure 7C and D, patients in the high-risk group had a significantly worse RFS than those in the low-risk group in both cohorts (Supplementary data 6). Patients with high risk had a higher probability of recurrence than those with low risk (Figure 7E–H).
 |
Figure 7 Identification of ferroptosis-related prognostic model in NMIBC. (A) Forest plots showing the results of the univariate Cox regression analysis of ferroptosis genes that were correlated with RFS in NMIBC. (B) The PPI network downloaded from the STRING database indicated the interactions among the candidate genes. (C and D) Kaplan–Meier curves for the RFS of patients in the high-risk group and low-risk group in the training cohort (C) and validation cohort (D). (E–H) The distribution of the risk scores, RFS statues, and the correlations between RFS and risk score in the training cohort (E and G) and validation cohort (F and H). Abbreviations: NMIBC, non-muscle invasive bladder cancer; RFS, recurrence-free survival. |
The AUC of the 6-gene signature was 0.710 at 1 year, 0.683 at 2 years, and 0.699 at 3 years in the training cohort (Figure 8A). In the validation cohort, the AUC at 1, 2, and 3 years were 0.600, 0.565, and 0.595, respectively (Figure 8B). t-SNE and PCA analyses indicated that patients in different risk groups were distributed in two directions (Figures 8C and D). Univariate and multivariate Cox regression analyses demonstrated that the risk score was an independent predictor for RFS in NMIBC (HR = 3.545, 95% CI = 2.239–5612, P < 0.001 in univariate Cox regression and adjusted HR = 3.812, 95% CI = 2.351–6.210, P < 0.001 in multivariate Cox regression) (Figure 8E and F).
 |
Figure 8 Accuracy verification of the ferroptosis-related prognostic model in NMIBC. (A and B) AUC of time-dependent ROC curves verified the prognostic performance of the risk score in the training cohort (A) and validation cohort (B). (C and D) t-SNE analysis (C) and PCA plot (D) of the training cohort. (E) Results of the univariate Cox regression analyses regarding RFS in the training cohort. The risk score is significantly associated with the RFS of NMIBC patients. (F) Results of the multivariate Cox regression analyses regarding RFS in the training cohort. The risk score is an independent prognostic factor in NMIBC patients. Abbreviations: NMIBC, muscle-invasive bladder cancer; AUC, area under the curve; ROC, Receiver Operating Characteristic; t-SNE, t-distributed stochastic neighbor embedding; PCA, Principal Component Analysis; RFS, recurrence-free survival. |
Functional Analyses in the NMIBC Cohort
The DEGs between the high-risk and low-risk groups of the NMIBC cohort were also submitted for functional enrichment analysis through GO. Intriguingly, the DEGs from the NMIBC cohorts were enriched in nuclear division biological processes (q value <0.05, Figure 9A, Supplementary data 7) instead of immune-related biological processes and pathways.
 |
Figure 9 The nuclear division difference between high risk and low risk in NMIBC patients. (A) The GO enrichment analysis between high-risk and low-risk groups in NMIBC. Red box: nuclear division biological processes. (B) Heatmap of the nuclear division-related genes between high-risk and low-risk groups in the training and validation cohort. (C–J) Kaplan–Meier curves of the nuclear division-related genes for the RFS of patients in the high-risk group and low-risk group in the training and validation cohort. Abbreviations: NMIBC, muscle-invasive bladder cancer; GO, Gene Ontology; RFS, recurrence-free survival. |
To further explore the correlation between the risk score and nuclear division, we picked out 9 enriched nuclear division-related genes, ie, RAD54L, MYBL2, CDC25B, CDC20, PKMYT1, CDCA5, MKI67, PDE3A, UBE2C, to see how they were distributed in NMIBC patients. Intriguingly, the 9 nuclear division-related genes all presented higher expressions in the high-risk group compared with the low-risk group (Figure 9B). The Kaplan–Meier curve indicated that patients with high expressions of these nuclear division-related genes had a significantly worse RFS than their low counterparts in the NMIBC cohort (Figure 9C–J).
To sum up, our 6-gene risk signature could be an independent prognostic factor for predicting the RFS of NMIBC patients. The elevated expression of nuclear division-related genes in the high-risk group was the crucial cause of the worst RFS in the high-risk group of NMIBC patients.
Discussion
Cell death was historically classified into three categories based on their morphotypes, ie, apoptosis, autophagy, and necrosis.21 Recent studies have shown that in addition to these cell death pathways, there still exist other death modes. In 1955, Harry Eagle first discovered that cystine deprivation led to cell death of a unique morphology.22 The mechanism was unknown at that time. Later in 2003, Dolma et al discovered a new compound, erastin, which had a selectively lethal effect on RAS-expressing cancer cells. The dead cells did not show any nuclear morphological changes, and the cell death pattern could not be reversed by caspase inhibitors.23 Subsequently, in 2007 and 2008, Yang and Stockwell24 and Yagoda et al25 found that this cell death pattern could be inhibited by iron chelating agents and found another inducer of this cell death pattern, RSL3. In 2012, Dixon et al formally named this cell death “ferroptosis”.4
Due to the non-adoptive nature, therapies targeting ferroptosis may be a new strategy for patients that are resistant to traditional treatments that focus on inducing cell apoptosis. Recently, ferroptosis has also been proved to be involved in cancer immunotherapy, where interferon-gamma (IFN-γ) secreted by CD8+T cells sensitizes tumor cells to ferroptosis by inhibiting system χc, which mediates the exchange of extracellular l-cystine and intracellular l-glutamate.19 The results of our research implied that down-regulating the expressions of the ferroptosis-related genes like GCLM, CRYAB, SLC3A2, SQLE, G6PD, etc., might be new strategies for genetic therapies for bladder cancer.
In the current study, we explored the role of ferroptosis in bladder cancer. Given the different characteristics, treatments, and outcomes between MIBC and NMIBC, we performed separate analyses, respectively. In MIBC, we first overlapped 61 ferroptosis-related genes associated with OS and 28 ferroptosis-related genes expressed differentially between tumor tissues and para-carcinoma tissues in the TCGA cohort. Then, a novel prognostic model of 7 overlapping genes consisting of GCLM, CRYAB, SLC3A2, TFRC, SQLE, G6PD, ACSF2 was constructed and validated in another cohort.
GCLM is the first-rate limiting enzyme for glutathione (GSH) synthesis, which is crucial for deoxidizing lipid peroxides in lipid alcohol.26 CRYAB acts primarily as a molecular chaperone. When cells are exposed to external stresses, such as oxidative stress, CRYAB binds to unfolded proteins, inhibits their aggregation, and prevents degeneration and degradation, thereby promoting cell survival.27 SLC3A2 mediates the exchange of extracellular cystine and intracellular glutamate, which are essential amino acids for GSH synthesis.19 TFRC encodes a cell surface receptor necessary for cellular iron uptake. The upregulation of iron uptake by TFRC augments the labile redox-active iron pool, which is needed for ferroptosis.28 SQLE catalyzes the first oxygenation step in sterol biosynthesis, which is the precursor of lipid peroxide. G6PD is involved in the pentose phosphate pathway, which has been reported to prevent erastin-induced ferroptosis.18 ACSF2 encodes regulators of acyl-CoA synthesis,29 which can increase the content of intracellular AA-CoA and AdA-CoA to promote ferroptosis.
We demonstrated that patients with high risk had a higher probability of premature death than those with low risk. Independently or combined with other markers, the risk score calculated by our novel ferroptosis-related multigene prognostic model could accurately predict the OS of MIBC patients. Further functional analyses revealed that the two risk groups showed distinctly different immune statuses. We noticed that both pro-tumor and anti-tumor immune cells except for NK cells and Th2 cells were higher in the high-risk group. However, a broad spectrum of immunosuppressive mechanisms is present in the tumor microenvironment (TME), which can shift the anti-tumor cells from the effector state to the exhaustion state.30 The upregulation of immune checkpoints on T cells is a major marker of T cell dysfunction. In addition to PD-1, dysfunctional T cells have been shown to overexpress other inhibitory receptors, including cytotoxic T lymphocyte antigen-4 (CTLA-4), T cell immunoglobulin and mucin domain-3 protein (Tim-3, also called HAVCR2), Lymphocyte-activation gene 3 (LAG-3), T cell immunoglobulin and ITIM domain (TIGIT) and thymocyte selection associated high mobility group box (TOX).30,31 We compared these exhaustion markers, respectively, between the two risk groups and discovered higher exhausted immune cell proportions in a high-risk group of patients. Moreover, the expression of exhaustion signatures was positively correlated with the ferroptosis signatures. Thus, we speculated that it was the higher exhausted immune cells that resulted in the worse OS in the high-risk group of MIBC patients. In these patients, immune checkpoint inhibitors (ICIs) may achieve good therapeutic effects.
To investigate the differences between MIBC and NMIBC, we constructed a prognostic model using the same method as mentioned before in NMIBC patients. To our knowledge, this is the first study to characterize the role of ferroptosis in NMIBC in separate NMIBC cohorts. Due to the high 5-year survival rate in NMIC patients, recurrence was what we were more concerned about in these patients. The prognostic model that we constructed could also independently predict RFS and showed a high prediction value. Functional analyses revealed that the two risk groups showed distinctly different nuclear division activity rather than different immune statuses in NMIBC. These enriched genes were involved in cell cycle regulation and repair of DNA double-strand breaks. Sustaining proliferative signaling, evading growth suppressors, resisting cell death, enabling replicative immortality, and activating invasion and metastasis are the hallmarks of cancer described by Hanahan and Weinberg.32 MYBL2, CDC25B, and CDC20 were all physiological regulators of cell cycle progression and cell survival.33 MYBL2 appears to be a predictive factor of recurrence in bladder cancer on the basis of genetic profiling.34 DNA repair defects are important factors in cancer development. High DNA repair activity can affect cancer progression and chemoresistance. A previous study confirmed that DNA breaks could be repaired by RAD54L in bladder cancer cells, which promoted bladder cancer progression.35 A heatmap of all 414 NMIBC patients in the training cohort and validation cohort identified that these nuclear-division related genes all showed a higher expression in the high-risk group. Further RFS analyses confirmed that the earlier the patient relapsed, the higher the expressions of these genes. Thus, we inferred that high expression of nuclear division-related genes is the characteristic of high-risk group in NMIBC patients and caused a worse RFS. These patients may benefit from treatments targeting cell cycle and DNA repair activity.
There also exist some limitations in our study. First, the ferroptosis-related multigene prognostic models were constructed and validated on public databases, which need further bioinformatical and experimental verification of our own clinical data. Secondly, we identified the difference between the two risk groups, but the underlying mechanisms and new targeted therapies for ferroptosis still warrant further investigations.
Conclusion
Our present study identified two ferroptosis-related multigene prognostic models for MIBC and NMIBC patients. These models were proved to have relatively high efficacy for independently predicting the prognosis of patients with bladder cancer. We also revealed the differences in characteristics of patients between ferroptosis-related gene risk groups and between MIBC and NMIBC. These results indicated that ferroptosis might play different roles in the tumorigenesis and development of MIBC and NMIBC. However, the underlying mechanisms and new targeted therapies for ferroptosis warrant further investigations.
Data Sharing Statement
The RNA expression datasets used in this study can be downloaded from the TCGA, ArrayExpress, and GEO. The Supplementary Material for this article is available in the article.
Ethical Approval and Consent to Participate
The ethics committee of Xinhua Hospital affiliated to Shanghai Jiao Tong University School of Medicine confirmed that this study does not need to be reviewed according to the current relevant ethical regulations.
Acknowledgments
We acknowledge TCGA and GEO databases for providing their platforms and contributors for uploading their meaningful datasets.
Author Contributions
All authors made a significant contribution to the work reported, whether that is in the conception, study design, execution, acquisition of data, analysis and interpretation, or in all these areas; took part in drafting, revising or critically reviewing the article; gave final approval of the version to be published; have agreed on the journal to which the article has been submitted; and agree to be accountable for all aspects of the work.
Funding
This work was supported by the Science and Technology Commission of Shanghai Municipality (No. 21511902300). The sponsor played no role in the study design, methods, data collection, analysis, and preparation of this manuscript.
Disclosure
The authors declare that they have no conflict of interest.
References
1. Sung H, Ferlay J, Siegel RL, et al. Global cancer statistics 2020: GLOBOCAN estimates of incidence and mortality worldwide for 36 cancers in 185 countries. CA Cancer J Clin. 2021;71(3):209–249. doi:10.3322/caac.21660
2. Miller KD, Siegel RL, Lin CC, et al. Cancer treatment and survivorship statistics, 2016. CA Cancer J Clin. 2016;66(4):271–289. doi:10.3322/caac.21349
3. Miller KD, Nogueira L, Mariotto AB, et al. Cancer treatment and survivorship statistics, 2019. CA Cancer J Clin. 2019;69(5):363–385. doi:10.3322/caac.21565
4. Dixon SJ, Lemberg K, Lamprecht M, et al. Ferroptosis: an iron-dependent form of nonapoptotic cell death. Cell. 2012;149(5):1060–1072. doi:10.1016/j.cell.2012.03.042
5. Li J, Cao F, Yin H-L, et al. Ferroptosis: past, present and future. Cell Death Dis. 2020;11(2):88. doi:10.1038/s41419-020-2298-2
6. Mou Y, Wang J, Wu J, et al. Ferroptosis, a new form of cell death: opportunities and challenges in cancer. J Hematol Oncol. 2019;12(1):34. doi:10.1186/s13045-019-0720-y
7. Louandre C, Marcq I, Bouhlal H, et al. The retinoblastoma (Rb) protein regulates ferroptosis induced by sorafenib in human hepatocellular carcinoma cells. Cancer Lett. 2015;356(2):971–977. doi:10.1016/j.canlet.2014.11.014
8. Xie Y, Zhu S, Song X, et al. The tumor suppressor p53 limits ferroptosis by blocking DPP4 activity. Cell Rep. 2017;20(7):1692–1704. doi:10.1016/j.celrep.2017.07.055
9. Chen M-S, Wang S-F, Hsu C-Y, et al. CHAC1 degradation of glutathione enhances cystine-starvation-induced necroptosis and ferroptosis in human triple negative breast cancer cells via the GCN2-eIF2α-ATF4 pathway. Oncotarget. 2017;8(70):114588–114602. doi:10.18632/oncotarget.23055
10. Miess H, Dankworth B, Gouw AM, et al. The glutathione redox system is essential to prevent ferroptosis caused by impaired lipid metabolism in clear cell renal cell carcinoma. Oncogene. 2018;37(40):5435–5450. doi:10.1038/s41388-018-0315-z
11. Liu J, Ma H, Meng L, et al. Construction and external validation of a ferroptosis-related gene signature of predictive value for the overall survival in bladder cancer. Front Mol Biosci. 2021;8:675651. doi:10.3389/fmolb.2021.675651
12. Sun J, Yue W, You J, et al. Identification of a novel ferroptosis-related gene prognostic signature in bladder cancer. Front Oncol. 2021;11:730716. doi:10.3389/fonc.2021.730716
13. Yan Y, Cai J, Huang Z, et al. A novel ferroptosis-related prognostic signature reveals macrophage infiltration and EMT Status in bladder cancer. Front Cell Dev Biol. 2021;9:712230. doi:10.3389/fcell.2021.712230
14. Yang L, Li C, Qin Y, et al. A novel prognostic model based on ferroptosis-related gene signature for bladder cancer. Front Oncol. 2021;11:686044. doi:10.3389/fonc.2021.686044
15. Liang Y, Ye F, Xu C, et al. A novel survival model based on a Ferroptosis-related gene signature for predicting overall survival in bladder cancer. BMC Cancer. 2021;21(1):943. doi:10.1186/s12885-021-08687-7
16. Zhang M, Zhang X, Yu M, et al. A novel ferroptosis-related gene model for overall survival predictions of bladder urothelial carcinoma patients. Front Oncol. 2021;11:698856. doi:10.3389/fonc.2021.698856
17. Luan J-C, Zeng T-Y, Zhang Q-J, et al. A novel signature constructed by ferroptosis-associated genes (FAGs) for the prediction of prognosis in bladder urothelial carcinoma (BLCA) and associated with immune infiltration. Cancer Cell Int. 2021;21(1):414. doi:10.1186/s12935-021-02096-3
18. Liang J-Y, Wang D-S, Lin H-C, et al. A novel ferroptosis-related gene signature for overall survival prediction in patients with Hepatocellular Carcinoma. Int J Biol Sci. 2020;16(13):2430–2441. doi:10.7150/ijbs.45050
19. Wang W, Green M, Choi JE, et al. CD8+ T cells regulate tumour ferroptosis during cancer immunotherapy. Nature. 2019;569(7755):270–274. doi:10.1038/s41586-019-1170-y
20. Stockwell BR, Friedmann Angeli JP, Bayir H, et al. Ferroptosis: a regulated cell death nexus linking metabolism, redox biology, and disease. Cell. 2017;171(2):273–285. doi:10.1016/j.cell.2017.09.021
21. Liang C, Zhang X, Yang M, Dong X. Recent progress in ferroptosis inducers for cancer therapy. Adv Mater. 2019;31(51):e1904197. doi:10.1002/adma.201904197
22. Eagle H. The specific amino acid requirements of a human carcinoma cell (Strain Hela) in tissue culture. J Exp Med. 1955;102(1):37–48. doi:10.1084/jem.102.1.37
23. Dolma S, Lessnick SL, Hahn WC, Stockwell BR. Identification of genotype-selective antitumor agents using synthetic lethal chemical screening in engineered human tumor cells. Cancer Cell. 2003;3(3):285–296. doi:10.1016/s1535-6108(03)00050-3
24. Yang WS, Stockwell BR. Synthetic lethal screening identifies compounds activating iron-dependent, nonapoptotic cell death in oncogenic-RAS-harboring cancer cells. Chem Biol. 2008;15:234–245. doi:10.1016/j.chembiol.2008.02.010
25. Yagoda N, von Rechenberg M, Zaganjor E, et al. RAS-RAF-MEK-dependent oxidative cell death involving voltage-dependent anion channels. Nature. 2007;447(7146):864–868. doi:10.1038/nature05859
26. Fagerberg L, Hallström BM, Oksvold P, et al. Analysis of the human tissue-specific expression by genome-wide integration of transcriptomics and antibody-based proteomics. Mol Cell Proteomics. 2014;13(2):397–406. doi:10.1074/mcp.M113.035600
27. Tan L, Sha L, Hou N, et al. High α B-crystallin and p53 co-expression is associated with poor prognosis in ovarian cancer. Biosci Rep. 2019;39(6). doi:10.1042/bsr20182407
28. Feng H, Schorpp K, Jin J, et al. Transferrin receptor is a specific ferroptosis marker. Cell Rep. 2020;30(10):3411–3423e3417. doi:10.1016/j.celrep.2020.02.049
29. Chen L, Vasoya RP, Toke NH, et al. HNF4 regulates fatty acid oxidation and is required for renewal of intestinal stem cells in mice. Gastroenterology. 2020;158(4):985–999e989. doi:10.1053/j.gastro.2019.11.031
30. Thommen DS, Schumacher TN. T cell dysfunction in cancer. Cancer Cell. 2018;33(4):547–562. doi:10.1016/j.ccell.2018.03.012
31. Khan O, Giles JR, McDonald S, et al. TOX transcriptionally and epigenetically programs CD8+ T cell exhaustion. Nature. 2019;571(7764):211–218. doi:10.1038/s41586-019-1325-x
32. Hanahan D, Weinberg RA. Hallmarks of cancer: the next generation. Cell. 2011;144:646–674. doi:10.1016/j.cell.2011.02.013
33. Musa J, Aynaud MM, Mirabeau O, Delattre O, Grünewald TG. MYBL2 (B-Myb): a central regulator of cell proliferation, cell survival and differentiation involved in tumorigenesis. Cell Death Dis. 2017;8:e2895. doi:10.1038/cddis.2017.244
34. Nord H, Segersten U, Sandgren J, et al. Focal amplifications are associated with high grade and recurrences in stage Ta bladder carcinoma. Int J Cancer. 2010;126:1390–1402. doi:10.1002/ijc.24954
35. Mun JY, Baek S-W, Park WY, et al. E2F1 promotes progression of bladder cancer by modulating RAD54L involved in homologous recombination repair. Int J Mol Sci. 2020;21(23):9025. doi:10.3390/ijms21239025
 © 2021 The Author(s). This work is published and licensed by Dove Medical Press Limited. The
full terms of this license are available at https://www.dovepress.com/terms
and incorporate the Creative Commons Attribution
- Non Commercial (unported, 3.0) License.
By accessing the work you hereby accept the Terms. Non-commercial uses of the work are permitted
without any further permission from Dove Medical Press Limited, provided the work is properly
attributed. For permission for commercial use of this work, please see paragraphs 4.2 and 5 of our Terms.
© 2021 The Author(s). This work is published and licensed by Dove Medical Press Limited. The
full terms of this license are available at https://www.dovepress.com/terms
and incorporate the Creative Commons Attribution
- Non Commercial (unported, 3.0) License.
By accessing the work you hereby accept the Terms. Non-commercial uses of the work are permitted
without any further permission from Dove Medical Press Limited, provided the work is properly
attributed. For permission for commercial use of this work, please see paragraphs 4.2 and 5 of our Terms.