Back to Journals » Drug Design, Development and Therapy » Volume 11
Notoginsenoside R1 attenuates high glucose-induced endothelial damage in rat retinal capillary endothelial cells by modulating the intracellular redox state
Authors Fan CL, Qiao Y, Tang MK
Received 22 August 2017
Accepted for publication 19 October 2017
Published 23 November 2017 Volume 2017:11 Pages 3343—3354
DOI https://doi.org/10.2147/DDDT.S149700
Checked for plagiarism Yes
Review by Single anonymous peer review
Peer reviewer comments 2
Editor who approved publication: Professor Manfred Ogris
Chunlan Fan, Yuan Qiao, Minke Tang
Department of Pharmacology, School of Chinese Materia Medica, Beijing University of Chinese Medicine, Beijing, People’s Republic of China
Abstract: The aim of this study was to examine whether Notoginsenoside R1 (NR1) attenuates high glucose-induced cell damage in rat retinal capillary endothelial cells (RCECs) and to explore the mechanisms involved. The exposure of rat RCECs to high concentration of glucose (30 mM) for 72 h led to significant cytotoxicity, including decreased cell viability, reduced mitochondrial DNA copy number, increased lactate dehydrogenase release and elevated apoptosis. NR1, when present in the culture medium, markedly attenuated the high glucose-induced cytotoxicity in rat RCECs. Moreover, high glucose also induced a significant increase in intracellular reactive oxygen species and subsequently increased the activity of NADPH oxidase and poly-ADP (ribose) polymerase, whereas the activity of catalase decreased. The addition of NR1 to the medium significantly reduced the generation of reactive oxygen species, inhibited NADPH oxidase and poly-ADP (ribose) polymerase activities and increased catalase activity in RCECs, accompanied by a reduced cellular nitrotyrosine level. To explore the underlying mechanisms involved, the cellular redox status was monitored. Both the cellular NAD+ and NADPH levels decreased significantly in high glucose medium, which resulted in a marked decrease in the NAD+/NADH and NADPH/NADP+ ratios. High glucose stimulation also enhanced the accumulation of GSSG, maintaining the GSH/GSSG ratio lower than that in the control group with 5.5 mM glucose. When treated with NR1, the cellular NAD+, NADPH and GSH concentrations increased, and the ratios of NAD+/NADH, NADPH/NADP+ and GSH/GSSG increased, similar to the control group. These results demonstrate that NR1 attenuates high glucose-induced cell damage in RCECs. Therefore, NR1 may exert its protective effects via mechanisms that involve changes in the cellular redox state.
Keywords: Notoginsenoside R1, high glucose, retinal capillary endothelial cells, apoptosis, reactive oxygen species, NADPH
Introduction
Diabetic retinopathy (DR) is the major cause of blindness and vision loss among working-age people in developed countries. DR is considered a microvascular disease; the earliest characterized events include a loss of endothelial cells and pericytes, abnormal thickening of capillary basement membrane and breakdown of the blood–retinal barrier.1,2 The inner blood–retinal barrier forms complex tight junctions of retinal capillary endothelial cells to prevent the free diffusion of substances between the circulating blood and the neural retina.3 Research has shown that diabetic human and rat retinas develop acellular capillaries, which is associated with endothelial cell apoptosis.4 Additionally, experiments in vivo have demonstrated that high glucose enhances apoptosis in retinal endothelial cells.5–7
Hyperglycemia appears to be the primary pathogenetic agent in DR as well as in other complications of diabetes.8,9 Diabetes-induced changes in retinal metabolism and function have been linked to increased production of reactive oxygen species (ROS). ROS include radical species such as superoxide (O2−·), hydroxyl radical (HO−) and hydrogen peroxide (H2O2), which play important roles in the regulation of cell survival.10 In general, moderate levels of ROS may function as signals to promote cell proliferation and survival, whereas a severe increase in ROS can induce cell death. An increase in ROS production or a decrease in ROS-scavenging capacity can disrupt redox homeostasis, leading to an overall increase in intracellular ROS levels or oxidative stress. When redox homeostasis is disturbed, several intracellular signaling pathways can be altered and oxidative stress may lead to aberrant cell death and contribute to disease development. ROS are regarded as the leading cause of mitochondrial DNA (mtDNA) damage and mitochondrial dysfunction.11 Poly-ADP (ribose) polymerase (PARP) is an abundant nuclear protein that is activated by DNA damage, and once active, it modifies nuclear proteins by attaching to poly (ADP-ribose) units derived from nicotinamide adenine dinucleotide (NAD+). Subsequently, cellular adenosine triphosphate (ATP) stores become depleted in an effort to replenish NAD+, resulting in cell death.12 NAD(P)H and glutathione (GSH) play important roles in maintaining the reduced cellular redox state. Diabetes-induced changes in retinal metabolism and function have been linked to increased ROS production and a decrease in the intracellular NAD+/NADH ratio. Moreover, the reduction of glucose to sorbitol by aldose reductase (AR) is coupled to the oxidation of nicotinamide adenine dinucleotide phosphate (NADPH) to NADP+, which decreases the cellular NADPH/NADP+ ratio.13,14 Furthermore, the depletion of intracellular NADPH and GSH promotes NADPH oxidase (NOX) activity, which is a major source of oxygen radical generation in endothelial cells.15
Panax notoginseng (known as tian qi or san qi) is a well-known medicinal herb for its long history of use in traditional Chinese medicine. Panax notoginseng saponins (PNS) were extracted from the root of the plant, which possesses activities used for the treatment of diabetes and its complications.16 A previous study in our laboratory showed that PNS are endowed with a significant protective function against high glucose-induced oxidative injury in rat retinal capillary endothelial cells (RCECs).17 However, the component that is responsible for the protective function of PNS remains to be clarified and further exploration of the mechanism responsible for DR is urgently needed. Notoginsenoside R1 (NR1), a unique ingredient of P. notoginseng, exhibits anti-inflammatory, antioxidative and antiapoptotic properties.18–22 We postulated that NR1 executes a protective function against high glucose-induced endothelial damage in RCECs, which may modulate the intracellular redox state and participate in antioxidant defense. The present findings provide evidence for a functional role of NR1 in the prevention of DR.
Materials and methods
Animals
Male Sprague Dawley rats weighing 90–110 g were purchased from the Vital River Laboratory Animal Technology Co., Ltd., in Beijing, People’s Republic of China (certificate number SCXK [Jing] 2012-0001). All of the experiments involving animals were carried out in accordance with the National Institutes of Health Guide for Care and Use of Laboratory Animals (NIH publication No 85-23, revised 1985), and the Institutional Animal Care and Use Committee of Beijing University of Chinese Medicine approved the protocol. All efforts were made to minimize animal suffering and reduce the number of animals used.
Cell culture and identification
The isolation of RCECs was performed based on the methods described previously.17 Rat RCECs were cultured in Endothelial Cell Growth Medium (Sciencell, San Diego, CA, USA) containing 5% fetal bovine serum, 1% penicillin/streptomycin and 0.05 mg/mL endothelial cell growth supplement (Sciencell). The medium was changed 48 h after plating and every 3–4 days thereafter. When the flasks reached confluence, cells were passaged using 0.25% trypsin (Thermo Fisher Scientific, Waltham, MA, USA) in PBS at a ratio of 1:2. Cells were maintained in 1% gelatin (Thermo Fisher Scientific)-coated flasks at 37°C in 5% CO2 atmosphere.
Capillary endothelial cells were identified by immunofluorescence staining for the expression of platelet endothelial cell adhesion molecule-1 (PECAM-1/CD31) and von Willebrand factor (vWf). Briefly, cells were fixed with freshly prepared 4% paraformaldehyde at 4°C for 30 min. After fixation, cells were washed thrice with PBS and blocked with 10% normal goat serum for 30 min. The cells were then incubated with primary antibodies (rabbit anti-CD31, 1:100; rabbit anti-vWf, 1:100; Santa Cruz Biotechnology Inc., Dallas, TX, USA) in a moist chamber at 4°C overnight. Following three washes with PBS, the cells were incubated for 1 h at room temperature with a fluorescein-conjugated goat anti-rabbit secondary antibody (1:00; Zhong Shan Jin Qiao, Beijing, People’s Republic of China) and stained with 4′,6-diamidino-2-phenylindole (Cell Signaling Technology, Danvers, MA, USA). All images were captured using a fluorescence microscope with appropriate filters.
MTT assay
RCECs were seeded at a density of 1×10⁵ cells/mL onto 96-well plates coated with 1% gelatin in a total volume of 100 μL of culture medium per well and allowed to adhere overnight before experimentation. The Endothelial Cell Growth Medium containing lower glucose (5.5 mmol/L glucose) was used as control. Cells were incubated for 24, 48 and 72 h with either 5.5 mM glucose or 30 mM glucose with or without varying concentrations of NR1 (1, 5, 10 and 20 μM). NR1 (purity >98%) was obtained from the National Institute for the Control of Pharmaceutical and Biological Products (Beijing, People’s Republic of China). MTT (10 μL, 5 mg/mL; Sigma-Aldrich Co., St Louis, MO, USA) was added to each well 4 h before termination of the experiment. After incubation with MTT for 4 h, the culture medium was removed and 150 μL dimethylsulfoxide (Sigma-Aldrich Co.) was added to each well to dissolve the resulting blue formazan crystals. Absorbance was read at 540 nm on an enzyme-linked immunosorbent assay reader (Thermo Fisher Scientific). All experiments were repeated three times.
Lactate dehydrogenase (LDH) release assay
RCECs were seeded at a density of 1×10⁵ cells/mL onto gelatin-coated 96-well plates in a total volume of 100 μL of culture medium per well, allowed to adhere overnight and exposed to experimental conditions. After treatment for 72 h, the LDH cytotoxicity assay (Beyotime Biotechnology, Shanghai, People’s Republic of China) was performed according to the manufacturer’s instructions.
Trypan blue staining assay
RCECs were seeded at a density of 3×10⁴ cells/mL onto 24-well plates coated with 1% gelatin in a total volume of 1 mL of culture medium per well, allowed to attach overnight and exposed to experimental conditions. After treatment for 72 h, the culture medium was removed, 0.25% trypsin was added to each well to suspend the cells and a 2-fold dilution of cells was prepared in 0.4% trypan blue solution (Sigma-Aldrich Co.). The number of cells was counted using an inverted microscope (Leica Microsystems, Wetzlar, Germany).
Detection of apoptosis by fluorescence microscopy
Apoptosis was determined using the annexin V-fluorescein isothiocyanate/propidium iodide (PI) apoptosis detection kit (Beyotime Biotechnology) according to the manufacturer’s instructions. Briefly, the cells were cultured in chamber slides (3×10⁴ cells per well), allowed to attach overnight and exposed to various experimental conditions. After treatment for 72 h, the RCEC cells were washed with PBS and incubated with annexin-V labeling solution (containing 10 μL annexin-V and 5 μL PI solution in 200 μL incubation buffer) for 15 min in the dark. Confocal images were acquired on a Nikon A1R Eclipse Ti confocal microscope (Nikon Corporation, Tokyo, Japan).
DNA extraction and real-time quantitative polymerase chain reaction (PCR) analysis
DNA was extracted from RCECs using the TIANamp Genomic DNA Kit (Tiangen Biotech, Beijing, People’s Republic of China) and DNA quantity and purity were determined by spectrometric analysis. The OD260/OD280 ratios of the isolated DNA were within the range of 1.8–2.0. Forward and reverse primers used to amplify β-globin were 5′-TTGTGTTGACTCGCAACCTC-3′ and 5′-CTCAGCGCCAACATTATCAG-3′, respectively. Forward and reverse primers used to amplify mtDNA were 5′-CCTCCTAATAAGCGGCTCCT-3′ and 5′-GGAGCTCGATTTGTTTCTGC-3′, respectively. Amplification was performed in 96-well plates on a StepOnePlus Real-Time System (Thermo Fisher Scientific). The PCR mixture consisted of 20 ng DNA mixed with SYBR Green Real Master Mix (Tiangen Biotech) in a final volume of 20 μL. The cycling conditions were as follows: initial denaturation at 95°C for 2 min; amplification by using 35 cycles, including denaturation at 95°C for 30 s, annealing at 60°C for 30 s and extension at 68°C for 30 s. All samples were run in triplicate and the average values were calculated. The relative mtDNA copy number was normalized to a single-copy nuclear β-globin gene, and the relative mtDNA copy number was calculated using 2−ΔΔCt method.23,24
Measurement of intracellular total ROS level
The intracellular ROS level was measured with a Fluorimetric Intracellular Total ROS Activity Assay Kit (AAT Bioquest, Sunnyvale, CA, USA) according to the manufacturer’s instructions. Briefly, rat RCECs were plated at a density of 1×10⁵ cells/mL onto gelatin-coated 96-well plates in a total volume of 100 μL of culture medium per well, allowed to adhere overnight and exposed to experimental conditions. After treatment of 10 μM NR1 for 72 h, the cells were loaded for 60 min with Amplite™ ROS Red. Fluorescence intensity was measured at 520 nm (excitation) and 605 nm (emission) on a fluorescence plate reader (BMG Labtech, Offenburg, Germany).
Nitrotyrosine immunofluorescence detection
RCECs were grown on a coated coverslip (3×10⁴ cells per well), allowed to attach overnight and exposed to various experimental conditions. After treatment for 72 h, rat RCECs were fixed in fresh cold 4% paraformaldehyde at 4°C for 30 min and washed three times in PBS. Cells were blocked for 1 h in 5% normal goat serum and incubated with the primary antibody (anti-3-nitrotyrosine antibody 1:100; Abcam, Cambridge, MA, USA) in a moist chamber at 4°C overnight. Following three washes with PBS, the cells were incubated for 1 h at room temperature with a fluorescein-conjugated goat anti-mouse secondary antibody (1:00; Zhong Shan Jin Qiao, Beijing, People’s Republic of China). The coverslips were then mounted onto slides with 4′,6-diamidino-2-phenylindole–containing medium. Images were collected on a Nikon A1R Eclipse Ti confocal microscope (Nikon Corporation) and processed with Image-Pro Plus 6.0 software (Media Cybernetics, Silver Spring, MD, USA).
Catalase activity
RCECs were grown at a density of 1×10⁵ cells/mL on six-well plates coated with 1% gelatin in a total volume of 1 mL of culture medium per well, allowed to attach overnight and exposed to various experimental conditions. After treatment for 72 h, cell extracts were collected for measurement of catalase (CAT) activity using a catalase analysis kit (Beyotime Biotechnology) according to the manufacturer’s instructions. Protein concentration was measured using the BCA Protein Assay Kit (Beyotime Biotechnology).
NOX activity
NOX activity was measured by the lucigenin-enhanced chemiluminescence method, as previously described.25 In brief, RCECs were grown on six-well plates coated with 1% gelatin, allowed to attach overnight and exposed to various experimental conditions. After treatment of 10 μM NR1 for 72 h, cells were trypsinized, pelleted by centrifugation and resuspended in cold Krebs–HEPES buffer. Fifty microliters of cell suspension (5×10⁴ cells) was then placed in a 96-well plate in a luminescence reader and dark-adapted lucigenin (10 μmol/L; Sigma-Aldrich Co.) was added to start the reaction. The chemiluminescence was recorded every 15 s for 10 min. NADPH (final concentration: 100 μmol/L; Sigma-Aldrich Co.) was added after measuring the background lucigenin chemiluminescence, with further measurements performed for an additional 10 min. Differences between the values obtained before and after the addition of NADPH were calculated and the results are represented as the activity of NOX.
PARP activity
In vitro PARP activity was assayed using the Trevigen Universal Chemiluminescent PARP Assay Kit (Trevigen, Gaithersburg, MD, USA) according to the manufacturer’s instructions. To assay endogenous PARP activity, cells exposed to different experimental conditions were grown in T-25 flasks for 72 h. Cells were washed once with ice-cold PBS and lysed in 50 μL PARP buffer containing protease inhibitors (Sigma-Aldrich Co.) on ice for 30 min. The protein concentration of the extracts was determined using the BCA Protein Assay Kit. Chemiluminescent detection was performed according to the manufacturer’s instructions. The background values were subtracted from the readings of the samples, and PARP activity was estimated from the standard curve obtained from the known standards.
NAD+/NADH and NADP+/NADPH assay
RCECs were seeded onto gelatin-coated six-well plates, allowed to adhere overnight and exposed to experimental conditions. After treatment of 10 μM NR1 for 72 h, cells (1×10⁶ per sample) were lysed in 100 μL of lysis buffer to perform the NAD+/NADH assays. The NAD+ and NADH levels were measured using the NAD+/NADH Assay Kit (AAT Bioquest) according to the manufacturer’s instructions. The intensity of the reduced product color, measured at 460 nm, is proportionate to the NAD+ concentration in the sample. The standards supplied with the kits were used to prepare the calibration curves needed to calculate the NAD+/NADH ratio. NADP+/NADPH measurements were performed using the NADP+/NADPH Ratiometric Kit (Promega, Madison, WI, USA). Cell extracts (5×10⁴ per sample) were treated with the respective NADP+/NADPH extraction buffer, and chemiluminescence was measured on a 2300 EnSpire Multimode Plate Reader (PerkinElmer, Boston, MA, USA).
GSH/GSSG assay
RCECs were seeded onto gelatin-coated six-well plates, allowed to adhere overnight and exposed to experimental conditions. After treatment of 10 μM NR1 for 72 h, cells (1×10⁶ per sample) were lysed in 100 μL of lysis buffer to perform the GSH/GSSG assay. The GSH/GSSG assay was performed using the Green Fluorometric Detection Kit (AAT Bioquest), which uses a proprietary nonfluorescent dye that becomes strongly fluorescent upon reacting with GSH (Ex/Em =490/520 nm). Fluorescence was measured on a microplate reader (BMG Labtech).
Statistical analysis
All data are shown as the mean ± SD. One-way analysis of variance followed by a Student–Newman–Keuls test was performed to analyze multiple comparisons. A value of P<0.05 was considered significant. Statistical analyses were performed using SPSS 18.0 software (SPSS Inc., Chicago, IL, USA).
Results
Validation of rat RCECs
After 5 days in culture, the RCECs fully released and migrated from the capillary fragments (Figure 1A). After 8–10 days in culture, cells showed a short fusiform or round morphology and formed contact-inhibited confluent monolayers with typical cobblestone morphology (Figure 1B). The cells expressed PECAM-1/CD31 (Figure 1C) and vWf (Figure 1D), which are well-known endothelial cell-specific markers.
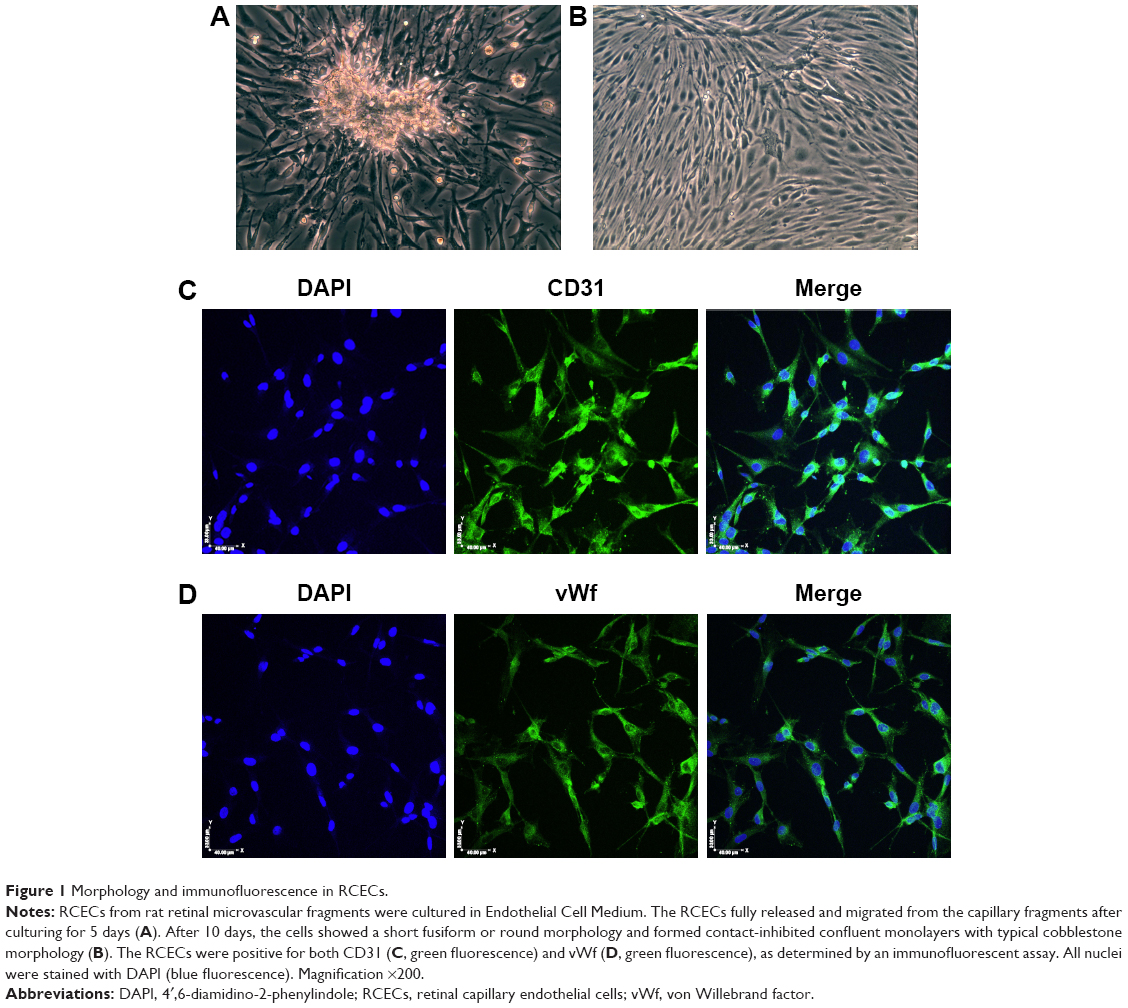 | Figure 1 Morphology and immunofluorescence in RCECs. |
NR1 attenuated high glucose-induced cytotoxicity in rat RCECs
Incubation with 30 mM glucose for 48 and 72 h resulted in a significant decrease in RCECs viability, compared to cells treated with 5.5 mM glucose (P<0.01). At concentrations of 5, 10 and 20 μM, NR1 significantly attenuated the high glucose-induced decrease in cell viability (P<0.05), as shown in Figure 2A. To further observe the protective effects of NR1, we detected the cellular LDH release and counted the number of live cells with trypan blue. As shown in Figure 2B, incubation with 30 mM glucose resulted in a significant increase in LDH release and a decrease in the number of live cells, compared to cells incubated with 5.5 mM glucose medium (P<0.01). Treatment with 10 μM NR1 not only remarkably reduced LDH release (P<0.01), as shown in Figure 2B, but also significantly increased the number of live cells (P<0.05), as observed in Figure 2C. These confirm that NR1 exerts protective effects against high glucose-induced cytotoxicity in RCECs.
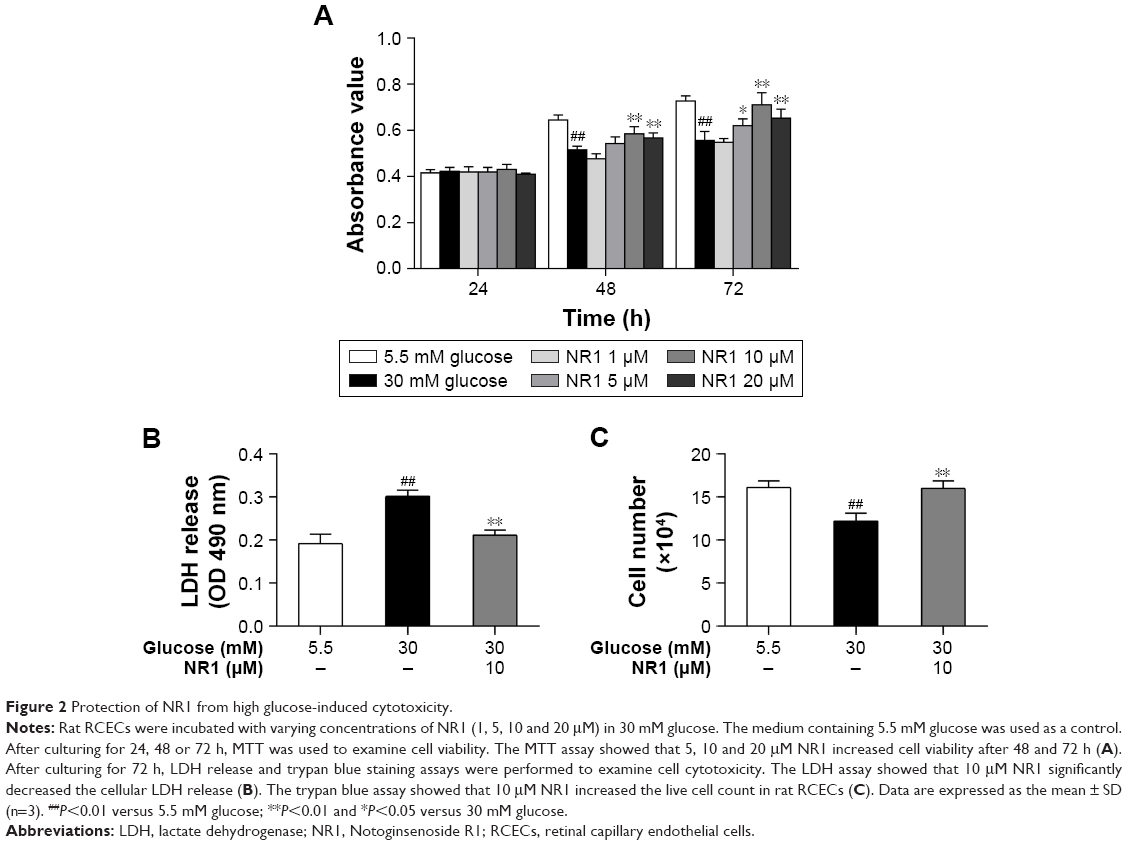 | Figure 2 Protection of NR1 from high glucose-induced cytotoxicity. |
Protective effect of NR1 on high glucose-induced apoptosis and DNA damage in rat RCECs
Apoptotic cells (double-labeled with annexin V/PI) were observed by confocal laser scanning microscopy and the relative mtDNA copy number was measured by real-time quantitative PCR. Annexin V binds to everted phosphatidylserine residues and is an early marker of regulated cell death at a time when cell injury may be reversible. Following staining with the annexin V/PI apoptosis kit, living cells exhibited little or no fluorescence and necrotic cells exhibited strong green and red fluorescence. As shown in Figure 3A, the cells showed weak green fluorescence, whereas no red fluorescence was found in 5.5 mM glucose-treated cells. The number of cells with green and red fluorescence increased following exposure to high glucose (30 mM). Treatment with 5.5 mM glucose and NR1 (10 μM) resulted in lower fluorescence intensity. As shown in Figure 3B, compared to 5.5 mM glucose-treated cells, the mtDNA copy number decreased significantly (by ~37%) when exposed to 30 mM glucose (P<0.01). Incubation of cells with 10 μM NR1 increased the mtDNA copy number (P<0.01), indicating that NR1 protects rat RCECs against high glucose-induced apoptosis and cellular mtDNA damage.
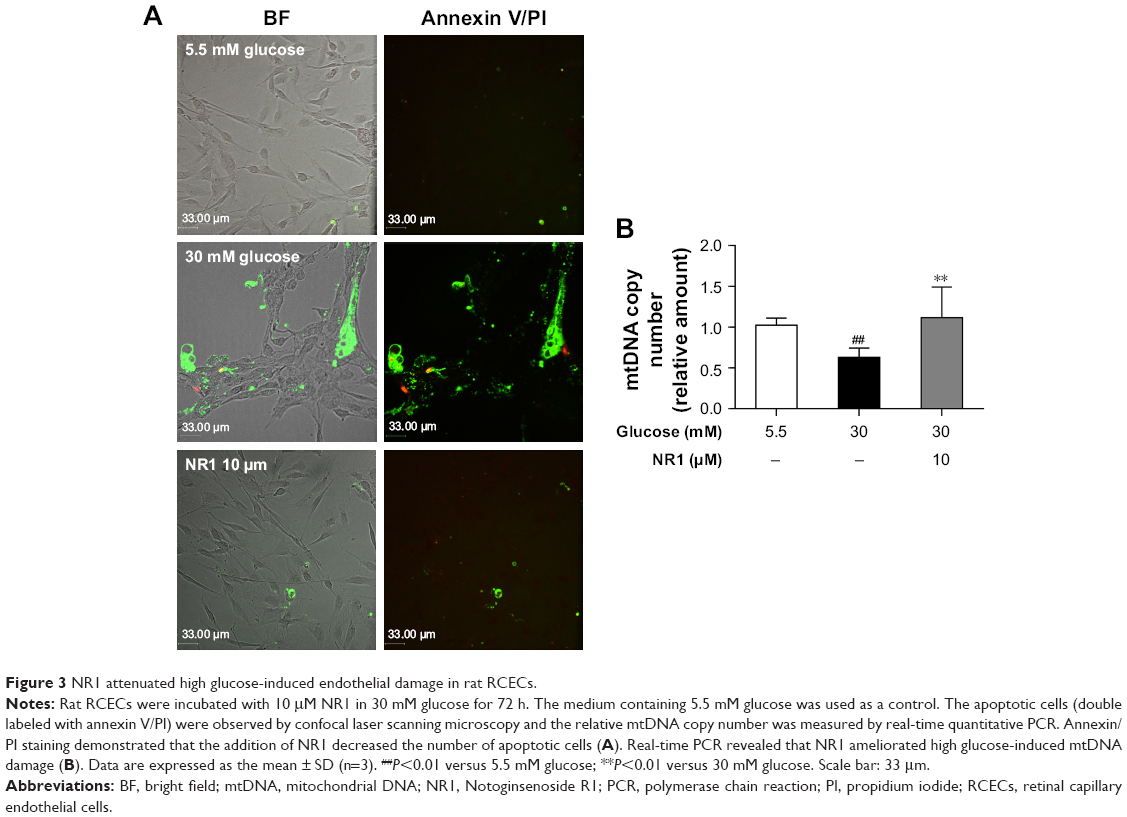 | Figure 3 NR1 attenuated high glucose-induced endothelial damage in rat RCECs. |
NR1 suppressed high glucose-induced ROS production and decreased 3-nitrotyrosine expression in RCECs
ROS are the main contributors of high glucose-induced cell lesions. Excessive ROS in endothelial cells easily react with NO to form peroxynitrite (ONOO−), a highly toxic oxidant species.26 In this study, we monitored ROS production with Amplite ROS Red and examined the expression of 3-nitrotyrosine (3-NT), a marker of ONOO−-mediated protein nitration, by immunofluorescence. As shown in Figure 4A and B, incubation with 30 mM glucose caused a significant increase in both ROS and 3-NT expression in RCECs, compared to cells cultured in a medium containing 5.5 mM glucose (P<0.01). Treatment with 10 μM NR1 significantly reduced the production of ROS (Figure 4A) and decreased 3-NT expression, compared to cells treated with 30 mM glucose alone (P<0.01; Figure 4B and C). These results suggest that NR1 reduces high glucose-induced ROS production and attenuates the consequent protein tyrosine nitration.
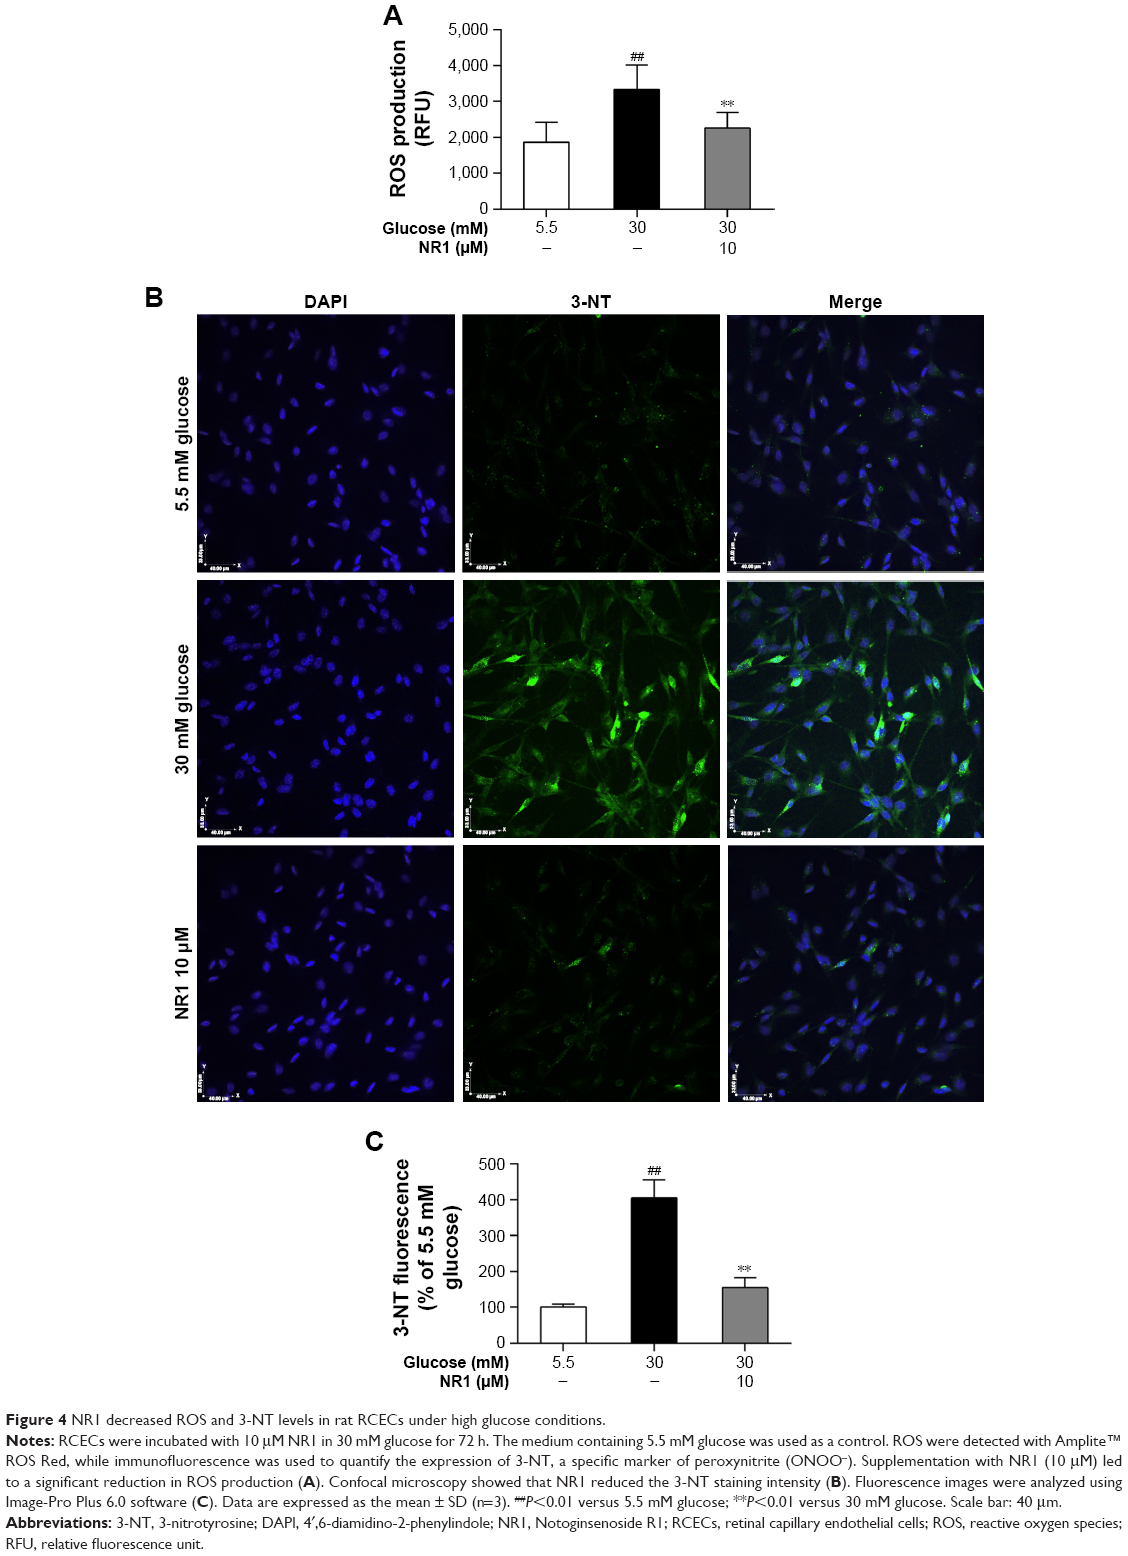 | Figure 4 NR1 decreased ROS and 3-NT levels in rat RCECs under high glucose conditions. |
NR1 increased CAT activity and inhibited NOX and PARP activities in rat RCECs exposed to high glucose
NOX is a major player that generates superoxide in endothelial cells at the cost of consuming NADPH, and CAT is one of the main antioxidants inside the cell. In this study, NOX activity increased and CAT activity significantly decreased in RCECs following exposure to 30 mM glucose compared to 5.5 mM glucose (P<0.01). Treatment with NR1 (10 μM) increased CAT activity and decreased NOX activity in rat RCECs (P<0.01), as shown in Figure 5A and B. These data suggest that NR1 regulates NADPH-dependent enzyme activities to maintain a specific NADPH concentration.
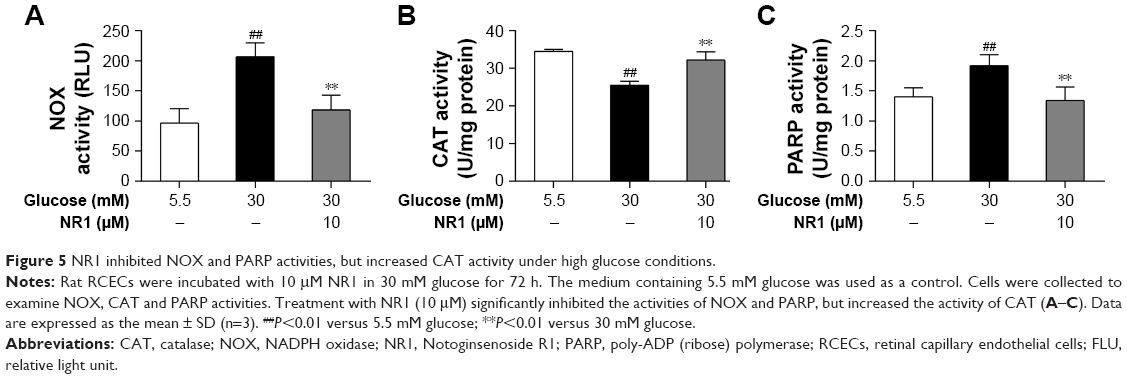 | Figure 5 NR1 inhibited NOX and PARP activities, but increased CAT activity under high glucose conditions. |
PARP modifies nuclear proteins by attaching to poly (ADP-ribose) units derived from NAD+, and cellular ATP stores become depleted in an effort to replenish NAD+, resulting in cell death. As shown in Figure 5C, PARP activity was significantly increased in RCECs exposed to 30 mM glucose medium, compared to 5.5 mM glucose medium. PARP activity decreased significantly after treatment with NR1 (10 μM; P<0.01). These results indicate that NR1 protects rat RCECs from DNA breakage by inhibiting PARP activity.
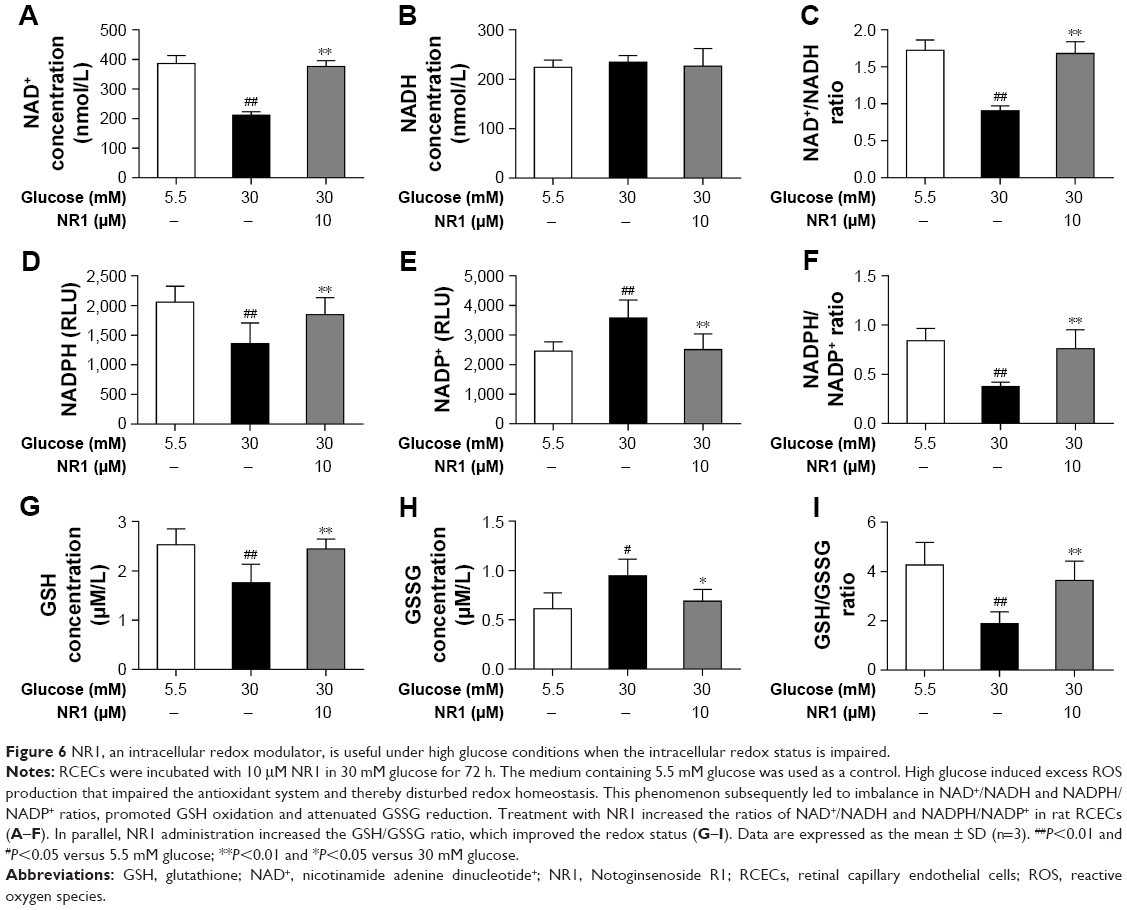
NR1 helps maintain the redox balance under high glucose conditions
The intracellular redox state is established by several redox pairs, such as NAD+/NADH and NADPH/NADP+ and GSH. A balanced intracellular redox state is critical for cellular activities, including energy metabolism, signaling and transcription. To investigate the intracellular redox state in RCECs insulted with high glucose, we monitored the redox pairs in the absence or presence of NR1. As shown in Figure 6A–C, 30 mM glucose induced a significant decrease in NAD+ concentration, while NADH remained unchanged, resulting in a significant decrease in the NAD+/NADH ratio. When treated with 10 μM NR1, intracellular NAD+ increased significantly, accompanied by an increase in the NAD+/NADH ratio. Similar to NAD+, the intracellular NADPH and GSH levels in RCECs markedly decreased when the cells were incubated in high glucose medium (30 mM). But the levels of NADP+ and GSSG were increased, resulting in decreased NADPH/NADP+ and GSH/GSSG ratios (Figure 6D–I). Treatment with 10 μM NR1 markedly enhanced the NADPH and GSH levels and increased the ratios of NADPH/NADP+ and GSH/GSSG (P<0.01), as shown in Figure 6D–I. Together, these data show that NR1 can re-establish the cellular redox balance and exert significant antioxidative effects against high glucose-induced oxidative stress in rat RCECs.
 | Figure 6 NR1, an intracellular redox modulator, is useful under high glucose conditions when the intracellular redox status is impaired. |
Discussion
Our previous study showed that PNS exert significant protective effects against high glucose-induced oxidative injury in RCECs. In this study, we demonstrated that NR1, a unique component of PNS, attenuates high glucose-induced cell damage, reduces oxidative stress and inhibits the subsequent redox status alteration in RCECs. These results indicate that NR1 represents a key component of PNS due to its protective effects against high glucose-induced cell damage in RCECs. NR1 may exert its protective effects via mechanisms that involve changes in the cellular redox status.
Oxidative stress is linked to early apoptosis in DR, and ROS play a critical role in this stress.27 ROS are increased in the retina in diabetes and the levels of oxidatively modified DNA are elevated.28 MtDNA is believed to suffer greater endogenous oxidative damage than nuclear DNA.29 A large body of evidence has demonstrated that high glucose-induced apoptosis in both endothelial cells and pericytes and oxidative damage to mtDNA have been linked to the pathogenicity of DR.30–32 In this study, after culturing RCECs with 30 mM glucose medium for 72 h, LDH release was significantly increased, with a concomitant decrease in cell viability and live cell count. Therefore, a high concentration of glucose induces apoptosis and decreases the mtDNA copy number in RCECs, an observation that agrees with previous studies. Our results also showed that treatment with NR1 markedly diminished high glucose-induced cytotoxicity, apoptosis and mtDNA damage in rat RCECs. These data suggest that NR1 reduces high glucose-induced endothelial damage in rat RCECs.
Redox homeostasis is maintained by a balance between ROS production and the ROS scavenging capacity of the cell.27,33 Oxidative stress is increased in the retina in diabetes, together with increased levels of ROS. The free radicals NO and superoxide O2−· react to form ONOO−, which is a highly toxic oxidant species in endothelial cells.26 Meanwhile, intracellular antioxidant defense enzymes are impaired. In several circumstances, NOX is a major source of oxygen radical generation in endothelial cells and CAT is the primary enzyme responsible for protecting the cell from hydrogen peroxide.34–37 Our study showed a significant increase in ROS production and 3-NT, a marker of ONOO−-mediated protein nitration, expression after high glucose exposure. Treatment with NR1 reduced high glucose-induced ROS production and attenuated the consequent protein tyrosine nitration. Further, we found that NOX activity increased and CAT activity significantly decreased in RCECs when exposed to high glucose. Treatment with NR1 increased CAT activity and inhibited the activity of NOX in rat RCECs. These data suggest that high glucose induces excess ROS production that impairs the antioxidant system and thereby disturbs redox homeostasis. NR1 may exert antioxidant effects in the intracellular compartment.
When redox homeostasis is disturbed, several intracellular signaling pathways can be changed, leading to aberrant cell death and contributing to disease development. Transcription factors that are activated by ROS include AMPK, PGC-1α, Nrf2, AP1, NF-kB, HIF-1α, p53 and FOXO. Many of these transcription factors contain redox-sensitive cysteine residues in their DNA binding sites, which leads to a loss of cell function, DNA damage and ultimately apoptosis or necrosis.38,39 PARP is a nuclear enzyme activated by DNA damage that catalyzes posttranslational protein modification known as poly (ADP-ribosyl)ation. Overactivation of PARP catalyzes the covalent addition of ADP-ribose groups to many nuclear proteins, causing a rapid depletion of NAD+. Subsequently, cellular ATP stores become depleted in an effort to replenish NAD+, resulting in cell death. As stated above, high glucose-induced oxidative stress decreased the mtDNA copy number and led to a significant increase in the number of apoptotic cells. In this study, high glucose increased intracellular PARP activity and treatment with NR1 inhibited PARP activity. These data demonstrate that NR1-moderated PARP activation following DNA damage may protect rat RCECs from high glucose-induced oxidative damage and apoptosis.
NAD(P)H and GSH play important roles in maintaining the reduced cellular redox state. Diabetes-induced changes in retinal metabolism and function have been linked to increase in ROS production, decrease in the NAD+/NADH ratio attributed to increased sorbitol dehydrogenase activity and a reduction of glucose to sorbitol by AR coupled to the oxidation of NADPH to NADP+. Increased oxidation of pyruvate (produced by increased glycolysis) in the mitochondria is coupled to a reduction of free NAD+ to NADH, which promotes superoxide production by the mitochondrial electron transport chain.13 The abundance of glucose involves activation of the polyol pathway, leading to the transformation of glucose to fructose, a pathway that is dependent on the available NADPH. This leads to the overconsumption of NADPH, which is essential for the enzymatic regeneration of oxidized GSH.14 Furthermore, depletion of intracellular NADPH and GSH promotes NOX activity, which is a major source of oxygen radical generation in endothelial cells.15 In all likelihood, hyperglycemia induces the earliest metabolic disparity in the retinal microvasculature, which is apparent as a change in the redox state of retinal microvascular cells and manifests biochemically by an altered ratio of pyridine coenzymes and a reduced level of GSH. Thus, to investigate the possible mechanism by which NR1 protects RCECs from high glucose-induced endothelial damage, the ratios of NAD+/NADH, NADPH/NADP+ and GSH/GSSG were examined. This study showed that high glucose induced a significant decrease in NAD+/NADH, NADPH/NADP+ and GSH/GSSG ratios. When treated with NR1, intracellular NAD+ increased significantly, accompanied by an increase in the NAD+/NADH ratio. NR1 also markedly enhanced the levels of NADPH and GSH and increased the ratios of GSH/GSSG and NADPH/NADP+. Therefore, hyperglycemia induced the metabolic disparities in the RCECs, which was apparent as a change in the redox state and manifested biochemically as an altered ratio of pyridine coenzymes and a reduced level of GSH. These data also showed that NR1 was able to re-establish the cellular redox balance and exerted significant antioxidative effects against high glucose-induced endothelial damage in rat RCECs.
Conclusion
In summary, our findings indicate that NR1 is endowed with a significant protective function against high glucose-induced endothelial damage in RCECs. The protective effect of NR1 may be due to its ability to modulate the intracellular redox state. However, its role in modulating intracellular redox signaling remains unclear. Therefore, it is necessary to conduct further investigations aimed at the clinical application of NR1 in the treatment of DR.
Acknowledgment
This research is supported by the grant “Major Innovative Drug Development Project (2011ZX11201)” from the Ministry of Science and Technology of China.
Disclosure
The authors report no conflicts of interest in this work.
References
Hammes HP. Pericytes and the pathogenesis of diabetic retinopathy. Horm Metab Res. 2005;37 (Suppl 1):39–43. | ||
Calcutt NA, Cooper ME, Kern TS, Schmidt AM. Therapies for hyperglycaemia-induced diabetic complications: from animal models to clinical trials. Nat Rev Drug Discov. 2009;8(5):417–429. | ||
Hosoya K, Tachikawa M. Inner blood-retinal barrier transporters: role of retinal drug delivery. Pharm Res. 2009;26(9):2055–2065. | ||
Dagher Z, Park YS, Asnaghi V, et al. Studies of rat and human retinas predict a role for the polyol pathway in human diabetic retinopathy. Diabetes. 2004;53(9):2404–2411. | ||
Williams KP, Steinle JJ. Maintenance of beta-adrenergic receptor signaling can reduce Fas signaling in human retinal endothelial cells. Exp Eye Res. 2009;89(4):448–455. | ||
Panjala SR, Steinle JJ. Insulin and β-adrenergic receptors inhibit retinal endothelial cell apoptosis through independent pathways. Neurochem Res. 2011;36(4):604–612. | ||
Kowluru RA, Kowluru A, Kanwar M. Small molecular weight G-protein, H-Ras, and retinal endothelial cell apoptosis in diabetes. Mol Cell Biochem. 2007;296(1–2):69–76. | ||
Ciulla TA, Amador AG, Zinman B. Diabetic retinopathy and diabetic macular edema: pathophysiology, screening, and novel therapies. Diabetes Care. 2003;26(9):2653–2664. | ||
Frank RN. On the pathogenesis of diabetic retinopathy. A 1990 update. Ophthalmology. 1991;98(5):586–593. | ||
Kamata H, Hirata H. Redox regulation of cellular signalling. Cell Signal. 1999;11(1):1–14. | ||
Kowluru R, Mishra M. Oxidative stress, mitochondrial damage and diabetic retinopathy. Biochim Biophys Acta. 2015;1852(11):2473–2483. | ||
PARP as a drug target for the therapy of diabetic cardiovascular dysfunction. Drug News Perspect. 2002;15(4):187–205. | ||
Williamson JR, Chang K, Frangos M, et al. Hyperglycemic pseudohypoxia and diabetic complications. Diabetes. 1993;42(6):801–813. | ||
Obrosova IG, Stevens MJ. Effect of dietary taurine supplementation on GSH and NAD(P)-redox status, lipid peroxidation, and energy metabolism in diabetic precataractous lens. Invest Ophthalmol Vis Sci. 1999;40(3):680–688. | ||
Meyer JW, Holland JA, Ziegler LM, et al. Identification of a functional leukocyte-type NADPH oxidase in human endothelial cells: a potential atherogenic source of reactive oxygen species. Endothelium. 1999;7(1):11–22. | ||
Uzayisenga R, Ayeka PA, Wang Y. Anti-diabetic potential of Panax notoginseng saponins (PNS): a review. Phytother Res. 2014;28(4):510–516. | ||
Fan Y, Qiao Y, Huang JM, Tang MK. Protective effects of panax notoginseng saponins against high glucose-induced oxidative injury in rat retinal capillary endothelial cells. Evid Based Complement Alternat Med. 2016;4:5326382. | ||
Zhang HS, Wang SQ. Notoginsenoside R1 from Panax notoginseng inhibits TNF-alpha-induced PAI-1 production in human aortic smooth muscle cells. Vascul Pharmacol. 2006;44(4):224–230. | ||
Zhang WJ, Wojta J, Binder BR. Notoginsenoside R1 counteracts endotoxin-induced activation of endothelial cells in vitro and endotoxin-induced lethality in mice in vivo. Arterioscler Thromb Vasc Biol. 1997;17(3):465–474. | ||
Sun K, Wang CS, Guo J, et al. Protective effects of ginsenoside Rb1, ginsenoside Rg1, and notoginsenoside R1 on lipopolysaccharide-induced microcirculatory disturbance in rat mesentery. Life Sci. 2007;81(6):509–518. | ||
Chen WX, Wang F, Liu YY, et al. Effect of notoginsenoside R1 on hepatic microcirculation disturbance induced by gut ischemia and reperfusion. World J Gastroenterol. 2008;14(1):29–37. | ||
Liu WJ, Tang HT, Jia YT, et al. Notoginsenoside R1 attenuates renal ischemia-reperfusion injury in rats. Shock. 2010;34(3):314–320. | ||
Winer J, Jung CK, Shackel I, Williams PM. Development and validation of real-time quantitative reverse transcriptase-polymerase chain reaction for monitoring gene expression in cardiac myocytes in vitro. Anal Biochem. 1999;270(1):41–49. | ||
Schmittgen TD, Zakrajsek BA, Mills AG, Gorn V, Singer MJ, Reed MW. Quantitative reverse transcription-polymerase chain reaction to study mRNA decay: comparison of endpoint and real-time methods. Anal Biochem. 2000;285(2);194–204. | ||
Ge QM, Dong Y, Su Q. Effects of glucose and advanced glycation end products on oxidative stress in MIN6 cells. Cell Mol Biol. 2010;56:1231–1238. | ||
Burewicz A, Dawoud H, Jiang LL, Malinski T. Nitric oxide/peroxynitrite redox imbalance in endothelial cells measured with amperometric nanosensors. Am J Analyt Chem. 2013;4(10):30–36. | ||
Kowluru RA, Atasi L, Ho YS. Role of mitochondrial superoxide dismutase in the development of diabetic retinopathy. Invest Ophthalmol Vis Sci. 2006;47(4):1594–1599. | ||
Kowluru RA. Diabetic retinopathy: mitochondrial dysfunction and retinal capillary cell death. Antioxid Redox Signa. 2005;7(11–12):1581–1587. | ||
Beckman KB, Ames BN. Endogenous oxidative damage of mtDNA. Mutat Res. 1999;424(1–2):51–58. | ||
Kowluru RA, Odenbach S. Effect of long-term administration of alpha-lipoic acid on retinal capillary cell death and the development of retinopathy in diabetic rats. Diabetes. 2004;53(12):3233–3238. | ||
Cui Y, Xu X, Bi H, et al. Expression modification of uncoupling proteins and MnSOD in retinal endothelial cells and pericytes induced by high glucose: the role of reactive oxygen species in diabetic retinopathy. Exp Eye Res. 2006;83(4):807–816. | ||
Sugiyama T, Kobayashi M, Kawamura H, Li Q, Puro DG. Enhancement of P2X (7)-induced pore formation and apoptosis: an early effect of diabetes on the retinal microvasculature. Invest Ophthalmol Vis Sci. 2004;45(3):1026–1032. | ||
Nishikawa T, Araki E. Impact of mitochondrial ROS production in the pathogenesis of diabetes mellitus and its complications. Antioxid Redox Signal. 2007;9(3):343–353. | ||
Deshpande SS, Angkeow P, Huang J, Ozaki M, Irani K. Rac1 inhibits TNF-alpha-induced endothelial cell apoptosis: dual regulation by reactive oxygen species. FASEB J. 2000;14(12):1705–1714. | ||
Lang D, Mosfer SI, Shakesby A, Donaldson F, Lewis MJ. Coronary microvascular endothelial cell redox state in left ventricular hypertrophy: the role of angiotensin II. Circ Res. 2000;86(4):463–469. | ||
Holland JA, Meyer JW, Chang MM, et al. Thrombin stimulated reactive oxygen species production in cultured human endothelial cells. Endothelium. 1998;6(2):113–121. | ||
Andreoli SP, Mallett C, McAteer JA, Williams LV. Antioxidant defense mechanisms of endothelial cells and renal tubular epithelial cells in vitro: role of the glutathione redox cycle and catalase. Pediatr Res. 1992;32(3):360–365. | ||
Trachootham D, Lu W, Ogasawara MA, Nilsa RD, Huang P. Redox regulation of cell survival. Antioxid Redox Signal. 2008;10(8):1343–1374. | ||
Ray PD, Huang BW, Tsuji Y. Reactive oxygen species (ROS) homeostasis and redox regulation in cellular signaling. Cell Signal. 2012;24(5):981–990. |
 © 2017 The Author(s). This work is published and licensed by Dove Medical Press Limited. The
full terms of this license are available at https://www.dovepress.com/terms
and incorporate the Creative Commons Attribution
- Non Commercial (unported, 3.0) License.
By accessing the work you hereby accept the Terms. Non-commercial uses of the work are permitted
without any further permission from Dove Medical Press Limited, provided the work is properly
attributed. For permission for commercial use of this work, please see paragraphs 4.2 and 5 of our Terms.
© 2017 The Author(s). This work is published and licensed by Dove Medical Press Limited. The
full terms of this license are available at https://www.dovepress.com/terms
and incorporate the Creative Commons Attribution
- Non Commercial (unported, 3.0) License.
By accessing the work you hereby accept the Terms. Non-commercial uses of the work are permitted
without any further permission from Dove Medical Press Limited, provided the work is properly
attributed. For permission for commercial use of this work, please see paragraphs 4.2 and 5 of our Terms.