Back to Journals » Clinical Ophthalmology » Volume 16
Normative Vascular Features on OCT Angiography in Healthy Nepalese Eyes
Authors Shyangbo R ![]() , Bajgai P, Kaiti R
, Bajgai P, Kaiti R ![]() , Pokharel GP
, Pokharel GP
Received 9 September 2022
Accepted for publication 27 October 2022
Published 2 November 2022 Volume 2022:16 Pages 3613—3624
DOI https://doi.org/10.2147/OPTH.S389272
Checked for plagiarism Yes
Review by Single anonymous peer review
Peer reviewer comments 2
Editor who approved publication: Dr Scott Fraser
Ranjila Shyangbo,1 Priya Bajgai,2 Raju Kaiti,3 Gopal Prasad Pokharel2
1Department of Optometry, National Academy of Medical Sciences (NAMS), Kathmandu, Nepal; 2Department of Ophthalmology, Nepal Eye Hospital, Kathmandu, Nepal; 3Department of Optometry, Nepal Eye Hospital, Kathmandu, Nepal
Correspondence: Ranjila Shyangbo, Department of Optometry, National Academy of Medical Sciences (NAMS), Mahaboudha, Kathmandu, 44600, Nepal, Tel +977- 9861499785, Email [email protected]
Purpose: To establish normative data on morphological characteristics and quantitative parameters of Foveal Avascular Zone (FAZ) as well as their systemic and ocular associations using OCT angiography (OCT-A) in healthy Nepalese subjects.
Patients and Methods: A prospective, cross-sectional, population-based study recruiting 210 healthy samples (420 eyes) aged 10 to 70 years was conducted. All the samples underwent detailed comprehensive eye examination followed by Optical Coherence Tomography Angiography (OCTA) and Enhanced Depth Imaging performed in each eye using Spectral Domain Optical Coherence Tomography. Foveal avascular zone area and vessel density in superficial and deep retinal plexus and Sub foveal Choroidal Thickness (SFCT) were evaluated. Ocular and systemic associations of these parameters were also studied in a multivariate analysis utilizing linear regression.
Results: The mean superficial and deep FAZ area was 459.96 ± 124.75 μm (95% confidence interval [CI], 443.08– 476.83) and 589.0 ± 141.39 μm (95% CL, 570.77– 609.02), respectively. The vessel density in superficial capillary plexus was 54.03 ± 9.34% (95% CL, 53.98– 54.11) while the vessel density in deep capillary plexus was 25.91 ± 38% (95% CL, 25.85– 25.96). The mean SFCT in this study was 308.89 ± 68.87μm (95% CL, 299.64– 318.14 μm). There was no statistically significant inter-eye difference in the FAZ parameters. Myopic eyes had smaller FAZ, lesser vessel density and thinner SFCT. Association was observed between superficial FAZ area and systolic blood pressure, and deep FAZ area and diastolic blood pressure.
Conclusion: This study reports the normative data on FAZ parameters in healthy Nepalese subjects which can serve as references for interpreting these parameters in different retinal-choroidal diseases.
Keywords: choroidal thickness, EDI-OCT, foveal avascular zone, healthy eyes, OCT-angiography
Introduction
The foveal avascular zone (FAZ) and choroid of the eye are important structures highly involved in any pathological events of retina and choroid. FAZ is an avascular area of the central macula. Though large variations in shapes and size of FAZ have been described, irregularities of FAZ have been long established as an indicator of vascular changes in the retina. The irregularities may appear either in the form of enlargement of FAZ as seen in retinal ischemia like vascular obstruction,1 normal tension glaucoma,2 and diabetic retinopathy,3 or reduction of FAZ as seen in retinopathy of prematurity,4 or reduction in FAZ circularity as seen in glaucoma,2 and diabetic retinopathy.3 Abnormalities of FAZ also may appear in the form of vascular changes such as increased VDI as seen in retinal vascular occlusion,1 diabetic retinopathy,3 and decreased vessel density in glaucoma.2
Previously, invasive procedures like indocyanine green and fundus fluorescein angiography (FFA) were used to visualize choroido-retinal structures and vasculatures. Although quantitative analysis of FAZ can be done by FFA, it only allows visualization of superficial FAZ, with little to no information on inter-capillary plexus, deep FAZ and avascular component of FAZ. This led to the advent of OCTA which is a non-invasive, dye-less imaging technique that allows the visualization of retinal and choroidal microvasculature in vivo, providing a more in-depth evaluation of FAZ. OCTA is non-invasive and provides static volumetric angiographic information depicting a snapshot in time of blood flow. OCTA provides highly detailed images of flow in the superficial retinal capillary plexus in addition to the intermediate and deep retinal capillary plexuses, the radial peripapillary network and choriocapillaris.
Despite being an important functional structure of the eye, whose pathologic changes lead to various sight-threatening conditions of the eye, very limited studies have been performed on FAZ. Information about the morphology of FAZ and its parameters, could be useful in many clinical situations for decision-making regarding diagnosis, management, and monitoring of disease progression. It is, therefore, imperative to have normative data for FAZ morphology and parameters. The main aim of this study was to establish a normative data on morphological characteristics of FAZ, particularly the area and vessel density in superficial and deep capillary plexus. To our knowledge, there is no published report on detailed FAZ parameters from Nepal. Measurement of FAZ parameters will establish a baseline for normative value in Nepalese population. This study also aimed to analyze the correlation FAZ parameters with ocular, demographic and systemic factors. Since, in Nepal understanding of the FAZ using non-invasive imaging techniques like OCTA and EDI has been limited, this study can be ventured as a benchmark for more studies on retinal-choroidal health.
Materials and Methods
A prospective, cross-sectional, population-based study including 210 (420 eyes) healthy Nepalese subjects aged 10–70 years attending OPD of Nepal Eye Hospital from March 2022 to July 2022 was enrolled. The study was conducted following ethical approval by Institutional Review Board (IRB) of National Academy of Medical Sciences (NAMS) (Reference number: 148312078179). All the methods adhered to the tenets of The Declaration of Helsinki. Informed consent was obtained from the subjects and assent was obtained from all children below 16 years of age along with written consent from their guardians prior to their enrollment in the study. The inclusion criteria consisted of patients between the age range of 10 to 70 years without ocular pathology during present examination and no self-reported history of systemic pathology (affecting FAZ parameters and choroid), referred to as “healthy patients”. The exclusion criteria were: i) history of ocular trauma and surgery (except cataract surgery), ii) history of hypertension, diabetes, coagulopathies, iii) known Pregnancy, iv) amblyopia or poor fixation and v) history of AMD, PCV, CSR, VKH disease, or other conditions affecting FAZ and choroid.
All the enrolled samples underwent a detailed comprehensive medical eye examination which included a detailed medical and ophthalmic history of information on systemic disease, ocular trauma, and ocular surgery, followed by ocular imaging. Presenting Visual acuity (PVA) and best corrected visual acuity (BCVA) in each eye with LogMAR chart at 4 meter was measured; static retinoscopy was performed at 50 cm distance in moderately illuminated room light with streak retinoscope (BETA 200 LED Streak Retinoscope, Heine Optotechnik GmbH & Co. KG, Germany) and lens bar and the finding was recorded after deducting the working distance of +2.00 D; subjective refraction was carried out to find out the best correction which was determined by the optimal visual acuity improvement with the refractive correction; anterior segment examination was performed using slit-lamp biomicroscopy; funduscopy was performed using +90D condensing lens in undilated pupil; blood pressure (BP) was recorded in the right arm in sitting position after 5 minutes of rest using a mercury sphygmomanometer; body weight was measured using standard weighing device; Intraocular Pressure (IOP) was measured using non-contact tonometry (NT-530/510 Non Contact Tonometer, Nidek Co., Ltd Japan) and axial length and Keratometry readings was measured using Optical Biometer (Nidek Inc., USA). OCT-A was performed for each eye using OCT Spectralis (Heidelberg Engineering, Germany). Data from OCT were corrected for the AL-related magnification using built-in software to take into account the FAZ area and Vascular Density measurement error due to image magnification. OCT-A images were analyzed and the findings were quantified using an automated image analysis technique by Image J software (version 1.51j8; National Institute of Health, Bethesda, MD).5 The border of the FAZ was manually measured in each patient using Image J software by two independent experienced graders (R.S and P.B). The inter-rater agreement for Image J measurement was summarized as intra-class correlation (ICC). FAZ area and vessel density in both the superficial capillary plexus (SCP) and deep capillary plexus (DCP) layers were separately evaluated. A 3 × 3-mm square was derived as a region of interest from an OCTA image. The 3 × 3-mm OCTA in SCP and DCP were binarized according to Niblack’s method with ImageJ (Figure 1). Measured FAZ parameters are illustrated in Figure 2.
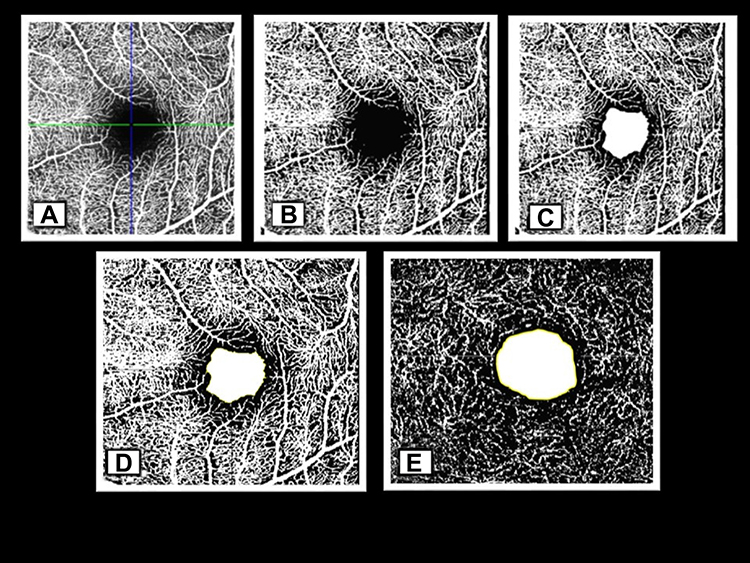 |
Figure 1 OCTA-Image Processing in Image-J. (A) Transverse image of superficial capillary plexus (SCP); (B) Binarized Image of SCP; (C) Ni-black thresholding for Binarized Image; (D) FAZ area (yellow line) in SCP; (E) FAZ area (yellow line) in deep capillary plexus (DCP). |
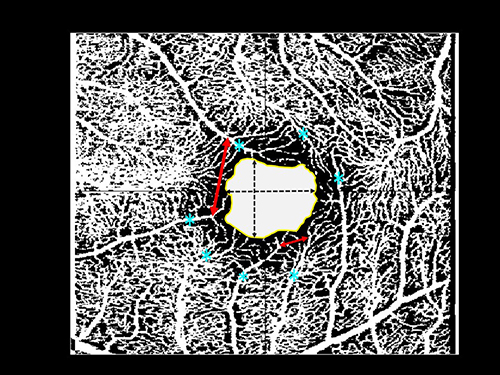 |
Figure 2 FAZ parameters measurement in SCP: FAZ area (yellow line), maximum horizontal and vertical FAZ diameter (dashed black double headed arrow), maximum and minimum vessel to vessel intervening distance (red lines), and number of terminal vessels (sky blue asterisks). |
The EDI images were acquired using horizontal raster pattern scans, which were obtained via a 10 × 10-degree. From the EDI scan, the choroidal thickness was measured manually using the caliper tool at the foveal center from the outer portion of the hyper reflective line corresponding to the RPE to hypo reflective line or margin corresponding to the chorio-scleral junction (Figure 3). The retinal thickness in the nine Early Treatment Diabetic Retinopathy Study (ETDRS) subfields were analyzed by the Retinal Thickness map analysis protocol, but recording was made for the central field only as central retinal thickness (CRT). Refractive errors were determined by the spherical equivalent refraction (SER) calculated as sphere plus the half of the cylindrical error referred to as “mean spherical equivalent”. In accordance with international recommendations, myopia was defined as myopic refractive error when SER of ≤-0.50 D.6 Refractive errors of ≥ +1.00 D were classified as hyperopia. Thus, emmetropia was defined as SER in the range −0.50 D < SER < + 1.00 D. All the measurements were taken between 11 am and 1 pm to prevent the undue effect of diurnal variation.
 |
Figure 3 Measurement of SFCT using EDI-OCT from hyper-reflective line corresponding to the RPE to hypo-reflective line or margin corresponding to the chorio-scleral junction using inbuilt caliper. |
All the statistical analysis was performed using SPSS Software (version 18).7 All the analyzed variables were reported as a mean ± standard deviation (mean ± SD). The significance of the study was evaluated by calculating the confidence limits of the observed rate with 95% confidence band. The significance of associations between analyzed variables and various factors was evaluated by the use of the Karl Pearson correlation coefficient (age, refractive error, axial length, etc), provided the relationship sought is roughly linear. Linear regression analysis and stepwise multiple regression analysis were conducted using FAZ parameters and SFCT as outcome variable and age, ocular factors (refractive error, keratometry, axial length, SFCT, central retinal thickness) and systemic factors (blood pressure, body weight, smoking history and quantity) and various demographic factors as predictors. p- value of less than 0.05 was considered statistically significant.
Results
Clinico-Demographic Features of Enrolled Subjects
Four hundred and twenty eyes of 210 healthy subjects (99 males and 111 females) were included in the study. The clinic-demographic features of enrolled subjects are shown in Table 1. The mean age of the enrolled subjects was 38.99 ± 17.24 years (range 10 to 70 years; Male: 40.33 ± 17.24 years; Female: 37.79 ± 17.23 years). The patients were divided into 6 cohorts based on age group at an equal interval of 10 years (10–20, 20–30 to 60–70). Each cohort consistent 35 patients.
 |
Table 1 Clinico-Demographical Features of Enrolled Subjects |
Most of the enrolled participants were emmetropic (31.42%), followed by myopic (42.6%), and then hyperopic (25.98%). The distribution of the inter-eye refractive status of the eye was statistically insignificant (p = 0.798). The ocular characteristics of the enrolled subjects are shown in Table 1. There was a statistically significant inter eye-difference in terms of mean spherical error (t (209) = −2.252, p = 0.025) and mean average keratometry reading (t (209) = 5.132, p < 0.001). There was statistically insignificant inter-eye difference in terms of BCVA (t(209) = −0.289, p = 0.773), mean IOP (t (209) = −1.301, p = 0.195), mean axial length (t (209) = −1.301, p = 0.193) and mean central retinal thickness (t(209) = 0.150, p = 0.881). The mean Subfoveal Choroidal Thickness in this study was 309.47 ± 68.39 μm and 308.31 ± 69.36 μm (in right eye and left eye, respectively, with an average of 308.89 ± 68.87μm (95% CL, 299.64–318.14 μm)). The inter-eye difference of SFCT was statistically insignificant (t (209) = 0.520, p = 0.603).
Foveal Avascular Zone (FAZ) Parameters
Analysis of the images of both superficial and deep retinal plexus revealed that the configuration of both layers is different. In superficial retinal plexus, the border of the FAZ is well delineated, and vascular network distribution is coarse and related to retinal blood vessel distribution. Meanwhile, the border of FAZ in deep retinal plexus is indistinct with a fine and compact distribution of its vascular network.
The inter rater ICC for FAZ area and vascular density in superficial and deep plexus (average measure) was 0.689 (good), 0.777 (excellent), 0.866 (excellent) and 0.695 (good), respectively, indicating overall good to excellent reliability as defined by Cichetti et al8 (less than 0.4-poor; 0.4 to 0.59 – fair; 0.60 to 0.74- good and 0.75 to 1.00 – excellent). The mean value of two independent observers was considered for analysis.
The FAZ parameters of enrolled subjects are shown in Table 2. The mean superficial and deep FAZ area was 459.96 ± 124.75 μm2 (95% confidence interval [CI], 443.08–476.83) and 589.0 ± 141.39 μm2 (95% CL, 570.77–609.02), respectively. The vessel density in superficial capillary plexus was 54.03 ± 9.34% (95% CL, 53.98–54.11) while the vessel density in deep capillary plexus was 25.91 ± 38% (95% CL, 25.85–25.96). The most common FAZ pattern was vertical oval, followed by round shape and horizontal oval (Figure 4).
 |
Table 2 FAZ Parameters of Enrolled Subjects |
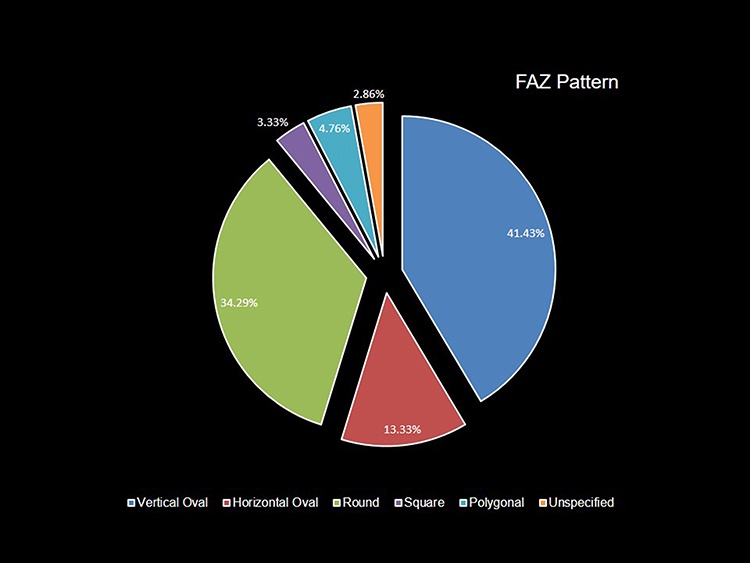 |
Figure 4 Distribution of FAZ pattern in SCP of healthy Nepalese eyes. |
There was a statistically significant difference between inter-eye FAZ parameters in terms of Minimum vessel to vessel intervening distance (p = 0.018), Vertical Diameter of FAZ (p = 0.004), Horizontal Diameter of FAZ (p = 0.007), and area of FAZ in deep plexus (p = 0.003). There was no statistically significant difference between inter-eye FAZ parameters in terms of Vascular Density in Superficial Capillary plexus (SCP) (p = 0.605), Vascular Density in Deep Capillary plexus (DCP) (p = 0.556). As the outcome variables as well as the independent variables in our study did not show statistically significant inter-eye difference in paired t-test in adjusted p-value for multiple testing, data from either eyes were randomly selected for further analysis There was a statistically significant difference between the horizontal and vertical diameter of FAZ (t (209)= 2.702, p = 0.007). There was a statistically significant difference between the superficial and deep FAZ area (t (209)= −12.83, p < 0.001). Vascular density in superficial capillary plexus correlated significantly with vascular density in deep capillary plexus (r = 0.498, p < 0.001). There was no statistically significant difference between genders in FAZ parameters.
FAZ Parameters and SFCT vs Age Group, and Refractive Status
The mean FAZ area in both superficial and deep capillary plexus demonstrated a positive correlation with age (Figure 5) (r = 0.184, p = 0.007 and r = 0.355, <0.001 respectively). Mean highest superficial FAZ area was observed in age group 60–70 years (523.51 ± 93.10 μm2) and lowest in age group 10–20 years (431.77 ± 127.95 μm2) (Table 3). Mean highest deep FAZ area was observed in age group 60–70 years (634.16 ± 128.49 μm) and lowest in age group 10–20 years (595.88 ± 150.22μm2). There was a statistically significant negative correlation of vascular density with age in superficial FAZ (r = −0.142, p = 0.016). The mean vascular density in superficial capillary plexus was highest in age 10–20 years and least in age 60–70 years (62.15 ± 5.23 and 48.26± 8.26 respectively). In the stepwise line regression analysis, the superficial FAZ area was found to enlarge by 1.321 μm2 per year (p = 0.007); in each decade of life, approximately 13.21 μm2 enlargement in superficial FAZ area was observed. Similarly, the vessel density in the superficial plexus was found to decrease approximately by 0.216% per year (p < 0.001). In each decade of life, approximately 2.16% reduction in superficial vessel density was observed.
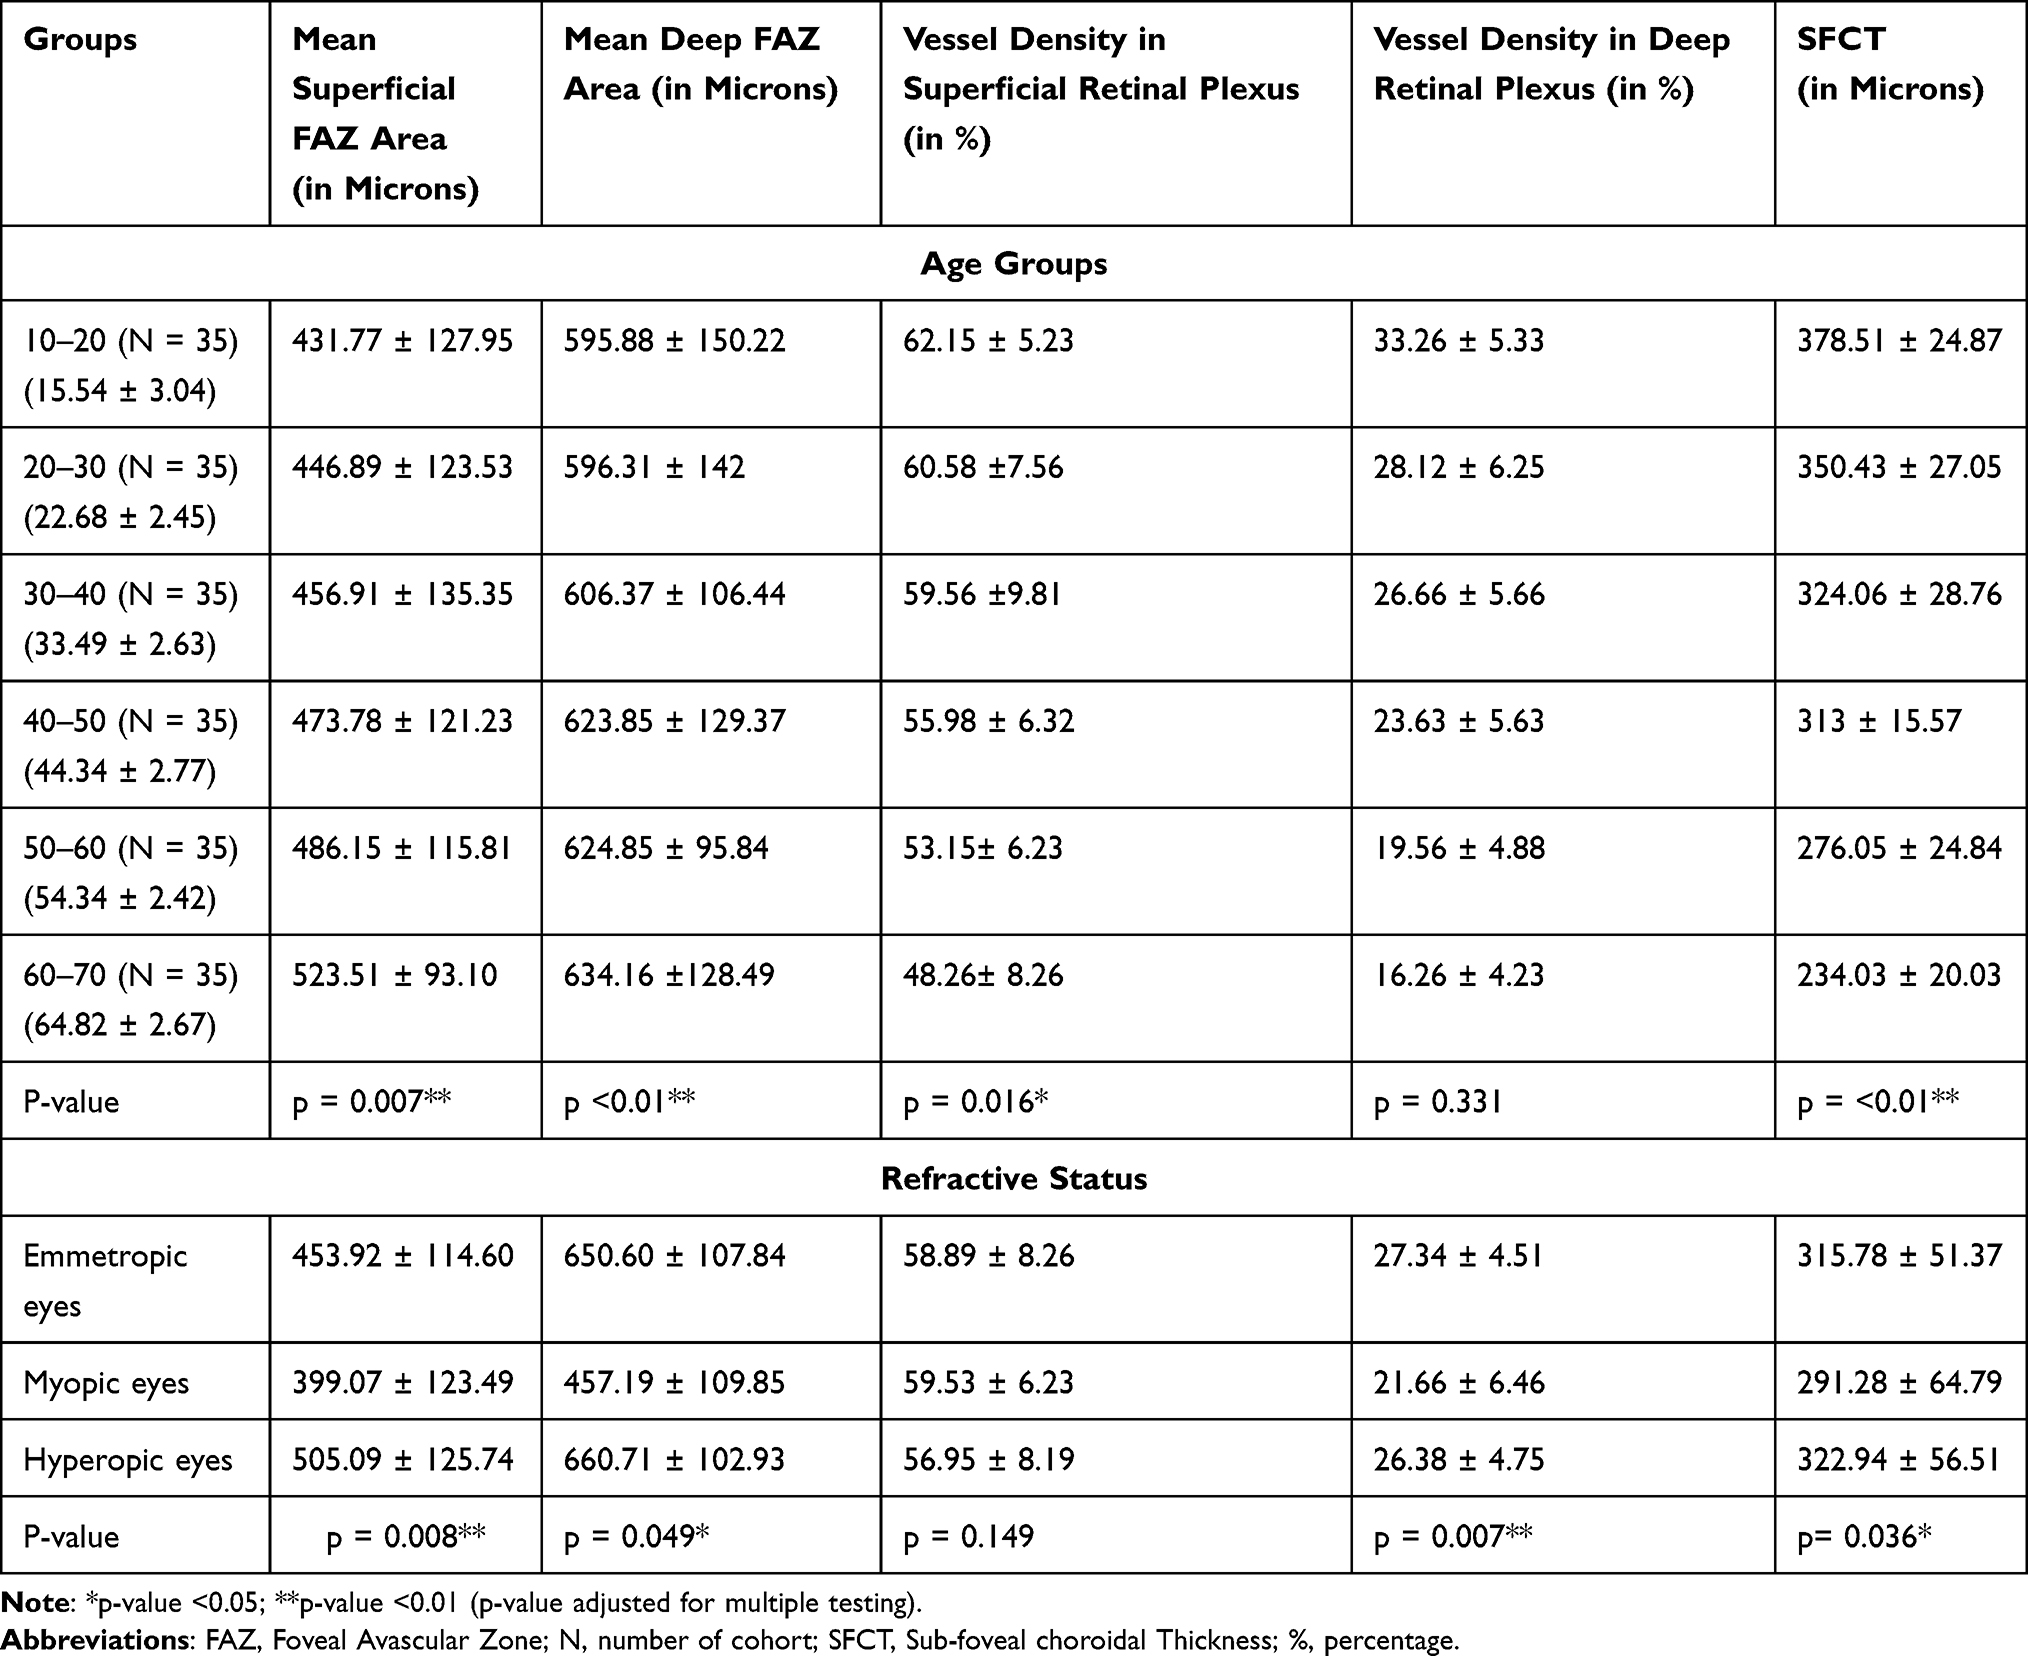 |
Table 3 FAZ Parameters, Vessel Density and SFCT in Various Age Groups and Refractive Status |
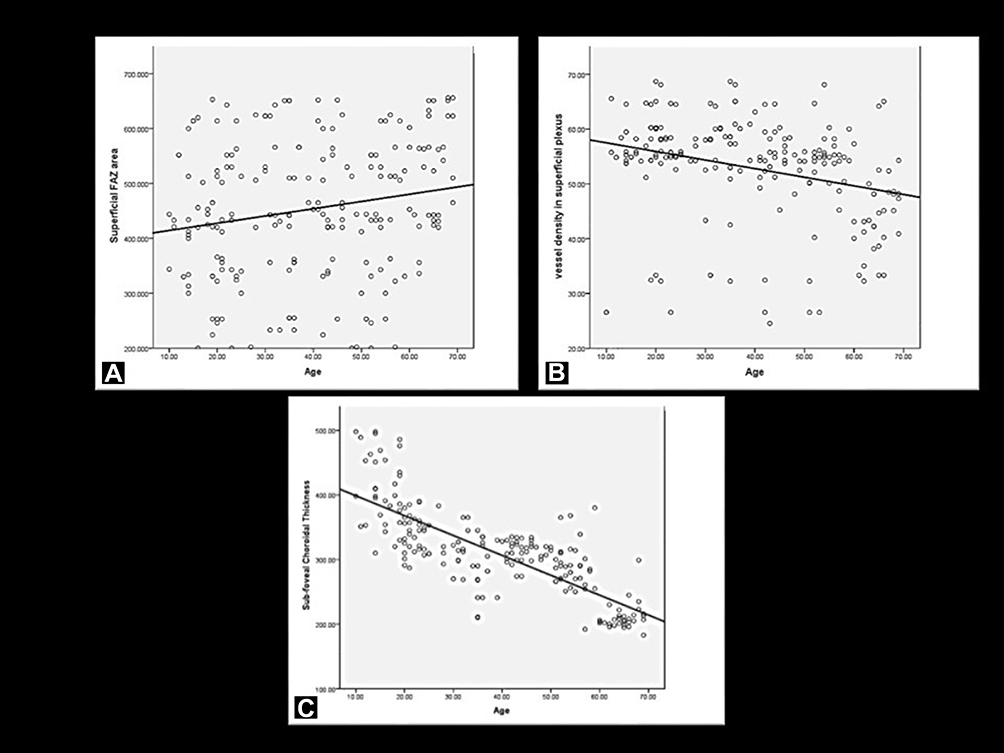 |
Figure 5 Scatter plot of FAZ area and vessel density in SCP and SFCT with age. (A) FAZ area in SCP vs age; (B) vessel density in SCP vs age; (C) SFCT vs age. |
Similarly, the highest SFCT was observed in age group 10–20 years (RE: 378.51 ± 24.87 μm and LE: 379.65 ± 25.36 μm) and lowest in age group 60–70 years (RE: 234.03 ± 20.03 μm and LE: 232.45 ± 21.92 μm) (Table 3). There was a statistically significant negative co-relation between age and SFCT (r = −0.776, p < 0.001). In the stepwise linear regression analysis, SFCT was found to decrease by 3.077 μm per year (Figure 5). In each decade of life, approximately 30 μm choroidal thinning is observed.
There was a statistically significant correlation between refractive status and superficial FAZ area (p = 0.008,) deep FAZ area (p = 0.049) and vascular density in deep plexus (p = 0.007) (Table 3). Compared to emmetropia, the myopes had smaller superficial FAZ area and the hyperopes had larger superficial FAZ area (p = 0.008). Compared to emmetropia, the myopes had a lesser vessel density in deep plexus (p = 0.007). Besides that, SFCT was also thinner in the myopic eyes and thicker in the hyperopic eyes in comparison to the emmetropic eyes (p = 0.036).
Variation FAZ Parameters with Ocular and Systemic Parameters
There was no statistically significant correlation of FAZ area and vessel density with ocular parameters in terms of IOP, axial length, average K reading and central retinal thickness. Mean SFCT demonstrated a negative correlation with axial length (r = −0.34, p = 0.039) (Table 4).
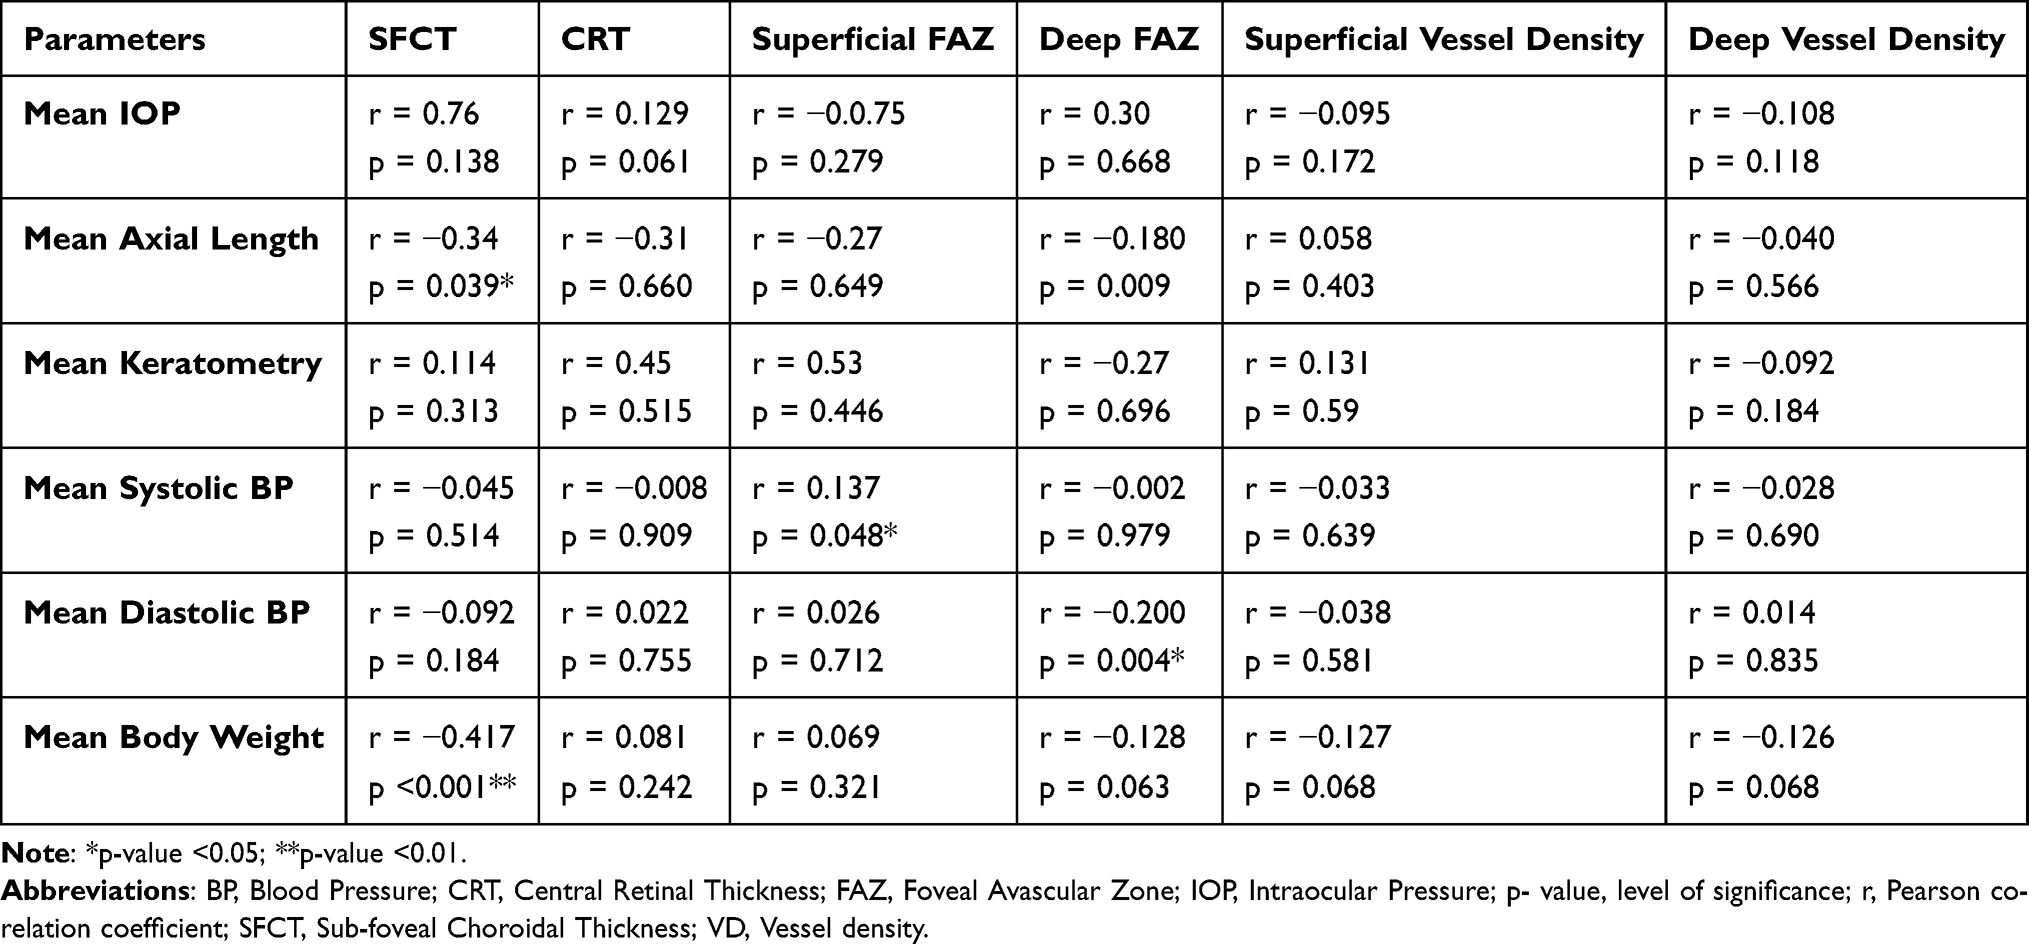 |
Table 4 Variation of SFCT, CRT and FAZ Area and VD with Ocular Systemic Parameters |
The mean superficial FAZ area showed a positive correlation with mean systolic blood pressure (r = 0.137, p = 0.048), while the mean deep FAZ area showed a negative correlation with mean diastolic blood pressure (r = −0.200, p = 0.004). There was no significant correlation of vessel density with systemic parameters in terms of BP, Diastolic BP and Body Weight. There was a statistically significant negative correlation of SFCT with body weight (r = −0.417, p < 0.001) (Table 4).
Correlation of FAZ Parameters with SFCT and CRT
There was a statistically significant negative correlation of the superficial FAZ with SFCT (r = −0.205, p = 0.003). The mean SFCT did not correlate with the vessel density in both Superficial and deep plexus as well as Deep FAZ area did not correlate with SFCT (Table 5).
 |
Table 5 Correlation of SFCT and CRT with FAZ Parameters (Karl Pearson Correlation) |
There was a statistically significant negative co-relation of CRT with Superficial and deep FAZ (r = −0.141, p = 0.014 and r = −0.142, p = 0.039). The mean CRT did not correlate with Vascular Density (Superficial), Vascular Density (Deep), Superficial to Deep FAZ area ratio and FAZ pattern (Table 5).
Discussion
The foveal avascular zone (FAZ) is a capillary-free area in the central macula with high photoreceptor density and metabolic activity. To the best of our knowledge, this is the first study to report details on quantitative parameters of FAZ in healthy Nepalese subjects and factors affecting it. In our study, the number of terminal vessels in superficial FAZ was variable, ranging from 7 to 11 terminal vessels in either eyes. This is comparable to findings by Eldaly et al.9 We measured the vessel density in SCP and DCP across the entire image using vessel analysis plugin of ImageJ software. We found no statistically significant difference between inter-eye Vessel density in Superficial Capillary plexus (SCP) (p = 0.605) and in Deep Capillary plexus (DCP) (p = 0.556). Falavarjani et al have reported a mean SCP vessel density of 51.5 ± 4.2 (range, 38.4–58.1) % in the whole image, which is in accordance with our study, but in the same study DCP vessel density was 57.4 ± 3.1% which is comparatively greater than our finding.10 In our study, the vessel density in SCP was almost 2.16 times that of DCP. This is consistent with findings from Yanan Dong’s study in which the mean VD in SVC was 49.70%, and the mean DVC was 20.90% in Washington County participants.11 The vessel density noted in our study is comparatively greater than other reported studies, and this may be attributed to the fact that we analyzed the vascular density across the entire OCTA image, not just the fraction of the image. However, studies have speculated that the vessel density analyses in the superficial and deep retinal vascular plexus need to be a local rather than an average of the whole image.11 In this study, the FAZ area in the deep plexus was significantly greater than the superficial plexus and the superficial FAZ area had no statistically significant inter-eye difference, but FAZ area in deep plexus was statistically significant for inter eye variation. Foveal avascular zone of superficial (0.35 ± 0.013 mm2) and deep (0.49 ± 0.012 mm2) retinal vascular plexus have been reported by Gadde et al, this is consistent with our finding that the deep FAZ area is larger than the superficial FAZ area.12 The superficial FAZ area of 0.47 mm2 has also been found by Di et al which is consistent with our finding.13 Like SFCT, the FAZ area and vascular density are also associated with age. By enrolling subjects across various age group 10–70 years with a mean age of 38.99 ± 17.24 years, we have attempted to delineate the age factor on FAZ parameters. Our study showed a positive correlation of both superficial and deep FAZ area with age, meaning that FAZ enlarges with advancing age. Similarly, we also noted an age-related decline in the vessel density in both superficial and deep capillary plexus. In our study, within age group of 10–20, the mean minimum FAZ area and mean maximum vessel density were observed, and within the age group of 60–70 years, the mean maximum FAZ area and mean minimum vessel density were observed indicating that the advancing age is accompanied by the age-related decline in vessel density in FAZ leading to involutional senile FAZ enlargement. In each decade of life, our study found approximately 13.21 μm2 enlargement in superficial FAZ area and 2.16% reduction in superficial vessel density. Enlargement of FAZ is also attributed to tissue loss and relative reduction on oxygen and nutrient demand that leads to reduce vascular supply thereby causing shrinkage of vessel density. This finding is similar to that reported by Yu et al, Wei et al and Park et al.14–16 We have noted a significant variation of FAZ pattern based on refractive status of the eye. This biological association between FAZ parameters and refractive has already been reported in various studies.17–20 Although we have made corrections for AL-related magnification to take account of FAZ parameters, these variations alone may not have been the effect of biological associations.
In our study, the mean SFCT was 309.47 ± 68.39 μm (Range: 192 to 417 μm) and 308.31 ± 69.36 (Range: 196 to 420 μm), respectively, in right eye and left eye with a mean SFCT between two eyes of 308.89 ± 68.87 μm. This finding is consistent with the previously reported sub-foveal choroidal thickness in healthy Nepalese subjects from Nepal by Gyawali et al in which an average SFCT of 310.31 ± 75.70 μm for both eyes has been reported.21 The mean SFCT of the Nepalese population was found to be closer to the reported SFCT thickness in the Indian population (307±79 μm),22 Spanish population (301.89 ± 80.53 μm),23 and Chinese population (328.8 μm).24 SFCT was found to decrease by 3.077 μm per year in our study.
Our study has also evaluated the association between FAZ parameters with various systemic and ocular factors. In this study, we did not find significant co-relation between FAZ area (SCP and DCP) and vessel density with mean IOP, mean average keratometry and mean axial length.
In our study, the superficial FAZ area was correlated with systolic blood pressure while the deep FAZ area was co-related with diastolic blood pressure. Studies have also established vessel measurement with OCTA as a means to assess cardiovascular risk factor. The inner vascular density measured with OCT-A has been reported to be associated with the cardiovascular risk profile.25 We did not find any relation of vessel density with body weight and blood pressure. However, studies have reported a positive correlation between FAZ area and hypertension. Dantas de et al found that the superficial FAZ area was significantly larger in hypertension group in comparison to control group.26 Foveal avascular zone is larger in patients with diabetes mellitus associated with essential hypertension.27 In our study, we found a significant negative correlation of SFCT with Superficial FAZ area. Larger FAZ is associated with thinner SFCT in both the univariate and multivariate regression analyses, thus indicating a possible relation between SFCT and FAZ, which has been demonstrated by previous studies.28 A strong correlation between FAZ area and CRT has been reported in past studies using healthy eyes.29 We did not find any significant correlation between vessel density and SFCT as reported by Fujiwara et al in which the retinal vascular density has been negatively correlated with FAZ area.30 We found a significant negative correlation between body weight and SFCT. A number of studies have consistently reported a negative association between SFCT and BMI measurements.31
The major strength of this study is its adequate sample. The samples were relatively heterogeneous belonging to different age groups which made it possible to study the ageing effect and inter-ethnic effect on retina and choroid. Our subjects had a wide range of clinical characteristics which could increase the accuracy of the regression analyses. We have studied the variation of FAZ parameters with refractive status of the eye and have assessed the possible effects of higher levels of myopia or hyperopia oretinal thickness the foveal microvasculature, choroidal thickness and retinal thickness. However, the variation may not be the effect of only biological associations but could have optical effects as well. The current study has provided a better and wider understanding of choroidal, retinal and FAZ parameters which can be used to have a better insight in understanding the disease process involving retina and choroid. A major limitation of this study could be the methods used to quantify choroidal thickness which is manual and may be subjected to grading bias. We have studied the vessel density across the entire image but vessel density analyses in the superficial and deep retinal vascular plexus needs to be a local rather than an average of the whole image.
Conclusion
In conclusion, this cross-sectional study is first in Nepal to report on the FAZ parameters and vessel density in healthy Nepalese subjects which is in accordance with reports from other parts of the world. FAZ area and vessel density exhibit significant variation with ocular factors, especially axial length and systemic factors, particularly age. Therefore, the demographic, ocular and systemic variations may be important parameters when assessing FAZ area for the diagnosis and follow-up of macular diseases. The normative data on qualitative and quantitative FAZ parameters can be used as a baseline while conducting research on similar topics. These findings are also useful in evaluating choroidal-retinal disease in Nepalese population.
Acknowledgments
We thank Mrs. Manju Yadav and Mr. Om Budhathoki for their extensive support and aid while performing investigative procedures. We thank Mr. Manish Poudel for guidance in statistical analysis.
Disclosure
The authors report no conflicts of interest in this work.
References
1. Koulisis N, Kim AY, Chu Z, et al. Quantitative microvascular analysis of retinal venous occlusions by spectral domain optical coherence tomography angiography. PLoS One. 2017;12:e0176404. doi:10.1371/journal.pone.0176404
2. Zivkovic M, Dayanir V, Kocaturk T, et al. Foveal avascular zone in normal tension glaucoma measured by optical coherence tomography angiography. Biomed Res Int. 2017;2017:3079141. doi:10.1155/2017/3079141
3. Tang FY, Ng DS, Lam A, et al. Determinants of quantitative optical coherence tomography angiography metrics in patients with diabetes. Sci Rep. 2017;7:2575. doi:10.1038/s41433-019-0500-5
4. Takagi M, Maruko I, Yamaguchi A, Kakehashi M, Hasegawa T, Iida T. Foveal abnormalities determined by optical coherence tomography angiography in children with history of retinopathy of prematurity. Eye. 2019;33(12):1890–1896. doi:10.1038/s41433-019-0500-5
5. Rasband WS. ImageJ, U. S. Bethesda, Maryland, USA: National Institutes of Health. 1997–2018. Available from: https://imagej.nih.gov/ij/.
6. Flitcroft DI, He M, Jonas JB, et al. IMI—defining and classifying myopia: a proposed set of standards for clinical and epidemiologic studies. Invest Ophthalmol Vis Sci. 2019;60:M20–M30. doi:10.1167/iovs.18-25957
7. SPSS Inc. PASW Statistics for Windows, Version 18.0. Chicago: SPSS Inc; 2009.
8. Cicchetti D, Toth SL. A developmental psychopathology perspective on child abuse and neglect. J Am Acad Child Adolesc Psychiatry. 1995;34(5):541–565. doi:10.1097/00004583-199505000-00008
9. Eldaly Z, Soliman W, Sharaf M, Reyad AN. Morphological characteristics of normal foveal avascular zone by optical coherence tomography angiography. J Ophthalmol. 2020;(4):1–6. doi:10.1155/2020/8281459
10. Falavarjani KG, Shenazandi H, Naseri D, et al. Foveal avascular zone and vessel density in healthy subjects: an optical coherence tomography angiography study. J Ophthalmic Vis Res. 2018;13(3):260–265. doi:10.4103/jovr.jovr_173_17
11. Dong Y, Guo X, Abraham A, et al.Vessel density and Foveal Avascular Zone (FAZ) size among a community sample of older adults from the eye determinants of cognition (EyeDOC) study. Invest Ophthalmol Vis Sci. 2020;61(7):3856.
12. Gadde SGK, Anegondi N, Bhanushali D. Quantification of vessel density in retinal optical coherence tomography angiography images using local fractal dimension. Invest Ophthalmol Vis Sci. 2016;57(1):246–252. doi:10.1167/iovs.15-18287
13. Di G, Weihong Y, Xiao Z, et al. A morphological study of the foveal avascular zone in patients with diabetes mellitus using optical coherence tomography angiography. Graefes Arch Clin Exp Ophthalmol. 2016;254(5):873–879. doi:10.1007/s00417-015-3143-7
14. Yu J, Jiang C, Wang X. Macular perfusion in healthy Chinese: an optical coherence tomography angiogram study. Invest Ophthalmol Vis Sci. 2015;56:3212–3217. doi:10.1167/iovs.14-16270
15. Wei Y, Jiang H, Shi Y, et al. Age-related alterations in the retinal microvasculature, microcirculation, and microstructure. Investig Ophthalmol Vis Sci. 2017;58:3804–3817. doi:10.1167/iovs.17-21460
16. Park SH, Cho H, Hwang SJ, et al. Changes in the retinal microvasculature measured using optical coherence tomography angiography according to age. J Clin Med. 2020;9(3):883. doi:10.3390/jcm9030883
17. Lee JH, Lee MW, Baek SK, Lee YH. Repeatability of manual measurement of foveal avascular zone area in optical coherence tomography angiography images in high myopia. Korean J Ophthalmol. 2020;34(2):113–120. doi:10.3341/kjo.2019.0105
18. Sung MS, Lee TH, Heo H, Park SW. Association between optic nerve head deformation and retinal microvasculature in high myopia. Am J Ophthalmol. 2018;188:81–90. doi:10.1016/j.ajo.2018.01.033
19. Lv L, Li M, Chang X, et al. Macular retinal microvasculature of hyperopia, emmetropia, and myopia in children. Front Med. 2022;9:900486. doi:10.3389/fmed.2022.900486
20. Sasaki K, Sasaki K, Hirota M, Hayashi T, Mizota A. Comparisons of size of foveal avascular zone area among children with posterior microphthalmos, high hyperopia, and normal eyes. Int Ophthalmol. 2022;42(8):2599–2607. doi:10.1007/s10792-022-02250-4
21. Gyawali P, Kharel Sitaula R, Kharal A, Bhusal A, Paudel M, Joshi SN. Sub-foveal choroidal thickness in healthy Nepalese population. Clin Optom. 2019;11:145–149. doi:10.2147/OPTO.S220615
22. Akhtar Z, Rishi P, Srikanth R, Rishi E, Bhende M, Raman R. Choroidal thickness in normal Indian subjects using Swept source optical coherence tomography. PLoS One. 2018;13(5):e0197457. doi:10.1371/journal.pone.0197457
23. Ruiz-Medrano J, Flores-Moreno I, Peña-García P, Montero JA, Duker JS, Ruiz-Moreno JM. Macular choroidal thickness profile in a healthy population measured by swept-source optical coherence tomography. Invest Ophthalmol Vis Sci. 2014;55(6):3532–3542. doi:10.1167/iovs.14-13868
24. Cheong KX, Lim LW, Li KZ, Tan CS. A novel and faster method of manual grading to measure choroidal thickness using optical coherence tomography. Eye. 2018;32(2):433–438. doi:10.1038/eye.2017.210r24
25. Arnould L, Guenancia C, Azemar A, et al. The EYE-MI pilot study: a prospective acute coronary syndrome cohort evaluated with retinal optical coherence tomography angiography. Invest Ophthalmol Vis Sci. 2018;59(10):4299–4306. doi:10.1167/iovs.18-24090
26. Stana D, Potop V, Istrate SL, et al.Foveal avascular zone in hypertension as measured by optical coherence tomography angiography. Curr Tre Ophthal. 2019;2(1):136–140.
27. Stana D, Potop V, Istrate SL, et al. Foveal avascular zone area measurements using OCT angiography in patients with type 2 diabetes mellitus associated with essential hypertension. Rom J Ophthalmol. 2019;63(4):354–359. doi:10.22336/rjo.2019.55
28. Chui TYP, VanNasdale DA, Elsner AE, Burns SA. The association between the foveal avascular zone and retinal thickness. Invest Ophthalmol Vis Sci. 2014;55(10):6870–6877. doi:10.1167/iovs.14-15446
29. Samara WA, Say EAT, Khoo CTL, et al. Correlation of foveal avascular zone size with foveal morphology in normal eyes using optical coherence tomography angiography. Retina. 2015;35:2188–2195. doi:10.1097/IAE.0000000000000847
30. Fujiwara A, Morizane Y, Hosokawa M, et al. Factors affecting foveal avascular zone in healthy eyes: an examination using swept-source optical coherence tomography angiography. PLoS One. 2017;12(11):e0188572. doi:10.1371/journal.pone.0188572
31. Teberik K, Eski MT, Dog˘an S, et al. Ocular abnormalities in morbid obesity. Arq Bras Oftalmol. 2019;82:6–11. doi:10.5935/0004-2749.20190007
 © 2022 The Author(s). This work is published and licensed by Dove Medical Press Limited. The
full terms of this license are available at https://www.dovepress.com/terms
and incorporate the Creative Commons Attribution
- Non Commercial (unported, 3.0) License.
By accessing the work you hereby accept the Terms. Non-commercial uses of the work are permitted
without any further permission from Dove Medical Press Limited, provided the work is properly
attributed. For permission for commercial use of this work, please see paragraphs 4.2 and 5 of our Terms.
© 2022 The Author(s). This work is published and licensed by Dove Medical Press Limited. The
full terms of this license are available at https://www.dovepress.com/terms
and incorporate the Creative Commons Attribution
- Non Commercial (unported, 3.0) License.
By accessing the work you hereby accept the Terms. Non-commercial uses of the work are permitted
without any further permission from Dove Medical Press Limited, provided the work is properly
attributed. For permission for commercial use of this work, please see paragraphs 4.2 and 5 of our Terms.