Back to Journals » OncoTargets and Therapy » Volume 9
Normalization of gene expression measurement of tissue samples obtained by transurethral resection of bladder tumors
Authors Pop L, Pileczki V, Cojocneanu-Petric R, Petrut B, Braicu C ![]() , Jurj A, Buiga R
, Jurj A, Buiga R ![]() , Achimas-Cadariu P, Berindan-Neagoe I
, Achimas-Cadariu P, Berindan-Neagoe I
Received 2 October 2015
Accepted for publication 20 February 2016
Published 2 June 2016 Volume 2016:9 Pages 3369—3380
DOI https://doi.org/10.2147/OTT.S97519
Checked for plagiarism Yes
Review by Single anonymous peer review
Peer reviewer comments 2
Editor who approved publication: Dr William C. Cho
Laura A Pop,1,* Valentina Pileczki,1,2,* Roxana M Cojocneanu-Petric,1 Bogdan Petrut,3,4 Cornelia Braicu,1 Ancuta M Jurj,1 Rares Buiga,5 Patriciu Achimas-Cadariu,6,7 Ioana Berindan-Neagoe1,8
1The Research Center for Functional Genomics, Biomedicine and Translational Medicine, Iuliu Haţieganu University of Medicine and Pharmacy, Cluj-Napoca, Cluj, Romania; 2Department of Analytical Chemistry, Iuliu Haţieganu University of Medicine and Pharmacy, Cluj-Napoca, Cluj, Romania; 3Department of Surgery II – Urology, The Oncology Institute “Prof Dr Ion Chiricuţă”, Cluj-Napoca, Cluj, Romania; 4Department of Urology, Iuliu Haţieganu University of Medicine and Pharmacy, Cluj-Napoca, Cluj, Romania; 5Department of Pathology, The Oncology Institute “Prof. Dr Ion Chiricuţă”, Cluj-Napoca, Cluj, Romania; 6Department of Surgery, The Oncology Institute “Prof Dr Ion Chiricuţă”, Cluj-Napoca, Cluj, Romania; 7Department of Surgical Oncology and Gynecological Oncology, Iuliu Haţieganu University of Medicine and Pharmacy, 8Department of Functional Genomics and Experimental Pathology, The Oncology Institute “Prof Dr Ion Chiricuţă”, Cluj-Napoca, Cluj, Romania
*These authors contributed equally to this work
Background: Sample processing is a crucial step for all types of genomic studies. A major challenge for researchers is to understand and predict how RNA quality affects the identification of transcriptional differences (by introducing either false-positive or false-negative errors). Nanotechnologies help improve the quality and quantity control for gene expression studies.
Patients and methods: The study was performed on 14 tumor and matched normal pairs of tissue from patients with bladder urothelial carcinomas. We assessed the RNA quantity by using the NanoDrop spectrophotometer and the quality by nano-microfluidic capillary electrophoresis technology provided by Agilent 2100 Bioanalyzer. We evaluated the amplification status of three housekeeping genes and one small nuclear RNA gene using the ViiA 7 platform, with specific primers.
Results: Every step of the sample handling protocol, which begins with sample harvest and ends with the data analysis, is of utmost importance due to the fact that it is time consuming, labor intensive, and highly expensive. High temperature of the surgical procedure does not affect the small nucleic acid sequences in comparison with the mRNA.
Conclusion: Gene expression is clearly affected by the RNA quality, but less affected in the case of small nuclear RNAs. We proved that the high-temperature, highly invasive transurethral resection of bladder tumor procedure damages the tissue and affects the integrity of the RNA from biological specimens.
Keywords: bladder cancer, transurethral resection, RNA quality, real-time PCR
Introduction
Although bladder cancer is a worldwide epidemiologic concern, it has been poorly represented in genomic studies due to the challenges raised by tumor tissue sample collection and preservation.1 In Europe, the incidence of this malignancy is 26.9 and its mortality is 8.5 in men, with a 5-year prevalence of 52.1%. Bladder cancer in women has a lower incidence and mortality of 5.3 and 1.8, respectively, with a 5-year prevalence of 52.4%.2 The incidence and mortality values are presented considering the age-standardized rate (European) per 100,000 people. The most frequently used surgical approach in urinary bladder cancer treatment is transurethral resection of bladder tumor (TURBT), having both diagnostic and prognostic value.3,4 It provides important staging information, facilitating treatment employment, and decreases tumor recurrence.5 Although it is an invasive technique that requires general anesthesia,4 TURBT remains the best strategy to remove all visible lesions from the urinary bladder.6,7
Even though TURBT is important in the management of bladder cancer, it represents a challenge in biological sample processing, with direct influence on downstream genomic analyses. This technique involves the diathermic effect of an alternative high-frequency current delivered to the tissue at the tip of a resection loop. By construction, the place where the resection loop touches the tissue is the area with the highest impedance of the current circuit, where the highest heat generation occurs. This high temperature is used for tissue cutting and for protein coagulation of the bleeding vessels, to reduce excessive hemorrhage. For monopolar systems, the power delivered to the tissue by the electric current passing through the resection loop will be responsible for the amount of heat transferred to the tissue.
In order to prevent overheating of the tissue sample and minimize the degradation processes, so that they could be further histologically or genetically analyzed, the electrical power delivered by the electrocautery device needs to be strictly controlled. There are several parameters that have to be considered and adjusted in order not to overheat the tissue during TURBT. These parameters are distance between the tissue and the loop, pressure of the loop on the tissue, contact surface of the loop, and the intensity of the current passing through the loop. Thus, it is necessary to use an electrocautery device with current intensity modulation capabilities. Another important parameter is the tension applied at the tip of the loop. Hence, there should be a strict correlation, which determines the automatic adjustment of lower currents when the tension reaches high values, with direct consequences on the diathermic effects into the tissue, of ~3–5 mm.8
In order to obtain the optimal quality data that will provide new relevant information in the prevention, diagnosis, prognosis, and treatment of bladder cancer, a suitable quality and quantity of RNA and small nuclear RNA (snRNA) are needed.
Total RNA represents a widely used genomic material to evaluate the level of expression by microarrays, next-generation sequencing, and quantitative real-time polymerase chain reaction (qRT-PCR). It is well known that the quantity and quality of RNAs and snRNAs can influence the results obtained for different methods used for evaluation in genomic studies, like microarrays, next-generation sequencing, and qRT-PCR. snRNAs, also called U-RNAs, are small RNA molecules found in the nucleus of eukaryotes and are an important part of the spliceosome.9 U6 is a snRNA that is used often as a normalizer of miRNA expression measurements.10–13 To reduce the level of degradation and obtain an optimal analysis in the gene expression studies, there are several methods used for quality assessment of RNA and snRNA, such as nano-spectrophotometric methods, nano-electrophoresis, or even qRT-PCR. For the nano-spectrophotometric methods, the most widely used instrument is the NanoDrop, whose purpose is focused on the quantitative evaluation, and it can also provide some information about the quality.14 Another method employs the use of Agilent 2100 Bioanalyzer (Agilent Technologies, Santa Clara, CA, USA), which gives both qualitative and quantitative information about RNA.3,15 qRT-PCR methods use housekeeping genes for normalization of the genomic data and to predict the alteration of biological processes in a pathological context or as response to a particular treatment. If a high-quality RNA sample is not obtained, specific optimization protocols can be developed for molecular profiling. Gene expression normalization is highly important in comparison studies of gene expression levels between tissue samples. Therefore, the time and methods used for tissue sample processing, as well as the storage conditions, are very important for molecular biology tests and diagnostic assessments.
The present study was performed to establish the influence of TURBT maneuver on the quality and quantity of RNA and snRNA obtained from samples collected after surgical removal of bladder tumors.
Patients and methods
Patients
Bladder cancer patients used in this study were diagnosed with different stages of urothelial carcinomas (as summarized in Table 1), belonged to both sexes, and had ages ranging from 51 to 93 years. To be included in the study, all patients were given information about the study, and they voluntarily signed an informed consent. The inclusion criteria for the patients were as follows: to have been diagnosed with urothelial carcinoma and to have undergone a TURBT intervention. All their personal data were handled following closely the dispositions of the Declaration of Helsinki, as well as up-to-date EU confidentiality regulations.
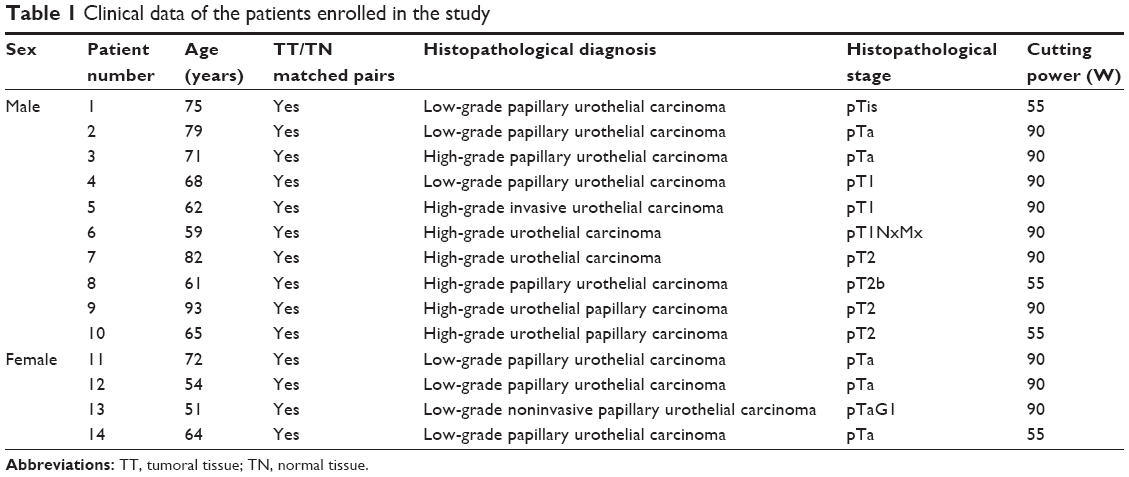 | Table 1 Clinical data of the patients enrolled in the study |
Sample collection, processing, and RNA isolation
The study and the protocols used in this study were approved by the Ethical Committee of the Iuliu Haţieganu University of Medicine and Pharmacy, Cluj-Napoca, Romania, with the authorization no 673A/20.11.2012. The analyzed samples were obtained from patients who underwent primary evaluation/surgical treatment for urothelial carcinomas, as described by the National Comprehensive Cancer Network guidelines. We collected tumor and matched normal tissue samples from 14 patients (ten males and four females) from The Oncology Institute “Prof Dr Ion Chiricuţă”, Cluj-Napoca, Romania. This procedure involved the use of general anesthesia, and was performed with a Richard Wolf-24 Shark resectoscope with a TURBT cutting mode and two different options, one monopolar and one bipolar electrocautery device. The power used was 90 W for cutting and 70 W for coagulation in the monopolar mode and 55 W for cutting and 40 W for coagulation in the bipolar mode. Immediately after resection, tissue specimens were collected in RNA-later extraction buffer, which is a good RNA integrity stabilizer and ensures a suitable reliability for the profiling studies.16,17 This was performed in order to increase tissue stabilization during the transport of the samples from the pathology department to the investigation laboratory, which took ~5–10 minutes. Then samples were washed with phosphate-buffered saline (PBS; Sigma-Aldrich, St Louis, MO, USA) and placed in liquid nitrogen for 2–3 months until total RNA extraction. The extraction was performed with TriReagent (Sigma-Aldrich) using the standard procedure,18 and the RNA samples were stored at −80°C for several months, until further processing.
RNA quantification
The RNA was measured both quantitatively and qualitatively. For the quantitative and qualitative evaluation of the RNA samples, we used the previously described instruments (NanoDrop and Agilent 2100 Bioanalyzer) following the specific protocol provided by the manufacturer. The nanochip used for evaluating the RNA quality produces electrophoresis peaks, from which the RNA integrity number (RIN) is calculated. The RIN is considered to be the best predictor for assessing the integrity of the mRNA molecules. The RIN algorithm was calculated for all the normal tissue and tumor tissue samples. The RIN is a decimal number ranging from 1 to 10, where 1 is attributed to completely degraded samples and 10 to intact RNA samples with very good quality. The main features taken into consideration for RNA quality evaluation are the size of the 18S and 28S peaks, the shape of these two peaks, the stability of the baseline, the appearance of additional peaks on the electropherogram, and the elevation of baseline between the two peaks.19
Quantitative real-time PCR for mRNA
The RNA samples were diluted to a concentration of 50 ng/μL and then reverse transcribed. The cDNA was obtained using the Transcriptor First Strand cDNA Synthesis Kit (Hoffmann-La Roche Ltd., Basel, Switzerland) using the specific protocol provided by the manufacturer. The real-time PCR protocol was conducted using the LightCycler TaqMan Master Mix (Hoffmann-La Roche Ltd.), employing the recommended protocol. The obtained cDNA was diluted 1:10 (diluent is RNase, DNase free water) and used in the RT-PCR with specific primers for each evaluated gene. Each sample was analyzed in duplicate on a 384-well plate, which was centrifuged briefly and introduced in the qRT-PCR machine ViiA 7 (Thermo Fisher Scientific, Waltham, MA, USA) using the following program: 1 cycle 10 minutes at 95°C, 40 cycles 1 second at 95°C and 20 seconds at 60°C. The sequences of the primers used were as follows: β-actin forward primer: 5′-GCTATGAGCTGCCTGATGG-3′, reverse primer: 5′-GGCTGGAAAAGAGCCTCG-3′; GAPDH forward primer: 5′-CCCCGGTTTCTATAAATTGAG-3′, reverse primer: 5′-CACCTTCCCCATGGTGTCT-3′; 18S forward primer: 5′-CTCAACACGGGAAACCTCAC-3′, reverse primer: 5′-CGCTCCACCAACTAAGAACG-3′. The corresponding Universal probe library (UPL)-probes (Hoffmann-La Roche Ltd.) were as follows: GAPDH probe 68, 18S probe 77, and β-actin probe 9.
Quantitative real-time PCR for U6 expression
For evaluating U6 expression, cDNA was synthesized starting from 16 ng/μL total RNA using the TaqMan Reverse Transcription Kit (Thermo Fisher Scientific, Waltham, MA, USA) using the manufacturer protocol. The samples were placed into a PCR machine with the following program: 30 minutes at 16°C, 30 minutes at 42°C, 5 minutes at 85°C, and then an infinite hold at 4°C. The cDNA was diluted and further used for the qRT-PCR experiment. The qRT-PCR evaluation was done in a LightCycler480 instrument (Hoffmann-La Roche Ltd.), in a 10 μL reaction volume using the SsoFast Supermix (Bio-Rad Laboratories Inc., Hercules, CA, USA) and specific primers for U6. The program for the qRT-PCR experiment was as follows: 3 minutes at 95°C, 5 seconds at 95°C, and 30 seconds at 60°C; the last two steps were repeated 45 times. All the sample analyses were performed in duplicate. The U6 primer sequence was as follows: forward primer: 5′-CTCGCTTCGGCAGCACA-3′, reverse primer: 5′-AACGCTTCACGAATTTGCGT-3′.
Results
Quantitative evaluation of nucleic acids
After total RNA was extracted from both tumor and normal tissue samples, RNA purity was assessed by NanoDrop. We obtained concentrations between 49.6 and 1,312.35 ng/μL, with 260/280 ratios ranging from 1.67 to 2.05, with 77.7% of the values being over 1.8 and with an average of 1.85. The 260/230 ratios ranged from 0.31 to 2.53, with 83.3% of the values being over the theoretically expected range and having an average of 1.78 (Table 2).
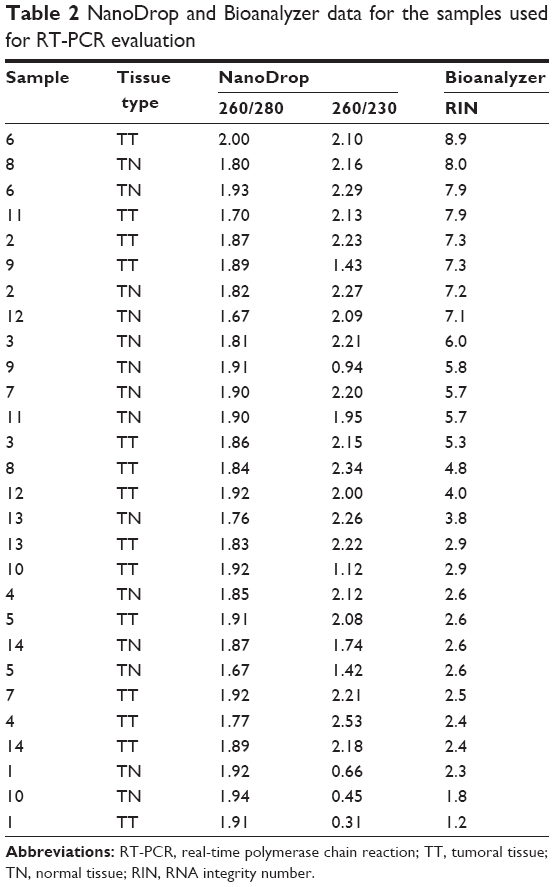 | Table 2 NanoDrop and Bioanalyzer data for the samples used for RT-PCR evaluation |
No difference between the RNA extracted from normal and tumor samples was observed. A ratio of absorbance greater than 1.8 for both 260/280 nm and 230/260 nm is accepted as an RNA purity indicator.
Qualitative assessment
The qualitative evaluation of RNA was performed by using a visual method based on RNA electrophoresis with the Agilent 2100 Bioanalyzer. The data generated by this system automatically provide the 28S/18S ratios for all the samples. The RIN values for the studied samples are presented in Table 2. In Figure 1, the electropherograms for four of the tested samples are presented, and the electropherograms of all the samples are presented in Figures S1 and S2. Eight of the analyzed samples were in the theoretically desired range for good quality samples, having a RIN value over 7.3
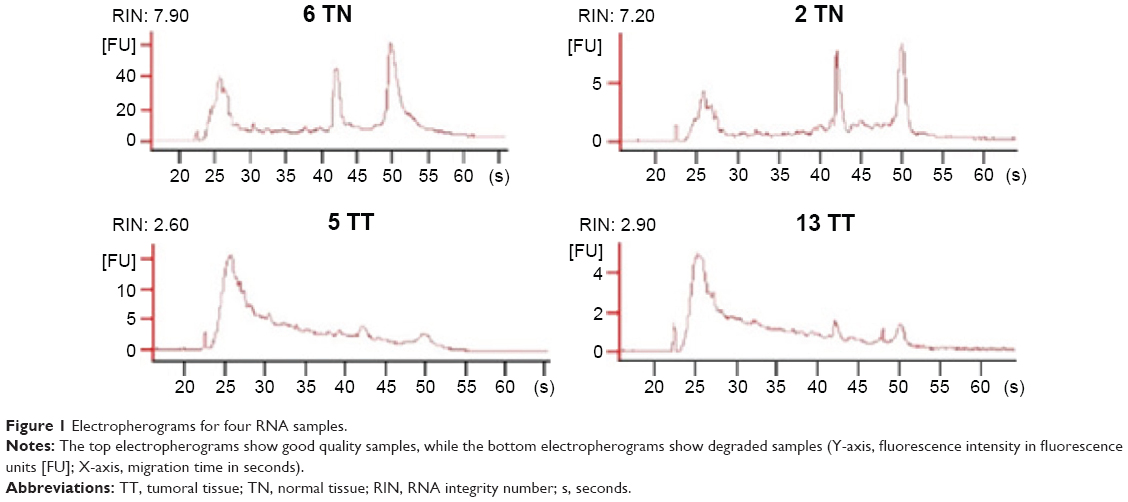 | Figure 1 Electropherograms for four RNA samples. |
Gene expression assay
cDNA synthesis was performed based on an equimolar concentration of RNA. The input cDNA was similar in all wells of the plate; therefore, the results were expected to show a standard deviation lower than 0.3 for threshold cycle (CT), which indicates the absence of PCR inhibitors.
For 18S and GAPDH, the results were lower than 0.3, but not in the case of β-actin. Two technical replicates were used for each sample in the experiment, and the mean difference between replicates was ±0.1 for 18S and GAPDH (Figure 2A and C). In the case of β-actin, the results did not meet the aforementioned criteria, as can be observed from the amplification curves in Figure 2B. All the tested genes showed measurable gene expression, and the raw CT values ranged from 14.68 to 38.05, with the mean CT values for all tested samples being 29.27 for GAPDH, 27.67 for β-actin, and 17.94 for 18S.
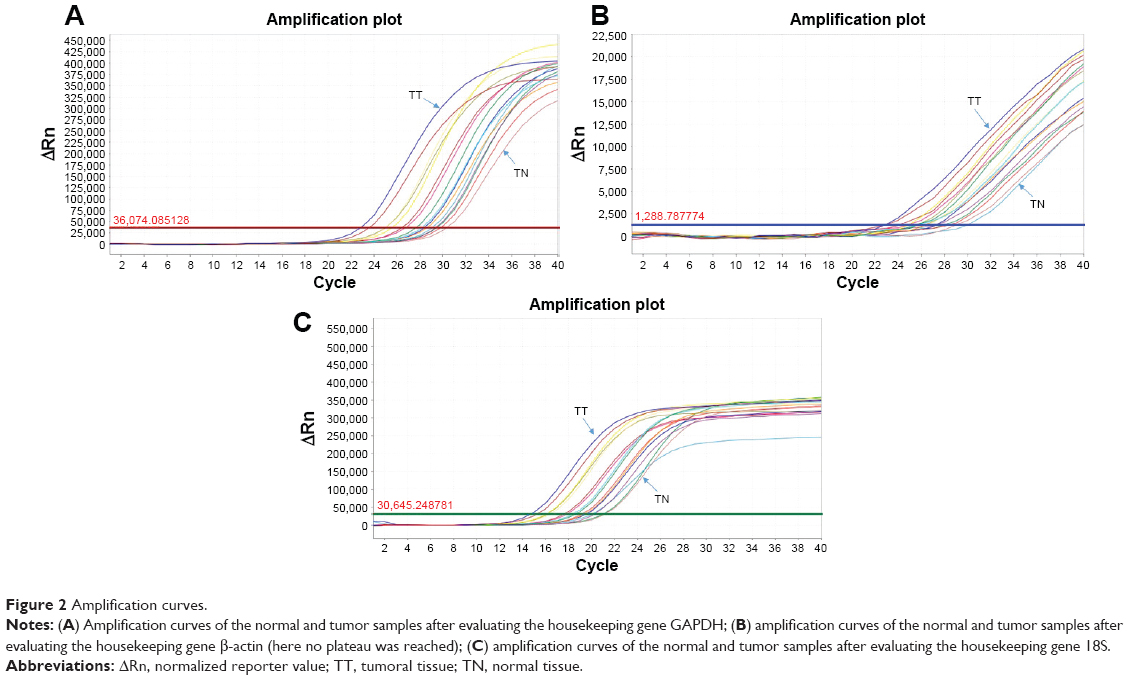 | Figure 2 Amplification curves. |
U6 evaluation pattern
U6 evaluation pattern was assessed by qRT-PCR technology in tumor and normal bladder cancer samples with different degradation ratios. The CT values ranged from 16.38 to 22.5, and the mean CT value was 19.12 (Figure 3).
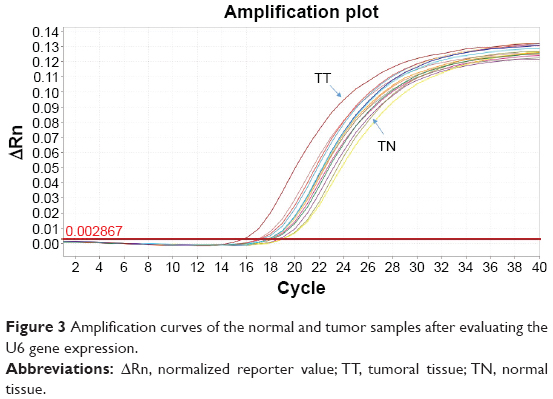 | Figure 3 Amplification curves of the normal and tumor samples after evaluating the U6 gene expression. |
Correlation between gene expression and U6, and quality control parameters
To evaluate the effect of RNA quality on the gene expression and U6 expression, different correlations were performed.
A positive correlation between the RIN and CT values was observed for all the three tested genes. In the case of GAPDH, β-actin, and 18S, a statistically significant correlation was observed when applying the Student’s t-test, with a P-value of 0.0013, 0.0001, and 0.024, respectively (Figure 4). When analyzing the correlation between the ΔCT value and the RIN, the results obtained were similar to those from the analysis of the CT values and RIN for the mRNA expression profiles.
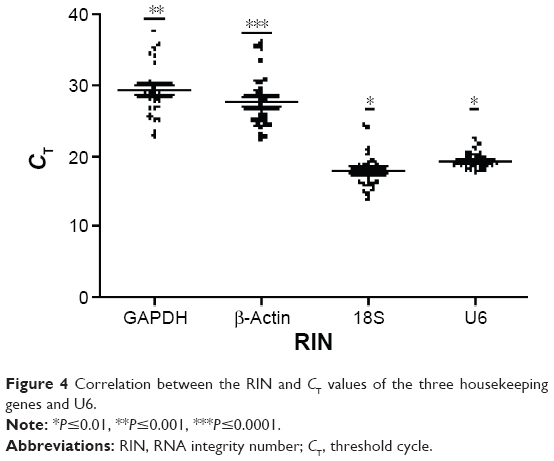 | Figure 4 Correlation between the RIN and CT values of the three housekeeping genes and U6. |
For U6, a significant negative correlation between the RIN and its CT value was observed, with a P-value of 0.0107. The correlation between U6 and the RIN is a weak correlation keeping in view the r-value (−0.457) that was obtained.
When analyzing the data according to the 260/280 and 260/230 ratios and correlating them with the CT values of the three genes tested, we observed a statistically significant correlation between the 260/230 ratio and the CT values of GAPDH with a P-value of 0.006, and no statistically significant correlation for the other tested genes (Figure 5A and B).
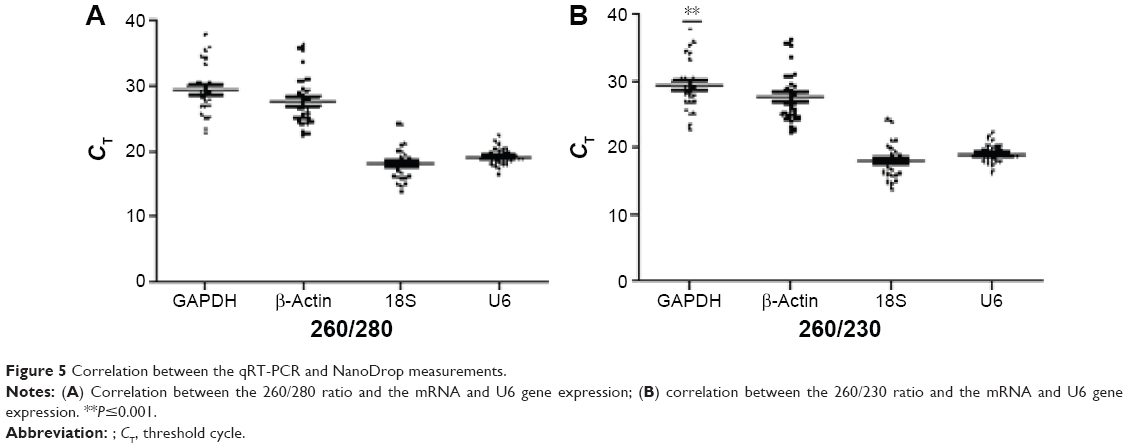 | Figure 5 Correlation between the qRT-PCR and NanoDrop measurements. |
Discussion
Several factors can influence the quality of RNA and snRNA samples from human tissue, beginning with the sampling procedure and the time between sample collection and proper tissue storage. In spite of the fact that TURBT is a surgical procedure that reduces the invasiveness of tumor resection, it significantly affects the quality of the tissue, but has the advantage of a low recurrence rate.20 This procedure is associated with a higher degree of necrosis, leading to poor RNA quality, due to RNA degradation at high temperatures. Processing of samples obtained by TURBT for genomic studies remains challenging due to the reduced tissue sample sizes21 and poor quality of these biological specimens.20 In order to protect the tissue sample from overheating, it is important to adjust the monopolar cautery to the minimum electrical tension to minimize the depth effect. Also, the cautery has to be adjusted in such a manner so as to obtain proper coagulation. It is also important to work with an electrocautery device that is able to generate constant electrical currents.22 Even though the hemostasis is not efficiently controlled after the tissue harvesting procedure, it is important to maintain a low working tension of the loop, in order to protect the specimen. After the specimen is carefully extracted, homeostasis can be achieved.23 The resection systems based on bipolar coagulation are less likely to affect the tissue sample from a thermic point of view. A simple decrease of power to 60 W or less is enough to protect the tissue specimen, making the thermic damage less than 0.5 mm.22,23
The reliability and reproducibility of genomic data are ensured by the integrity of the RNA used for the assays. Consequently, for working with biological material that has been partially degraded during the surgical procedure, supplementary testing methods were developed for the assessment of nucleic acid quality.24 A decline in the 28S/18S ribosomal RNA (rRNA) signal ratio coupled with an elevated baseline signal of the 5S, 18S, and 28S rRNA peaks is a good indicator of a progressive RNA degradation process. Being an unstable variable, the 28S/18S ratio should not be taken as an absolute measure for the evaluation of RNA integrity.3
Nowadays, RNA integrity can by evaluated through innovative methods, like the OD measurements via NanoDrop and nanochip electrophoresis used by the Agilent 2100 Bioanalyzer. The NanoDrop is a UV/vis spectrophotometer that can be used for sensitive quantification of RNA. The major advantage of this technology is the low sample volume of 1–2 μL required for the evaluation. This is essential when using valuable materials such as samples obtained from biopsy or laser dissection,25 which usually are obtained in very small quantities. Since the sample is not placed in a secondary vessel, but directly on the system’s optical sensor, it reduces a lot of variables and contaminating factors. Quantity and quality assessments using a spectrophotometer are performed at different wavelengths, and the data are expressed as ratios of the values obtained from these measurements. Therefore, the A260/280 ratio is an indicator of protein contamination and the A60/230 ratio is a guide for the presence of residual contamination with organic compounds.26
These two ratios reflect the purity of a sample without giving information regarding the integrity of the RNA sample, so a more sensitive evaluation technique is required. In our study, we used the technique designed by Agilent Technologies, which is based on nucleic acid electrophoresis followed by laser-induced fluorescence detection. Because all the events take place on a microfabricated chip, this method requires only a small amount of RNA sample. The system also offers several methods of analyzing the data that are automatically generated by the Agilent 2100 Bionalyzer software (Agilent Techologies, Santa Clara, CA, USA). One of them is the 28S/18S rRNA ratio, but it is not completely foolproof due to the fact that it relies on the calculation of area measurements on the electropherograms and is consequently dependent on the start and end points of the peaks.27 A more dependable tool is the RIN value, because the algorithm that it uses is based on multiple features.19 To ensure reproducibility of the experimental procedures and reliability of the results, it is mandatory to verify nucleic acid integrity, especially in the case of RNA.26,28
Tissue quality was also checked in pathology slides, confirming our supposition that burned tissue leads to low RNA quality, due to the surgical approach used in bladder tumors. Figure 6 presents the hematoxylin–eosin coloration images, at a 200× magnification, of two tumor samples with RIN values over 7 (Figure 6A and B), and two tumor samples with RIN values under 3 (Figure 6C and D). Figure 6A and B shows very well-preserved tissue with only 5%–10% thermal degradation, whereas Figure 6C shows large areas of mucosal ulceration with an overall small size of tissue. In Figure 6D, the large tumor fragment presents extensive thermally generated artifacts covering more than 20% of the tumor area. These are possible explanations for the low RIN values of the samples, which correlate with the low quality of the nucleic acids, especially RNA.
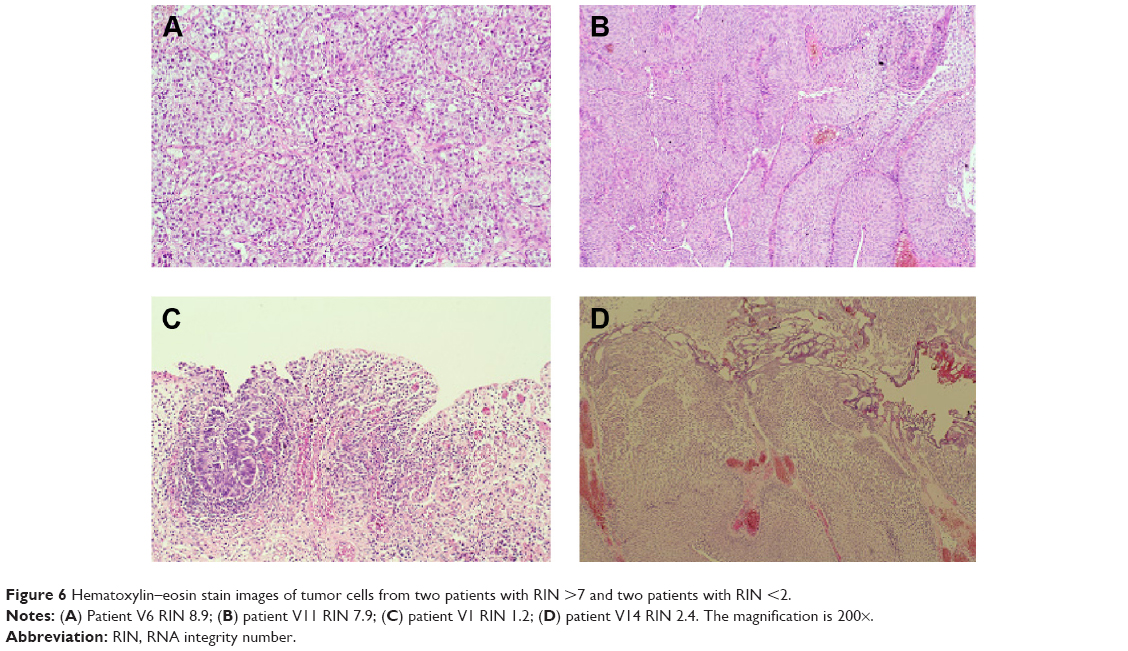 | Figure 6 Hematoxylin–eosin stain images of tumor cells from two patients with RIN >7 and two patients with RIN <2. |
In our study, there was no relevant correlation between the power used for TURBT and the integrity of RNA, which means that the RNA integrity was affected by other preanalytical factors during the surgical procedure used for resection, like the working tension that was used or the time needed for resecting the tumors. Several studies have shown no significant difference between the use of monopolar and bipolar devices for TURBT in terms of histopathological diagnosis and presence of tumor artifacts (TAs).29–31
Mashni et al observed in their study that there are fewer considerable TAs in the case of bipolar instruments than when using monopolar instruments, but in both cases, there are samples that show less TAs and that could easily be used for diagnostic proposes.32 In their study on bladder cancer repositories, Sapre et al showed that the specimens obtained by standard electrocautery presented lower RIN values than those obtained by cold cup biopsy. A cold cup biopsy is used mainly for sampling bladder tissue. This type of biopsy uses a flexible forceps provided with a cup-shaped structure that is introduced into the bladder by means of a specially designed endoscope. For the standard technique, they observed a mean RIN value of 2.8, while for the cold cup biopsy it was 9.7.33 Huang et al34 demonstrated, on normal mucosa from a human colon cancer specimen, that the majority of RNA alterations taken into account as experimentally meaningful occurred after 20 minutes of tissue ischemia.35 The tissue type, the surgical technique used, the sampling method, and the RNA extraction protocol are other factors that influence the quality and quantity of RNA and snRNAs. In our study, the TURBT used for resection and cauterization of bladder tumors appeared to have had great impact on the quality of RNA and snRNAs.24 RNA presents an intrinsic susceptibility to RNases, as well as chemical instability, as it is compromised by base- or enzyme-catalyzed hydrolysis.
The degree of integrity is important, especially for hybridization-based techniques like microarrays, where there are no amplification steps as in the case of qRT-PCR. The quality of the RNA samples influences CT values for gene expression, and in the case of snRNAs, one should take into account the overestimation of the snRNA fraction due to the degradation processes. Therefore, the evaluation of RNA quality and integrity is an eliminatory step in achieving significant data. Many endogenous and exogenous factors contribute to bad quality data, so one must be very careful and comply with all the tissue sample preservation, storage, and RNA extraction conditions and standard protocols.3 The qRT-PCR data show that the amplification results for all housekeeping genes are not directly related to sample quality. From our results, we established that the Agilent 2100 Bioanalyzer mRNA quality, which evaluates only the 18S and 28S integrity, is not directly related to the qRT-PCR amplification results. The use of partially degraded bladder tissue is sustained by other research groups like Mengual et al,36 Haller et al,37 and April et al.38
In some limited situations like the case of bladder cancer, reliable gene expression studies can be performed even when using degraded biological material, but this depends on the length of the amplicons and the proper use of normalization algorithms.39 One of the endogenous factors is the mRNA structure. It is well known that mRNA molecules rich in GC nucleotides present a shorter life, so the PCR results will depend on the primary structure of the mRNA. This is mainly affected by sample collection methods and by the fact that the tissue is cauterized during TUBR. Although the information provided by the NanoDrop and Agilent 2100 Bioanalyzer is not infallible and does not guarantee the success of downstream experiments, it still provides a good understanding of where the samples stand in terms of RNA integrity and purity, and it can give the researchers an idea about the success of subsequent experiments.
The accuracy of qRT-PCR depends on the selection of the optimal housekeeping gene, based on the most stable expression level of the gene for a particular tissue.40 All housekeeping genes should be assessed under particular experimental conditions for gene profiling to certify a stable level of expression.41
Kasahara et al observed that there is a more pronounced decrease of β-actin expression, which starts earlier, than the decrease of the 28S/18S ratio. They also noticed that there is a strong correlation between the expression of this gene and the 28S/18S ratio, while there is no correlation between the β-actin expression level and the OD260/280 ratio.16 The same reasoning can be applied to our case, where it seems that the expression levels of β-actin are more affected than those of the other housekeeping genes. This fact could be used for gene expression studies, and the CT values of β-actin can be used as a quality indicator of mRNA degradation. Timofeeva et al also demonstrated that RNA stability can vary extensively between different genes.42 To minimize the effect of preanalytical and analytical variances on qPCR performance, it is important to select the most relevant housekeeping gene for bladder cancer, with minimal variability, particularly for the case of degraded tissue.43
Viana et al showed in their study on 200 tissue samples, preserved at room temperature for 30 and 45 minutes, that the number of samples with degraded RNA doubled in the case of the samples kept at room temperature for 45 minutes compared to the other group. Also, they observed that the RNA degradation is tissue specific: thyroid and colorectal samples showed the highest degree of degradation, while lung and stomach samples presented the lowest.44 Another study on breast cancer samples showed that the use of the RIN value for the evaluation of RNA degradation is better than the 18S/28S ratio, and that degraded samples can affect the outcome of gene expression studies.45 Hatzis et al observed that RNA-later extraction buffer is better for the collection of small breast cancer biopsies that snap freeze. The RNA showed higher yield and quality, for use in gene expression and microarray assays, in the case of samples stored in RNA-later buffer.46 Another study showed that it is very difficult to find a good normalizer for the evaluation of gene expression due to the heterogeneity of tissue samples.47
Expression levels of mRNA and U6 were evaluated in order to give a better understanding of the influence of the RNA quality on the real-time PCR protocol. For mRNA, we obtained a positive correlation, and for U6, we obtained a negative correlation between the RIN and the CT values (Figure 4). Similar results were observed in earlier studies of Fleige et al24 and Becker et al.48 When comparing the slope of the correlation of RIN to CT values for mRNA and U6, we observed that the slope is lower in the case of U6 (0.987 vs 0.243), which can mean that the degradation is lower in the case of U6. This can be explained by the length of the U6 sequence. As can be observed, U6 was evaluated without problems for the degraded samples, but it should be done by using correction for data analysis, confirmed also by Jung et al in a similar study on cell lines and normal and tumor prostate tissue.49
Conclusion
Our data confirm that degraded total RNA can be used in profiling studies, especially in the case of snRNA evaluation, while taking into account the overestimation of the snRNA fraction by weighing it against the total RNA extracted from samples. The present data suggest that RNA is able to offer information regarding gene expression and snRNA evaluation using qRT-PCR, even from degraded samples. When conducting gene expression studies, it is more suitable to select a panel of genes for normalization. For gene expression studies, GAPDH and 18S proved to be more suitable normalizers than β-actin. For snRNA studies, U6 seems to be a good normalizer.
In this context, it is important to minimize the errors introduced by technical means, based on the fact that sample degradation caused by preanalytical sources related to the method of tumor resection, like TURBT, cannot be minimized. This is an example that certain approaches like qRT-PCR can tolerate partially degraded RNA, while still generating reliable data.
Acknowledgments
This work was funded by the National Plan II Program (contract no125/2012) “Intelligent systems of prediction of recurrence and progression in superficial bladder cancer based on artificial intelligence and microarray data: tumor mRNA and plasmatic microRNA-IntelUro”.
Disclosure
The authors report no conflicts of interest in this work.
References
Colombel M, Soloway M, Akaza H, et al. Epidemiology, staging, grading, and risk stratification of bladder cancer. Eur Urol Suppl. 2008;7(10):618–626. | ||
World Health Organization. EUCAN. Available from: http://eu-cancer.iarc.fr/EUCAN/Country.aspx?ISOCountryCd=968. Accessed on March 13, 2015. | ||
Fleige S, Pfaffl MW. RNA integrity and the effect on the real-time qRT-PCR performance. Mol Aspects Med. 2006;27(2–3):126–139. | ||
Sexton WJ, Wiegand LR, Correa JJ, Politis C, Dickinson SI, Kang LC. Bladder cancer: a review of non-muscle invasive disease. Cancer Control. 2010;17(4):256–268. | ||
Dobruch J, Borowka A, Herr HW. Clinical value of transurethral second resection of bladder tumor: systematic review. Urology. 2014;84(4):881–885. | ||
Raheem OA, Besharatian B, Hickey DP. Surgical management of bladder transitional cell carcinoma in a vesicular diverticulum: case report. Can Urol Assoc J. 2011;5(4):E60–E64. | ||
Balbay MD, Cimentepe E, Unsal A, Bayrak O, Koc A, Akbulut Z. The actual incidence of bladder perforation following transurethral bladder surgery. J Urol. 2005;174(6):2260–2262; discussion 2262–2263. | ||
Sarkisian AM, Bernie AM, Lee R. Principal of electrocautery-based techniques In: Chughtai B, Te AE, Kaplan SA, editors. Treatment of Benign Prostatic Hyperplasia: Modern Alternative to Transurethral Resection of the Prostate. New York: Springer Science+Business Media; 2015:3–6. | ||
Hadjiolov AA, Venkov PV, Tsanev RG. Ribonucleic acids fractionation by density-gradient centrifugation and by agar gel electrophoresis: a comparison. Anal Biochem. 1966;17(2):263–267. | ||
Sawant DV, Yao W, Wright Z, et al. Serum microRNA-21 as a biomarker for allergic inflammatory disease in children. MicroRNA. 2015;4(1):36–40. | ||
Li X, Zheng J, Chen L, Diao H, Liu Y. Predictive and prognostic roles of abnormal expression of tissue miR-125b, miR-221, and miR-222 in glioma. Mol Neurobiol. 2016;53(1):577–583. | ||
Yang JS, Li BJ, Lu HW, et al. Serum miR-152, miR-148a, miR-148b, and miR-21 as novel biomarkers in non-small cell lung cancer screening. Tumour Biol. 2015;36(4):3035–3042. | ||
Braicu C, Cojocneanu-Petric R, Chira S, et al. Clinical and pathological implications of miRNA in bladder cancer. Int J Nanomed. 2015;10:791–800. | ||
Vermeulen J, De Preter K, Lefever S, et al. Measurable impact of RNA quality on gene expression results from quantitative PCR. Nucleic Acids Res. 2011;39(9):e63. | ||
Perez-Novo CA, Claeys C, Speleman F, Van Cauwenberge P, Bachert C, Vandesompele J. Impact of RNA quality on reference gene expression stability. BioTechniques. 2005;39(1):52, 54, 56. | ||
Kasahara T, Miyazaki T, Nitta H, et al. Evaluation of methods for duration of preservation of RNA quality in rat liver used for transcriptome analysis. J Toxicol Sci. 2006;31(5):509–519. | ||
Weber DG, Casjens S, Rozynek P, et al. Assessment of mRNA and microRNA stabilization in peripheral human blood for multicenter studies and biobanks. Biomark Insights. 2010;5:95–102. | ||
Molecular Research Center [updated July 17, 2012]. Available from: http://mrcgene.com/wp-content/uploads/2014/06/TRIMay2014.pdf. Accessed on January 10, 2016. | ||
Schroeder A, Mueller O, Stocker S, et al. The RIN: an RNA integrity number for assigning integrity values to RNA measurements. BMC Mol Biol. 2006;7:3. | ||
Seisen T, Roupret M. Résection endoscopique des tumeurs de vessie n’infiltrant pas la musculeuse avec Hexvix® [Transurethral bladder resection of non muscle invasive bladder cancer with Hexvix (R)]. Prog Urol. 2013;23(14):1177–1180. French. | ||
Seisen T, Comperat E, Leon P, Roupret M. Impact of histological variants on the outcomes of nonmuscle invasive bladder cancer after transurethral resection. Curr Opin Urol. 2014;24(5):524–531. | ||
Gupta NP, Saini AK, Dogra PN, Seth A, Kumar R. Bipolar energy for transurethral resection of bladder tumours at low-power settings: initial experience. BJU Int. 2011;108(4):553–556. | ||
Venkatramani V, Panda A, Manojkumar R, Kekre NS. Monopolar versus bipolar transurethral resection of bladder tumors: a single center, parallel arm, randomized, controlled trial. J Urol. 2014;191(6):1703–1707. | ||
Fleige S, Walf V, Huch S, Prgomet C, Sehm J, Pfaffl MW. Comparison of relative mRNA quantification models and the impact of RNA integrity in quantitative real-time RT-PCR. Biotechnol Lett. 2006;28(19):1601–1613. | ||
Manchester KL. Use of UV methods for measurement of protein and nucleic acid concentrations. BioTechniques. 1996;20(6):968–970. | ||
Imbeaud S, Graudens E, Boulanger V, et al. Towards standardization of RNA quality assessment using user-independent classifiers of microcapillary electrophoresis traces. Nucleic Acids Res. 2005;33(6):e56. | ||
Auer H, Lyianarachchi S, Newsom D, Klisovic MI, Marcucci G, Kornacker K. Chipping away at the chip bias: RNA degradation in microarray analysis. Nat Genet. 2003;35(4):292–293. | ||
Mueller O, Lightfoot S, Schroeder A. RNA integrity number (RIN) – standardization of RNA quality control: Agilent Application Note; 2004. Available from: http://www.chem.agilent.com/Library/applications/5989-1165EN.pdf. Accessed on March 14, 2015. | ||
Wang DS, Bird VG, Leonard VY, et al. Use of bipolar energy for transurethral resection of bladder tumors: pathologic considerations. J Endourol. 2004;18(6):578–582. | ||
Lagerveld BW, Koot RA, Smits GA. Thermal artifacts in bladder tumors following loop endoresection: electrovaporization v electrocauterization. J Endourol. 2004;18(6):583–586. | ||
Yang SJ, Song PH, Kim HT. Comparison of deep biopsy tissue damage from transurethral resection of bladder tumors between bipolar and monopolar devices. Korean J Urol. 2011;52(6):379–383. | ||
Mashni J, Godoy G, Haarer C, et al. Prospective evaluation of plasma kinetic bipolar resection of bladder cancer: comparison to monopolar resection and pathologic findings. Int Urol Nephrol. 2014;46(9):1699–1705. | ||
Sapre N, Hong MK, Huang JG, et al. Bladder cancer biorepositories in the “-omics” era: integrating quality tissue specimens with comprehensive clinical annotation. Biopreserv Biobank. 2013;11(3):166–172. | ||
Huang J, Qi R, Quackenbush J, Dauway E, Lazaridis E, Yeatman T. Effects of ischemia on gene expression. J Surg Res. 2001;99(2):222–227. | ||
Copois V, Bibeau F, Bascoul-Mollevi C, et al. Impact of RNA degradation on gene expression profiles: assessment of different methods to reliably determine RNA quality. J Biotechnol. 2007;127(4):549–559. | ||
Mengual L, Burset M, Ars E, et al. Partially degraded RNA from bladder washing is a suitable sample for studying gene expression profiles in bladder cancer. Eur Urol. 2006;50(6):1347–1355; discussion1355–1346. | ||
Haller AC, Kanakapalli D, Walter R, Alhasan S, Eliason JF, Everson RB. Transcriptional profiling of degraded RNA in cryopreserved and fixed tissue samples obtained at autopsy. BMC Clin Pathol. 2006;6:9. | ||
April C, Klotzle B, Royce T, et al. Whole-genome gene expression profiling of formalin-fixed, paraffin-embedded tissue samples. PLoS One. 2009;4(12):e8162. | ||
Antonov J, Goldstein DR, Oberli A, et al. Reliable gene expression measurements from degraded RNA by quantitative real-time PCR depend on short amplicons and a proper normalization. Lab Invest. 2005;85(8):1040–1050. | ||
Guenin S, Mauriat M, Pelloux J, Van Wuytswinkel O, Bellini C, Gutierrez L. Normalization of qRT-PCR data: the necessity of adopting a systematic, experimental conditions-specific, validation of references. J Exp Bot. 2009;60(2):487–493. | ||
Pfaffl MW, Tichopad A, Prgomet C, Neuvians TP. Determination of stable housekeeping genes, differentially regulated target genes and sample integrity: BestKeeper – Excel-based tool using pair-wise correlations. Biotechnol Lett. 2004;26(6):509–515. | ||
Timofeeva AV, Skrypina NA, Savochkina LP, Beabealashvilli R. Size distribution of the urokinase mRNA decay intermediates in different tissues and cell lines. Biochim Biophys Acta. 2000;1517(1):33–45. | ||
Lars Radke CG, Lubitz A, Hinderlich S, Sandig G, Hummel M, Frohme M. Reference gene stability in peripheral blood mononuclear cells determined by qPCR and NanoString. Microchim Acta. 2014;181(13–14):1733–1742. | ||
Viana CR, Neto CS, Kerr LM, et al. The interference of cold ischemia time in the quality of total RNA from frozen tumor samples. Cell Tissue Bank. 2013;14(2):167–173. | ||
Strand C, Enell J, Hedenfalk I, Ferno M. RNA quality in frozen breast cancer samples and the influence on gene expression analysis – a comparison of three evaluation methods using microcapillary electrophoresis traces. BMC Mol Biol. 2007;8:38. | ||
Hatzis C, Sun H, Yao H, et al. Effects of tissue handling on RNA integrity and microarray measurements from resected breast cancers. J Natl Cancer Inst. 2011;103(24):1871–1883. | ||
de Kok JB, Roelofs RW, Giesendorf BA, et al. Normalization of gene expression measurements in tumor tissues: comparison of 13 endogenous control genes. Lab Invest. 2005;85(1):154–159. | ||
Becker C, Hammerle-Fickinger A, Riedmaier I, Pfaffl MW. mRNA and microRNA quality control for RT-qPCR analysis. Methods. 2010;50(4):237–243. | ||
Jung M, Schaefer A, Steiner I, et al. Robust microRNA stability in degraded RNA preparations from human tissue and cell samples. Clin Chem. 2010;56(6):998–1006. |
Supplementary materials
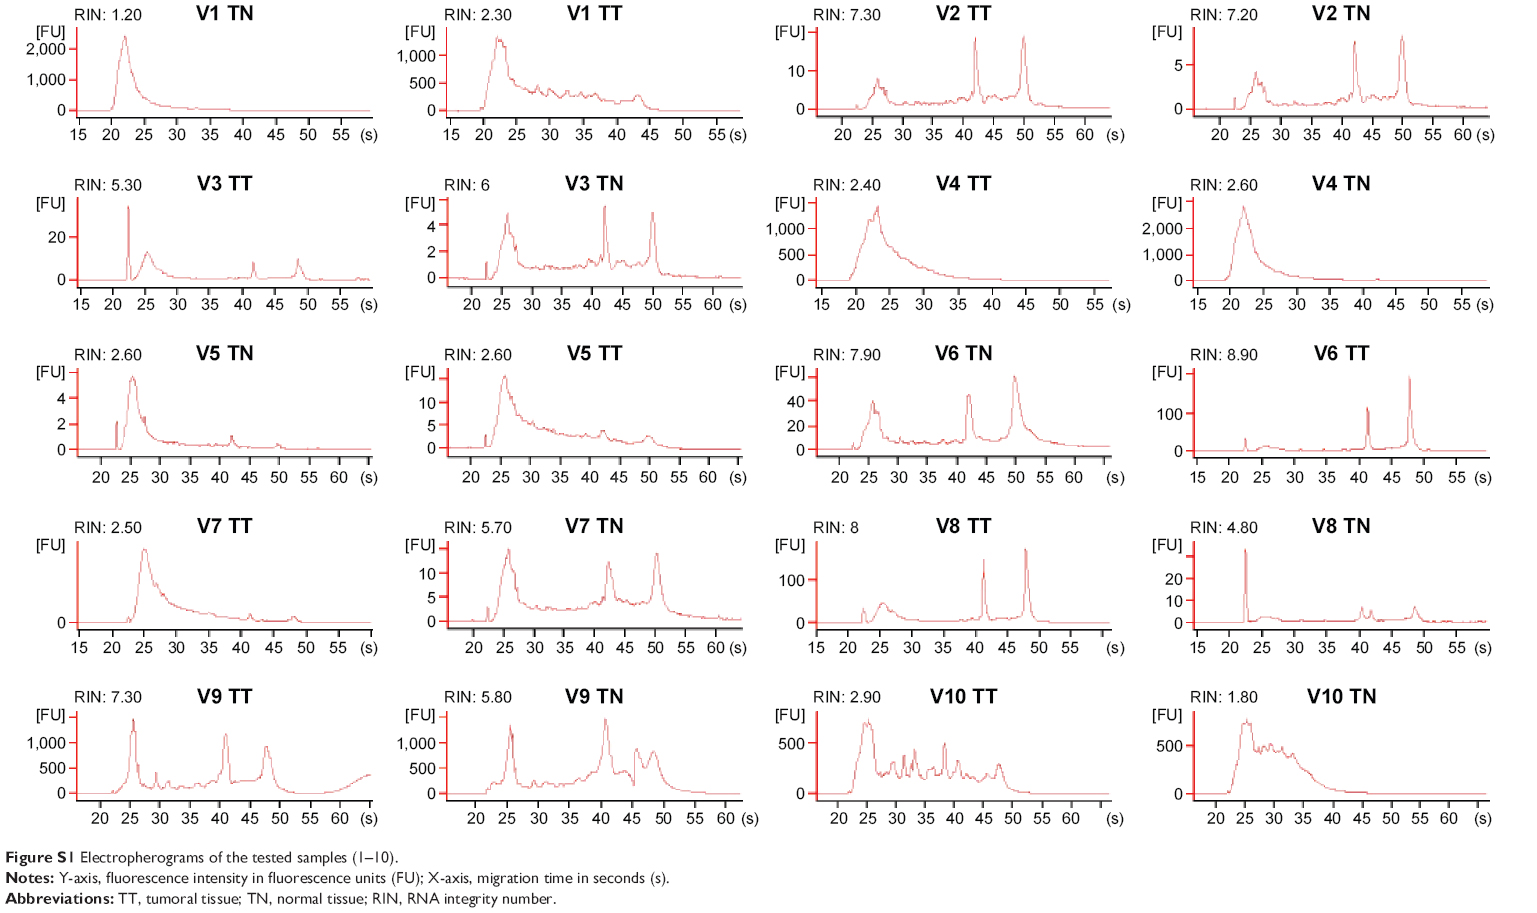 | Figure S1 Electropherograms of the tested samples (1–10). |
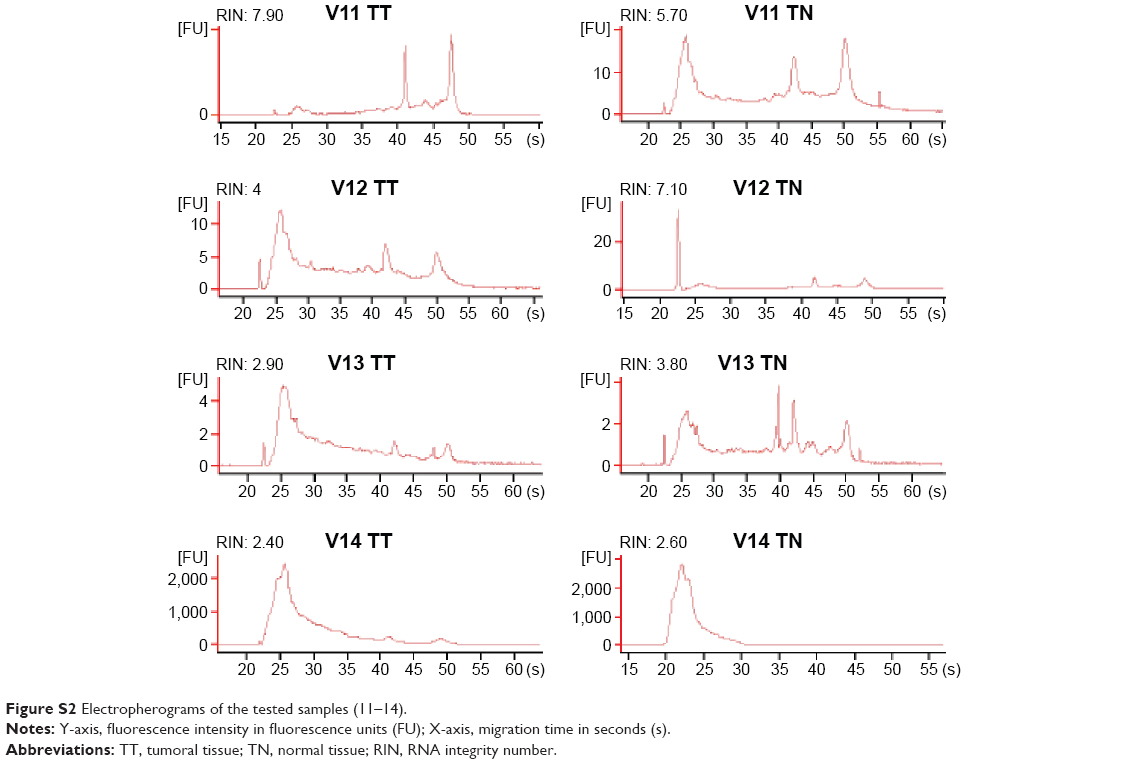 | Figure S2 Electropherograms of the tested samples (11–14). |
 © 2016 The Author(s). This work is published and licensed by Dove Medical Press Limited. The
full terms of this license are available at https://www.dovepress.com/terms
and incorporate the Creative Commons Attribution
- Non Commercial (unported, 3.0) License.
By accessing the work you hereby accept the Terms. Non-commercial uses of the work are permitted
without any further permission from Dove Medical Press Limited, provided the work is properly
attributed. For permission for commercial use of this work, please see paragraphs 4.2 and 5 of our Terms.
© 2016 The Author(s). This work is published and licensed by Dove Medical Press Limited. The
full terms of this license are available at https://www.dovepress.com/terms
and incorporate the Creative Commons Attribution
- Non Commercial (unported, 3.0) License.
By accessing the work you hereby accept the Terms. Non-commercial uses of the work are permitted
without any further permission from Dove Medical Press Limited, provided the work is properly
attributed. For permission for commercial use of this work, please see paragraphs 4.2 and 5 of our Terms.