Back to Journals » Clinical Epidemiology » Volume 12
Nonparametric Assessment of Differences Between Competing Risk Hazard Ratios: Application to Racial Differences in Pediatric Chronic Kidney Disease Progression
Authors Ng DK, Antiporta DA ![]() , Matheson MB, Muñoz A
, Matheson MB, Muñoz A ![]()
Received 2 August 2019
Accepted for publication 18 December 2019
Published 20 January 2020 Volume 2020:12 Pages 83—93
DOI https://doi.org/10.2147/CLEP.S225763
Checked for plagiarism Yes
Review by Single anonymous peer review
Peer reviewer comments 4
Editor who approved publication: Professor Henrik Toft Sørensen
Derek K Ng, Daniel A Antiporta, Matthew B Matheson, Alvaro Muñoz
Department of Epidemiology, Johns Hopkins Bloomberg School of Public Health, Baltimore, MD, USA
Correspondence: Alvaro Muñoz
Department of Epidemiology, Johns Hopkins Bloomberg School of Public Health, 615 Wolfe Street Room E7648, Baltimore, MD 21205, USA
Tel +1 410-955-2792
Email [email protected]
Abstract: Associations between an exposure and multiple competing events are typically described by cause-specific hazard ratios (csHR) or subdistribution hazard ratios (sHR). However, diagnostic tools to assess differences between them have not been described. Under the proportionality assumption for both, it can be shown mathematically that the sHR and csHR must be equal, so reporting different time-constant sHR and csHR implies non-proportionality for at least one. We propose a simple, intuitive approach using the ratio of sHR/csHR to nonparametrically compare these metrics. In general, for the non-null case, there must be at least one event type for which the sHR and csHR differ, and the proposed diagnostic will be useful to identify these cases. Furthermore, once standard methods are used to estimate the csHR, multiplying it with our nonparametric estimate for the sHR/csHR ratio will yield estimates of sHR which fulfill intrinsic linkages of the subhazards that separate analysis may violate. In addition, for non-null cases, at least one must be time dependent (i.e., non-proportional), and thus our tool serves as an indirect test of the proportionality assumption. We applied this proposed diagnostic tool to data from a cohort of children with congenital kidney disease to describe racial differences in the time to first dialysis or first transplant and extend methods to include adjustment for socioeconomic factors.
Keywords: survival analysis, nonparametric methods, competing risk analysis, cause-specific hazard ratios, sub-distribution hazard ratios, chronic kidney disease
Introduction
Recent advances in epidemiologic and biostatistical methods have made available multiple tools to describe differences in times to outcomes related to an exposure in the context of competing risks.1–9 The two most common approaches are based on semiparametric methods for the cause-specific hazard ratios (csHR) using a Cox proportional hazard model, in which those who experience other events are treated as censored for the event of interest;10 and subhazard ratios (often referred to as sub-distribution hazard ratios; sHR) using the Fine and Gray model, in which those who experience other events are treated as immune (i.e., “cured” and remaining in the risk sets) to the event of interest.11 Although some authors have questioned the usefulness of the subhazards claiming this metric conditions on having reached an absorbing state,12 it is not problematic if occurrence of a given event is conceptualized as conferring “cure” (i.e., immunity) for the other events. In doing so, these individuals with immunity should be appropriately kept in the risk set (consistent with the classical cure model), even though they will never experience the event of interest, and thus provide the basis for properly estimating the “cured” proportions. More importantly, the accumulation of the subhazards directly reproduces the cumulative incidences of each event type.
Semiparametric approaches are accessible in standard statistical software packages, can be easily implemented, have been extended in several directions7,13–15 and are frequently presented in biostatistical and epidemiologic literature.8 Some authors have recommended that csHR is for “etiological” research and sHR for “prediction”;5,6,16–18 and others have recommended conducting analyses using both approaches (i.e., both sHR and csHR) and presenting results from each analysis side-by-side for comparison.19 Most recently, Poythress et al20 correctly posed the question, “Under what conditions is the estimated sHR in the Fine and Gray model substantially different than the estimated csHR for the event of interest in the CSH model?” but their analysis focused on the setting of proportional hazards and did not distinguish between model misspecification and differences between the two hazard ratios. We propose a nonparametric diagnostic tool that is free of proportionality assumptions to give insight into differences between the sHR and csHR, and whether these discrepancies are reflected by the data.
The presentation of both sHR and csHR provides the opportunity to evaluate consistency between the two methods and is a useful way to describe risk by displaying both metrics separately.21,22 Close linkages, or tethering, of sHR and csHR ratios have been described.23,24 In particular, regardless of the number of competing events, if the sHR and csHR are constant (i.e., hazards are proportional) for a given event type, the two will be equal (i.e., sHR/csHR = 1). Conversely, if the sHR differs from the csHR, at least one of them must be time dependent. Therefore, if one identifies a case for which the sHR differs from the csHR, it follows that assuming both to be proportional is inappropriate. Although there are several approaches to assess violations of proportionality assumptions, a secondary property of our proposed method is to provide an indirect test for proportionality of hazards. In general, proportionality is unlikely in the setting of competing risks: we have specifically shown that in the case of two competing events, at most, two of the four sHR and csHR estimates can be proportional.24
In longitudinal studies, epidemiologists frequently investigate competing events in both non-causal21,22,25,26 and causal settings.27 Here, we present a general theory comparing the sHR and csHR and how these estimators can be different, which is consistent with, but not restricted to, different estimand choices for causal inference. We propose and describe nonparametric estimates of the ratio of sHR to csHR, corresponding 95% confidence intervals, and present an applied non-causal example that updates a description of racial differences in time to competing renal replacement therapy events in a pediatric population with chronic kidney disease (CKD).28 In the analysis presented here, we provide a comprehensive characterization and comparison of sHRs and csHRs for first dialysis and first transplant and demonstrate that this can be accomplished nonparametrically, with adjustment for multiple variables using inverse probability of exposure weights. We further demonstrate how our method leads to the calculation of an alternative estimate of the sHR, the product of the semiparametric csHR estimates and the nonparametric sHR/csHR ratio estimates, which does not violate any tethering constraints nor assume proportionality.
Materials and Methods
Ratio of Subhazard Ratio and Cause-Specific Hazard Ratio as a Diagnostic Tool
In the setting of any number  of competing events and a binary exposure variable, let
  denote the cumulative incidence of event
  at time
  among the unexposed and
  the corresponding cumulative incidence for the exposed group where
  . For the unexposed group, the subhazard
  for event
  , whose accumulation (i.e., integral) determines
  , is defined as
  where
where  is the derivative (i.e., rate of increase) of
  . Likewise, the cause-specific hazard
  for event
  is defined as
  where
where  is the sum of all the cumulative incidences (i.e.,
  ) and corresponds to the cumulative incidence of the composite event.
  represents the incidence of type
  events among the event-free individuals, though its accumulation is not directly linked to the event-specific cumulative incidence as it depends on all of the cumulative incidences; in contrast, the accumulation of
  reproduces
  directly. The subhazard and cause-specific hazard functions for the exposed group are similarly defined and denoted by
  and
and  , respectively. For a two-sample problem, the sHR for event
  is defined as:
Likewise, the corresponding csHR for event  is defined as:
It follows that, as  goes to 0,
 . Hence, were
  and
and  to be constant (i.e., proportional hazards), they must be equal to each other at all time points since they are equal at time zero.24 Thus, exploring differences between the sHR and csHR under classical proportionality assumptions is futile, as they cannot be different.
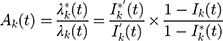
An important feature for the comparison of (1) to
to  is the fact that their dependencies on the derivatives (i.e., rates of change) of the cumulative incidences are the same (i.e.,
  . Therefore, the ratio of the sHR to the csHR for event
  is
is
where  is the composite of all events except
  . Thus, the comparison of
  to
to  for all
  can be accomplished by fully nonparametric methods as they depend only on nonparametric estimates of the cumulative incidence functions. It should be noted that Equation (1) can be expressed in terms of Pepe and Mori’s conditional probability of a competing event:
  .29 Hence,
  .
.
In the general case of  competing events, the ratios of the cause-specific hazard to the subhazard (
 fully determine the cumulative incidences as
In other words, this shows that the ratios  for
for  fully determine the competing risk process similar to how either the
  or the
  functions by themselves do. Furthermore, since equality of the sHR (=
  ) to the csHR (=
  ) for all event types implies
 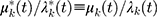 for all
  , it follows from the above equation that
  for all
  (i.e., the full null hypothesis of no effect of exposure whatsoever). Hence, from the converse, if an exposure has an effect on at least one event type (i.e., not the full null hypothesis), there will be at least one event type for which the csHR will be different from the sHR. In most applications, the likely scenario is that the csHR is different than the sHR for all competing events. Our proposed diagnostic tool will be useful to identify those instances.
For the particular case of  (i.e., the most common case of two competing events), if the sHR is equal to the csHR for a particular event, and their common value is not the null case of 1, then for the other event, the sHR must be different from the csHR and at least one of the two has to be time dependent (i.e., non-proportional).
We and others have shown that there are strong tethering (links) between sHRs so that separate analyses can yield inadmissible results.23 Since the csHRs are not subject to such tethering, one can use standard methods to estimate csHRs ( which can then be multiplied by our proposed nonparametric estimates of
  to yield estimates of the sHRs (
 that will fulfill the intrinsic tethering (links) of all hazard functions in the setting of competing risks. To our knowledge, this approach is the first one using semiparametric methods to accomplish appropriate reporting of all types of hazard ratios as has been recommended and claimed as good practice.19
Application
Study Population
The study population for our application comprised children enrolled in the Chronic Kidney Disease in Children (CKiD) study with a diagnosis of nonglomerular kidney disease. CKiD is a longitudinal observational cohort initiated in 2003 that enrolled children between the ages of 1 and 16 with diagnosed kidney disease and glomerular filtration rate (GFR) <90 mL/min|1.73m2. Data were collected annually until the initiation of renal replacement therapy (RRT), defined as dialysis or kidney transplantation, with information obtained from medical records and/or patient report. Details of the study and diagnoses have been previously described.30–32 All participants/families provided informed consent/assent and the study protocols were approved by the Institutional Review Boards of each participating site (see Supplementary material).
Exposure and Outcome
The exposure was self or parental reported race categorized as African American (AA; “AA race” or “mixed race including AA”) and non-African American (non-AA). The outcome was the time from the onset of nonglomerular kidney disease to initiation of RRT. The two competing events were dialysis and transplantation. Death was not treated as a competing event since there were no observed deaths prior to dialysis or transplant in our study population. Since children enrolled in CKiD at heterogeneous durations of disease and using a timescale of years since CKD onset was epidemiologically meaningful, we incorporated late entries to avoid survival biases and appropriately account for event-free, but unobserved person-time. As only a small number of children were recruited with less than 2 years of duration, all analyses were anchored at 2 years from CKD onset.
Covariates
Since lower socioeconomic status (SES) is associated with AA race, adjustment for SES factors was critical and demonstrated the inclusion of weighting methods for adjusted nonparametric descriptions of the cumulative incidences, as well as for our diagnostic tool. As previously described,28 inverse probability of exposure weights (IPWs; scaled to the marginal proportion within each group) were constructed based on annual household income (categorized as <$30,000, $30,000 to $75,000, and >$75,000), abnormal birth history (defined as low birth weight, small for gestational age, or premature birth), food assistance in the past year, household having any public insurance, maternal education less than college, participant visiting a private doctor in the past year and male sex.
Statistical Methods
Our first analysis used nonparametric estimates of the cumulative incidences to determine  using Equation (1). The cumulative incidence for a competing event of interest is easily obtained by first calculating the standard Kaplan–Meier of the composite event and then accumulating the jumps of the Kaplan–Meier at the times when the event of interest occurs. These may be obtained in standard statistical software programs, such as the etmCIF package in R or the stcompet command in Stata. In addition, IPWs may be employed to adjust for multiple covariates and enable graphical nonparametric presentations of adjusted Kaplan–Meier functions, and adjusted
  in which the contribution of each individual is not equal, but corresponds to their inverse probability weight.
Classical Cox regression models estimated the csHRs and the Fine and Gray11 method estimated sHRs of dialysis and transplant (comparing AA to non-AA) using the stcox and stcrreg commands in Stata, both of which incorporate late entry information. For these models, the logarithms of the hazard ratios were modeled to vary (linearly) over time by the exposure, thus allowing for non-proportionality. Specifically, the subhazard ratios  were modeled as
  and the cause-specific hazard ratios
  were modeled as
  separately for each event
  . The ratio of these semiparametric hazard ratios for each event (i.e.,
  to estimate
  , defined above) was used to compare and contrast to the proposed fully nonparametric method. Bootstrap methods were used to calculate percentile-based 95% confidence intervals for the nonparametric estimator.
As an alternative to separately modeling the subhazard ratios as  which may not fulfill the tethering (links) between all hazard types, one may instead use our proposed nonparametric estimate for
  and derive the estimate of
  as
as  which will fulfill all links between the types of hazard ratios. Consistent with statistical modeling principles, these estimates of
  depend on correct specification of
  as a model for
  . Bootstrap methods can equally be applied to obtain 95% confidence intervals for the refined estimator of
  Furthermore, congruence between
  and
and 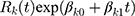 will provide support for the adequacy of the simpler
 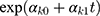 as an appropriate estimate of
Lastly, to account for potential confounding by SES, we have previously described28 the application of IPWs for adjusted nonparametric calculations of a) the competing events cumulative incidences and b) the diagnostic comparison of the ratio of sHR to csHR (denoted as  ). Bootstrap methods were employed to obtain valid 95% confidence intervals for nonparametric estimates that were adjusted for covariates. Resampling with replacement was stratified by race with new IPWs generated for each bootstrap sample.
All analyses were conducted in Stata 14 and R 3.5.0 software, with a customized R package (hrcomprisk) developed for unadjusted and adjusted nonparametric estimation of  and
and  , respectively.
Results
Table 1 presents descriptive statistics of 626 children with nonglomerular kidney disease. Of these children, 80% (504) were non-AA. Consistent with congenital and early age disease, both racial groups comprised more than 90% participants with disease onset within 1 year of age, and all were enrolled with mild to moderate CKD (median eGFR= 49 and 57 mL/min|1.73 m2, respectively). The median follow-up time was about 5 years for both groups. Since RRT was an exclusion criterion at enrollment, late entries accounting for heterogeneous duration of CKD at enrollment were incorporated to estimate times to RRT and the timescale was anchored at 2 years from CKD onset.
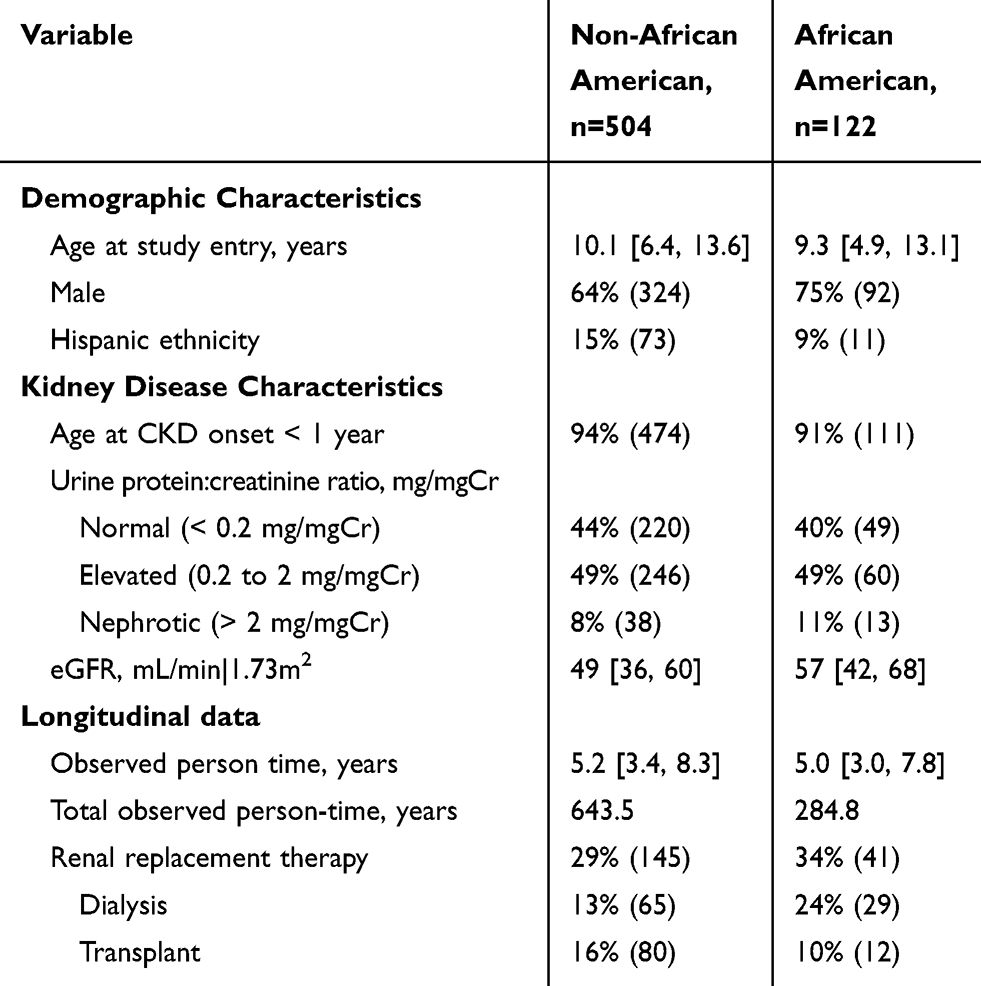 |
Table 1 Descriptive Statistics of Baseline Demographic and Clinical Characteristics and Longitudinal Data Contributed by Children Enrolled in CKiD with a Nonglomerular CKD Diagnosis, Stratified by Race. Median [Interquartile Range] and % (n) |
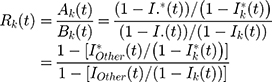
Figure 1A presents the unadjusted cumulative incidence of the RRT composite event by race. AA children received RRT earlier than non-AA children: the 10th, 25th and median times to RRT for AA children were 6.6, 12.6 and 16.2 years, respectively. In contrast, these times for non-AA children were 8.7, 13.1 and 19.0 years, respectively.
 |
Figure 1 Extended nonparametric (solid) cumulative incidence functions of composite RRT (A) and first occurrence of dialysis (grey) or transplant (black) as competing events (B), by African-American (bold), and non-African-American (unbolded) participants with a pediatric diagnosis of kidney disease. |
Figure 1B describes the unadjusted cumulative incidences of the competing events of dialysis (bottom to top with scale in the left vertical axis) and transplant (top to bottom with scale in the right vertical axis) and demonstrate earlier dialysis times for AA children compared to non-AA children. In contrast, transplant occurred at earlier times for non-AA children, particularly 10 years after kidney disease onset. These nonparametric incidence functions presented can be used to estimate  (using Equation (1)) to diagnose differences between sHR and csHR and contrast them with semiparametric estimates of sHR/csHR.
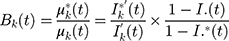
Figure 2 presents the results from classical separate semiparametric subhazard and cause-specific hazard models with linear time-varying (i.e., non-proportional) effects, to compare the risk of dialysis (Panel A) and of transplant (Panel B) by race. For dialysis, the sHR ( ) and csHR (
 ) were very similar: AAs had an approximately 4 times higher hazard than non-AAs at 2 years, and this decreased over time to 3/2 by 20 years. For transplant, the sHR (
 ) was less than 1 indicating that AAs were less likely to receive transplant and the sHR decreased (away from the null) over time. In contrast to the time-varying sHR, the csHR (
 ) did not vary substantially by time (csHR: ~3/4).
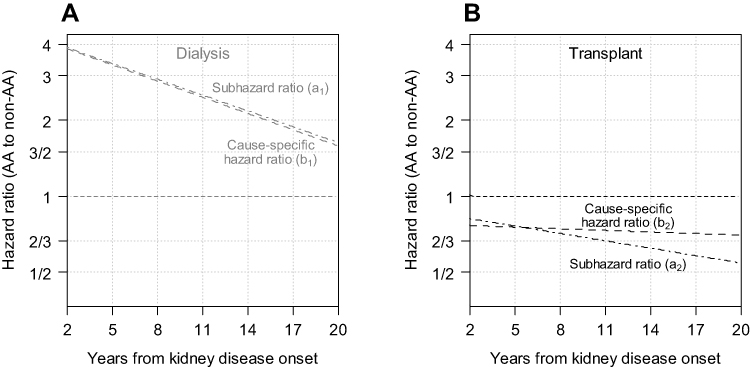 |
Figure 2 Results from cause-specific hazard (i.e., Cox regression) and subhazard (i.e., Fine and Gray regression) models with first dialysis (A) and first transplant (B) as competing events presenting the time-varying hazard ratios comparing African-American to non-African-American participants with a pediatric onset of kidney disease. |
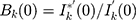
Figure 3 presents the estimates of the sHR to csHR ratios for dialysis (Panel A, grey;  ) and transplant (Panel B, black;
  ). The nonparametric estimate was derived from the nonparametric incidence functions alone (in Figure 1B) using Equation (1) and is depicted as a bold solid step function, with corresponding 95% bootstrapped confidence intervals. The semiparametric estimator is depicted as a line with long dashes and was derived from the results from Figure 2. For dialysis, the sHR and csHR were very similar with only minor deviations from 1, and the nonparametric 95% confidence interval contained 1. In contrast, for transplant, the sHR was lower than the csHR over time with significant departures at about 14 years based on the nonparametric estimator. The semiparametric estimator was contained within the 95% nonparametric bootstrapped confidence intervals, but overestimated the ratio of sHR to csHR after 14 years. Another limitation of the classical semiparametric approach is that by conducting two analyses separately (i.e., estimating csHR and sHR separately), the two estimators did not agree at time 0 (corresponding to 2 years for the timescale of the analysis) which is a violation of the theoretical property described in the Methods section.
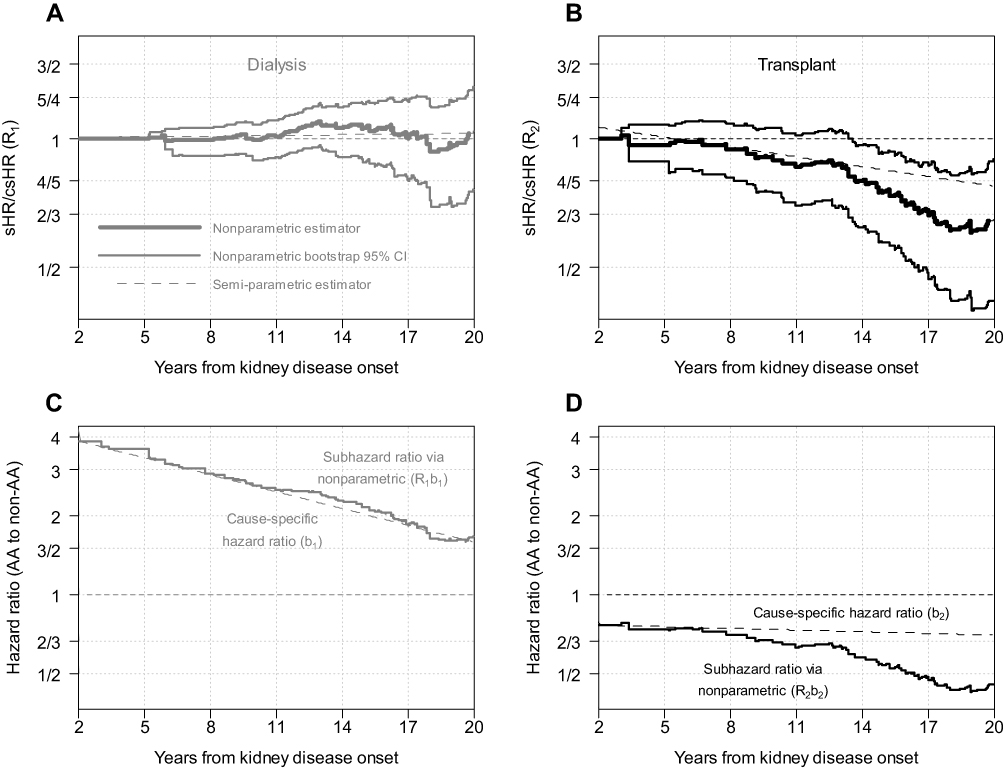 |
Figure 3 (A and B) Ratios of subhazard ratio to cause-specific hazard ratio for dialysis and transplant, respectively. (C and D) Subhazard ratios via nonparametric and classical semiparametric cause-specific hazard ratios for dialysis and transplant, respectively. For (A and B), solid lines depict the nonparametric estimator with bootstrapped 95% confidence intervals and dashed lines depict the semiparametric estimator based on the models presented in Figure 2. |
To avoid violating theoretical properties and to fulfill intrinsic tethering of the subhazard ratios, the step functions in the bottom panels of Figure 3 depict estimates of the subhazard ratios resulting by multiplying the cause-specific hazard ratios in Figure 2 and the nonparametric estimates of  provided in the top two panels of Figure 3. Although for the case of transplant, the refined estimate of the sHR is below the one provided in Figure 2, the primary inference is preserved, providing justification for the Fine and Gray linear model to be reasonably appropriate.
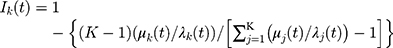
Figure 4A presents the adjusted nonparametric estimates for the cumulative incidences of dialysis and transplant, by race, controlling for SES variables. With adjustment, earlier times to dialysis and later times to transplant for AA participants compared to non-AA participants were observed, but the differences were substantially reduced compared to Figure 1B. Figure 4B and C display the weighted nonparametric estimates and 95% bootstrap confidence intervals of the adjusted sHR/csHR (i.e.,  ). For both dialysis and transplant, the confidence intervals for this adjusted metric contain 1 at practically all time points, indicating that race was consistent with a null exposure after adjustment for SES. This inference was confirmed by the weighted semiparametric models, each of which showed no association with race after accounting for SES. This was consistent with the theoretical principles described in the Methods in which equality of hazard ratios for all events can only occur in the presence of a null exposure.
 |
Figure 4 Adjusted nonparametric competing risk analyses based on inverse probability weights controlling for socioeconomic status variables associated with race. (A) presents the extended nonparametric (solid) cumulative incidence functions of first occurrence of dialysis (grey) or transplant (black) as competing events by race. Adjusted nonparametric ratios of subhazard ratio to cause-specific hazard ratio for dialysis (grey, B) and transplant (black, C) with adjusted bootstrapped 95% confidence intervals. |
Discussion
Previous studies recommended presenting both sHR and csHR to comprehensively describe risks in the context of competing risk events,19,22 and others have described the intrinsic tethering of the two measures of association.23,24 Here, we propose a diagnostic tool that not only characterizes how the two metrics differ using the nonparametric incidence functions alone, but also plainly identifies differences between the sHR and csHR. We have shown that in the non-null setting (i.e., an exposure associated with at least one event type), there must be at least one instance where the sHR will differ from the csHR; the proposed diagnostic tool can help with the identification of this necessary difference. That the sHR and csHR differ should not be surprising, as subhazard functions and cause-specific hazards have distinct behaviors; at least one cause-specific hazard must have an area under the curve equal to infinity, whereas all subhazard functions must have finite areas under the curves.
A strength of our proposed estimator for the ratios of the two hazard ratio types is that it is nonparametric, but it is also subject to large standard errors for later follow-up periods when the risk sets diminish as depicted in Figures 3 and 4. Parametric methods can offer an alternative to improve precision but are subject to more restrictive assumptions.25,28
Our application integrated weighting methods to account for potential confounding for these nonparametric approaches. In the unadjusted analysis, our proposed ratios were different which was consistent with non-null associations. In adjusted analysis, these ratios were close to 1, and this was consistent with a null association with race. This finding was entirely consistent with previous results showing that risk differences due to race were explained by SES factors.28 Here we demonstrate that racial differences related to dialysis or kidney transplantation in children with CKD were explained by socio-economic factors and this was accomplished by nonparametric approaches which did not require classical assumptions of proportionality of hazards or other modeling fitting assumptions. A clinical implication of this application is that in this North American setting, transplant planning efforts should be mobilized for those with lower SES, many of whom will likely be African American.
Two limitations of our application may be noted. First, to handle the substantial heterogeneity of duration of disease at study enrollment and minimize immune time biases, we used methods to incorporate late entries and anchoring at age 2; however, there may still be residual immune time biases. Second, even though the adjustment for SES attenuated the association between race and transplant and confidence intervals suggested consistency with the null hypothesis, the differences shown in Figure 4 may be due to residual confounding.
Given the intrinsic links of the subhazard ratios in contrast to the cause-specific hazard ratios being free of dependencies, a preferred approach to estimate the subhazard ratios is to use standard methods to separately estimate the cause-specific hazard ratios along with our proposed general procedure to estimate the ratios of subhazard to cause-specific hazard ratios to obtain semiparametric estimates of the subhazard ratios as presented in the bottom panels of Figure 3. One may opt to report them or in turn, use them to assess the model appropriateness of simpler separate analyses of subhazard ratios (using classical Fine and Gray procedures) as was the case in Figure 2.
We have previously shown24 that assuming proportionality for both the cause-specific hazards and the subhazards of a given event renders them necessarily equal and thus the reporting of both under such an assumption is futile. Several papers have reported differing time-constant sHR and csHR despite these being inadmissible under the proportionality assumption.21,33–36
Under non-proportionality, the sHR and csHR can still be equal for a non-null exposure; this was the case for dialysis in our application. As shown in the Methods section, for the case of two competing events, equality between the sHR and csHR for one event (e.g., dialysis) requires that the sHR and csHR must be different for the other event (e.g., transplant). Although simultaneous proportionality implies sHR/csHR=1, it is not the case that if sHR/csHR=1, simultaneous proportionality holds (i.e., Figure 2A; and results reported by Hsu et al.22). On the other hand, when the opposite is observed (i.e., sHR/csHR ≠ 1) at least one of the hazard types is non-proportional as illustrated by Figures 2B and 3B.
These results also show that due to the sHR and csHR being equal at the start of the study, sufficient occurrence of events and duration of follow-up are necessary to determine differences between the two metrics. For limited studies with few events and/or short follow-up, reporting both sHR and csHR may be redundant as these metrics will not be different. Correspondingly, the diagnostic tool will not be useful in the context of such limited studies. In this case, we recommend reporting the csHRs with proportionality because they are untethered. In contrast, the tethering of constant sHRs means that the sHRs for the two competing events must be on opposite sides of one.24 However, for data with sufficient follow-up and events, reporting the sHR has the attraction of being directly linked to the cumulative incidence functions.
Although our application only had two competing events, the methods are applicable to any number of competing events using Equation (1). In such a case, for diagnostic purposes, the number of events will dictate the number of graphs (such as Figure 3). Additionally, this tool can accommodate categorical exposures with one exposure level serving as the reference. However, this tool does not extend to continuous exposures, due to the same limitations as classical Kaplan–Meier nonparametric incidence estimates that are only calculated for categorical exposures.
Our proposed nonparametric estimator can be calculated without the need for complex statistical tools or computing power to compare and contrast the sHRs and csHRs. More importantly, combining estimates of csHR  from standard Cox regression methods and our proposed nonparametric method to estimate
  , one can provide proper estimates of
  as
as  which will be congruent with expected theoretical properties of the metrics, avoid reporting inadmissible results and could be used to assess the appropriateness of estimates from classical Fine and Gray-based approaches. In addition, our approach provides indirect tests of exposure effects and proportionality, and it can incorporate covariate adjustment through weighting.
Data Accessibility Statement
Data and code are available in an R package called “hrcomprisk” developed by the authors. This software is freely available for download from CRAN (http://cran.r-project.org/).
Acknowledgments
Data in this manuscript were collected by the Chronic Kidney Disease in children prospective cohort study (CKiD) with clinical coordinating centers (Principal Investigators) at Children’s Mercy Hospital and the University of Missouri–Kansas City (Bradley Warady, MD) and Children’s Hospital of Philadelphia (Susan Furth, MD, PhD), Central Biochemistry Laboratory (George Schwartz, MD) at the University of Rochester Medical Center, and data coordinating center (Alvaro Muñoz, PhD and Derek K. Ng, PhD) at the Johns Hopkins Bloomberg School of Public Health. The CKiD Study is supported by grants from the National Institute of Diabetes and Digestive and Kidney Diseases, with additional funding from the Eunice Kennedy Shriver National Institute of Child Health and Human Development, and the National Heart, Lung, and Blood Institute (U01-DK-66143, U01-DK-66174, U24-DK-082194, U24-DK-66116). The CKiD website is located at http://statepi.jhsph.edu/ckid.
Disclosure
The authors report no conflicts of interest in this work.
References
1. Prentice RL, Kalbfleisch JD, Peterson AV, Flournoy N, Farewell VT, Breslow NE. The analysis of failure times in the presence of competing risks. Biometrics. 1978;34:541–554. doi:10.2307/2530374
2. Crowder MJ. Classical Competing Risks. Boca Raton, FL: CRC Press; 2001.
3. Pintilie M. Competing Risks: A Practical Perspective. Chichester, England: John Wiley & Sons; 2006.
4. Putter H, Fiocco M, Geskus RB. Tutorial in biostatistics: competing risks and multi-state models. Stat Med. 2007;26:2389–2430. doi:10.1002/sim.2712
5. Lau B, Cole SR, Gange SJ. Competing risk regression models for epidemiologic data. Am J Epidemiol. 2009;170:244–256. doi:10.1093/aje/kwp107
6. Andersen PK, Geskus RB, de Witte T, Putter H. Competing risks in epidemiology: possibilities and pitfalls. Int J Epidemiol. 2012;41:861–870. doi:10.1093/ije/dyr213
7. Kuk D, Varadhan R. Model selection in competing risks regression. Stat Med. 2013;32:3077–3088. doi:10.1002/sim.5762
8. Taghipour S, Banjevic D, Miller A, Harvey B. Competing risks models and breast cancer: a brief review. In: M-LT L, Gail M, Pfeiffer R, Satten G, Cai T, Gandy A, editors. Risk Assessment and Evaluation of Predictions. New York: Springer; 2013:301–313.
9. Austin PC, Lee DS, Fine JP. Introduction to the analysis of survival data in the presence of competing risks. Circulation. 2016;133:601–609. doi:10.1161/CIRCULATIONAHA.115.017719
10. Gaynor JJ, Feuer EJ, Tan CC, et al. On the use of cause-specific failure and conditional failure probabilities: examples from clinical oncology data. J Am Stat Assoc. 1993;88:400–409. doi:10.2307/2290318
11. Fine JP, Gray RJ. A proportional hazards model for the subdistribution of a competing risk. J Am Stat Assoc. 1999;94:496. doi:10.2307/2670170
12. Andersen PK, Keiding N. Interpretability and importance of functionals in competing risks and multistate models. Stat Med. 2012;31:1074–1088. doi:10.1002/sim.4385
13. Lau B, Cole SR, Gange SJ. Parametric mixture models to evaluate and summarize hazard ratios in the presence of competing risks with time-dependent hazards and delayed entry. Stat Med. 2011;30:654–665. doi:10.1002/sim.4123
14. Ren X, Li S, Shen C, Yu Z. Linear and nonlinear variable selection in competing risks data. Stat Med. 2018;37:2134–2147. doi:10.1002/sim.7637
15. Troendle JF, Leifer ES, Kunz L. Dealing with competing risks in clinical trials: how to choose the primary efficacy analysis? Stat Med. 2018;37:2787–2796. doi:10.1002/sim.7800
16. Wolbers M, Koller MT, Witteman JCM, Steyerberg EW. Prognostic models with competing risks: methods and application to coronary risk prediction. Epidemiology. 2009;20:555–561. doi:10.1097/EDE.0b013e3181a39056
17. Koller MT, Raatz H, Steyerberg EW, Wolbers M. Competing risks and the clinical community: irrelevance or ignorance? Stat Med. 2012;31:1089–1097. doi:10.1002/sim.4384
18. Wolbers M, Koller MT, Stel VS, et al. Competing risks analyses: objectives and approaches. Eur Heart J. 2014;35:2936–2941. doi:10.1093/eurheartj/ehu131
19. Latouche A, Allignol A, Beyersmann J, Labopin M, Fine JP. A competing risks analysis should report results on all cause-specific hazards and cumulative incidence functions. J Clin Epidemiol. 2013;66:648–653. doi:10.1016/j.jclinepi.2012.09.017
20. Poythress JC, Lee MY, Young J. Planning and analyzing clinical trials with competing risks: recommendations for choosing appropriate statistical methodology. Pharm Stat. 2019. doi:10.1002/pst.1966
21. Wolkewitz M, Palomar-Martinez M, Olaechea-Astigarraga P, Alvarez-Lerma F, Schumacher M. A full competing risk analysis of hospital-acquired infections can easily be performed by a case-cohort approach. J Clin Epidemiol. 2016;74:187–193. doi:10.1016/j.jclinepi.2015.11.011
22. Hsu JY, Roy JA, Xie D, et al. Statistical methods for cohort studies of CKD: survival analysis in the setting of competing risks. Clin J Am Soc Nephrol. 2017;12:1181–1189. doi:10.2215/CJN.10301016.
23. Beyersmann J, Latouche A, Buchholz A, Schumacher M. Simulating competing risks data in survival analysis. Stat Med. 2009;28:956–971. doi:10.1002/sim.3516
24. Muñoz A, Abraham AG, Matheson M, Wada N. Non-proportionality of hazards in the competing risks framework. In: M-LT L, Gail M, Pfeiffer R, Satten G, Cai T, Gandy A, editors. Risk Assessment and Evaluation of Predictions. New York: Springer; 2013:3–22.
25. Checkley W, Brower RG, Muñoz A. Inference for mutually exclusive competing events through a mixture of generalized gamma distributions. Epidemiology. 2010;21:557–565. doi:10.1097/EDE.0b013e3181e090ed.
26. Scrutinio D, Guida P, Passantino A, et al. Application of competing risks analysis improved prognostic assessment of patients with decompensated chronic heart failure and reduced left ventricular ejection fraction. J Clin Epidemiol. 2018;103:31–39. doi:10.1016/j.jclinepi.2018.07.006
27. Austin PC, Fine JP. Accounting for competing risks in randomized controlled trials: a review and recommendations for improvement. Stat Med. 2017;36:1203–1209. doi:10.1002/sim.7215
28. Ng DK, Moxey-Mims M, Warady BA, Furth SL, Muñoz A. Racial differences in renal replacement therapy initiation among children with a nonglomerular cause of chronic kidney disease. Ann Epidemiol. 2016;26:780–787.e1. doi:10.1016/j.annepidem.2016.09.011
29. Pepe MS, Mori M. Kaplan–Meier, marginal or conditional probability curves in summarizing competing risks failure time data? Stat Med. 1993;12:737–751. doi:10.1002/(ISSN)1097-0258
30. Furth SL, Cole SR, Moxey-Mims M, et al. Design and methods of the Chronic Kidney Disease in Children (CKiD) prospective cohort study. Clin J Am Soc Nephrol. 2006;1:1006–1015. doi:10.2215/CJN.01941205
31. Wong CS, Pierce CB, Cole SR, et al. Association of proteinuria with race, cause of chronic kidney disease, and glomerular filtration rate in the chronic kidney disease in children study. Clin J Am Soc Nephrol. 2009;4:812–819. doi:10.2215/CJN.01780408
32. Pierce CB, Cox C, Saland JM, Furth SL, Muñoz A. Methods for characterizing differences in longitudinal glomerular filtration rate changes between children with glomerular chronic kidney disease and those with nonglomerular chronic kidney disease. Am J Epidemiol. 2011;174:604–612. doi:10.1093/aje/kwr121
33. Babiker A, Darbyshire J, Pezzotti P, et al. Changes over calendar time in the risk of specific first AIDS-defining events following HIV seroconversion, adjusting for competing risks. Int J Epidemiol. 2002;31:951–958.
34. Lim HJ, Zhang X, Dyck R, Osgood N. Methods of competing risks analysis of end-stage renal disease and mortality among people with diabetes. BMC Med Res Methodol. 2010;10:97. doi:10.1186/1471-2288-10-97
35. Noordzij M, Leffondré K, van Stralen KJ, Zoccali C, Dekker FW, Jager KJ. When do we need competing risks methods for survival analysis in nephrology? Nephrol Dial Transplant. 2013;28:2670–2677. doi:10.1093/ndt/gft355
36. Latouche A, Boisson V, Chevret S, Porcher R. Misspecified regression model for the subdistribution hazard of a competing risk. Stat Med. 2007;26:965–974. doi:10.1002/sim.2600
 © 2020 The Author(s). This work is published and licensed by Dove Medical Press Limited. The
full terms of this license are available at https://www.dovepress.com/terms
and incorporate the Creative Commons Attribution
- Non Commercial (unported, 3.0) License.
By accessing the work you hereby accept the Terms. Non-commercial uses of the work are permitted
without any further permission from Dove Medical Press Limited, provided the work is properly
attributed. For permission for commercial use of this work, please see paragraphs 4.2 and 5 of our Terms.
© 2020 The Author(s). This work is published and licensed by Dove Medical Press Limited. The
full terms of this license are available at https://www.dovepress.com/terms
and incorporate the Creative Commons Attribution
- Non Commercial (unported, 3.0) License.
By accessing the work you hereby accept the Terms. Non-commercial uses of the work are permitted
without any further permission from Dove Medical Press Limited, provided the work is properly
attributed. For permission for commercial use of this work, please see paragraphs 4.2 and 5 of our Terms.