Back to Journals » International Journal of Chronic Obstructive Pulmonary Disease » Volume 20
Nonlinear Association Between Weekday Sleep Duration and COPD Risk: Evidence From NHANES 2017–2023
Received 20 March 2025
Accepted for publication 31 July 2025
Published 12 August 2025 Volume 2025:20 Pages 2823—2836
DOI https://doi.org/10.2147/COPD.S522236
Checked for plagiarism Yes
Review by Single anonymous peer review
Peer reviewer comments 3
Editor who approved publication: Dr Jill Ohar
Xinxin Tao,1 Xianwei Ye1,2
1School of Clinical Medicine, Guizhou Medical University, Guiyang, Guizhou, People’s Republic of China; 2Department of Respiratory and Critical Care Medicine, Guizhou Provincial People’s Hospital, Guiyang, Guizhou, People’s Republic of China
Correspondence: Xianwei Ye, Email [email protected]
Background: Chronic Obstructive Pulmonary Disease (COPD) is a major global health concern. Lifestyle factors play a pivotal role in its prevention. This research aims to explore the possible link between Weekday Sleep Duration (WSD) and the prevalence of COPD within the US population.
Methods: We employed data sourced from the NHANES during the 2017– 2023 cycles. The research was centered around COPD. The primary exposure variable, WSD, was grouped by quartiles. Missing values were addressed using multiple imputation. Covariates related to WSD and COPD were pre-identified via a Directed Acyclic Graph (DAG), and highly collinear variables were removed using the Variance Inflation Factor (VIF). Least Absolute Shrinkage and Selection Operator (LASSO) regression further screened variables. Weighted logistic regression was employed to analyze the association between WSD and COPD. Sensitivity analysis tests the stability and reliability of results. Nonlinear relationships were evaluated using Restricted Cubic Splines (RCS) and threshold analysis, while subgroup analyses were performed to assess heterogeneity and validate results. Model performance was gauged by the Area Under the Receiver Operating Characteristic Curve (AUC).
Results: After adjusting for all covariates in the weighted logistic regression analysis, we found that higher WSD was consistently correlated with increased prevalence of COPD (P=0.012; OR=1.740; 95% CI, 1.196– 2.530). The sensitivity analysis confirms the reliability of our results. The RCS and threshold analysis results show a positive correlation between COPD and WSD (7.0– 14.0 hours) (P=0.011; OR=1.12; 95% CI, 1.03– 1.22). Subgroup analysis shows that among weekend catch-up sleep (P=0.000), there is a significant positive association between WSD and COPD prevalence. The ROC (AUC=0.811) results show that our model has good diagnostic performance.
Conclusion: WSD of 8.5– 14 hours/day is associated with higher COPD risk. Prospective studies are needed to validate this novel insight for COPD prevention and treatment.
Keywords: COPD, weekday sleep duration, DAG, VIF, LASSO, RCS
Introduction
COPD has emerged as a prominent global public health concern, with a surge in prevalence, mortality rates, and financial burden, especially in developing countries. According to the GOLD 2025 Report, the global prevalence of COPD is estimated at 10.3%, accounting for over 3.0 million annual deaths worldwide.1,2 The standard diagnosis of COPD is irreversible airflow limitation, but this criterion has to be reexamined due to the variability in clinical course, imaging, exacerbations, and mortality, as well as the slow advancement of treatment research.3–5 Recently, the Lancet proposed a radical redefinition of COPD, taking into account genetics, early-life experiences, infections, smoking, environmental tobacco smoke, and other environmental exposures.5 The Genetic Epidemiology of COPD (COPDGene) research also formulated broader definitions for COPD, incorporating patients whose FEV1/FVC ratio remained normal but had impaired results in spirometry tests.6 These patients are identified as being at risk for developing chronic airflow obstruction, as outlined in the most recent guidelines from the Global Initiative for Chronic Obstructive Lung Disease (GOLD) and the American Thoracic Society (ATS)/European Respiratory Society (ERS) for pulmonary function testing.7 Early diagnosis of COPD is crucial as emphasized by the authors of the GOLD, Lancet, and COPDGene papers, since it allows for timely intervention before irreparable lung damage has occurred.
Sleep plays a vital role in the recovery and growth of the body and brain, as well as in memory consolidation. According to the Sleep Research Society (SRS) and the American Academy of Sleep Medicine (AASM), adults should aim for at least 7 hours of sleep per night.8 Studies have shown that a daily sleep duration of 7 to 9 hours represents the “optimal range”.9–11 Previous studies have linked both short and long sleep durations to a range of adverse health outcomes, including metabolic disorders,12–21 cardiovascular diseases,22,23 and respiratory conditions such as COPD.24 Understanding the specific role of sleep duration in COPD development may offer new insights into its prevention and management. Although the mechanisms underlying this association are not fully understood, current evidence suggests that abnormal sleep duration may contribute to COPD pathogenesis through pathways involving inflammation,25 oxidative stress,26 autonomic dysregulation,27 and endocrine imbalance.28 For instance, abnormal sleep duration may elevate levels of pro-inflammatory cytokines, such as interleukin-6 (IL-6) and tumor necrosis factor-alpha (TNF-α), potentially exacerbating airway inflammation in patients with COPD.29–31 Additionally, abnormal sleep periods can disrupt circadian rhythms, affect cortisol secretion, and increase oxidative stress, all of which may further intensify the progression of COPD.32–34
Moreover, few studies have examined the association between WSD and COPD in the general population. Previous studies have often focused on weekend sleep duration or obstructive sleep apnea (OSA) without specifically examining the impact of WSD.35,36 Elucidating this relationship not only contributes to a better understanding of the intricate interaction between COPD and sleep patterns but also holds the potential to positively influence the formulation of treatment strategies for COPD.
In this study, we aim to explore the possible connection between self-reported WSD and COPD in participants from the NHANES. NHANES provides a large, nationally representative sample with detailed information on sleep patterns, COPD status, and various covariates, allowing for robust analysis of the relationship between WSD and COPD. This investigation will better guide the management and prevention of COPD by providing insights into how sleep patterns may impact the development and progression of the disease.
Methods
Research Cohort
The NHANES, overseen by the Centers for Disease Control and Prevention (CDC), is a thorough examination that gathers data on the dietary and the health conditions of both children and adults within the United States. Initiated in 1999, NHANES has been carrying out surveys on a two-year cycle, employing a nationally representative sample. The objective is to evaluate the nutritional status and overall health of children and adults in the United States. The Institutional Review Board at the National Center for Health Statistics (NCHS) has granted ethical approval for this study. Prior to taking part, every single participant provided written informed consent. We ensure that all research for this study followed relevant rules and guidelines. We got informed consent from every participant or their legal guardians. Also, all research abided by the Declaration of Helsinki. (https://www.cdc.gov/nchs/nhanes/index.htm). This research incorporates information from two parts of the NHANES, spanning from 2017 to 2020 and from 2021 to 2023, involving an initial total of 25,526 participants. The criteria for participant exclusion in our study, along with the number of participants excluded at each step, are as follows: 1) Absence of data regarding COPD, resulting in the exclusion of 9,467 participants; 2) Lack of data on WSD, leading to the exclusion of 176 participants; 3) Surveys with missing information or incomplete data, which led to the exclusion of 4,034 participants. After applying these exclusion criteria, 11,849 participants remained for the final analysis, further categorized into 938 with COPD and 10,911 without COPD. The screening process is depicted in Figure 1.
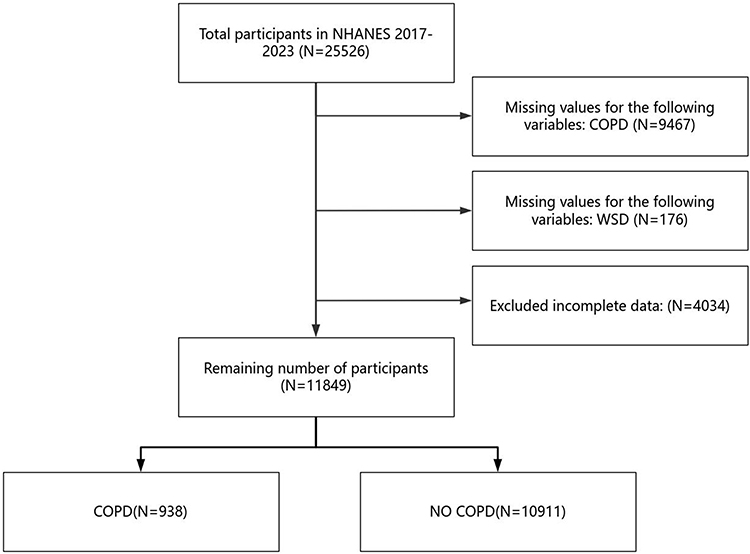 |
Figure 1 The flow chart of the included participants in this research. |
The Ascertainment of COPD
According to the GOLD 2025 report,2 COPD diagnosis depends on spirometry, with a post - bronchodilator FEV1/FVC ratio < 0.7 as the key criterion. Airflow obstruction severity has four grades: GOLD 1 (FEV1≥80% predicted, mild), GOLD 2 (50%≤FEV1<80% predicted, moderate), GOLD 3 (30%≤FEV1<50% predicted, severe), and GOLD 4 (FEV1<30% predicted, very severe). For dyspnea assessment, while the mMRC scale is common, the CAT is preferred as COPD symptoms are more than just dyspnea. An mMRC grade of 2 or above still indicates more severe dyspnea. The GOLD 2025 ABE tool groups patients into three: Group A (low risk, 0–1 exacerbations/year, no hospitalization, fewer symptoms: mMRC 0–1 or CAT < 10), Group B (low risk, more symptoms: mMRC ≥ 2 or CAT ≥ 10), and Group E (high risk, ≥ 2 exacerbations/year or ≥ 1 hospitalization, regardless of symptoms).8 This study used participants’ COPD status as the dependent variable. We drew on data from the NHANES questionnaire (MCQ160O) covering 2017 to 2023. This questionnaire asked whether participants had received a COPD diagnosis. Participants who said “yes” were grouped into the COPD group; those who said “no” were placed in the control group.
Evaluations of Sleep Time and WSD
Between 2017 and 2023, as part of the NHANES, respondents provided answers to a series of inquiries pertaining to their sleep habits, which allowed for the determination of their sleep patterns:1 “quantity of hours usually sleep on weekdays or workdays” and2 “quantity of hours usually sleep on weekends or non-workdays.” WSD is identified as the period of sleep time during workdays. Subsequently, it was categorized into four distinct segments based on Quartile grouping: Q1(2.0≤WSD<7.0h), Q2(7.0≤WSD<7.5h), Q3(7.5≤WSD<8.5h), Q4(8.5≤WSD≤14.0h). A multitude of research on sleep duration relies on the times reported by participants, which hold a degree of precision. In this study, the analysis was conducted utilizing the information provided directly by the participants.
Covariates
According to clinical experience and prevailing literature, covariates were set, such as gender (male or female); age (≥20); education (9–11th grade; College graduate or above; High school graduate; Less than 9th grade; Some college or AA degree); race (Mexican American; Non-Hispanic Asian; Non-Hispanic Black; Non-Hispanic White; Other Hispanic); smoke (yes or no); marital status (Married/Living with partner; Never married; Widowed/Divorced/Separated); drink (yes or no); BMI; hypertension (yes or no); diabetes (yes or no); depress (More than half the days; Nearly every day; Not at all; Several days); trouble sleeping (More than half the days; Nearly every day; Not at all; Several days); Number of hours worked in the last week; Sedentary activity; Weekend catch-up sleep; Smoke (yes or no).
Statistical Analyses
In this study, we utilized the R open-source statistical software, version 4.4.1, to explore the link between WSD and COPD. Given the intricacies of the survey design, we applied descriptive statistics to process the weighted data. The designated sample weights for our research were obtained from the datasets “WTMECPRP - Comprehensive 3-year MEC examination weights” for the years 2017 to 2020, and “WTMEC2YR - Comprehensive MEC examination weights” for the period from 2021 to 2023. The study’s demographic details, encompassing both continuous and categorical variables, were presented with mean values and their corresponding standard errors (SE) for the former, and frequencies with percentage distributions for the latter. Each set of data was complemented by a 95% confidence interval. Comparative analyses of the initial subject attributes were performed using t-tests for continuous variables and chi-square tests for categorical variables. Multiple imputation was used to handle missing covariate data and reduce bias from missingness. Covariates associated with WSD and COPD were pre-identified via DAG to exclude spurious associations. The VIF was applied to eliminate highly collinear variables, and LASSO regression further simplified the model. Then, put the selected data into multivariate logistic regression. Add confounding factors step by step to figure out the link between WSD and COPD. Three models were constructed: Model 1 (unadjusted); Model 2 (adjusted for Gender, Age, Race, Education, Marital, BMI, Weekend catch-up sleep); and Model 3 (adjusted for selected covariates, including the above plus Hypertension, Diabetes, Trouble sleeping, Number of hours worked in the last week, Sedentary activity, Weekend catch-up sleep, Drink, Smoke). Sensitivity analysis was then used to verify the stability of our model. Next, we further performed stratification and interaction analyses by all variables and plotted the associated forests. In addition, we combine the RCS curve and threshold analysis to flexibly and accurately describe nonlinear relationships between WSD and COPD. Finally, the diagnostic performance of the selected variable model was evaluated using the AUC.
Results
Description of Participant Characteristics
This study comprised a sample of 11,849 individuals, reflecting approximately 0.0036% of the American population. Table 1 presents the characteristics of participants (Q1(2.0≤WSD<7.0h), Q2(7.0≤WSD<7.5h), Q3(7.5≤WSD<8.5h), Q4(8.5≤WSD≤14.0h)). The group with WSD from 8.5 to 14 h per day had higher prevalence of COPD compared to other groups. The WSD from 8.5 to 14 hours per day of 2598 people account for 21.9% of the total population (Table 1).
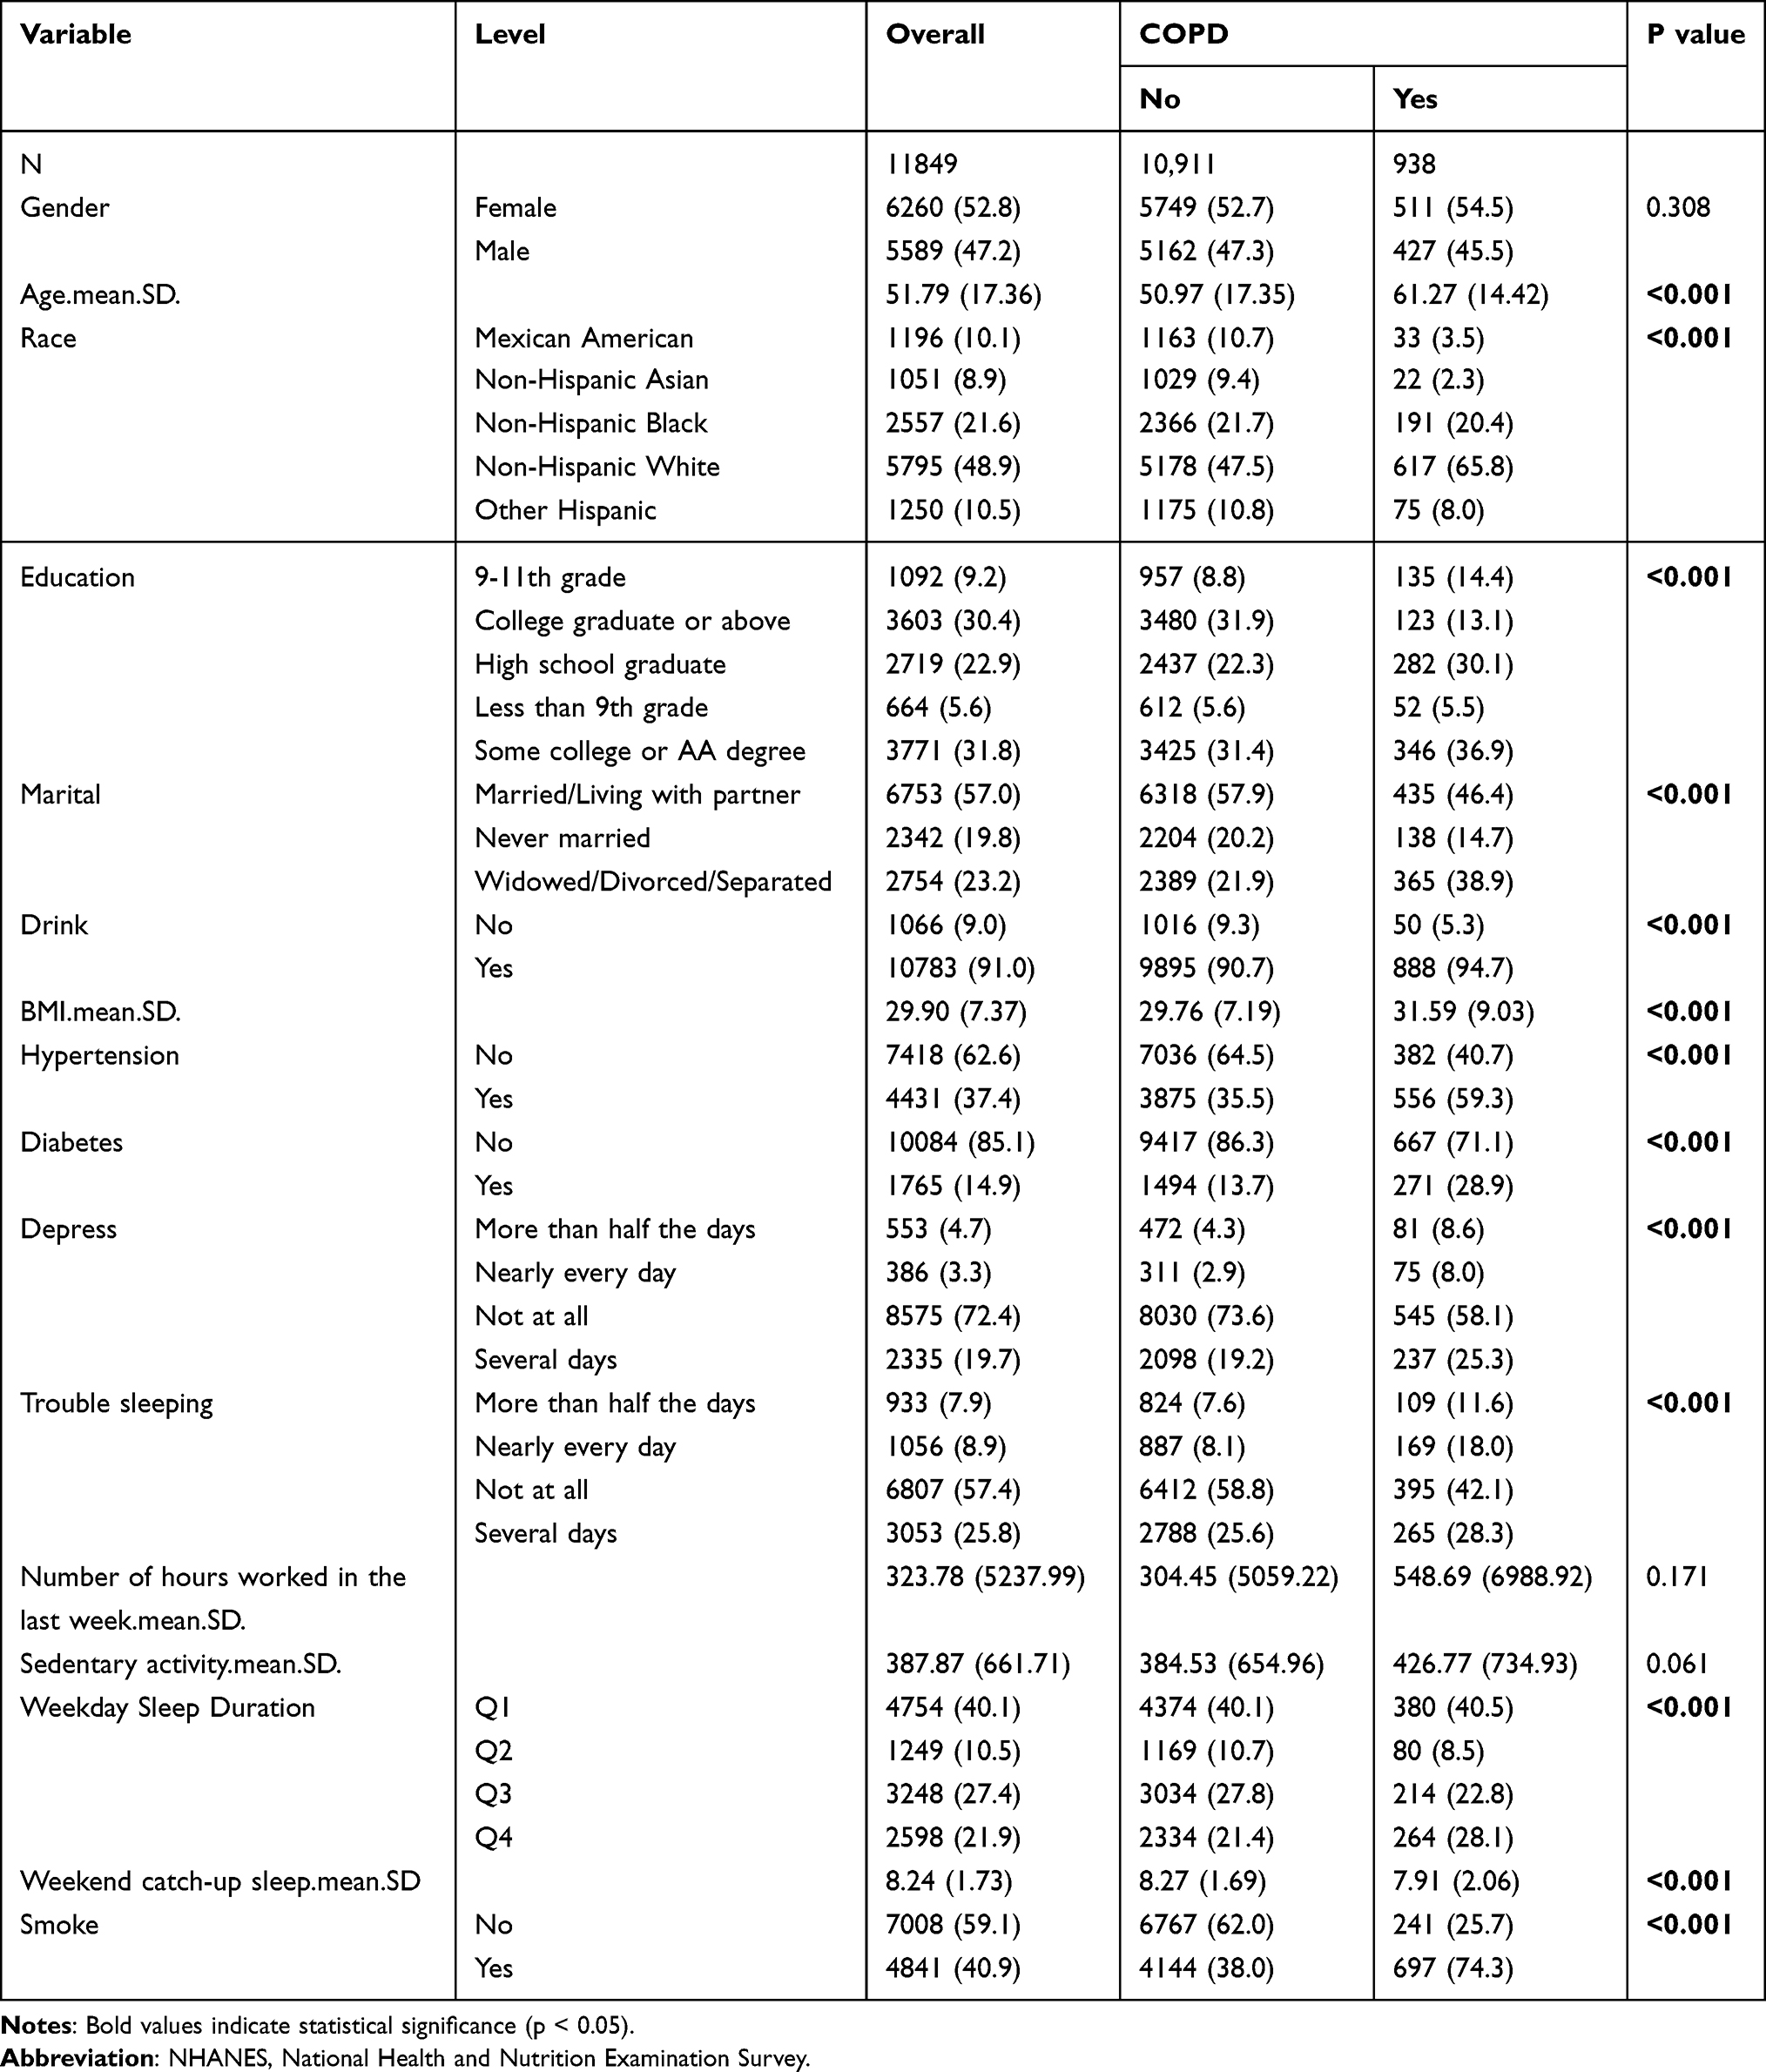 |
Table 1 Features of the Participants in the NHANES 2017–2023 Cycles (n = 11,849) |
Variable Preselection and Collinearity Assessment
To ensure model accuracy and reliability before developing a LASSO model, we used DAG (Figure 2A) to pre-identify covariates with plausible causal links to WSD and COPD, removing spurious associations. We evaluated collinearity via VIF and excluded variables with VIF >5 to simplify the model. Figure 2B shows that Depress had the highest VIF (5.0), indicating strong collinearity, and will be excluded to reduce model impact.
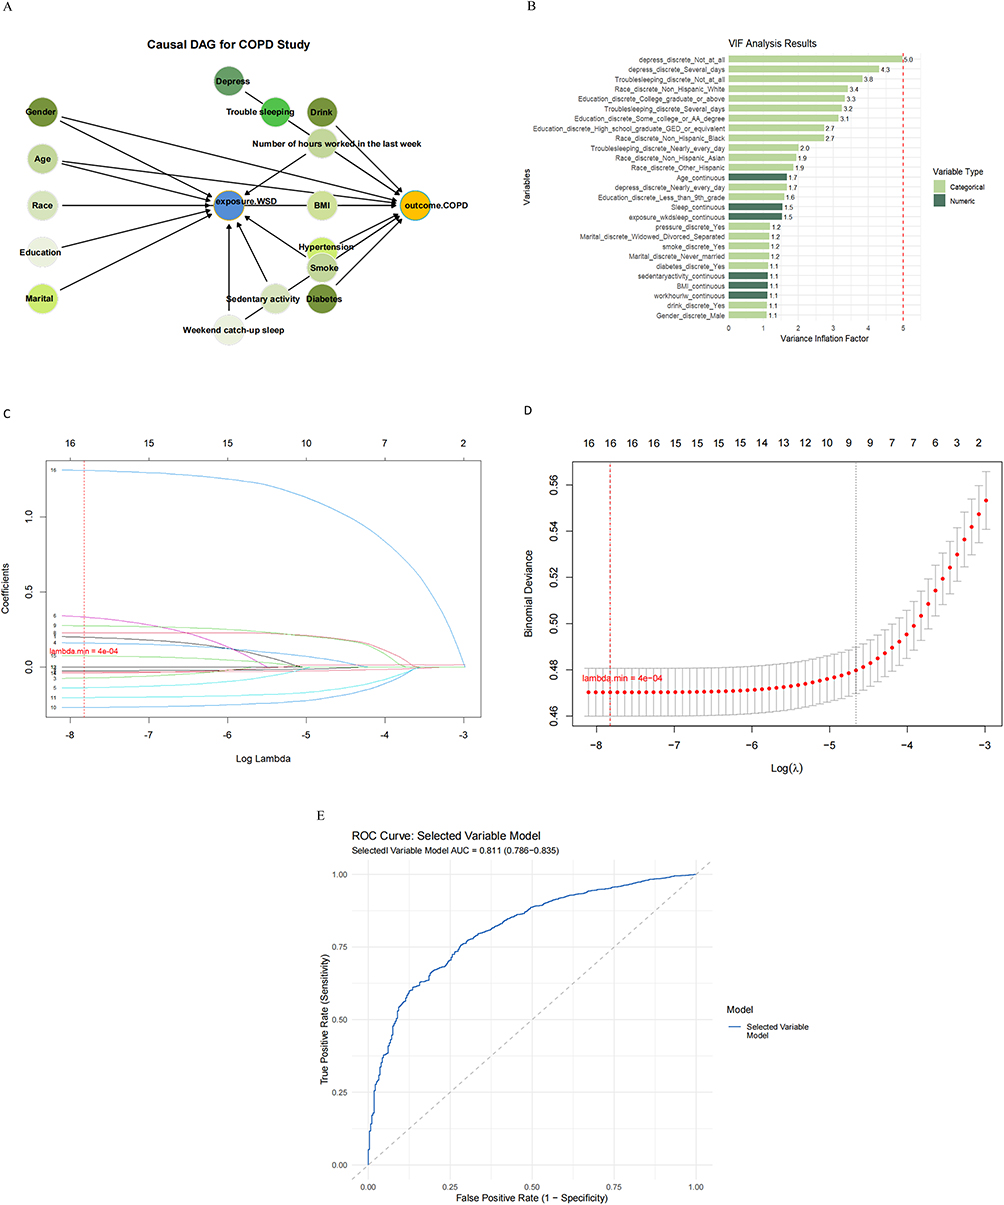 |
Figure 2 (A) Directed Acyclic Graph (DAG) for pre-identifying covariates. (B) Conduct Variance Inflation Factor (VIF) detection for all variables. (C) LASSO regression path plot. (D) LASSO 10-fold cross-validation plot. (E) The Receiver Operating Characteristic (ROC) curve of the model with selected variables (excluding the depression variable). |
Covariate Selection Using LASSO
We utilized the LASSO regression model to predict the hazard of COPD. As a regularization approach, LASSO reduces model complexity, avoids overfitting, and performs variable selection by adding an L1 penalty term to the loss function. This gives it a distinct advantage over traditional linear regression, which tends to produce unstable estimates when multicollinearity exists. Using the “cv.glmnet” function from the “glmnet” package, we carried out cross-validation to identify the optimal penalty parameter “lambda”. The best “lambda” value, determined by minimizing the cross-validation error, is 0.0003998152. However, it is important to note that the selection of the optimal lambda is highly dependent on the cross-validation process, which may introduce some variability in the results. Figure 2C, the Coefficient Path Plot, illustrates how the coefficient of each variable in the model changes with different regularization strengths (Log Lambda). The X-axis represents Log Lambda (ranging from 8 to 3; higher values indicate stronger regularization), and the Y-axis shows the coefficient values (spanning from - 0.5 to 1.5), reflecting the direction and magnitude of the variable’s impact on the model’s predictions. Each line traces the trajectory of a variable’s coefficient as Log Lambda changes. The variables (numbered 1–16) see their coefficients gradually shrink toward zero as regularization strength increases, which simplifies the model and reduces overfitting. Variables whose coefficients remain non-zero over a relatively wide range of Log Lambda values are considered more crucial for prediction. Figure 2D, the Cross-validation Plot, demonstrates the model’s cross-validation performance under different Log Lambda values to guide the selection of the optimal regularization strength. Here, the X-axis is Log Lambda (8 to 3), and the Y-axis is binomial deviance (ranging from 0.46 to 0.56; lower values indicate a better fit). Red dots plot the deviance at each Lambda, and error bars show the standard error. As Lambda increases (and the model becomes simpler), the deviance may rise, reflecting a trade-off between complexity and fit. A stable deviance around a certain range of Lambda values suggests the model’s robustness within that range. However, the reliance on cross-validation deviance to determine the optimal lambda may not always capture the most clinically relevant predictors, as it prioritizes model fit over potential clinical significance. After weighting all variables, we ran the LASSO regression on predictors excluding the weighted/outcome variables, identifying 16 variables. Notably, no variables were excluded because their coefficients did not shrink to zero, confirming that all filtered covariates are strongly associated with COPD. For a more parsimonious model, “lambda.1se” could be used; however, our analysis retained all impactful predictors for robustness. While this approach ensures that no potentially important variables are omitted, it may also result in a more complex model than necessary, which could complicate clinical interpretation. In short, LASSO effectively refined our COPD hazard prediction model, balancing complexity and predictive power while validating variable relevance, with all 16 selected covariates proving integral to the outcome. However, the highly collinear variable “depress” was excluded via VIF analysis, leaving 15 variables for multivariable logistic regression.
ROC Curve Analysis of Our Selected Variable Model
Figure 2E presents the ROC curve for our selected variable (excluding the depression variable by VIF) model applied to a binary classification task. The model’s AUC is 0.811 (95% CI: 0.786–0.835), demonstrating robust discriminative power. The curve’s position above the diagonal line indicates superior classification performance compared to random guessing, with higher sensitivity and lower false positive rates. This suggests that our model possesses good diagnostic efficacy.
WSD Changes and COPD
Our weighted multivariate logistic regression analysis (Table 2) shows that longer WSD is linked to a higher COPD risk. In Model 1, the top WSD quartile (Q4) had a significant risk increase (OR = 1.457, 95% CI = 1.144–1.856, p = 0.004). This significance persisted in Model 2 (OR = 1.853, 95% CI = 1.280–2.683, p = 0.003) and Model 3 (OR = 1.740, 95% CI = 1.196–2.530, p = 0.012), indicating a robust association between longer WSD and COPD risk.
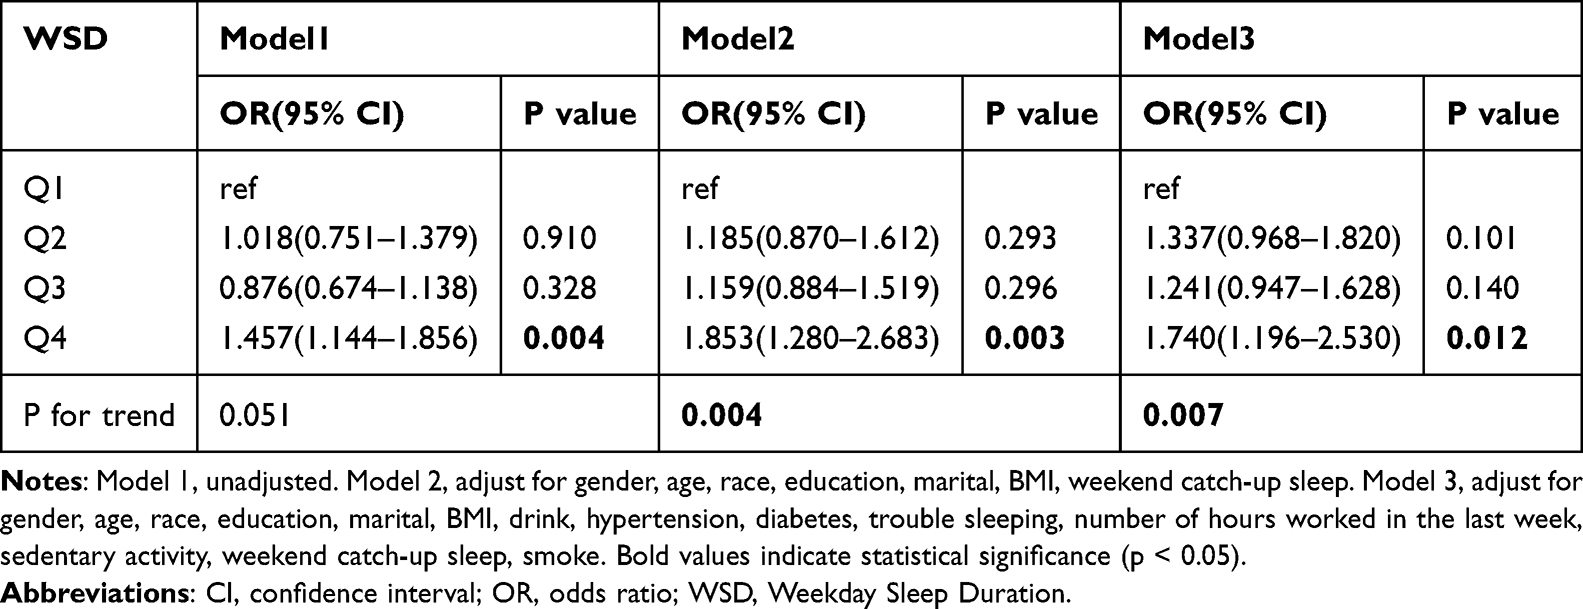 |
Table 2 Multivariate Logistic Regression Analysis of the Linkage Between WSD and COPD |
Compared to the lowest quartile (Q1), the risk of COPD in Q4 increased by 46% in Model 1 (OR = 1.457; 95% CI = 1.144–1.856; p = 0.004), by 85% in Model 2 (OR = 1.853; 95% CI = 1.280–2.683; p = 0.003), and by 74% in Model 3 (OR = 1.740; 95% CI = 1.196–2.530; p = 0.012). Additionally, the P-values for trend were significant across all models (Model 1: p = 0.051; Model 2: p = 0.004; Model 3: p = 0.007), further supporting a significant dose-response relationship between WSD and the risk of COPD.
Covariate-Independent Exposure Effect
Figure 3 Sensitivity analysis forest plot generated using the “survey” and “ggplot2” packages. The plot demonstrates that the OR and its 95% confidence interval for the exposure variable are hardly affected by the sequential exclusion of each covariate. This finding indicates that the robustness of our model outcomes is not contingent upon the inclusion of specific covariates. Additionally, we have included the following contents in the supplementary files: (1) Pattern diagram of data missingness and the process of multiple imputation (Figure S1 and Table S1); (2) Variables retained by Lasso regression and their corresponding coefficients; (3) A summary table of all abbreviations; (4) Supplementary variable analysis; (5) Sensitivity Analysis Table.
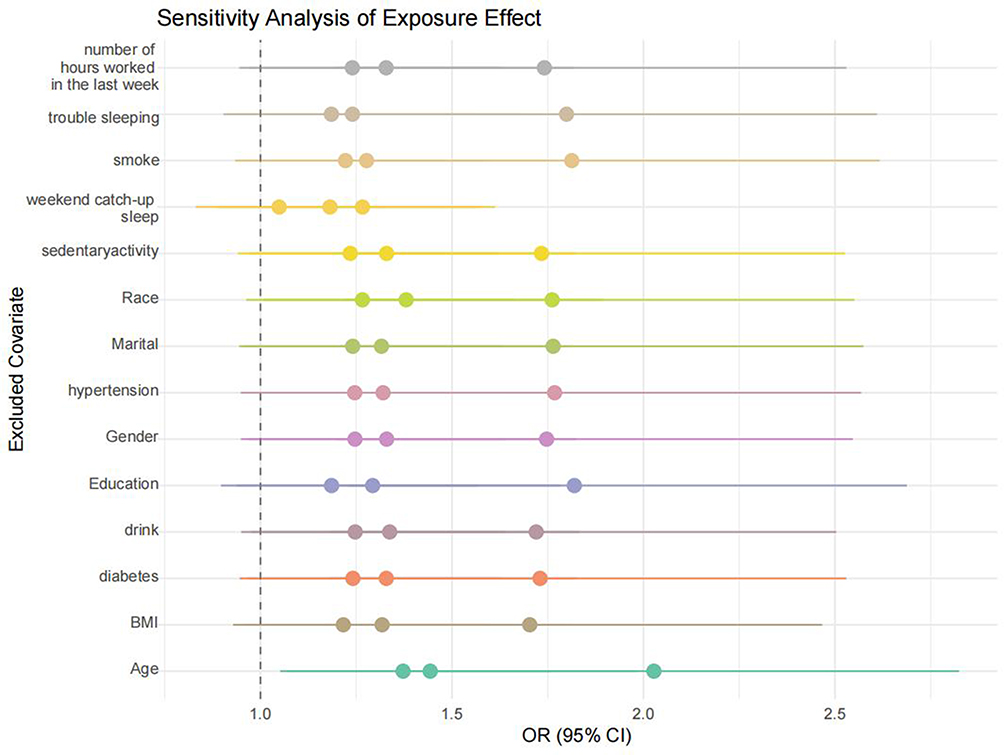 |
Figure 3 Sensitivity analysis of covariate exclusion effects. |
Hierarchical Analysis, Interaction Effects, and Forest Plot
The interaction P-value for “Weekend catch-up sleep” is 0.000, indicating a highly significant interaction between weekend catch-up sleep and WSD in influencing the risk of COPD. Specifically, as shown in Table 3 and Figure 4, there is a significant positive association between WSD and COPD prevalence when considering weekend catch-up sleep. This suggests that weekend catch-up sleep may play a modifying role in the relationship between WSD and COPD risk. In contrast, interactions between other variables in the table and WSD did not reach statistical significance.
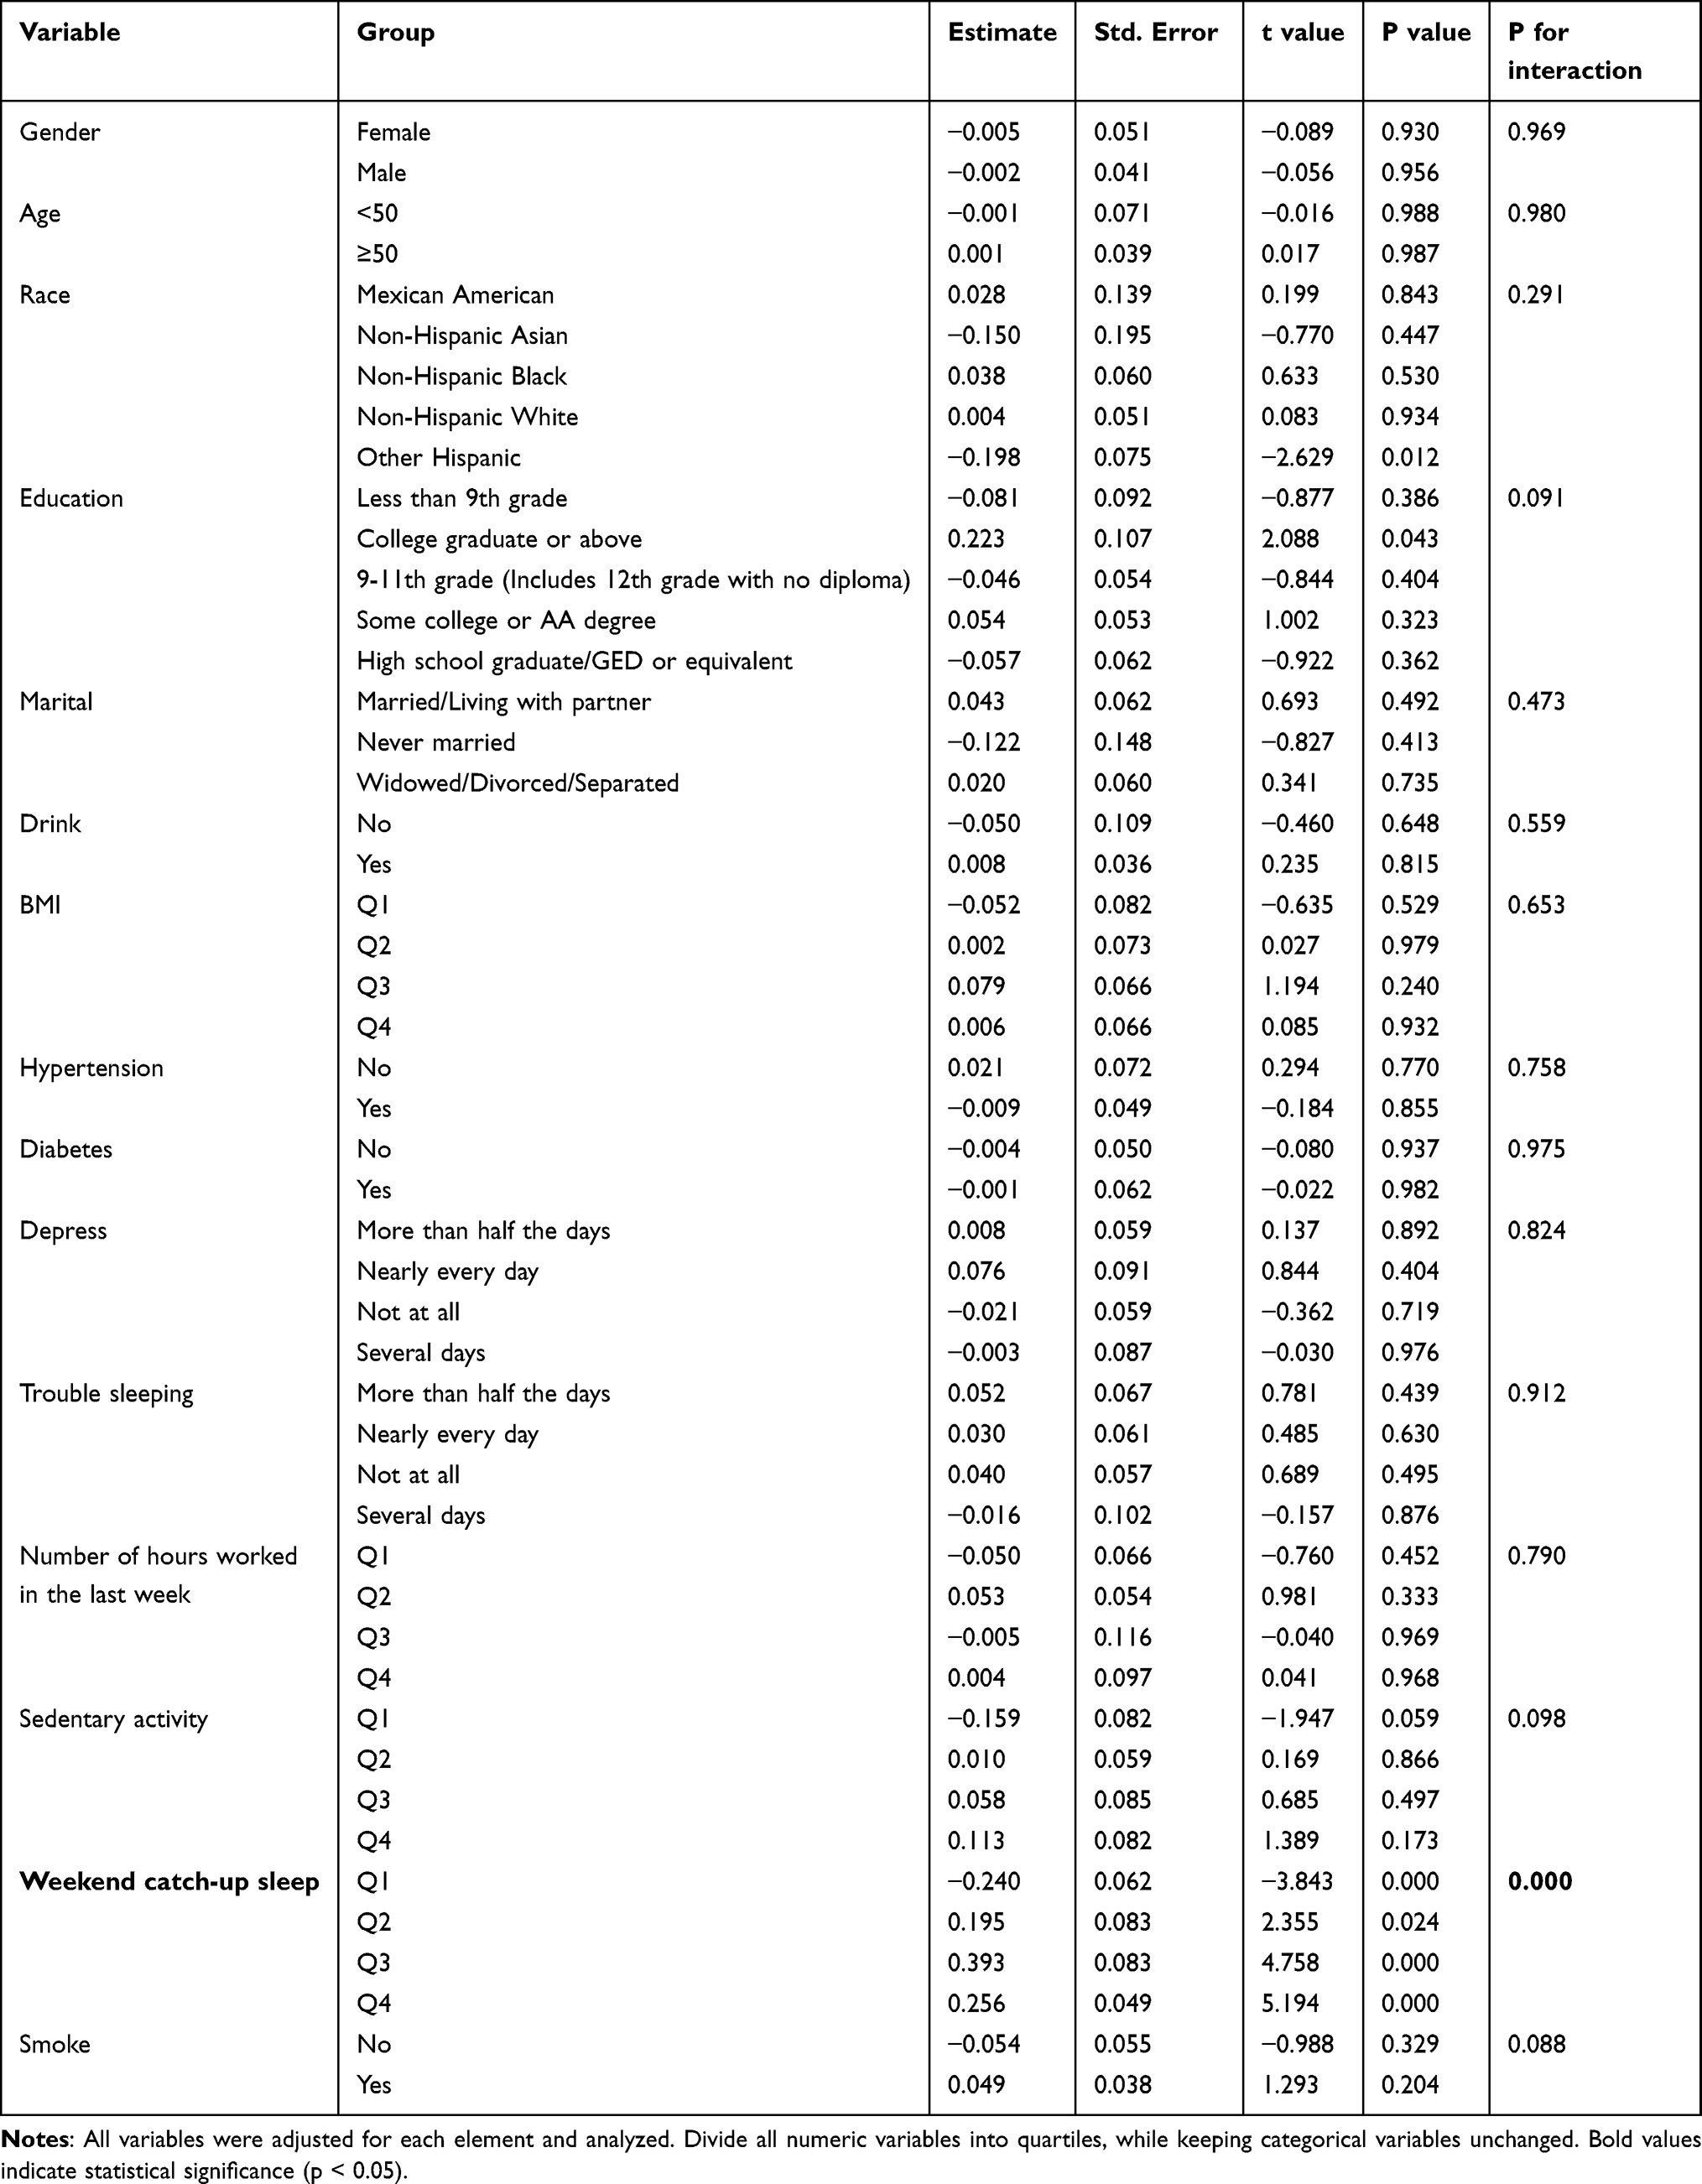 |
Table 3 Hierarchical Analysis and Interaction Effects |
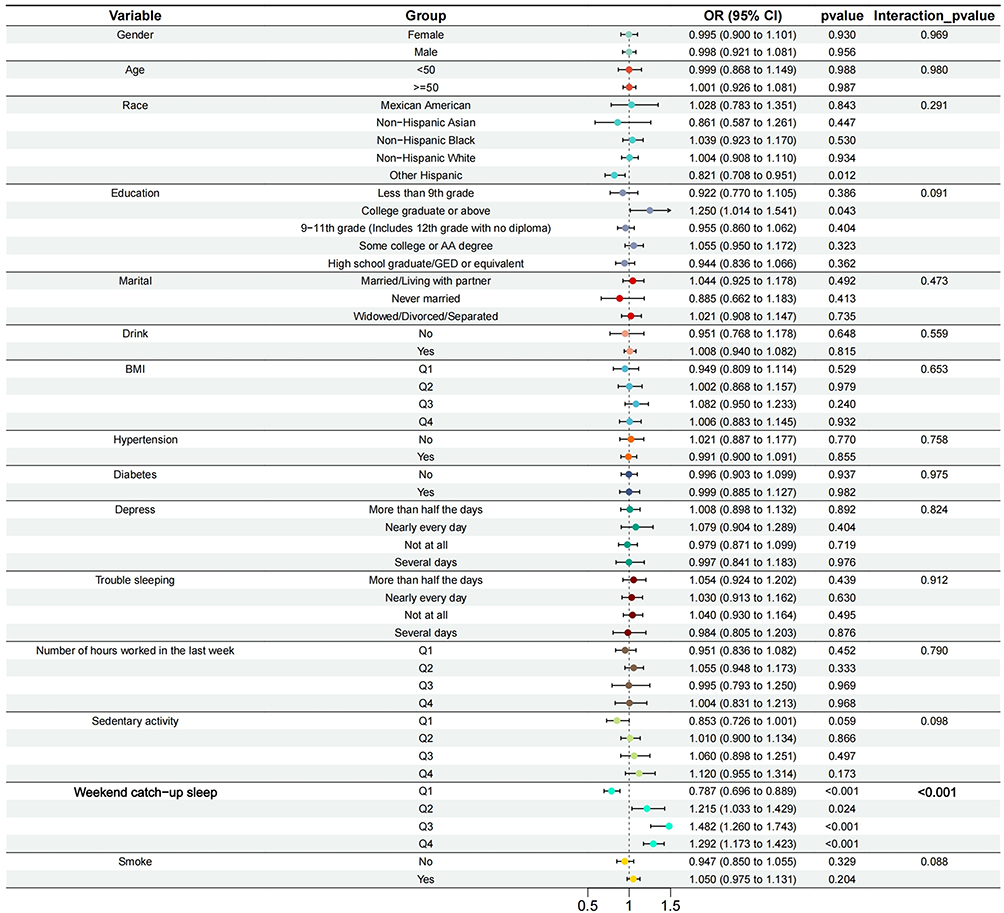 |
Figure 4 Subgroup and interaction analysis of WSD and COPD by all groups. |
Non-Linear Relationship and Threshold Analysis Results
To examine the non-linear relationship between WSD and the risk of COPD, we utilized the RCS model based on the “rms” package. The chart generated using the “ggplot2” package shows a U-shaped curve, indicating that the relationship between WSD and COPD risk is likely not linear. The overall model P-value is less than 0.001, which confirms the statistical significance of the model, suggesting a significant association between WSD and COPD risk. Additionally, the P-value for the non-linearity test is also less than 0.001, further confirming that this association has a significant non-linear characteristic, meaning that the relationship between the two variables is not a simple linear one (Figure 5).
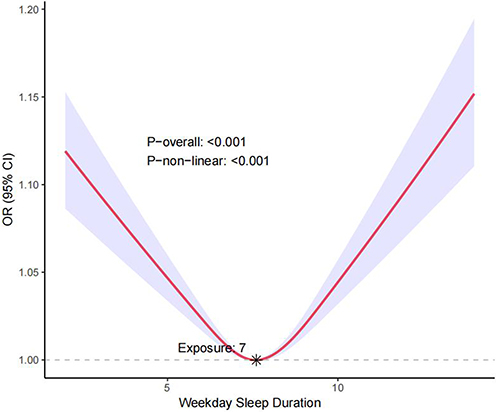 |
Figure 5 Nonlinear relationship between WSD and COPD: restricted cubic spline analysis, with node at 7.0 h. |
There is a threshold effect in the association between the continuous variable of WSD and the discrete variable of COPD (P for likelihood test <0.001). No association was found between WSD and COPD when the number of WSD was below 7. However, when the number of WSD was ≥7 and ≤14, a positive association was observed between WSD and COPD, with an odds ratio (OR) and its 95% confidence interval (CI) of 1.12 (1.03–1.22) (Table 4).
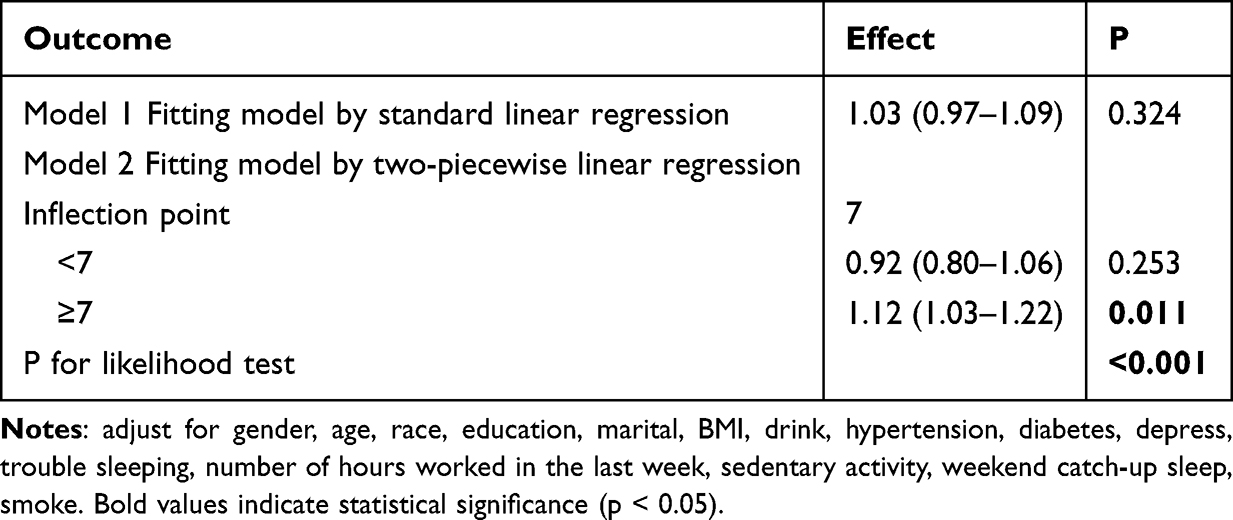 |
Table 4 Threshold Analysis Result |
Discussion
Before studying COPD risk, it is important to understand how sleep duration relates to chronic diseases. This study uses NHANES data to explore the link between WSD and COPD prevalence. Results show a clear positive association between WSD and higher COPD risk.
In weighted logistic regression, WSD (8.5–14.0 hours) correlates significantly with COPD prevalence, whether covariates are unadjusted, adjusted for demographics, or fully adjusted. RCS curves and threshold analyses reveal a non-linear relationship between WSD and COPD, with an inflection point at 7.0 hours. When WSD exceeds 7.0 hours, COPD risk rises as WSD increases (up to 14.0 hours). This is consistent with the findings from weighted logistic regression. Specifically, WSD in the 8.5–14.0 hour range is linked to significantly higher COPD risk. Sensitivity analyses, showing robustness with individual covariate exclusions, further validate the reliability of our conclusions.
Subgroup analyses further confirm a positive correlation between WSD and COPD prevalence, particularly when weekend catch-up sleep is considered. This highlights the importance of keeping WSD within a healthy range for lung health.
Before variable screening, we used DAG to assess covariate relationships and VIF to check for multicollinearity. Variables with a VIF of 5 or higher were excluded. LASSO regression was then used to select key variables, reducing overfitting risk and simplifying the model. Finally, The ROC (AUC=0.811) confirmed the good diagnostic ability of our model.
Looking at the articles published to date, sleep issues have been associated with various health risks. However, the relationship between COPD and WSD has not been mentioned, making this area of research relatively unexplored. Notably, Chuntian Lu et al37 demonstrated that both short and long sleep durations correlate with elevated risks of common chronic diseases among women aged 18 to 64. Zhishen Ruan et al25 found that sleep duration of less than 7.5 hours was negatively associated with cough and dyspnea, whereas sleep duration exceeding 7.5 hours was positively correlated with these conditions. Unlike their clinically based research, our study shifts focus from general sleep duration to quantified WSD. By employing RCS modeling combined with threshold analysis, we found that long sleep—defined as 7 to 14 hours—is linked to increased COPD risk, whereas short sleep (less than 7 hours) shows no significant association with COPD. These findings partially align with their conclusions but also have some differences. In addition, our study features more comprehensive statistical methods and yields more quantitative and meticulous distinction results, and the data year used in our research is more recent.
The factors underlying the interaction between sleep and COPD are highly complex, potentially involving the inflammation hypothesis,38 biochemical pathways,39 and genetic factors.40 While our study provides important insights into the relationship between sleep health (including duration and quality) and COPD, it underscores the need for future research to unravel these intricate mechanisms. Moving forward, multi-center, multi-sample big data research is essential to deepen our understanding of this association. In particular, future studies should prioritize longitudinal designs to establish temporal relationships and causality, mechanistic investigations to elucidate biological pathways, and interventional trials to assess whether improving sleep health mitigates COPD risk. Additionally, more granular analyses of pulmonary function, disease staging, and occupational exposures would further refine our knowledge. This study has several limitations. The cross-sectional design precludes causal inference, and self-reported data may introduce measurement bias. Despite adjusting for numerous confounders, residual confounding remains possible. While valuable, our reliance on secondary NHANES data imposes constraints—including missing variables, inconsistent definitions, and potential timeliness issues—that may affect generalizability. Future work should validate these findings using primary data or integrated datasets with standardized measures of sleep and COPD phenotypes. By addressing these gaps, researchers can advance this emerging field and inform strategies to reduce COPD risk through sleep-focused interventions.
Conclusion
By analyzing NHANES data from 2017 to 2023, an association was found between WSD of 8.5 to 14 hours per day and increased COPD risk. Clinically, it is advisable for physicians to inquire about sleep habits among individuals at high risk of COPD. From a public health perspective, in addition to the well-established risks of insufficient sleep, targeted health education initiatives could highlight the potential adverse effects of excessively prolonged sleep on pulmonary health among adult populations.
Highlights
- Weekday sleep duration is associated with an increased risk of COPD.
- The combination of DAG, VIF, and LASSO demonstrates superior variable selection capability, effectively avoiding overfitting and including irrelevant variables.
- Weekday sleep duration offer new guidance for preventing and treating COPD.
- Further clinical trials are needed to investigate the effectiveness of Weekday sleep duration.
Data Sharing Statement
All data from this study, whether generated or analyzed, are in this published article and its supplementary files.
Ethics Approval and Consent to Participate
Due to the de-identification of participants in the NHANES database, all participants in NHANES have written and signed the informed consent, consistent with and deemed by the National Center for Health Statistics Institutional Review Board (NCHSIRB) (Protocol #2021-05 Protocol #2018-01 Protocol #2011-17), the IRB of the study University (Guizhou Medical University) waived both IRB review and informed consent by the participants for the present study.
Funding
National Natural Science Foundation of China (82460015).
Disclosure
The authors have no relevant financial or non-financial interests to disclose in this work.
References
1. Liu J, Liu Y, Ma W, Tong Y, Zheng J. Temporal and spatial trend analysis of all-cause depression burden based on global burden of disease (GBD) 2019 study. Sci Rep. 2024;141(1):12346. doi:10.1038/s41598-024-62381-9
2. Global Initiative for Chronic Obstructive Lung Disease. Global strategy for the diagnosis, management, and prevention of chronic obstructive pulmonary disease (2025 report). 2024. Available from: https://goldcopd.org/wp-content/uploads/2024/11/GOLD-2025-Report-v1.0-15Nov2024_WMV.pdf.
3. Agusti A, Calverley PM, Celli B, et al. Characterisation of COPD heterogeneity in the ECLIPSE cohort. Respir Res. 2010;111(1):122. doi:10.1186/1465-9921-11-122
4. Sidhaye VK, Nishida K, Martinez FJ. Precision medicine in COPD: where are we and where do we need to go? Euro Resp Rev. 2018;27149. doi:10.1183/16000617.0022-2018
5. Stolz D, Mkorombindo T, Schumann DM, et al. Towards the elimination of chronic obstructive pulmonary disease: a Lancet Commission. Lancet. 2022;40010356:921–972. doi:10.1016/s0140-6736(22)01273-9
6. Miller A, Brown LK. Comments on “COPDGene 2019: redefining the diagnosis of chronic obstructive pulmonary disease”. Chron Obstructive Pulm Dis. 2020;72(2):79–81. doi:10.15326/jcopdf.7.2.2020.0134
7. Stanojevic S, Kaminsky DA, Miller MR, et al. ERS/ATS technical standard on interpretive strategies for routine lung function tests. Europ Resp J. 2022:601. doi:10.1183/13993003.01499-2021.
8. Watson NF, Badr MS, Belenky G, et al. Recommended amount of sleep for a healthy adult: a joint consensus statement of the American Academy of Sleep Medicine and Sleep Research Society. Sleep. 2015;386:843–844. doi:10.5665/sleep.4716
9. Svensson T, Saito E, Svensson AK, et al. Association of sleep duration with all- and major-cause mortality among adults in Japan, China, Singapore, and Korea. JAMA Network Open. 2021;49(9):e2122837. doi:10.1001/jamanetworkopen.2021.22837
10. Hirshkowitz M, Whiton K, Albert SM, et al. National sleep foundation’s sleep time duration recommendations: methodology and results summary. Sleep Health. 2015;11(1):40–43. doi:10.1016/j.sleh.2014.12.010
11. Pomeroy A, Pagan Lassalle P, Kline CE, Heffernan KS, Meyer ML, Stoner L. The relationship between sleep duration and arterial stiffness: a meta-analysis. Sleep Med Rev. 2023;70:101794. doi:10.1016/j.smrv.2023.101794
12. Smiley A, King D, Bidulescu A, Ghosh S. The association between sleep duration and metabolic syndrome: the NHANES 2013/2014. Nutrients. 2019;11(5):1111. doi:10.3390/nu11112582
13. Grandner M, Mullington JM, Hashmi SD, Redeker NS, Watson NF, Morgenthaler TI. Sleep duration and hypertension: analysis of > 700,000 adults by age and sex. J Clin Sleep Med. 2018;146:1031–1039. doi:10.5664/jcsm.7176
14. Kim W, Lee J, Ha J, et al. Association between sleep duration and subclinical thyroid dysfunction based on nationally representative data. J Clin Med. 2019;8(6):811. doi:10.3390/jcm8112010
15. Shan Z, Ma H, Xie M, et al. Sleep duration and risk of type 2 diabetes: a meta-analysis of prospective studies. Diabetes Care. 2015;383(3):529–537. doi:10.2337/dc14-2073
16. Kim BK, Kim BS, An SY, et al. Sleep duration and glycemic control in patients with diabetes mellitus: Korea national health and nutrition examination survey 2007-2010. J Korean Med Sci. 2013;289(9):1334–1339. doi:10.3346/jkms.2013.28.9.1334
17. Tan NYQ, Chew M, Tham YC, et al. Associations between sleep duration, sleep quality and diabetic retinopathy. PLoS One. 2018: 135:e0196399. doi:10.1371/journal.pone.0196399.
18. Koren D, Levitt Katz LE, Brar PC, Gallagher PR, Berkowitz RI, Brooks LJ. Sleep architecture and glucose and insulin homeostasis in obese adolescents. Diabetes Care. 2011;3411(11):2442–2447. doi:10.2337/dc11-1093
19. Åkerstedt T, Ghilotti F, Grotta A, Bellavia A, Lagerros YT, Bellocco R. Sleep duration, mortality and the influence of age. Eur J Epidemiol. 2017;3210(10):881–891. doi:10.1007/s10654-017-0297-0
20. van Dijk D, Balkau B, Segrestin B, et al. Associations between sleep duration and sleep debt with insulin sensitivity and insulin secretion in the EGIR-RISC Study. Diabetes Metabolism. 2019;454(4):375–381. doi:10.1016/j.diabet.2018.11.001
21. Park HM, Kwon YJ, Kim HS, Lee YJ. Relationship between sleep duration and osteoarthritis in middle-aged and older women: a nationwide population-based study. J Clin Med. 2019;83. doi:10.3390/jcm8030356
22. Pourmotabbed A, Ghaedi E, Babaei A, et al. Sleep duration and sarcopenia risk: a systematic review and dose-response meta-analysis. Sleep & Breathing = Schlaf & Atmung. 2020;244(4):1267–1278. doi:10.1007/s11325-019-01965-6
23. Duggan KA, Reynolds CA, Kern ML, Friedman HS. Childhood sleep duration and lifelong mortality risk. Health Psycholog. 2014;3310(10):1195–1203. doi:10.1037/hea0000078
24. Dong L, Xie Y, Zou X. Association between sleep duration and depression in US adults: a cross-sectional study. J Affective Disorders. 2022;296:183–188. doi:10.1016/j.jad.2021.09.075
25. Ruan Z, Li D, Cheng X, et al. The association between sleep duration, respiratory symptoms, asthma, and COPD in adults. Front Med. 2023;10:1108663. doi:10.3389/fmed.2023.1108663
26. McNicholas WT, Hansson D, Schiza S, Grote L. Sleep in chronic respiratory disease: COPD and hypoventilation disorders. Euro Resp Rev. 2019;28153. doi:10.1183/16000617.0064-2019
27. Mehra R, Tjurmina OA, Ajijola OA, et al. Research opportunities in autonomic neural mechanisms of cardiopulmonary regulation: a report from the national heart, lung, and blood institute and the national institutes of health office of the director workshop. JACC. 2022;73(3):265–293. doi:10.1016/j.jacbts.2021.11.003
28. Ortega Á, Duran P, Garrido B, et al. Specialized pro-resolving lipid mediators in pulmonary diseases: molecular and therapeutic implications. Molecules. 2025:3010. doi:10.3390/molecules30102212.
29. Sanchez-Azofra A, Gu W, Masso-Silva JA, et al. Inflammation biomarkers in OSA, chronic obstructive pulmonary disease, and chronic obstructive pulmonary disease/OSA overlap syndrome. J Clin Sleep Med. 2023;198:1447–1456. doi:10.5664/jcsm.10600
30. Lee JE, Nguyen HQ, Fan VS. Inflammatory markers and fatigue in individuals with moderate to severe chronic obstructive pulmonary disease. Nurs Res. 2024;731(1):54–61. doi:10.1097/nnr.0000000000000695
31. Wang YG, Lin C, Huang M, Fang XL, Chen GH, Ye SN. Overexpression of YKL40,IL-6, IL-8, TNF-α in tonsils and the role of YKL40 in childhood with obstructive sleep apnea syndrome. Sci Rep. 2024;141(1):26283. doi:10.1038/s41598-024-74402-8
32. Potter GD, Skene DJ, Arendt J, Cade JE, Grant PJ, Hardie LJ. Circadian rhythm and sleep disruption: causes, metabolic consequences, and countermeasures. Endoc Rev. 2016;376:584–608. doi:10.1210/er.2016-1083
33. Baranwal N, Yu PK, Siegel NS. Sleep physiology, pathophysiology, and sleep hygiene. Prog Cardiovasc Dis. 2023;77:59–69. doi:10.1016/j.pcad.2023.02.005
34. Han H, Wang Y, Li T, et al. Sleep duration and risks of incident cardiovascular disease and mortality among people with type 2 diabetes. Diabetes Care. 2023;461(1):101–110. doi:10.2337/dc22-1127
35. Liu Y, Yin J, Li X, Yang J, Liu Y. Examining the connection between weekend catch-up sleep and depression: insights from 2017 to 2020 NHANES information. J Affective Disorders. 2024;358:61–69. doi:10.1016/j.jad.2024.05.022
36. Naranjo M, Willes L, Prillaman BA, Quan SF, Sharma S. Undiagnosed OSA may significantly affect outcomes in adults admitted for COPD in an inner-city hospital. Chest. 2020;1583(3):1198–1207. doi:10.1016/j.chest.2020.03.036
37. Lu C, Liao B, Nie J, Wang W, Wang Y. The association between sleep duration and chronic diseases: a population-based cross-sectional study. Sleep Med. 2020;73:217–222. doi:10.1016/j.sleep.2020.05.005
38. Lamont EW, Legault-Coutu D, Cermakian N, Boivin DB. The role of circadian clock genes in mental disorders. Dialogues Clin Neurosci. 2007;93(3):333–342. doi:10.31887/DCNS.2007.9.3/elamont
39. Bolger GB, Uversky VN. Therapeutic targets and precision medicine In COPD: inflammation, ion channels, both, or neither? Int J Mol Sci. 2023;24(3):2424. doi:10.3390/ijms242417363
40. Wang T, Duan W, Jia X, et al. Associations of combined phenotypic ageing and genetic risk with incidence of chronic respiratory diseases in the UK Biobank: a prospective cohort study. Europ Resp J. 2024:632. doi:10.1183/13993003.01720-2023.
 © 2025 The Author(s). This work is published and licensed by Dove Medical Press Limited. The
full terms of this license are available at https://www.dovepress.com/terms
and incorporate the Creative Commons Attribution
- Non Commercial (unported, 4.0) License.
By accessing the work you hereby accept the Terms. Non-commercial uses of the work are permitted
without any further permission from Dove Medical Press Limited, provided the work is properly
attributed. For permission for commercial use of this work, please see paragraphs 4.2 and 5 of our Terms.
© 2025 The Author(s). This work is published and licensed by Dove Medical Press Limited. The
full terms of this license are available at https://www.dovepress.com/terms
and incorporate the Creative Commons Attribution
- Non Commercial (unported, 4.0) License.
By accessing the work you hereby accept the Terms. Non-commercial uses of the work are permitted
without any further permission from Dove Medical Press Limited, provided the work is properly
attributed. For permission for commercial use of this work, please see paragraphs 4.2 and 5 of our Terms.