Back to Journals » Journal of Multidisciplinary Healthcare » Volume 18
Nonlinear Association Between Red Cell Distribution Width-to-Albumin Ratio and Retinopathy: A Cross-Sectional Study
Received 28 March 2025
Accepted for publication 24 July 2025
Published 5 August 2025 Volume 2025:18 Pages 4691—4701
DOI https://doi.org/10.2147/JMDH.S530939
Checked for plagiarism Yes
Review by Single anonymous peer review
Peer reviewer comments 2
Editor who approved publication: Professor Charles V Pollack
Jinjin Gu,1,2 Shanhu Qiu,3 Zilin Sun1
1Department of Endocrinology, Zhongda Hospital, Institute of Diabetes, School of Medicine, Southeast University, Nanjing, People’s Republic of China; 2Department of Geriatrics, The Affiliated People’s Hospital of Jiangsu University, Zhenjiang, People’s Republic of China; 3Department of General Practice, Zhongda Hospital, Institute of Diabetes, School of Medicine, Southeast University, Nanjing, People’s Republic of China
Correspondence: Shanhu Qiu, Department of General Practice, Zhongda Hospital, Institute of Diabetes, School of Medicine, Southeast University, No. 87 Dingjiaqiao, Nanjing, 210009, People’s Republic of China, Fax +86-025-83262810, Email [email protected] Zilin Sun, Department of Endocrinology, Zhongda Hospital, Institute of Diabetes, School of Medicine, Southeast University, No. 87 Dingjiaqiao, Nanjing, 210009, People’s Republic of China, Email [email protected]
Purpose: The red cell distribution width-to-albumin ratio (RAR), a marker of systemic inflammation and nutritional status, has been associated with diabetic retinopathy. However, its relationship with retinopathy in a nationally representative sample of US adults aged 40 and older, including both diabetic and nondiabetic individuals, and the potential nonlinear association remains underexplored.
Patients and Methods: This cross-sectional study included 4,753 adults aged 40 and older from the National Health and Nutrition Examination Survey (NHANES) 2005– 2008. Retinopathy was evaluated through fundus photography and classified based on the Early Treatment Diabetic Retinopathy Study (ETDRS) grading protocol. Nonlinear associations between RAR and retinopathy risk were evaluated using generalized additive models, with a two-piecewise linear regression employed to identify the inflection point.
Results: The prevalence of retinopathy increased with higher quartiles of RAR (P < 0.001). A nonlinear association was identified, with an inflection point at 3.14. Below this inflection point, each 1-unit increase in RAR was associated with approximately 2.69 times higher odds of retinopathy (OR = 3.69; 95% CI: 1.37– 9.96). Above the inflection point, the association plateaued (OR = 1.14; 95% CI: 0.60– 2.14). Participants in the highest RAR quartile had 56% higher odds of retinopathy compared to those in the lowest quartile (OR = 1.56; 95% CI: 1.16– 2.11).
Conclusion: RAR exhibits a nonlinear association with retinopathy and may serve as a risk stratification tool in clinical and public health settings.
Keywords: red cell distribution width-to-albumin ratio, retinopathy, nonlinear threshold effects, cross-sectional study
Introduction
Retinopathy, a microvascular complication marked by damage to the retinal vasculature, is a leading cause of visual impairment worldwide.1 Among its subtypes, diabetic retinopathy (DR) is the most prevalent, affecting approximately 28.5% of individuals with diabetes in the United States.2 The pathogenesis of DR is primarily driven by hyperglycemia-induced metabolic dysregulation, which encompasses oxidative stress, inflammation, and the accumulation of advanced glycation end-products.3 However, retinopathy can also occur in non-diabetic populations through mechanisms such as vascular occlusion, inflammation, and degenerative changes, as observed in conditions including retinal vein occlusion, age-related macular degeneration, and hypertension.4,5 With the increasing global burden of chronic diseases and aging populations, the prevalence of retinopathy is expected to rise, highlighting the urgent need for reliable biomarkers and early detection strategies to enable timely intervention and prevention.6
The red cell distribution width-to-albumin ratio (RAR), calculated as the ratio of red cell distribution width (RDW) to serum albumin, has been recognized as a marker of systemic inflammation and nutritional status.7,8 This is supported by evidence that RDW reflects chronic inflammation, oxidative stress, and hematologic disorders. In contrast, hypoalbuminemia serves as an indicator of malnutrition and systemic inflammation.9,10 Emerging evidence suggests that elevated RAR is associated with increased risks of adverse health outcomes, including poorer prognosis in sepsis, DR, and higher mortality rates—both all-cause and cause-specific.11–15 Despite these associations, the relationship between RAR and retinopathy remains unclear, especially considering that the pathogenesis of retinopathy involves oxidative stress, inflammation, and nutritional deficiencies.16–18
We therefore conducted this study to evaluate the association between RAR and retinopathy in a nationally representative sample of US adults aged 40 years and older, including both diabetic and non-diabetic individuals, with a specific focus on investigating potential nonlinear relationships.
Materials and Methods
Design
This study utilized publicly available, anonymized data from the National Health and Nutrition Examination Survey (NHANES), a nationally representative, cross-sectional dataset designed to evaluate the health and nutritional status of the US population. The NHANES protocols were reviewed and approved by the Institutional Review Board of the National Center for Health Statistics. Written informed consent was obtained from all participants prior to data collection.19
In accordance with the Measures for the Ethical Review of Life Science and Medical Research Involving Human Subjects issued by China on February 18, 2023, this research qualifies for exemption under Article 32 (1) and (2), as it involves the analysis of publicly accessible, anonymized data. An ethical exemption was granted by the Affiliated People’s Hospital of Jiangsu University (Approval No. 2025-Exempt-2).
Inclusion and Exclusion Criteria
We analyzed pooled data from the 2005–2008 NHANES cycles, as these were the only cycles that included objective fundus photography for all participants aged 40 years and older. The initial sample consisted of 7,081 individuals in this age group. Participants were included if they had complete data on both retinopathy and RAR. Exclusion criteria included missing retinopathy data (n=1,377), missing RAR data (n=251), pregnancy (n=2), history of cancer or malignancies (n=675), and RAR outliers, defined as values exceeding the mean by more than four standard deviations (n=23). After applying these criteria, the final analytic sample comprised 4,753 participants (Refer to Figure 1 for the flowchart illustration). It is essential to note that, due to the limited availability of data on other potential confounders, such as liver disease, infections, or causes of anemia, these factors were not systematically evaluated.
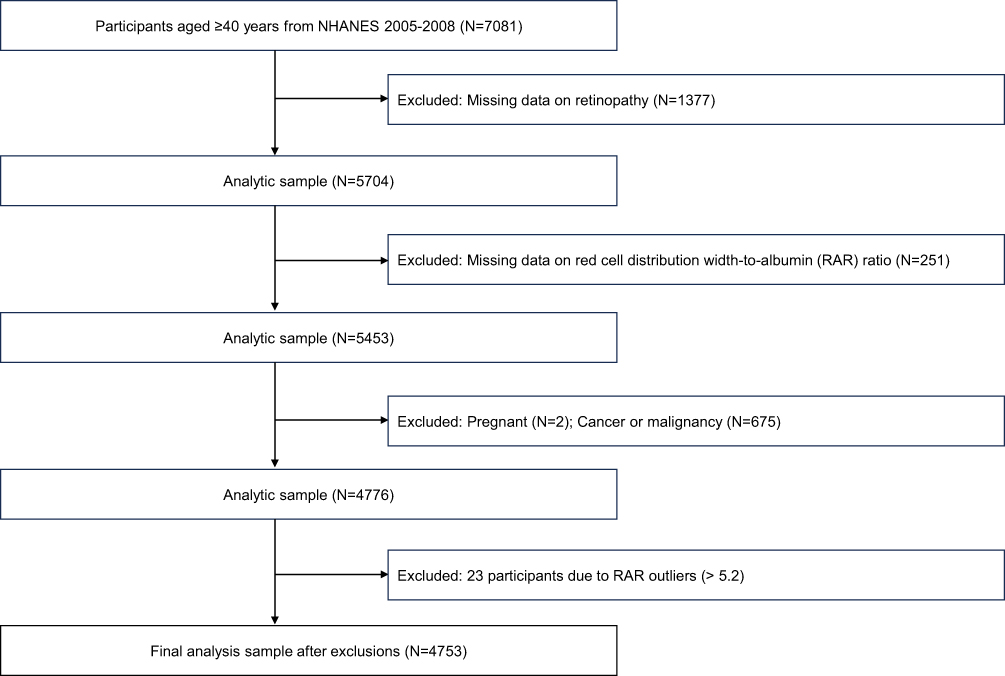 |
Figure 1 Flow diagram of participant selection in the NHANES Study. |
Assessment of Retinopathy
Retinopathy was evaluated using standardized fundus photography with the Canon CR6-45NM ophthalmic digital imaging system. Participants were excluded from retinal imaging if they met any of the following criteria: (1) bilateral blindness with open eyes, (2) active ocular infections, or (3) bilateral eye patches. Imaging was performed in a dimly lit environment following NHANES protocol guidelines. Two non-mydriatic 45-degree digital images per eye were obtained—one centered on the macula and another on the optic disc—to ensure comprehensive retinal assessment.
Images were transmitted to the University of Wisconsin Ophthalmic Epidemiology Research Center for centralized grading and quality control. Retinal status was classified according to the Early Treatment Diabetic Retinopathy Study (ETDRS) grading protocol.20 Retinopathy was defined as the presence of at least one microaneurysm or hemorrhage, with or without more advanced lesions (ETDRS severity level ≥14).21 Participants meeting these criteria were categorized as having retinopathy; all others were classified as having non-retinopathy.
Measurement of RAR
Hematological parameters, including RDW, were measured from peripheral blood specimens collected according to NHANES standardized procedures at the Mobile Examination Centers. Complete blood counts were analyzed using Beckman Coulter instruments, initially with the MAXM system from 2005 to 2006 and subsequently with the HMX system from 2007 to 2008. Both analyzers utilize impedance technology combined with flow cytometry to assess blood cell counts and red blood cell volume heterogeneity, ensuring consistency and comparability across survey cycles.
Serum albumin concentrations were determined using the bromocresol purple (BCP) assay, following NHANES Laboratory Procedures Manual guidelines. Between 2005 and 2007, analyses were performed on Beckman Synchron LX20 analyzers. In 2008, the Beckman Coulter UniCel DxC800 system was used. Both analyzers employ bichromatic digital endpoint methods, where albumin binds to BCP reagent under alkaline conditions to form a blue complex, with absorbance measured photometrically at 600 nm.
The red cell distribution width-to-albumin ratio (RAR) was calculated as

All laboratory analyses adhered to the procedures outlined in the NHANES Laboratory Procedures Manual to ensure accuracy and reliability.
Covariate Definitions
Demographic characteristics were defined according to NHANES operational protocols and validated in the literature. Race/ethnicity was categorized as non-Hispanic White, non-Hispanic Black, or Hispanic (including Mexican American and other Hispanic subgroups) due to limited sample sizes in other racial groups.22 Smoking status was classified into three categories based on self-report: current smokers, ex-smokers, and never-smokers. Never-smokers were defined as individuals who reported having smoked fewer than 100 cigarettes in their lifetime.23 The poverty-income ratio (PIR) was stratified into three categories: ≤1 (at or below the federal poverty threshold), >1 to ≤3 (above the poverty threshold up to three times that amount), and >3 (more than three times the federal poverty threshold).24
Glucose metabolism status was classified into diabetes, prediabetes, and normal glucose regulation according to the criteria established by the American Diabetes Association (ADA).25 Diabetes was defined by any of the following: fasting plasma glucose (FPG) ≥126 mg/dL (7.0 mmol/L); 2-hour plasma glucose (PBG) ≥200 mg/dL (11.1 mmol/L) following a 75-g oral glucose tolerance test; glycated hemoglobin (HbA1c) ≥6.5%; or a self-reported diagnosis of diabetes, indicated by a positive response to the question, “Ever been told by a doctor or health professional that you have diabetes.” The use of antidiabetic medications was also considered. Prediabetes was classified based on FPG values of 100–125 mg/dL (5.6–6.9 mmol/L), PBG of 140–199 mg/dL (7.8–11.0 mmol/L), or HbA1c of 5.7–6.4%, in the absence of a diagnosis of diabetes. Participants who did not meet the criteria for diabetes or prediabetes were considered to have normal glucose regulation.
Hypertension was diagnosed based on the criteria outlined by the European Society of Hypertension.26 Participants were classified as hypertensive if their mean systolic and diastolic blood pressures, obtained from three consecutive readings during the examination, were ≥140/90 mmHg. Additionally, self-reported diagnosis was considered; participants who responded “Yes” to the question “Ever been told by a doctor or health professional that you have high blood pressure” were also classified as hypertensive. The use of antihypertensive medications was taken into account when determining the diagnosis.
Hyperlipidemia was diagnosed according to the National Cholesterol Education Program Adult Treatment Panel III (NCEP ATP III) guidelines.27 A participant was considered to have hyperlipidemia if they met any of the following criteria: total cholesterol ≥200 mg/dL (≥5.17 mmol/L); high-density lipoprotein (HDL) cholesterol <40 mg/dL (<1.03 mmol/L); triglycerides ≥150 mg/dL (≥1.69 mmol/L); or low-density lipoprotein (LDL) cholesterol ≥130 mg/dL (≥3.36 mmol/L); or a self-reported diagnosis, indicated by a response of “Ever told by a doctor or health professional that you have high cholesterol level.”
Cardiovascular disease (CVD) was defined as a self-reported diagnosis by a healthcare professional of myocardial infarction, stroke, congestive heart failure, coronary heart disease, or angina. Any positive response was regarded as confirmation of CVD.28
Statistical Analysis
All sample weights were calculated in accordance with the official guidelines for the NHANES survey.29 Participants were stratified into quartiles (Q1–Q4) based on their RAR level. Continuous variables are presented as weighted means with standard errors (SE), and categorical variables are presented as weighted percentages with SE. Differences between groups were assessed using one-way analysis of variance (ANOVA) for continuous variables and chi-square tests for categorical variables, with adjustments made for the complex survey design.
To evaluate the association between RAR and retinopathy, multivariable logistic regression models were applied with three nested adjustment levels: Model 1 (unadjusted), Model 2 (adjusted for age, sex, and race/ethnicity), and Model 3 (further adjusted for PIR, smoking status, BMI, glucose metabolism status, hypertension, hyperlipidemia, and CVD. All analyses incorporated survey weights and design variables to produce nationally representative estimates.
To investigate potential nonlinear associations between RAR levels and retinopathy risk, generalized additive models (GAMs) with smoothing splines were utilized, adjusting for all covariates included in Model 3. To identify potential thresholds, a two-piecewise linear regression model was fitted with the inflection point (K) estimated via maximum likelihood. The significance of nonlinear relationships was evaluated through a likelihood ratio test comparing the segmented model with a simple linear model (P<0.05 indicating significant non-linearity). Bootstrap resampling with 1,000 iterations was performed to derive confidence intervals for the estimated inflection point and assess its stability.
Subgroup analyses were conducted with stratification to evaluate effect modification by key covariates: age groups (40–60 years vs ≥60 years), sex, race/ethnicity (non-Hispanic White, non-Hispanic Black, Hispanic), PIR categories (≤1, >1 and ≤3, >3), smoking status (never, former, current), BMI categories (≤25, >25 and <30, ≥30 kg/m²), glucose metabolism status (normal, prediabetes, diabetes), hypertension (yes/no), hyperlipidemia (yes/no), and CVD (yes/no). Interaction tests between RAR and these variables were performed to evaluate effect modification.
Sensitivity analyses were conducted using multiple imputations by chained equations to handle missing data, incorporating dummy variables for missingness.30
All statistical analyses were performed using R software (version 4.2.0) and EmpowerStats (X&Y Solutions, Inc., Boston, Massachusetts). Threshold analyses were implemented using the segmented package. A two-sided P-value < 0.05 was considered statistically significant.
Results
Baseline Characteristics by RAR Quartiles
Table 1 summarizes the weighted baseline characteristics of 4,753 participants, with a mean age of 55.49 years and a female proportion of 51.8%. The mean RAR was 3.05 (interquartile range: 2.7 to 3.64), with significant differences across quartiles (P < 0.001). Participants in higher RAR quartiles exhibited notable variations in several clinical parameters. For instance, red cell distribution width (RDW) increased significantly from a median of 12.11% in Q1 to 14.10% in Q4 (P < 0.001), while serum albumin levels decreased from 4.50 g/dL to 3.88 g/dL across the same quartiles (P < 0.001). In terms of ocular health, the prevalence of retinopathy rose progressively from 6.44% in Q1 to 14.03% in Q4 (P < 0.001).
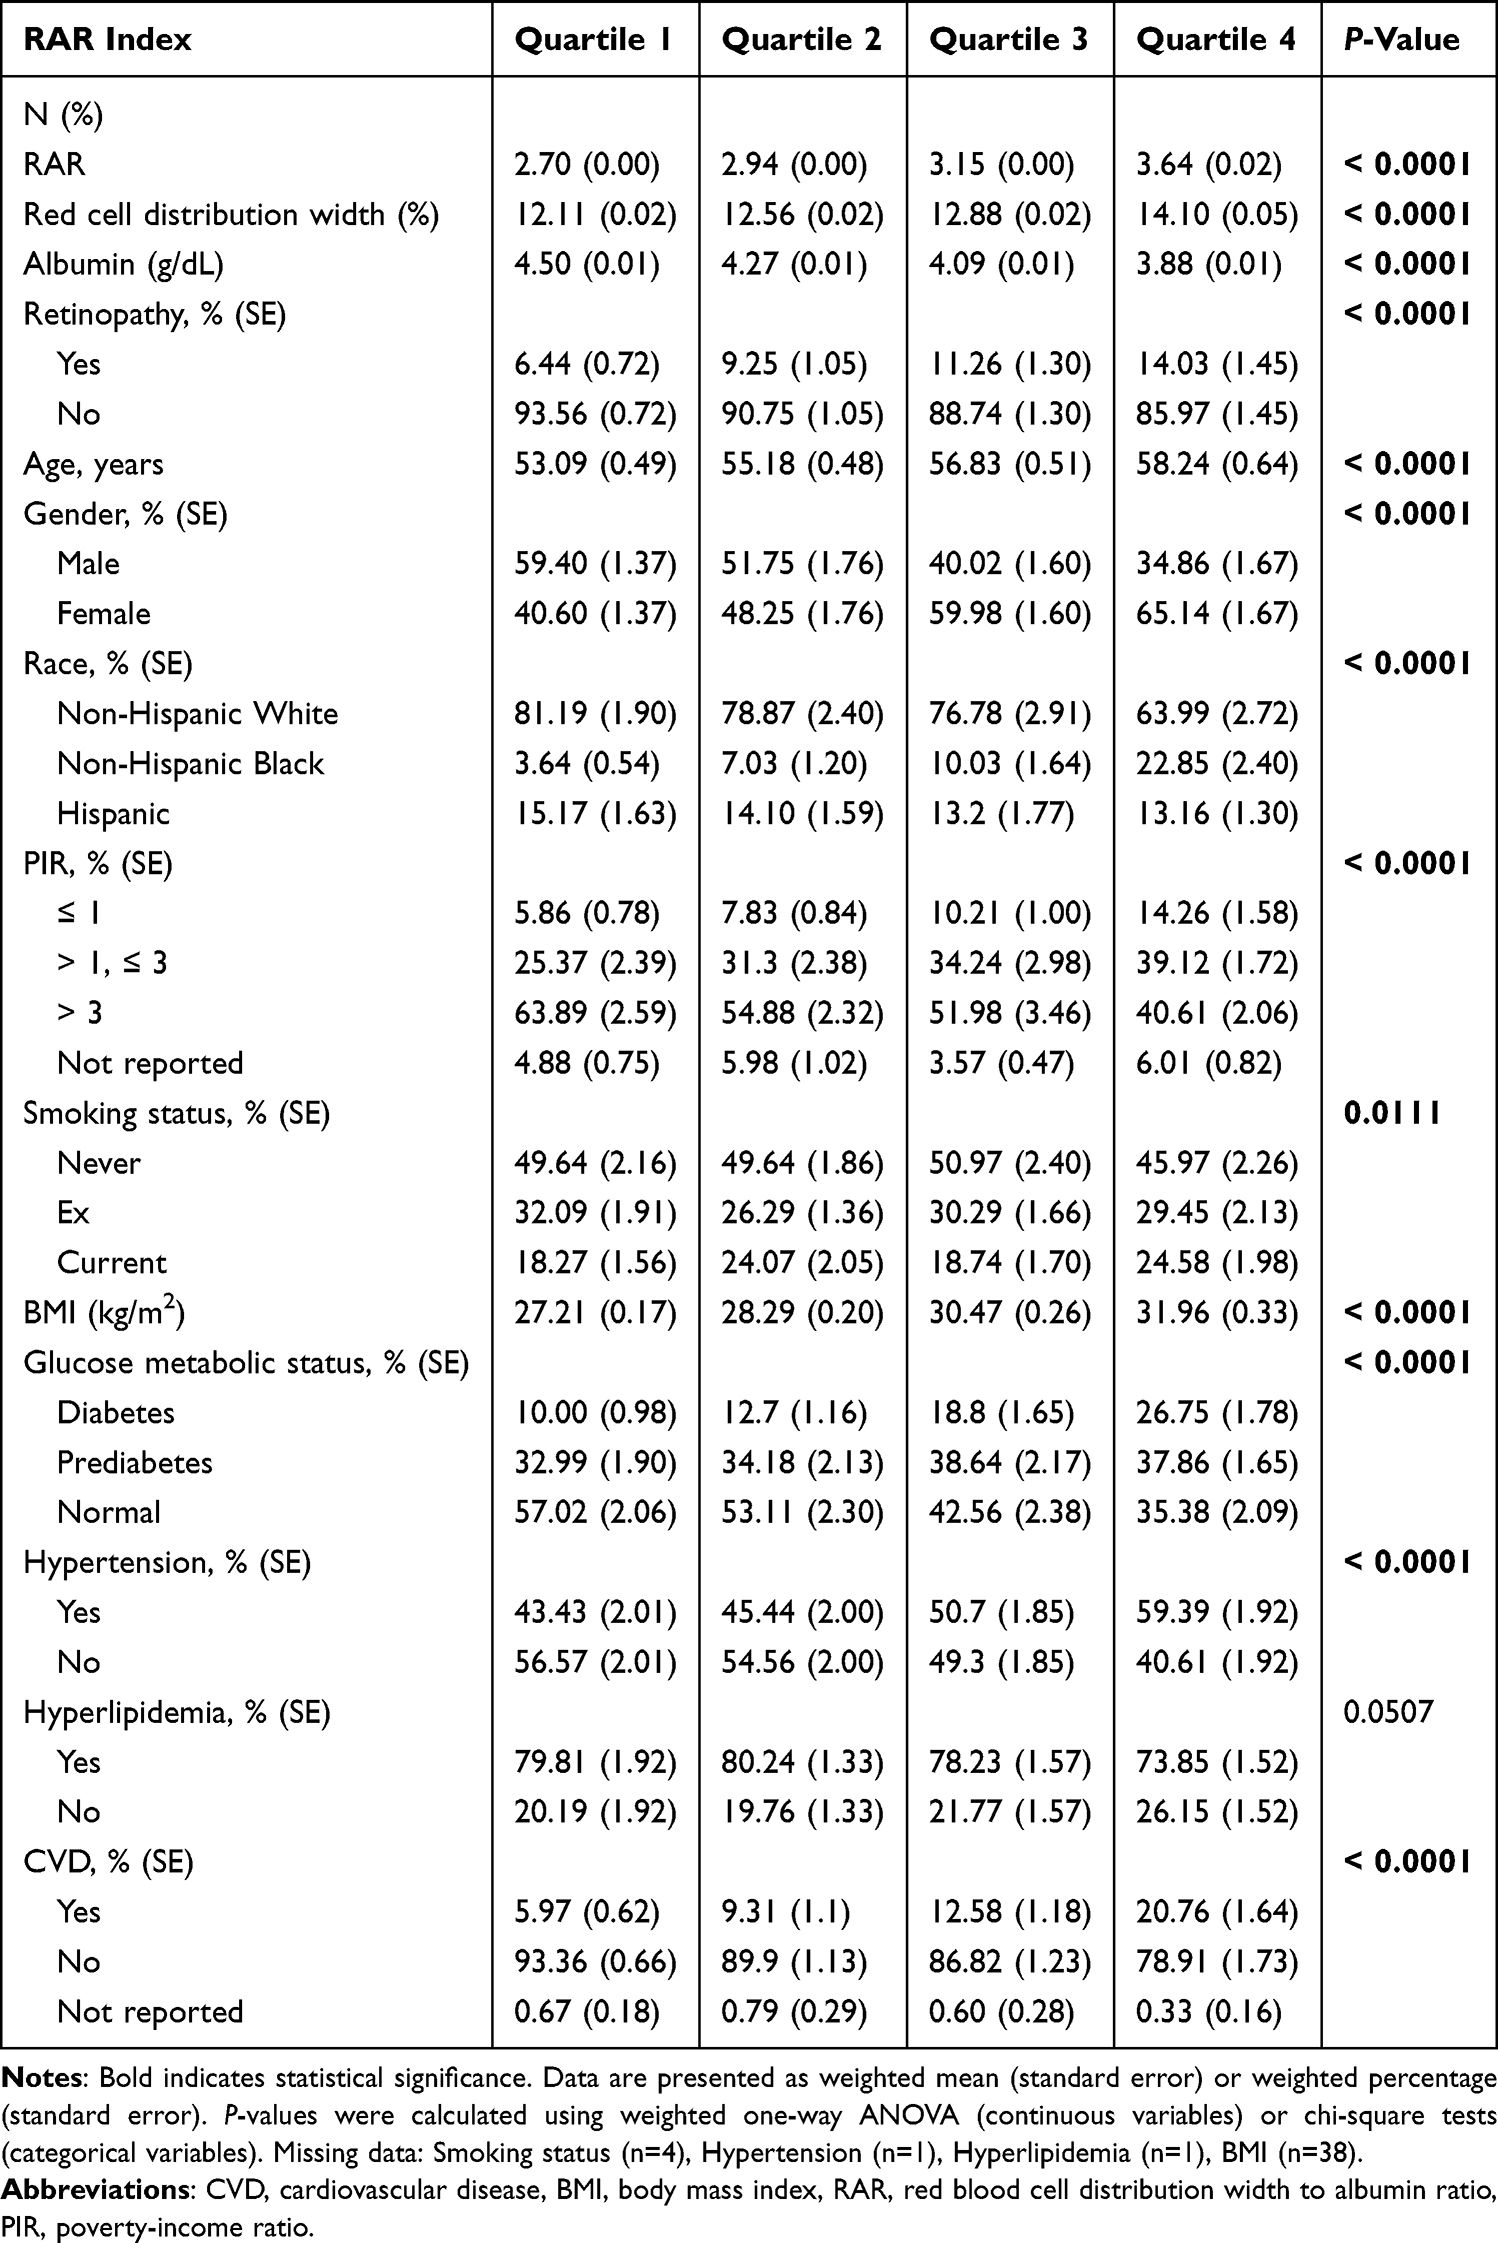 |
Table 1 Weighted Baseline Characteristics of Participants Stratified by RAR Quartiles: NHANES 2005–2008 |
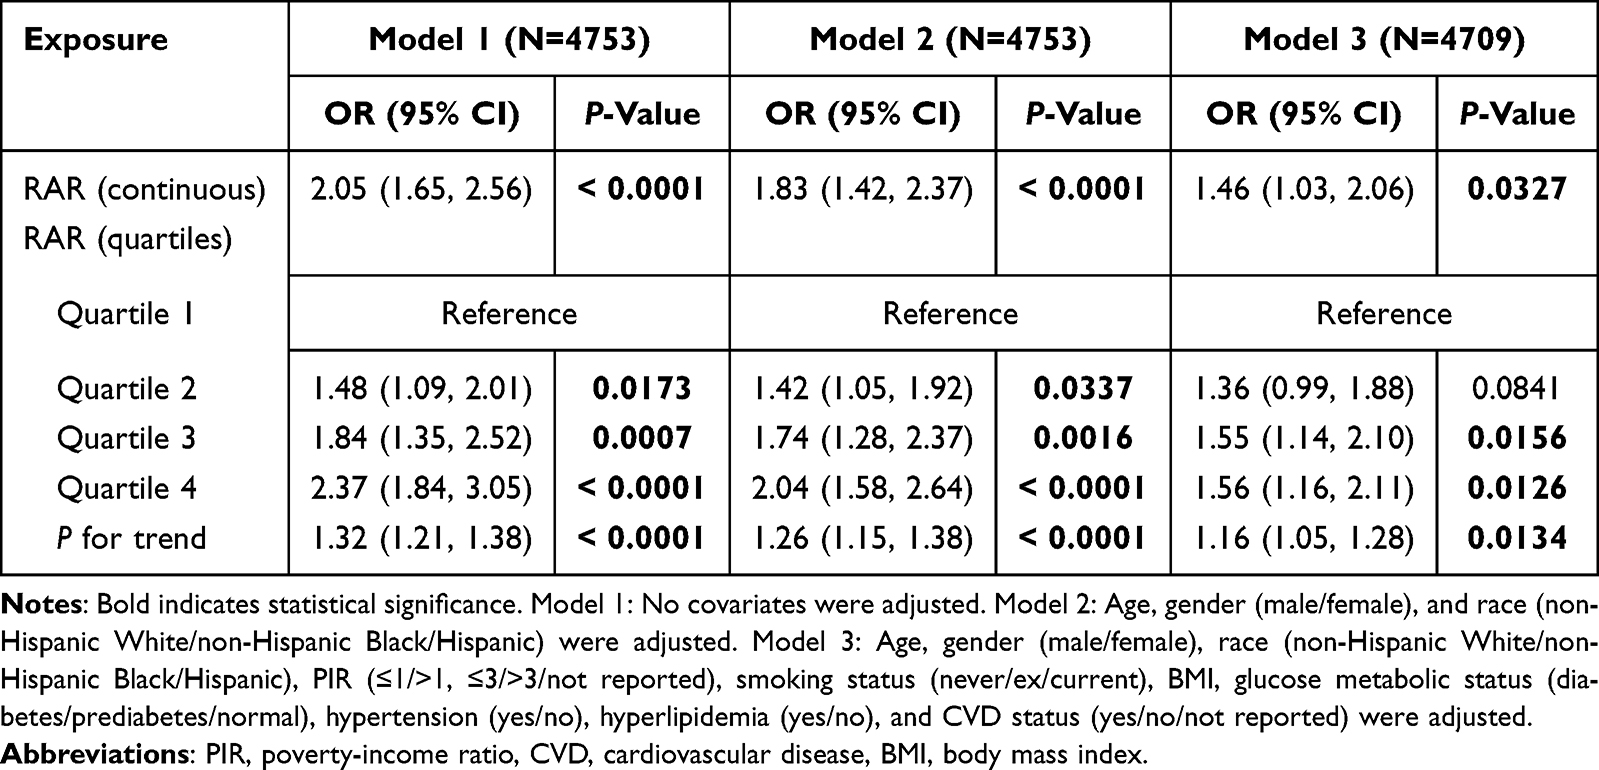 |
Table 2 Weighted Multivariable Logistic Regression Analysis of the Association Between RAR and Retinopathy Risk |
Several demographic and clinical characteristics also varied significantly with RAR levels. The proportions of older adults, females, and non-Hispanic Black individuals increased notably across the quartiles (all P < 0.001). Sociodemographic factors such as lower PIR and adverse metabolic profiles—including higher BMI and higher prevalence of diabetes, hypertension, and CVD—were more common in participants in Q4 (all P < 0.05). Conversely, the prevalence of hyperlipidemia did not differ significantly across quartiles (P > 0.05).
Supplementary Table 1. details the clinical parameters stratified by disease status (diabetes, hypertension, hyperlipidemia). Participants diagnosed with these conditions exhibited significantly worse metabolic and blood pressure profiles compared to those without such diagnoses (all P < 0.001). For example, individuals with diabetes showed elevated HbA1c and fasting plasma glucose levels, whereas hypertensive participants had higher systolic blood pressure relative to normotensive individuals (P < 0.001).
Association Between RAR and Retinopathy
Table 2 displays the results of multivariable logistic regression analyses examining the relationship between RAR and retinopathy. Consistently, higher RAR levels were associated with increased odds of retinopathy across all models (P < 0.05). After full adjustment for demographic, socioeconomic, and clinical covariates, each 1-unit increase in RAR was associated with a 46% higher likelihood of retinopathy (OR = 1.46; 95% CI: 1.03–2.06). Participants in the highest RAR quartile (Q4) had 56% higher odds of retinopathy compared to those in the lowest quartile (Q1) (OR = 1.56; 95% CI: 1.16–2.11). Although the ORs tended to increase progressively across RAR quartiles, the relatively minor difference between the ORs for Q3 and Q4 suggested a potential nonlinear association, warranting further investigation into the linearity of this relationship.
Nonlinear Relationship and Threshold Effects
The generalized additive model (GAM) revealed a significant nonlinear association between RAR and the probability of retinopathy after comprehensive multivariable adjustment (P = 0.0031), which was visually supported by the curve shown in Figure 2. Further segmented regression analysis identified an inflection point at a RAR value of 3.14 (95% CI: 3.05–3.21; Table 3). Below this threshold, each one-unit increase in RAR was associated with a markedly higher risk of retinopathy (adjusted odds ratio [aOR] = 3.69; 95% CI: 1.37–9.96; P = 0.0018). In contrast, RAR values above this inflection point did not exhibit a statistically significant association with retinopathy risk (aOR = 1.14; 95% CI: 0.60–2.14; P = 0.6652). The likelihood ratio test demonstrated that the segmented model provided a significantly better fit than a simple linear model (P = 0.037).
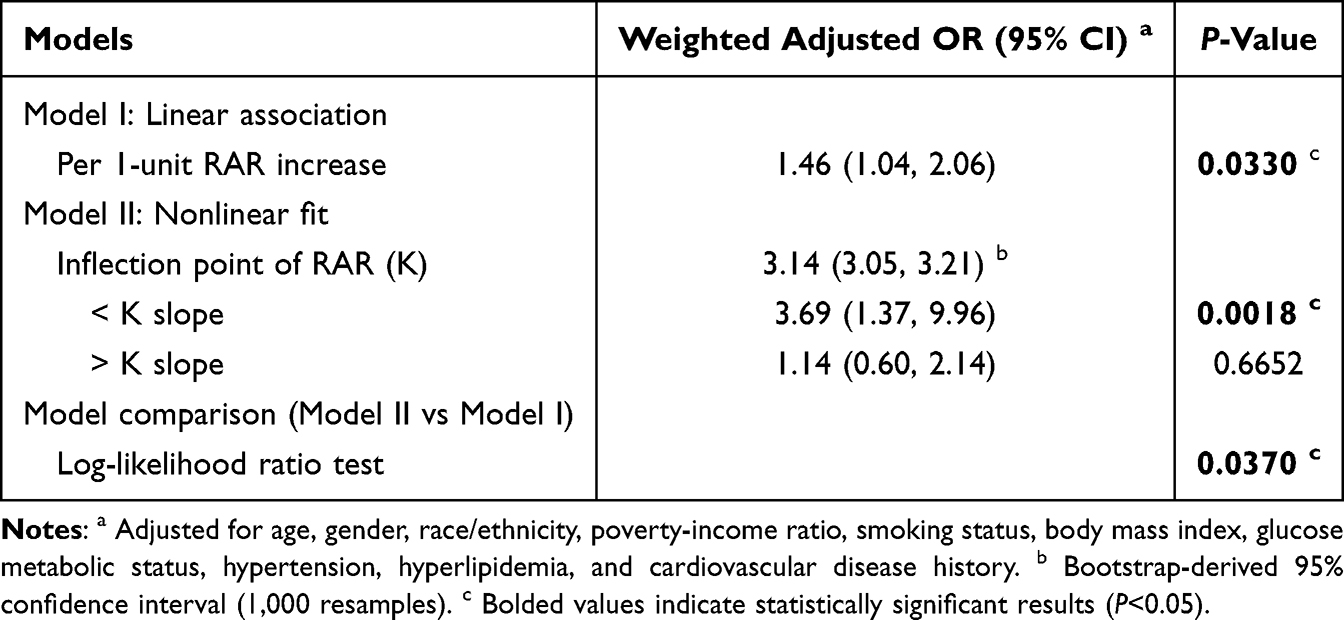 |
Table 3 Threshold Effect Analysis of RAR on Retinopathy Probability |
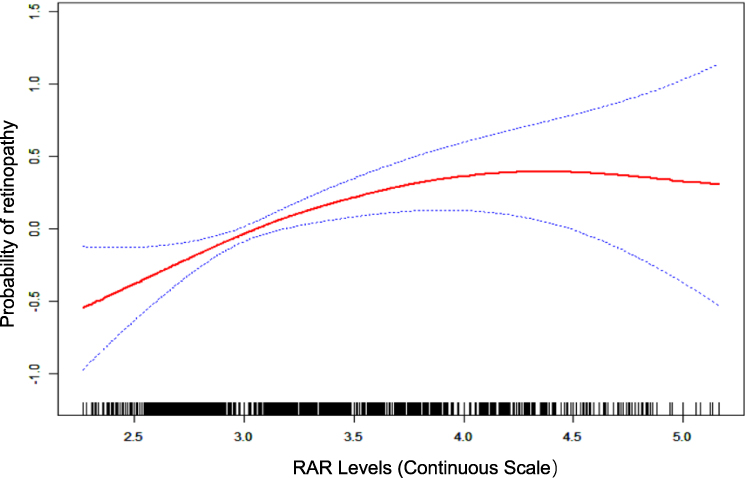 |
Figure 2 Non-linear association between RAR and probability of retinopathy after adjustment for age, sex, race, PIR, smoking, BMI, glucose metabolic status, hypertension, hyperlipidemia, and CVD history. The red solid line indicates the estimated predicted probability of retinopathy obtained from a spline-smoothed model, while the blue dashed lines represent the 95% pointwise confidence intervals. |
Subgroup Analysis and Interaction Effects
The forest plot in Figure 3 illustrates the consistent association between RAR and retinopathy across various demographic and clinical subgroups. The observed relationship remained largely stable among different age groups (40–60 years vs ≥60 years), sexes (male vs female), racial/ethnic groups (non-Hispanic White, non-Hispanic Black, Hispanic), smoking statuses (never, ex-smoker, current smoker), hypertension status (yes/no), history of CVD (yes/no), hyperlipidemia (yes/no), and glucose metabolic states (diabetes, prediabetes, normal).
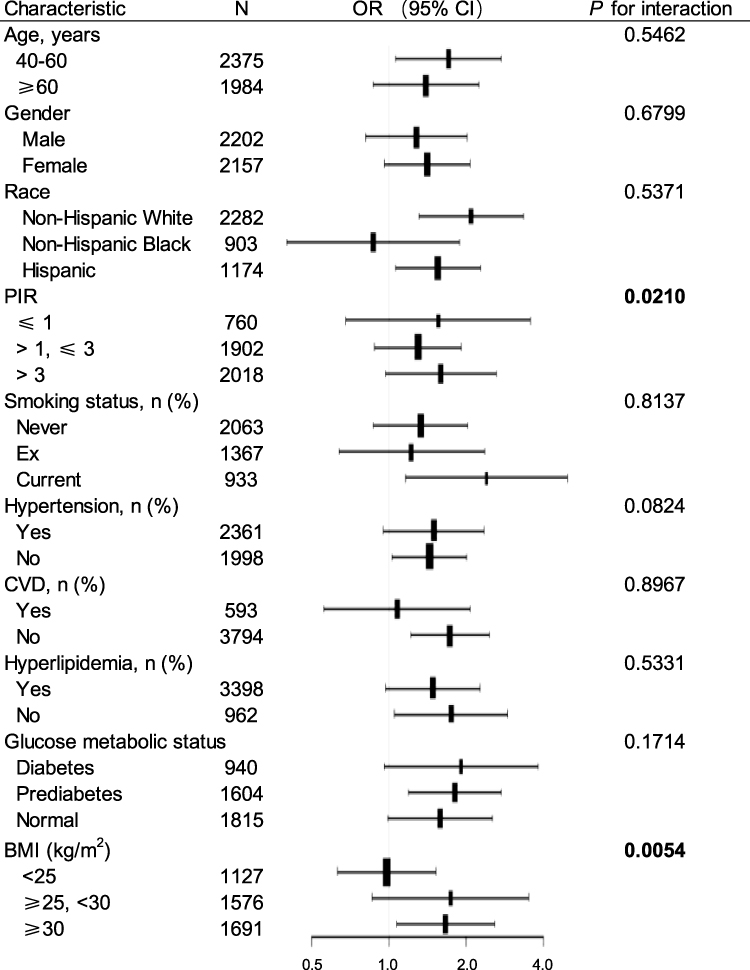 |
Figure 3 Forest plot of pooled subgroup analyses assessing the association between RAR and retinopathy risk. Adjusted for age, gender, race, PIR, smoking, BMI, glucose metabolic status, hypertension, hyperlipidemia, and CVD, excluding the stratified variable. Significant interactions are highlighted in bold. |
Notably, as shown in Figure 3, significant effect modifications were identified for BMI (P for interaction = 0.0054) and PIR (P for interaction = 0.021). The association between RAR and retinopathy appeared to strengthen with increasing BMI categories, with odds ratios (OR) approximating 1.0 among normal-weight individuals and rising to approximately 1.7 among overweight or obese participants. Similarly, socioeconomic stratification revealed heightened risks at both lower (OR = 1.56) and higher income levels (OR = 1.59) compared to middle-income groups. These findings suggest that body size and socioeconomic status may modify the impact of RAR on retinopathy risk, potentially reflecting underlying biological and social determinants.
Sensitivity Analysis of RAR-Related Threshold Effect on Retinopathy
Sensitivity analyses across all five multiply imputed datasets consistently confirmed a nonlinear threshold effect of RAR on the risk of retinopathy. The identified inflection point remained stable at RAR = 3.14 in all datasets (Supplementary Tables 2–6). Below this threshold, increases in RAR were significantly associated with higher odds of retinopathy; above this point, the association was not statistically significant. These results reinforce the robustness of the threshold effect observed in the primary analysis, indicating that the nonlinear relationship between RAR and retinopathy is consistent and resilient to potential bias arising from missing data.
Discussion
This study utilized data from NHANES 2005–2008 to investigate the nonlinear association between RAR and retinopathy. Our results identified a threshold effect of RAR on retinopathy risk, indicating its potential utility in risk stratification across diverse populations. The association was robust across multiple demographic and metabolic subgroups (Figure 3), and significant interactions with BMI and PIR suggest these factors may modify this relationship.
The threshold at RAR = 3.14 (Table 3) appears to represent a pivotal “biological tipping point” where accumulated inflammatory and nutritional deficits may overwhelm physiological compensatory mechanisms, thereby accelerating retinal microvascular damage. Below this threshold, each 1-unit increase in RAR was associated with approximately 2.69 times higher odds of retinopathy (Figure 2). These findings align with prior research linking elevated RDW to oxidative stress and low serum albumin to endothelial dysfunction.31,32 Similar nonlinear or J-shaped relationships involving RAR have been reported in other conditions, such as erectile dysfunction.33
The underlying pathophysiological mechanisms may involve systemic inflammation and oxidative stress, leading to endothelial dysfunction and disruption of the blood-retinal barrier.11,34 RDW values have been significantly elevated in patients with DR, and higher RDW levels are associated with an increased risk of developing DR.35 Hypoalbuminemia, which reflects both malnutrition and systemic inflammation, further compromises vascular integrity and promotes the development of macular edema.36,37 The combined effect of these factors, represented by the RAR, may synergistically impair retinal microcirculation, particularly in individuals with metabolic or socioeconomic vulnerabilities.
Subgroup analyses further found that both BMI and PIR significantly modified the relationship between RAR and the odds of retinopathy (Figure 3). While the exact biological mechanisms underlying these interactions warrant further investigation, existing evidence suggests that obesity and socioeconomic status influence retinopathy risk through distinct yet potentially overlapping pathways. Elevated BMI is associated with increased systemic inflammation, oxidative stress, and endothelial dysfunction, which can exacerbate microvascular injury.5,38,39 As a result, individuals with a higher BMI may exhibit a heightened susceptibility to microvascular damage, as reflected by elevated RAR levels. On the other hand, individuals in lower-income groups often encounter barriers such as limited healthcare access, suboptimal nutrition, and environmental stressors, all of which contribute to chronic systemic inflammation and microvascular injury. Conversely, higher-income populations may face risks associated with sedentary lifestyles, unhealthy dietary patterns, and exposure to pollution—factors that can also induce vascular inflammation and oxidative stress,40,41 as depicted in Figure 3. The observed synergistic effects of elevated BMI and RAR levels suggest that metabolic, inflammatory, and socioeconomic factors may jointly influence the pathogenesis of retinopathy. These findings highlight the importance of considering both biological and social determinants when assessing individual risk profiles for microvascular complications.
Our findings extend previous research linking elevated RAR to diabetic retinopathy13 by highlighting its potential utility as a risk stratification tool beyond diabetic populations. Utilizing GAM, we identified a nonlinear, threshold-dependent relationship between RAR and the risk of retinopathy. The incorporation of objective fundoscopic examinations minimized measurement bias, thereby strengthening the validity and robustness of our results.
Several limitations should be acknowledged. The cross-sectional design limits causal inference, underscoring the need for prospective longitudinal studies to establish temporal relationships. The exclusion of extreme RAR values (>5.2) may lead to an underestimation of effects in more severely ill populations. Additionally, our sample was restricted to adults aged 40 years and older in the United States, and unmeasured confounders, such as liver disease or infections, may have influenced RAR levels. Furthermore, some variables, including a history of CVD, were self-reported, which may introduce recall bias.
Emerging evidence suggests that interventions targeting inflammation and nutritional status slow the progression of retinopathy and improve clinical outcomes.42,43 Given the robust association between RAR and retinopathy demonstrated in this study, future research should explore whether modulation of RAR through lifestyle interventions or pharmacological approaches may serve as effective strategies for preventing or delaying retinal microvascular damage. Large-scale, multicenter, prospective cohort studies are crucial for validating RAR as a reliable biomarker for retinopathy risk across diverse populations. Additionally, longitudinal studies are crucial for establishing causal relationships and identifying threshold values that can guide clinical prevention and intervention strategies. Addressing these knowledge gaps will advance our understanding and promote the development of targeted, individualized therapies to improve patient outcomes.
Conclusion
In conclusion, RAR exhibits a nonlinear, threshold-dependent relationship with retinopathy in adults aged 40 and older. These findings deepen our understanding of the intricate relationship between systemic inflammation, nutritional status, and microvascular health. RAR has the potential to serve as a valuable indicator for risk stratification and may inform future clinical and public health strategies aimed at preventing and detecting retinal vascular diseases early.
Acknowledgments
The authors would like to thank the staff and participants of the NHANES study for their invaluable contributions. Additionally, we acknowledge the assistance of the Sider tool in improving the language and readability of the initial draft of this manuscript.
Funding
This study was partly supported by the Research Personnel Cultivation Program of Zhongda Hospital, Southeast University (CZXM-GSP-RC115).
Disclosure
The authors report no conflicts of interest in this work.
References
1. Steinmetz JD, Bourne RRA, Briant PS. GBD. 2019 blindness and vision impairment collaborators, vision loss expert group of the global burden of disease study. causes of blindness and vision impairment in 2020 and trends over 30 years, and prevalence of avoidable blindness in relation to VISION 2020: the right to sight: an analysis for the global burden of disease study. Lancet Glob Health. 2021;9(2):e144–e160. doi:10.1016/S2214-109X(20)30489-7
2. Aguayo-Mazzucato C, Diaque P, Hernandez S, Rosas S, Kostic A, Caballero AE. Understanding the growing epidemic of type 2 diabetes in the Hispanic population living in the United States. Diabetes Metab Res Rev. 2019;35(2):e3097. doi:10.1002/dmrr.3097
3. Seo H, Park S-J, Song M. Diabetic Retinopathy (DR): mechanisms, current therapies, and emerging strategies. Cells. 2025;14(5):376. doi:10.3390/cells14050376
4. Venkatramani J, Mitchell P. Ocular and systemic causes of retinopathy in patients without diabetes mellitus. BMJ. 2004;328(7440):625–629. doi:10.1136/bmj.328.7440.625
5. van Leiden HA, Dekker JM, Moll AC, et al. Blood pressure, lipids, and obesity are associated with retinopathy: the hoorn study. Diabetes Care. 2002;25(8):1320–1325. doi:10.2337/diacare.25.8.1320
6. ElSayed NA, Aleppo G, Bannuru RR. American diabetes association professional practice committee, 12. retinopathy neuropathy, and foot care: standards of care in diabetes—2024. Diabetes Care. 2024;47(Suppl 1):S231–S243. doi:10.2337/dc24-S012
7. Cai Y, Zhang Y, Zhou N, et al. Association between red blood cell distribution width-to-albumin ratio and prognosis in post-cardiac arrest patients: data from the MIMIC-IV database. Front Cardiovasc Med. 2024;11:1499324. doi:10.3389/fcvm.2024.1499324
8. Tan Y, Li Y, Huang X, et al. The ratio of red blood cell distribution width to albumin as a predictor for rehospitalization risk and rehospitalization all-cause mortality in middle-aged and elderly survivors with sepsis: an ambispective ICU cohort study. J Inflamm Res. 2024;17:1227–1240. doi:10.2147/JIR.S451769
9. Zurauskaite G, Meier M, Voegeli A, et al. Biological pathways underlying the association of red cell distribution width and adverse clinical outcome: results of a prospective cohort study. PLoS One. 2018;13(1):e0191280. doi:10.1371/journal.pone.0191280
10. Rahmiyanti L, Rasyid H, Taslim NA, As’Ad S, Bukhari A, Aminuddin A. Nutritional status associated to red cell distribution width, length of stay, and clinical outcome patient with chronic kidney diseases. Macedonian J Med Sci. 2022;10(A):7. doi:10.3889/oamjms.2022.8173
11. Hao M, Jiang S, Tang J, et al. Ratio of red blood cell distribution width to albumin level and risk of mortality. JAMA Network Open. 2024;7(5):e2413213. doi:10.1001/jamanetworkopen.2024.13213
12. Gu YL, Yang D, Huang ZB, Chen Y, Dai ZS. Relationship between red blood cell distribution width-to-albumin ratio and outcome of septic patients with atrial fibrillation: a retrospective cohort study. BMC Cardiovasc Disord. 2022;22(1):538. doi:10.1186/s12872-022-02975-1
13. Zhao F, Liu M, Kong L. Association between red blood cell distribution width-to-albumin ratio and diabetic retinopathy. J Clin Lab Anal. 2022;36(4):e24351. doi:10.1002/jcla.24351
14. Chen X, Luo Y, Liu S. Association between red cell distribution width to albumin ratio and all-cause mortality in patients with acute pancreatitis admitted to the intensive care unit: a retrospective study based on the MIMIC-IV database. Front Med. 2025;12:1503378. doi:10.3389/fmed.2025.1503378
15. He Q, Hu S, Xie J, Liu H, Li C. The red blood cell distribution width to albumin ratio was a potential prognostic biomarker for acute respiratory failure: a retrospective study. BMC Med Inform Decis Mak. 2024;24(1):253. doi:10.1186/s12911-024-02639-4
16. Wei W, Lin R, Li S, et al. malnutrition is associated with diabetic retinopathy in patients with type 2 diabetes. J Diabetes Res. 2023;2023:1613727. doi:10.1155/2023/1613727
17. Zeng GQ, Yao YF, Zhong JB, et al. The non-linear relationship between serum albumin and diabetic retinopathy in type 2 diabetes mellitus: a secondary analysis based on a cross-sectional study. BMC Ophthalmol. 2024;24(1):94. doi:10.1186/s12886-024-03348-2
18. Liu X, Chang Y, Li Y, et al. Oxidative stress and retinopathy: evidence from epidemiological studies. J Transl Med. 2025;23(1):94. doi:10.1186/s12967-025-06110-4
19. Zipf G, Chiappa M, Porter KS, Ostchega Y, Lewis BG, Dostal J. National health and nutrition examination survey: plan and operations, 1999-2010. Vital Health Stat. 2013;(56):1–37.
20. Early Treatment Diabetic Retinopathy Study Research Group. Grading diabetic retinopathy from stereoscopic color fundus photographs--an extension of the modified Airlie House classification. ETDRS report number 10. Ophthalmology. 1991;98(5 Suppl):786–806. doi:10.1016/S0161-6420(13)38012-9
21. Zhu Z, Wang W, Scheetz J, Zhang J, He M. Prevalence and risk profile of retinopathy in non-diabetic subjects: national health and nutrition examination survey 2005 to 2008. Clin Exp Ophthalmol. 2019;47(9):1173–1181. doi:10.1111/ceo.13595
22. Nwanyanwu K, Nunez-Smith M, Gardner TW, Desai MM. Awareness of diabetic retinopathy: insight from the national health and nutrition examination survey. Am J Prev Med. 2021;61(6):900–909. doi:10.1016/j.amepre.2021.05.018
23. Xu J, Han X, Chen Q, et al. Association between sarcopenia and prediabetes among non-elderly US adults. J Endocrinol Invest. 2023;46(9):1815–1824. doi:10.1007/s40618-023-02038-y
24. Becker DJ, Oloya J, Ezeamama AE. Household socioeconomic and demographic correlates of cryptosporidium seropositivity in the United States. PLoS Negl Trop Dis. 2015;9(9):e0004080. doi:10.1371/journal.pntd.0004080
25. ElSayed NA, Aleppo G, Bannuru RR. American Diabetes Association Professional Practice Committee. 2. diagnosis and classification of diabetes: standards of care in diabetes—2024. Diabetes Care. 2024;47(Suppl 1):S20–S42. doi:10.2337/dc24-S002
26. Mancia G, Kreutz R, Brunström M, et al. 2023 ESH guidelines for the management of arterial hypertension the task force for the management of arterial hypertension of the European Society of Hypertension: endorsed by the International Society of Hypertension (ISH) and the European Renal Association (ERA). J Hypertens. 2023;41(12):1874–2071. doi:10.1097/HJH.0000000000003480
27. Panel on Detection, Evaluation, and Treatment of High Blood Cholesterol in Adults E. Executive summary of the third report of The National Cholesterol Education Program (NCEP) expert panel on detection, evaluation, and treatment of high blood cholesterol in adults (adult treatment panel III). JAMA. 2001;285(19):2486–2497. doi:10.1001/jama.285.19.2486
28. Wang Q, Xi L, Yang N, et al. Association of leukocyte telomere length with risk of all-cause and cardiovascular mortality in middle-aged and older individuals without cardiovascular disease: a prospective cohort study of NHANES 1999-2002. Aging Clin Exp Res. 2024;36(1):131. doi:10.1007/s40520-024-02773-z
29. Johnson CL, Paulose-Ram R, Ogden CL, et al. National health and nutrition examination survey: analytic guidelines, 1999-2010. Vital Health Stat. 2013;(161):1–24.
30. Austin PC, White IR, Lee DS, van Buuren S. missing data in clinical research: a tutorial on multiple imputation. Can J Cardiol. 2021;37(9):1322–1331. doi:10.1016/j.cjca.2020.11.010
31. Wu MY, Yiang GT, Lai TT, Li CJ. The oxidative stress and mitochondrial dysfunction during the pathogenesis of diabetic retinopathy. Oxid Med Cell Longev. 2018;2018:3420187. doi:10.1155/2018/3420187
32. Kang Q, Yang C. Oxidative stress and diabetic retinopathy: molecular mechanisms, pathogenetic role and therapeutic implications. Redox Biol. 2020;37:101799. doi:10.1016/j.redox.2020.101799
33. Xu Y, Li S. J-Shaped relationship between the red cell distribution width to albumin ratio and erectile dysfunction: a cross-sectional study from NHANES 2001-2004. Front Endocrinol. 2025;16:1545272. doi:10.3389/fendo.2025.1545272
34. Semeraro F, Morescalchi F, Cancarini A, Russo A, Rezzola S, Costagliola C. Diabetic retinopathy, a vascular and inflammatory disease: therapeutic implications. Diabetes Metab. 2019;45(6):517–527. doi:10.1016/j.diabet.2019.04.002
35. Ma Y, Li S, Zhang A, et al. Association between red blood cell distribution width and diabetic retinopathy: a 5-year retrospective case-control study. J Ophthalmol. 2021;2021:6653969. doi:10.1155/2021/6653969
36. Sharif A, Smith DR, Hellgren KJ, Jendle J. Diabetic retinopathy among the elderly with type 2 diabetes: a Nationwide longitudinal registry study. Acta Ophthalmol. 2024;102(6):e883–e892. doi:10.1111/aos.16659
37. Misirocchi F, Quintard H, Rossetti AO, et al. Hypoalbuminemia in status epilepticus is a biomarker of short- and long-term mortality: a 9-year cohort study. Eur J Neurol. 2025;32(1):e16573. doi:10.1111/ene.16573
38. Scanlon G, Loughman J, Farrell D, McCartney D. A review of the putative causal mechanisms associated with lower macular pigment in diabetes mellitus. Nutr Res Rev. 2019;32(2):247–264. doi:10.1017/S095442241900012X
39. Gao D, Bing C, Griffiths HR. Disrupted adipokine secretion and inflammatory responses in human adipocyte hypertrophy. Adipocyte. 2025;14(1):2485927. doi:10.1080/21623945.2025.2485927
40. Bryl A, Mrugacz M, Falkowski M, Zorena K. The effect of diet and lifestyle on the course of diabetic retinopathy-a review of the literature. Nutrients. 2022;14(6):1252. doi:10.3390/nu14061252
41. Markeviciute A, Huang-Lung J, Zemaitiene R, Grzybowski A. A review of ambient air pollution as a risk factor for posterior segment ocular diseases. J Clin Med. 2023;12(11):3842. doi:10.3390/jcm12113842
42. Li LH, Lee JC, Leung HH, Lam WC, Fu Z, Lo A. Lutein supplementation for eye diseases. Nutrients. 2020;12(6):1721. doi:10.3390/nu12061721
43. Xu J, Shen R, Qian M, et al. Obtusin ameliorates diabetic retinopathy by inhibiting oxidative stress and inflammation. Psychopharmacology. 2024;241(12):2471–2484. doi:10.1007/s00213-024-06689-4
 © 2025 The Author(s). This work is published and licensed by Dove Medical Press Limited. The
full terms of this license are available at https://www.dovepress.com/terms
and incorporate the Creative Commons Attribution
- Non Commercial (unported, 4.0) License.
By accessing the work you hereby accept the Terms. Non-commercial uses of the work are permitted
without any further permission from Dove Medical Press Limited, provided the work is properly
attributed. For permission for commercial use of this work, please see paragraphs 4.2 and 5 of our Terms.
© 2025 The Author(s). This work is published and licensed by Dove Medical Press Limited. The
full terms of this license are available at https://www.dovepress.com/terms
and incorporate the Creative Commons Attribution
- Non Commercial (unported, 4.0) License.
By accessing the work you hereby accept the Terms. Non-commercial uses of the work are permitted
without any further permission from Dove Medical Press Limited, provided the work is properly
attributed. For permission for commercial use of this work, please see paragraphs 4.2 and 5 of our Terms.