")
Back to Journals » Medical Devices: Evidence and Research » Volume 16
Noninvasive Point of Care Device for Assessing Cardiac Response to Acute Volume Changes
Authors Silber HA , Gilotra NA, Miller TL
Received 25 April 2023
Accepted for publication 4 October 2023
Published 26 October 2023 Volume 2023:16 Pages 219—227
DOI https://doi.org/10.2147/MDER.S416845
Checked for plagiarism Yes
Review by Single anonymous peer review
Peer reviewer comments 2
Editor who approved publication: Dr Scott Fraser
Harry A Silber,1 Nisha A Gilotra,1 Thomas L Miller2,3
1Department of Medicine, Division of Cardiology, Johns Hopkins University School of Medicine, Baltimore, MD, USA; 2Enalare Therapeutics, Inc, Princeton, NJ, USA; 3Department of Pediatrics, Sidney Kimmel Medical College, Thomas Jefferson University, Philadelphia, PA, USA
Correspondence: Harry A Silber, Johns Hopkins Bayview Medical Center, Cardiology Suite 2400, 301 Building, 4940 Eastern Avenue, Baltimore, MD, 21224, USA, Tel +1 410 550 5717, Fax +1 410 550 0012, Email [email protected]
Purpose: The change in the amplitude of a peripheral pulse in response to a Valsalva maneuver has diagnostic utility for assessing volume status at the bedside. We have developed a device to automatically quantify the Valsalva pulse response (VPR) to a standardized Valsalva maneuver that the device guides a user to perform. In this study, we sought to determine whether VPR by the device, Indicor, is sensitive enough to detect the acute increase in central pressure and volume load that occurs with a passive leg raise (PLR) in healthy volunteers.
Methods: Healthy volunteers were tested semirecumbently at 45 degrees, then again after being leaned back on a pivoted wedge with legs raised at 45 degrees and torso and head flat, and then again in the semirecumbent position. The device recorded a finger photoplethysmography (PPG) signal during a 10-second expiratory effort of 20 mmHg as guided by the device. VPR was automatically calculated as the ratio of the end-Valsalva pulse amplitude to the baseline pulse amplitude.
Results: In the 30 participants who completed testing, VPR increased from baseline to PLR in every participant, from 0.34 ± 0.13 to 0.60 ± 0.14 (p < 0.0001). Back upright, VPR decreased back to 0.33 ± 0.10 (p < 0.0001 versus PLR; NS versus baseline position).
Conclusion: In this proof-of-concept study of healthy participants, the Indicor device, a noninvasive, convenient device that automatically calculates VPR from a finger photoplethysmography signal during a standardized Valsalva maneuver, was sensitive enough to detect the increase in VPR that occurred with an acute central volume load from a PLR. Future studies should examine whether VPR responds differently to a PLR in heart failure patients with abnormal cardiac performance and/or congestion.
Plain Language Summary: It is often important clinically to determine whether there has been a change in the volume of fluid in the heart and chest (known as central volume). We have developed a noninvasive technique for assessing changes in central volume. The technique involves measuring the change in blood volume in a fingertip while a person blows into a closed tube for 10 seconds. An index is calculated from the change in fingertip blood volume. In this study, we measured this index before and after a central volume change in healthy participants. We produced an increase in central volume in the participants by changing their position from legs flat and head elevated, to legs elevated and head flat. Thirty participants successfully completed testing. In all participants, the index increased when they changed position to legs up and head down. Thus, this technique can detect an acute increase in central volume. Future studies should examine whether the index can detect longer-term changes in central volume in patients with abnormal heart conditions such as heart failure.
Keywords: Valsalva maneuver, photoplethysmography, filling pressure, fluid volume, passive leg raise, fluid load, pulse amplitude
Introduction
It is important in many clinical settings to assess changes in thoracic volume status, including detecting the development of subclinical congestion in chronic heart failure patients.1 However, physical exam findings may be insensitive to these changes.2–4 It has been established since the 1940s and 1950s that assessing the changes in arterial pressure pulse amplitude during a Valsalva maneuver helps with assessing central volume/filling pressure status.5–8 Normally during a Valsalva maneuver, the increased thoracic pressure limits venous return, which leads to a decreased arterial pulse amplitude. In patients who develop congestion, the higher filling pressure and central volume are less affected by the increased thoracic pressure of a Valsalva maneuver. Therefore, the Valsalva-induced change in pulse amplitude from baseline is less, or there may be no change at all. The Valsalva-induced change in pulse amplitude has been quantified as a ratio of the end-Valsalva pulse amplitude to the baseline pulse amplitude, called Pulse Amplitude Ratio, or, as will be expressed here, Valsalva Pulse Response (VPR). An increase in VPR reflects an increase in central volume/filling pressure, and a decrease in central volume/filling pressure is reflected in a decrease in VPR.
Unfortunately, no convenient, noninvasive system is available for automatically quantifying the pulse amplitude response to a standardized Valsalva maneuver. Hence, we have developed a noninvasive, convenient, point-of-care device, Indicor, which records the change in pulse amplitude of a finger photoplethysmography (PPG) signal during a Valsalva maneuver.9–12 The Indicor guides the user to perform a standardized Valsalva maneuver. We have shown that VPR obtained using the Indicor decreases with a procedure that decreases central volume/filling pressure – a session of hemodialysis.13 In this proof-of-concept study of healthy participants, we investigated whether the Indicor is sensitive enough to detect a change in VPR with a procedure that increases central volume/filling pressure – a passive leg raise (PLR).
Materials and Methods
The study was approved by the Advarra Institutional Review Board (Advarra ID: Pro00028641) and complies with the Declaration of Helsinki. Written informed consent was obtained from all participants. Healthy volunteers without a history of hypertension, cardiovascular disease, or cerebrovascular disease were enrolled. Exclusion criteria were weight <88 pounds (40 kg) or symptomatic bradycardia.
Indicor Device and Test
Following informed consent, participants were trained to execute the Indicor test using the Indicor device (Vixiar Medical, Baltimore, Maryland). Then they were positioned, and allowed to rest for 5 minutes to equilibrate before testing. Three consecutive Indicor tests were administered with 5 minutes allowed for achieving equilibrium between each test. As shown in Figure 1, Test 1 (Baseline: BL) was performed in the 45° upright posture, Test 2 was performed in the PLR posture (PLR; supine with legs at passive 45° elevation) and Test 3 was performed again in the 45° upright posture (Recovery; REC).
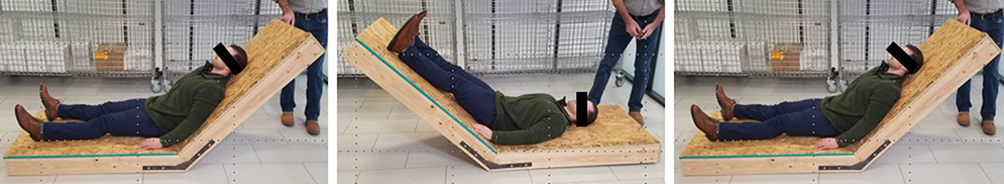 |
Figure 1 Positioning for the Three Indicor Tests and the PLR Test Bench. Participants were administered three consecutive Indicor tests separated by 5 minutes in the postural order shown from left to right. Test 1 (Baseline: BL) was in the 45° upright posture, Test 2 was done in the PLR posture (PLR; supine with legs at passive 45° elevation), Test 3 was done again in the 45° upright posture (Recovery; REC). The bench is constructed to easily rock participants between the 45° upright (left) and PLR (middle) postures. |
Intra-abdominal hypertension can affect the PLR challenge because the increased abdominal weight can squeeze the inferior vena cava in the raised-leg position.14,15 As such, precaution was taken to ensure that intra-abdominal pressure was not a confounding factor for the PLR. All studies were completed before the lunchtime meal and two hours following a no-more-than a light to moderate breakfast.
The Indicor consists of a hand piece and a tablet computer (Figure 2). A disposable mouth piece is attached to an expiratory pressure transducer on the hand piece. A finger PPG probe is connected to the hand piece. The expiratory pressure signal and the finger PPG signal are wirelessly transmitted to the tablet. The tablet runs a software application (Navigator App) with a graphical user interface for automatically guiding the user to perform a Valsalva maneuver for 10 seconds at an expiratory effort of 20 mmHg. We have previously demonstrated that most cardiac patients can successfully complete this Valsalva effort.12 The Navigator software then calculates VPR as the ratio of the last pulse amplitude during the Valsalva maneuver to an average of baseline pulses (ie, resting pulses before each Valsalva begins).
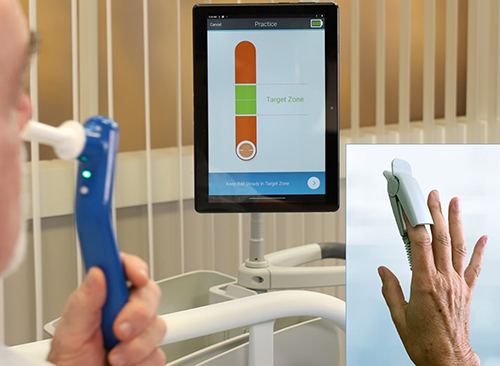 |
Figure 2 Indicor device. The user holds a hand piece with a disposable mouthpiece filter connected to an expiratory pressure sensor. A photoplethysmography (PPG) probe connected to the hand piece is placed on a finger of the other hand. The expiratory pressure and PPG signals are wirelessly input into the tablet, which automatically guides the user through a 10-second Valsalva maneuver at 20 mmHg effort, and then calculates the Valsalva Pulse Response (VPR). |
Each Indicor test consisted of a practice session for the participant to learn the correct Valsalva maneuver, followed by at least three efforts. Each effort consisted of 20 seconds of resting data collection, a 5-second window with no data collection to allow for movement as the patient is instructed to lift the hand piece toward the mouth, a 10-second Valsalva maneuver, and 15 seconds of post maneuver data collection. Efforts were separated by a 30-second countdown timer, allowing at least 60 seconds between the Valsalva maneuvers. Additional Valsalva efforts were directed by the automated Navigator software if device logics detected signal interference during a sequence; for example, motion artifact, ectopy, and light interference. If a Valsalva effort had already begun when an interference logic was triggered, the 30-second countdown timer was also implemented prior to restarting the effort. The Indicor’s final output value was the average of the VPR’s for the three efforts. Blinding was achieved by configuring the Navigator software to show no results at the time of testing.
Testing Protocol
The participants were instructed to sit still and limit motion and talking through the entire protocol, including the rest/equilibrium periods. For the entire protocol, the participants were seated on a custom-made test bench with their buttocks comfortably at the juncture where the bench creates the 45° angle (Figure 1). Participants started in the upright posture and remained there, except for when the study administrators tipped them back into the PLR position. The participants did not move or actively participate in the postural changes. A small pillow was placed under the head for comfort so that the head could remain back and not be held up. Another small pillow was placed under the arm to which the PPG sensor was affixed such that the hand sat at the anterior thigh level just distal to the waist. The test administrators performed all the operations on the tablet and held the tablet directly in line with the participants’ face at a suitable distance for visualization during each test effort.
Baseline (BL) Condition
After remaining in the test position as described above for a 5-minute stabilization period, the baseline test was administered. A short practice of no more than 10 sec was performed as the first step in test execution.
Passive Leg Raising (PLR) Condition
Because each of the three efforts within one Indicor test takes approximately 40 to 50 seconds for all data collection, including 25 to 40 seconds of data collected before the Valsalva begins, a separate and individual PLR maneuver was performed for each of the three efforts so that the hemodynamic response was not dissipated. The design of the test bench (Figure 1) was such that the participants could be easily rocked between postures. The participant began on the bench in the upright posture (BL/REC posture) and a 5-minute equilibrium period was allowed before beginning the PLR challenges.
When ready to begin, the participant was rocked into the PLR posture and the button was pressed on the Navigator App to begin the test. After the Navigator screen showed that the 10-second Valsalva effort was complete and approximately 8 to 10 seconds had passed for the collection of post-Valsalva data, the participant was returned (rocked back) to the upright posture.
The participant remained in the upright posture during the rest period countdown between efforts. Immediately before the countdown reached zero, with approximately 4 seconds left on the countdown timer, the participant was rocked back to the PLR position for the start of the second and then third efforts.
Recovery (REC) Condition
Following completion of the PLR challenge condition, the participant was returned to the upright posture (BL equivalent) and given a 5-minute period to attain equilibrium. Following the period of equilibrium, the participant executed another Indicor test.
Statistical Analysis
The primary outcome was the change in VPR from BL/REC to PLR, with each participant serving as their own control. A paired t-test was used to compare the variables before and after a change in position. Correlations between variables were estimated using Spearman correlation coefficient. MedCalc® Statistical Software version 20 (MedCalc Software Ltd, Ostend, Belgium) was used for statistical analysis. Because this was a proof-of-concept pilot study, there was no preliminary data with which to perform a sample size calculation prior to the study. However, we previously published a study where we used a form of PLR consisting of only raising the legs, in heart failure patients undergoing a right heart catheterization.11 In that study, we showed a statistically significant change of VPR with PLR in 36 participants. A greater central thoracic volume change would be expected with the maneuver in the current study. Therefore, we estimated that 30 participants with usable data would be sufficient to show a statistically significant change with each serving as their control (baseline vs PLR).
Results
Thirty-eight participants were enrolled in the study. Eight participants could not complete the testing because of a weakly detectable pulse (n = 6) due to cold hands, prompting the study apparatus to be moved to a better temperature-controlled room. Other withdrawals were due to recurrent missed beats at rest (n = 1) which appropriately caused the Indicor to fault, and an unstable PPG waveform DC offset (eg, unstable baseline; n = 1) from a participant who exercised just before participating. Thirty participants completed the three tests.
The participants were 19 males and 11 females with ages ranging from 22 to 67 years (mean ± SD; 46 ± 13 years). The mean change in resting heart rate with the change in position from BL to PLR was −2 ± 6 beats per minute and all participants were within a ±15 beats per minute change in resting heart rate.
Figure 3 shows the signals recorded for one typical participant, showing Valsalva-induced changes in PPG amplitude for each of the three expiratory efforts in each position - the baseline head-up position, the Passive Leg Raise position, and then back in the baseline head-up position. It can be seen that the Valsalva-induced decrease in pulse amplitude was attenuated when obtained at one minute after being placed in the PLR position.
 |
Figure 3 Valsalva Pule Response (VPR) of a Photoplethysmography (PPG) Signal to a Valsalva Maneuver at Head-Up Position, After Passive Leg Raise (PLR), and After Return to Head-Up Position in one typical participant. The signals for each of the 3 Valsalva efforts at each position are shown. Expiratory Pressure = Pressure of an expiratory effort into a mouthpiece leading to closed tube with a pressure transducer, during the 10-second Valsalva maneuver. There are tiny x-marks where the program automatically determines the peaks and valleys. |
Analysis of VPR revealed that every participant showed an increase in VPR from BL to PLR and a concomitant reduction in VPR from PLR to REC. VPR increased from a mean of 0.34 ± 0.13 at BL to 0.60 ± 0.14 at PLR (p < 0.0001) and back to 0.33 ± 0.10 with REC (p < 0.0001, Figure 4). The VPR at the REC did not differ from that at BL. Across participants, BL VPR values ranged from 0.19 to 0.74 and differed from their individual REC VPR values by only 0.01 ± 0.06. The mean increase in VPR with PLR compared to the mean of BL and REC was 0.26 ± 0.09 with a range of increases from 0.03 to 0.43.
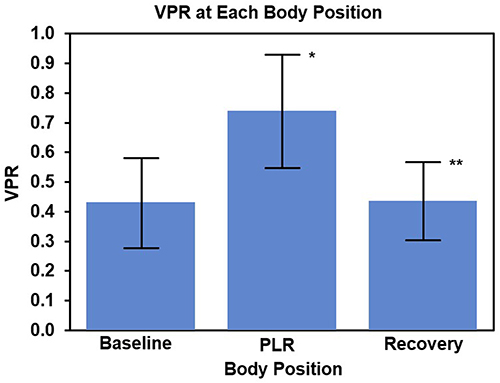 |
Figure 4 Valsalva Pulse Response Ratio to Passive Leg Raise and Recovery. The ratio of the pulse amplitude at the end of the Valsalva maneuver to the average resting pulse amplitude (Valsalva Pulse Response; VPR) increased from baseline to the passive leg raise posture (PLR) (*p<0.0001 PLR versus Baseline) and returned with the Recovery back to baseline posture. (**p<0.0001 for Recovery versus PLR); Baseline and Recovery are not different from each other. N=30. The blue bars indicate the means; the black brackets indicate the means plus and minus the standard deviations. |
Of note, the baseline pulse amplitude also increased with a leg raise (826 ± 329 to 1568 ± 565 arbitrary units, p < 0.0001). Since an acute increase in finger pulse volume amplitude reflects the increase in stroke volume with a passive leg raise,16,17 we plotted the ratio of PLR-to-semirecumbent baseline pulse amplitudes versus the ratio of PLR-to-semirecumbent End-Valsalva pulse amplitudes, as a reflection of change in stroke volume versus change in preload; thus, a form of left ventricular performance plot. The relationship was linear in this group of healthy participants (R = 0.80, p < 0.001, Figure 5).
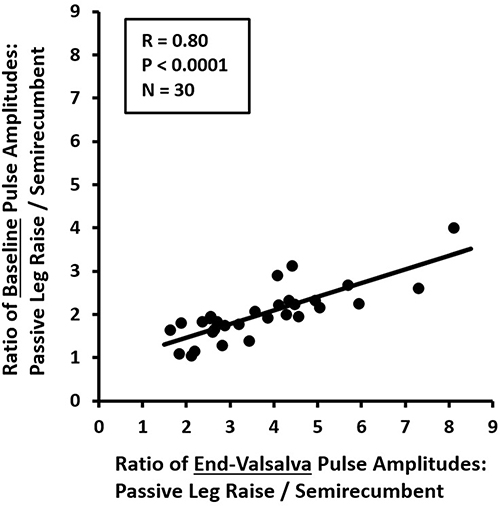 |
Figure 5 Photoplethysmography Indicators of Change in Stroke Volume vs Change in Cardiac Preload with Passive Leg Raise. Indicator of change in stroke volume = Ratio of Baseline Pulse Amplitudes of Passive Leg Raise/Semirecumbent. Indicator of change in cardiac preload = Ratio of End-Valsalva Pulse Amplitudes of Passive Leg Raise/Semirecumbent. R=0.80, P<0.0001, N=30. |
Discussion
The results of this proof-of-concept study in healthy participants showed that an acute increase in thoracic volume load by PLR was associated with a change in the amplitude response of a finger PPG signal during a Valsalva maneuver. PLR resulted in an increase in VPR, which is the ratio of the pulse amplitude at the end of a Valsalva maneuver to the pulse amplitude at baseline. Another notable finding was that, by 5 minutes after the maneuver, VPR returned to baseline in this cohort of healthy individuals. Thus, changes in a finger PPG signal response during the VM are able to detect a transient increase in thoracic volume load, as well as its return to steady-state. One of the implications of this study is that this technique may be useful for tracking trends in thoracic volume.
The directional changes in VPR were consistent, in that every subject’s VPR increased with the PLR, although the degree of increase varied among individuals. Considering the utility of PLR in assessing fluid responsiveness,18 it is possible that some of the variability in the degree of increase in VPR with PLR in the present study was due to the baseline hydration state of each healthy individual.
Research dating back to 1944 demonstrates that the pulse response to a Valsalva maneuver, measured by a variety of transducers and named by a variety of terms, can be used to detect and assess circulatory congestion.5,6,19 VPR is the ratio of the pulse amplitude of the last pulse in the strain phase of the maneuver to an average of multiple baseline pulses. During the maneuver, the increased intrathoracic pressure generated by the Valsalva expiratory pressure, monitored as proximal oral pressure, appreciably attenuates venous return in non-congested patients, thus enabling the heart to maintain pulse volumes a function of hemodynamic fluid volume in reserve at the start of the maneuver.
Monitoring hemodynamic congestion is of such importance that even an implantable pulmonary artery pressure monitor is sometimes used for that purpose.20 The device used in this study, Indicor, measures VPR using finger PPG, an inexpensive and robust technology that tracks pulse volume changes in the fingertip. The device also provides an automated and standardized platform for testing. The eventual goal of its development is to provide a noninvasive tool to trend hemodynamic congestion related to fluid volume status in patients with heart failure, and in other conditions for which monitoring thoracic fluid status is indicated.
We have previously shown that VPR obtained by finger PPG reflects left ventricular end-diastolic pressure and pulmonary capillary wedge pressure.9–11 We have also shown that VPR decreases after removing an average of 3 liters of fluid by hemodialysis.13 The results of the present study, taken together with the results of those previous studies, indicate that changes in VPR reflect both increases and decreases in cardiac filling pressure. This supports the potential utility of finger PPG during the Valsalva maneuver to monitor changes in central volume/filling pressure status.
In a previous study, we measured the change in VPR resulting from the increase in pulmonary capillary wedge pressure that occurred with a PLR in patients with heart failure undergoing right heart catheterizations.11 However, in that study, the participants were in the supine position, and the intervention was only to raise the legs. In addition, VPR was measured two minutes after the legs were raised, as opposed to after only one minute in the present study. Moreover, the three efforts were repeated successively in that previous study. The result was that a change in VPR was observed, but the effect was less pronounced than that observed in the present study. In the present study, participants were shifted from the head up with the thorax above the level of the legs, to the head down and the legs raised. In addition, we measured each of the three efforts after three separate leg raises so that the effect of each leg raise on subsequent measurement was undiminished. By measuring each PLR VPR after only one minute into a leg raise, we were able to capture the peak or near-peak level of the transient thoracic volume increase.
Early studies used invasive blood pressure waveforms to show a directional increase in VPR after of a central volume increase with IV fluid infusion or after a PLR.7,8 A later study recorded a noninvasive, continuous blood pressure waveform using the volume-clamp technique to show that VPR (measured earlier in the Valsalva maneuver in their study) increased after ingestion of an isotonic solution of a volume equal to 2% of lean body mass consumed over 1 hour. They also measured plasma volume and showed that the degree to which the Valsalva-induced pulse pressure decrease was attenuated after fluid ingestion was proportional to the increase in plasma volume.19
In studies using PLR to measure volume responsiveness, the delay in obtaining measurement for up to 5 minutes is because it is ultimately the effect of the increased venous return on cardiac output that is being measured.21 The PLR model is a well-described test to assess hypovolemia by determining whether a patient’s cardiac output would respond to an increase in preload; that is, if cardiac output is limited by low volume/pressure load in the thoracic vasculature. The PLR test utilizes gravity to draw the volume from the lower extremity to the central circulation, resulting in an increased pulmonary venous volume/pressure load similar to a volume expansion or a neurohumoral translocation of fluid.18 Monnet et al have validated and quantified the PLR model as a transient, reversible fluid challenge,22 and the current protocol was conducted as described by those investigators.18 In their study, they assessed the impact of both PLR and then a subsequent bolus fluid challenge on cardiac output change in critically ill patients who responded to increased thoracic volume load. Compared to baseline, the PLR maneuver increased aortic blood flow by ≥10% whereas a subsequent bolus infusion of 500 mL of normal saline increased aortic blood flow by ≥15%. Therefore, the investigators concluded that a PLR was equivalent to approximately 300 mL of central volume expansion. An important consideration of the PLR model is that the effects are short-lived as the heart increases the stroke volume and displaces the volume arterially. Hence, to capture the full transient increase in thoracic load, measures should be made within one minute of the challenge.22
Data from previous studies show that the functional range of VPR is from almost 0.00 in a system with low volume/pressure load to approximately 1.20 (VPR can surpass 1.00 when there is adequate blood volume for venous return, and the additional pressure of the Valsalva improves preload).9,11,13,23–25 The mean increase in VPR with a PLR was 0.26, which represents approximately a quarter of the functional range of VPR and thus demonstrated the sensitivity to detect fluid shifts that may cause hemodynamic congestion in patients with heart failure.
The baseline pulse amplitude increased with a leg raise, which represents an acute increase in fingertip pulse volume due to an increase in stroke volume resulting from the acutely increased cardiac preload.16,17 Considered together with the changes in VPR, this suggests that, using finger PPG with a VM before and after a passive leg raise, a left ventricular performance plot as an indicator of change in stroke volume vs an indicator of change in cardiac filling pressure (preload) can be generated. In the healthy individuals in this study, this relationship was a highly correlated straight line with a positive slope. A study comparing this type of plot between healthy individuals and patients with chronic heart failure or acute decompensated heart failure is warranted. Among other potential uses, this could have implications for diagnosing heart failure with preserved ejection fraction (HFpEF). The gold-standard test for diagnosing HFpEF is a supine bicycle exercise during pulmonary artery catheterization, which shows an exaggerated increase in cardiac filling pressure (pulmonary capillary wedge pressure) in HFpEF versus non-HFpEF patients.26 In recent years, there has been evidence that a passive leg raise may be a useful substitute for supine bicycle exercise.27 Based on the present study, we hypothesize that finger PPG during the VM after a PLR in HFpEF patients may show an exaggerated increase in VPR coupled with a limited augmentation of baseline pulse amplitude. If this hypothesis is proven correct, fingertip PPG Valsalva Pulse Response with PLR may be useful in diagnosing HFpEF. This possibility should be explored further.
This study had some limitations. First, this was a pilot study of healthy volunteers, therefore, it did not include patients with cardiac disease. A study comparing healthy volunteers and patients with heart failure should be undertaken next. Second, a leg raise represents an acute volume load, as opposed to a more gradual increase in central volume and filling pressure. Thus, this proof-of-concept physiological study showed that acute increases in central volume load are associated with acute increases in VPR by finger PPG. Subsequent studies should be conducted to establish whether VPR can track increased congestion over time in patients with chronic heart failure. Third, this pilot study was not powered to assess the effects of variables such as age or gender; these should be addressed in future studies. Finally, as was mentioned in the Results section, 8 of the subjects could not complete testing because of a weakly detectable PPG signal due to cold hands. This could be even more of a problem in patients with cardiovascular disease. Future studies should be conducted in a sufficiently warm environment, and signal amplification parameters may need to be refined.
Conclusions
We have shown in this proof-of-concept study in healthy participants that the increase in thoracic load created by a PLR is associated with changes in the Valsalva-induced pulse amplitude response of a finger PPG signal. The transient increase in central volume/filling pressure caused a transient increase in VPR that quickly reverted to the baseline value as the central load was accommodated and redistributed. This adds to the evidence that VPR using finger PPG may be useful in monitoring processes that change central volume/filling pressure. Future studies should be conducted in patients with various conditions including chronic heart failure, and with processes that act over a longer period, such as days to weeks.
Acknowledgment
The authors gratefully acknowledge Benjamin Verschoore and Jonathan Woodward for their assistance in the performance of this study. This work was supported by Vixiar Medical, Inc.
Disclosure
Dr. Silber is the inventor of the technology, has been a paid consultant to Vixiar Medical, and owns shares. In addition, Dr. Silber has patents in the US and in Europe with royalties paid to Johns Hopkins University. Dr. Miller was formerly employed by Vixiar Medical and owns shares. In addition, Dr. Miller has a patent “SYSTEMS AND METHODS FOR AUTOMATICALLY INTERPRETING PHOTOPLETHYSMOGRAPHY(PPG) SIGNALS DURING PHYSIOLOGIC PERTURBATIONS” pending to Vixiar Medical. The authors report no other conflicts of interest in this work.
References
1. Gheorghiade M, Vaduganathan M, Fonarow GC, et al. Rehospitalization for heart failure: problems and perspectives. J Am Coll Cardiol. 2013;61(4):391–403. doi:10.1016/j.jacc.2012.09.038
2. Stevenson LW, Perloff JK. The limited reliability of physical signs for estimating hemodynamics in chronic heart failure. JAMA. 1989;261(6):884–888. doi:10.1001/jama.1989.03420060100040
3. Badgett RG, Lucey CR, Mulrow CD. Can the clinical examination diagnose left-sided heart failure in adults? JAMA. 1997;277(21):1712–1719. doi:10.1001/jama.1997.03540450068038
4. Thibodeau JT, Drazner MH. The role of the clinical examination in patients with heart failure. JACC Heart Fail. 2018;6(7):543–551. doi:10.1016/j.jchf.2018.04.005
5. Hamilton WF, Woodbury RA, Harper HT. Arterial, cerebrospinal and venous pressures in man during cough and strain. Am J Physiol. 1944;141(1):42–50. doi:10.1152/ajplegacy.1944.141.1.42
6. Knowles JH, Gorlin R, Storey CF. Clinical test for pulmonary congestion with use of the Valsalva maneuver. J Am Med Assoc. 1956;160(1):44–48. doi:10.1001/jama.1956.02960360046009a
7. Judson WE, Hatcher JD, Wilkins RW. Blood pressure responses to the Valsalva maneuver in cardiac patients with and without congestive failure. Circulation. 1955;11(6):889–899. doi:10.1161/01.CIR.11.6.889
8. Gorlin R, Knowles JH, Storey CF. The Valsalva maneuver as a test of cardiac function; pathologic physiology and clinical significance. Am J Med. 1957;22(2):197–212. doi:10.1016/0002-9343(57)90004-9
9. Silber HA, Trost JC, Johnston PV, et al. Finger photoplethysmography during the Valsalva maneuver reflects left ventricular filling pressure. Am J Physiol Heart Circ Physiol. 2012;302(10):H2043–H2047. doi:10.1152/ajpheart.00609.2011
10. Galiatsatos P, Win TT, Monti J, et al. Usefulness of a noninvasive device to identify elevated left ventricular filling pressure using finger photoplethysmography during a Valsalva maneuver. Am J Cardiol. 2017;119(7):1053–1060. doi:10.1016/j.amjcard.2016.11.063
11. Gilotra NA, Tedford RJ, Wittstein IS, et al. Usefulness of pulse amplitude changes during the Valsalva maneuver measured using finger photoplethysmography to identify elevated pulmonary capillary wedge pressure in patients with heart failure. Am J Cardiol. 2017;6(6):966–972. doi:10.1016/j.amjcard.2017.06.029
12. Gilotra NA, Wanamaker BL, Rahim H, et al. Usefulness of noninvasively measured pulse amplitude changes during the Valsalva maneuver to identify hospitalized heart failure patients at risk of 30-day heart failure events (from the PRESSURE-HF Study). Am J Cardiol. 2020;125(6):916–923. doi:10.1016/j.amjcard.2019.12.027
13. Galiatsatos P, Parakh K, Monti KJ, et al. A finger photoplethysmography waveform during the Valsalva maneuver detects changes in left heart filling pressure after hemodialysis. BMC Nephrol. 2015;16(1):138. doi:10.1186/s12882-015-0135-0
14. Mahjoub Y, Touzeau J, Airapetian N, et al. The passive leg-raising maneuver cannot accurately predict fluid responsiveness in patients with intra-abdominal hypertension. Crit Care Med. 2010;38(9):1824–1829. doi:10.1097/CCM.0b013e3181eb3c21
15. Malbrain MLNG, Reuter DA. Assessing fluid responsiveness with the passive leg raising maneuver in patients with increased intra-abdominal pressure: be aware that not all blood returns! Crit Care Med. 2010;38(9):1912–1915. doi:10.1097/CCM.0b013e3181f1b6a2
16. Beurton A, Teboul JL, Gavelli F, et al. The effects of passive leg raising may be detected by the plethysmographic oxygen saturation signal in critically ill patients. Crit Care. 2019;223(1):19. doi:10.1186/s13054-019-2306-z
17. Coutrot M, Dudoignon E, Joachim J, et al. Perfusion index: physical principles, physiological meanings and clinical implications in anaesthesia and critical care. Anaesth Crit Care Pain Med. 2021;40(6):100964. doi:10.1016/j.accpm.2021.100964
18. Monnet X, Teboul JL. Passive leg raising: five rules, not a drop of fluid! Crit Care. 2015;19(1):17. doi:10.1186/s13054-014-0708-5
19. Fritsch-Yelle JM, Convertino VA, Schlegel TT. Acute manipulations of plasma volume alter arterial pressure responses during Valsalva maneuvers. J Appl Physiol. 1999;86(6):1852–1857. doi:10.1152/jappl.1999.86.6.1852
20. Abraham WT, Adamson PB, Bourge RC, et al; CHAMPION Trial Study Group. Wireless pulmonary artery haemodynamic monitoring in chronic heart failure: a randomised controlled trial. Lancet. 2011;377(9766):658–666. doi:10.1016/S0140-6736(11)60101-3
21. Monnet X, Marik P, Teboul JL. Passive leg raising for predicting fluid responsiveness: a systematic review and meta-analysis. Intensive Care Med. 2016;42(12):1935–1947. doi:10.1007/s00134-015-4134-1
22. Monnet X, Rienzo M, Osman D, et al. Passive leg raising predicts fluid responsiveness in the critically ill. Crit Care Med. 2006;34(5):1402–1407. doi:10.1097/01.CCM.0000215453.11735.06
23. Remmen JJ, Aengevaeren WR, Verheugt FW, et al. Detection of elevated pulmonary capillary wedge pressure in elderly patients with various cardiac disorders by the Valsalva manoeuvre. Clin Sci. 2006;111(2):153–162. doi:10.1042/CS20050372
24. Gillard C, Henuzet C, Lallemand J, et al. Operating characteristics of the Finapress system to predict elevated left ventricular filling pressure. Clin Cardiol. 2006;3(3):107–111. doi:10.1002/clc.4960290305
25. McIntyre KM, Vita JA, Lambrew CT, et al. A noninvasive method of predicting pulmonary-capillary wedge pressure. N Engl J Med. 1992;327(24):1715–1720. doi:10.1056/NEJM199212103272404
26. Reddy YNV, Obokata M, Wiley B, et al. The haemodynamic basis of lung congestion during exercise in heart failure with preserved ejection fraction. Eur Heart J. 2019;40(45):3721–3730. doi:10.1093/eurheartj/ehz713
27. Tossavainen E, Wikström G, Henein MY, et al. Passive leg-lifting in heart failure patients predicts exercise-induced rise in left ventricular filling pressures. Clin Res Cardiol. 2020;109(4):498–507. doi:10.1007/s00392-019-01531-w
 © 2023 The Author(s). This work is published and licensed by Dove Medical Press Limited. The full terms of this license are available at https://www.dovepress.com/terms.php and incorporate the Creative Commons Attribution - Non Commercial (unported, v3.0) License.
By accessing the work you hereby accept the Terms. Non-commercial uses of the work are permitted without any further permission from Dove Medical Press Limited, provided the work is properly attributed. For permission for commercial use of this work, please see paragraphs 4.2 and 5 of our Terms.
© 2023 The Author(s). This work is published and licensed by Dove Medical Press Limited. The full terms of this license are available at https://www.dovepress.com/terms.php and incorporate the Creative Commons Attribution - Non Commercial (unported, v3.0) License.
By accessing the work you hereby accept the Terms. Non-commercial uses of the work are permitted without any further permission from Dove Medical Press Limited, provided the work is properly attributed. For permission for commercial use of this work, please see paragraphs 4.2 and 5 of our Terms.