Back to Journals » OncoTargets and Therapy » Volume 10
Non-small-cell lung cancer cell lines A549 and NCI-H460 express hypoxanthine guanine phosphoribosyltransferase on the plasma membrane
Authors Townsend MH, Anderson MD ![]() , Weagel EG, Velazquez EJ, Weber KS
, Weagel EG, Velazquez EJ, Weber KS ![]() , Robison RA
, Robison RA ![]() , O'Neill KL
, O'Neill KL ![]()
Received 22 November 2016
Accepted for publication 13 January 2017
Published 30 March 2017 Volume 2017:10 Pages 1921—1932
DOI https://doi.org/10.2147/OTT.S128416
Checked for plagiarism Yes
Review by Single anonymous peer review
Peer reviewer comments 3
Editor who approved publication: Dr Yao Dai
Michelle H Townsend, Michael D Anderson, Evita G Weagel, Edwin J Velazquez, K Scott Weber, Richard A Robison, Kim L O’Neill
Department of Microbiology and Molecular Biology, Brigham Young University, Provo, UT, USA
Abstract: In both males and females, lung cancer is one of the most lethal cancers worldwide and accounts for >30% of cancer-related deaths. Despite advances in biomarker analysis and tumor characterization, there remains a need to find suitable biomarker antigen targets for treatment in late-stage lung cancer. Previous research on the salvage pathway enzyme TK1 shows a unique relationship with cancer patients as serum levels are raised according to cancer grade. To expand this analysis, the other salvage pathway enzymes were evaluated for possible upregulation within lung cancer. Adenine phosphoribosyltransferase, deoxycytidine kinase, and hypoxanthine guanine phosphoribosyltransferase (HPRT) were assessed for their presentation on two non-small-cell lung cancer cell lines NCI-H460 and A549. In the present study, we show that deoxycytidine kinase and adenine phosphoribosyltransferase have no significant relationship with the membrane of NCI-H460 cells. However, we found significant localization of HPRT to the membrane of NCI-H460 and A549 cells. When treated with anti-HPRT antibodies, the average fluorescence of the cell population increased by 24.3% and 12.9% in NCI-H460 and A549 cells, respectively, in comparison with controls. To ensure that expression was not attributed to cytoplasmic HPRT, confocal microscopy was performed to visualize HPRT binding on the plasma membrane. After staining NCI-H460 cells treated with both fluorescent antibodies and a membrane-specific dye, we observed direct overlap between HPRT and the membrane of the cancer cells. Additionally, gold-conjugated antibodies were used to label and quantify the amount of HPRT on the cell surface using scanning electron microscopy and energy-dispersive analysis X-ray. Further confirming HPRT presence, the gold weight percentage of the sample increased significantly when NCI-H460 cells were exposed to HPRT antibody (P=0.012) in comparison with isotype controls. Our results show that HPRT is localized on the surface of these non-small-cell lung cancer cell lines.
Keywords: non-small-cell lung cancer, NCI-H460, A549, surface antigen, hypoxanthine guanine phosphoribosyltransferase
Introduction
Lung cancer is one of the leading causes of cancer-related deaths in both males and females worldwide. In 2015, 221,200 individuals in the US were diagnosed with lung cancer, while another 158,040 individuals were killed by the disease.1 Approximately 85% of lung cancer cases are diagnosed as non-small-cell lung cancer, which encompasses squamous cell carcinoma, adenocarcinoma, and large cell carcinoma.2 Despite advances in combinatorial therapy using both chemotherapy and radiotherapy, patient outcome has not improved at a satisfactory rate.3 Currently, the 1-year survival rate for lung cancer patients is 44%, and the 5-year survival is only 17%. Low survival is largely attributed to late-stage diagnoses. Approximately 57% of patients are diagnosed at a late stage, leading to reduced treatment options and increased mortality. When diagnosed at a late stage, the survival rates are reduced to 26% and 6% for 1-year and 5-year survival, respectively.1
Because early detection of lung cancer is integral to patient survival and outcome, substantial efforts have been made to develop noninvasive tests that identify non-small-cell lung cancers, allowing physicians to diagnose the disease at an earlier stage.4,5 Although profiling cancer tissues to find circulating biomarkers can aid in identifying tumor-derived proteins, these methods are extremely invasive. As a result, researchers have developed techniques to identify cancer biomarkers in the sputum of patients. These tests utilize DNA-based assays to detect methylated gene promoter regions that are commonly found in tumors and lead to the loss of tumor suppressor function.6,7 RARβ is a chief candidate for this type of analysis because it is involved in cellular signaling during embryonic morphogenesis, cell growth, and differentiation.8 Studies show that 95% of the cancer tissue has upregulated methylation of the RARβ promoter compared to controls, demonstrating its use as an effective biomarker for lung cancer detection.8 The p16 tumor suppressor gene has also been used in early detection through evaluation of hypermethylation at its locus.9–11 This methylation change is often detected in precursor lesions of tumors and serves as an early event in cancer development and progression.12 In addition, recent advancements have allowed physicians to detect cancer using breath samples from patients by analyzing volatile organic compounds. By evaluating panels of patients, cancer profiles are established that can later be used as references to aid physicians in early lung cancer detection.13,14 While these methods are promising for the early recognition of lung cancer, they are not suitable for the treatment of patients.
Once lung cancer is detected and diagnosed, a majority of patients are treated with surgery, chemotherapy, radiation therapy, and targeted therapy. For patients suffering with non-small-cell lung cancer, the most common treatment is chemotherapy combined with targeted drugs. Although many patients go into remission after initial treatment, a large percentage eventually relapse, and chemotherapy regimens offer little advantage over other treatments for advanced non-small-cell lung cancer.15 New therapies utilize cancer antigens to target tumors, which enables physicians to personalize treatments. Treatment efficacy is enhanced with tumor biopsies, which classify the individual mutations in a tumor to help determine the best course of treatment.16 Because of these biopsies, multiple genes have been assessed and shown as biomarkers for lung cancer due to their upregulation in comparison with normal tissue. CBLC, CYP24A1, S100P, and ALDH3A1 all have 5- to 10-fold increases in the level of expression in both adenocarcinoma and squamous cell carcinoma samples in comparison with normal tissue.17 This information leads to personalized treatment and aids physicians in determining effective drug regimens. For example, ~10% of patients with non-small-cell lung cancer have a mutation in the epidermal growth factor receptor (EGFR) that renders them sensitive to tyrosine kinase inhibitor drugs.18–21 Although personalizing treatment based on tumor characteristics can be effective and lead to increased survival rates for small subsets of patients, the current targeted treatments lack specificity and can often lead to unwanted off-target effects.22
The purpose of this study was to find a lung cancer biomarker on the surface of non-small-cell lung cancer cells. Due to the proliferative capacity of cancer cells and the need for necessary nucleotide production to support rapid division, the salvage pathway enzymes deoxycytidine kinase (DCK), adenine phosphoribosyltransferase (APRT), and hypoxanthine guanine phosphoribosyltransferase (HPRT) were evaluated for potential expression on non-small-cell lung cancer cell lines. DCK functions by transferring a phosphate group to deoxycytidine in the production of cytosine bases. APRT catalyzes the transfer of a phosphoribosyl group from phosphoribosyl pyrophosphate (PRPP) to adenine, forming adenine monophosphate in the production of adenine bases. HPRT is a crucial enzyme for the large-scale production of guanine and inosine bases. HPRT functions by transferring phosphoribose from PRPP to hypoxanthine or guanine bases to form inosine monophosphate (IMP) and Guanine monophosphate (GMP), respectively.23,24 We designed this study to evaluate the potential of these salvage pathway enzymes as possible biomarker targets for the treatment of non-small-cell lung cancer.
We utilized a variety of methods, including flow cytometry, confocal microscopy, and scanning electron microscopy, to determine whether DCK, APRT, or HPRT had any significant relationship with the surface of H460 and A549 cells. In addition, we also evaluated HPRT expression within patient tissue to determine whether there was a unique elevation in patients with lung carcinoma. Although we found no significant relationship between DCK and APRT with H460 non-small-cell lung cancer cells, HPRT had a significant colocalization with the membrane of both A549 and H460 cancer cells.
Materials and methods
Chemicals
Mouse-antihuman HPRT monoclonal antibody clone 1F8D11 (Thermo Fischer Scientific, Waltham, MA, USA) was aliquoted and stored at −20°C. DCK antibody clone 2243C2 (Santa Cruz Biotechnology Inc., Dallas, TX, USA) and APRT antibody lot 10196 (Abnova, Taipei City, Taiwan) were stored at −20°C. Mouse-FITC and rabbit-FITC antibody (Sigma Aldrich, St Louis, MO, USA) were stored at 4°C and were used in minimal light conditions. Bovine serum albumin (BSA, Sigma Aldrich) and sodium thiolsulfate (Macron Fine Chemicals, Center Valley, PA, USA) were dissolved in phosphate-buffered saline (PBS) at a 1% concentration and stored at 4°C. A 50% glutaraldehyde stock solution (Electron Microscopy Sciences, Hatfield, PA, USA) was stored at −20°C, and workable solutions were diluted to 0.25% in PBS and stored at 4°C. Glycine (Thermo Fischer Scientific) was diluted to 0.2 mM in PBS and stored at 4°C. NF-κB polyclonal antibody (Bioss Antibodies, Woodburn, MA, USA) was stored at −20°C. CD44 monoclonal antibody (One World Lab, San Diego, CA, USA) was stored at −20°C.
Cell culture conditions
The human non-small-cell lung cancer cell lines H460 and A549 were obtained from the American Type Culture Collection (Rockville, MD, USA). H460 cells were grown in RPMI 1640 medium supplemented with 10% fetal bovine serum and 2 mM L-glutamine (all from Hyclone, Logan, UT, USA). A549 cells were grown in DMEM/F12 medium supplemented with 10% fetal bovine serum and 4 mM L-glutamine (all from Hyclone). The cell media were replaced every 48 hours, and cells were trypsinized and reduced once 90% confluence was obtained. Cells were treated with Accutase (Stemcell Technologies, Vancouver, Canada) when utilized for flow cytometry, and when plated for all other applications. All cells were grown at 37°C and 5% CO2. Cell lines were authenticated in May 2016 by the University of Arizona Genetics Core.
Flow cytometry
The expressions of HPRT, DCK, and APRT in cultured cells were evaluated by measuring the levels of fluorescence in cells treated with each salvage pathway enzyme antibody. All samples were analyzed on a Blue/Red Attune (Applied Biosystems, Foster City, CA, USA), which recorded 25,000–50,000 events per sample. Briefly, 250,000 cells were incubated with 200 μL of PBS containing 1 μg of antibody to DCK, APRT, and HPRT for 15 minutes on ice. Cells were then labeled with FITC-conjugated secondary (mouse or rabbit) antibody for 15 minutes on ice. Isotypic IgG and unstained cells served as negative controls. The forward/side-scatter plots were used to gate out cell doublets and dead cells. Resulting data were analyzed and plotted using FlowJo Software (FlowJo Enterprise, Ashland, OR, USA). CD44 was utilized as a positive control (Figures S1 and S2), and NF-κB was utilized as a negative control.
Confocal microscopy
Fluorescently stained cells were examined under an epifluorescence microscope (Olympus, Tokyo, Japan) equipped with a laser confocal system (Bio-Rad Laboratories, Hercules, CA, USA) using a 15 mW Krypton/argon laser. Image processing was carried out with Laser Sharp Computer Software (Bio-Rad Laboratories). After accutase treatment, cells were plated at a concentration of 4×10⁵ cells/mL on glass coverslips. Following 1 day of growth, cells were incubated in 500 μL of PBS containing 2.5 μg of anti-HPRT antibody for 15 minutes on a shaker at 4°C. Cells were then labeled with 2.5 μg of FITC-conjugated secondary antibody for 15 minutes on a shaker at 4°C. Then, cells were incubated at 37°C for 10 minutes with a 1:1,000 dilution of a Cell Mask Deep Red plasma membrane dye (Fisher Scientific, Waltham, MA, USA).
Scanning electron microscopy
After accutase treatment, cells were plated at a concentration of 400,000 cells/mL on glass coverslips. After 1 day of growth, cells were placed in 6-well plates and washed three times with PBS followed by a 1% BSA in PBS wash, a 1% sodium thiolsulfate in PBS wash, and a 1% sodium azide wash for 5 minutes each at 4°C. Cells were then incubated with 5 μg of primary antibody conjugated to Biotin for 15 minutes on a shaker at 4°C. After primary incubation, cells were washed with 1% BSA followed by two washes with PBS. Then, cells were washed with 1% PBS–BSA and 1% sodium thiolsulfate for 5 minutes on a shaker at 4°C. Cells were then incubated with 2.5 μg of a streptavidin–gold conjugate (Nanoprobes, Yaphank, NY, USA) for 15 minutes on a shaker at 4°C. This was followed by a 1% BSA wash and three PBS washes. Cells were then fixed via incubation in a 0.25% glutaraldehyde solution diluted in PBS for 5 minutes. The reaction was extinguished by adding a 0.2 mM glycine diluted in PBS solution and incubating for 10 minutes until the solution turned to a slight yellow color. Cells were then washed three times with ddH2O. Solutions A and B from the Nanoprobes gold enhancement kit were incubated together for 5 minutes. Solutions C and D were then added, vortexed, and 40 μL of the gold enhancement solution was added to each sample and incubated for 5 minutes. Each sample treated with gold enhancement is coated in a solution of 2 nm gold particles, but only gold already present via secondary antibody binding will be enhanced to form a definitive particle. Each sample was subsequently put through a series of dehydrations with 70%, 80%, 90%, and 100% EtOH before analysis. Gold-labeled samples were examined under a Phillips XL-30 ESEM using a 15 kV electron stream under low vacuum conditions at 0.8 Torr. A gaseous side electron (GSE) detector was utilized to image the cell morphology and topography. A back scatter electron (BSE) detector was utilized to visualize gold particles on the cell surface. Once images for the cells were obtained, the elemental composition was evaluated using energy-dispersive analysis X-ray (EDAX). Because of gold enhancement, the elemental gold percentage of the background levels of gold was ~8%.
Immunohistochemistry
Lung carcinoma tissue arrays were obtained from Cybrdi (Frederick, MD, USA). These tissues contain various stages of cancer along with corresponding benign and normal tissues from 35 different patients. HPRT levels were assessed utilizing standard immunohistochemistry staining. Tissues were rehydrated in a series of ethanol washes before treatment with a DIVA decloaker solution to retrieve antigen. Tissues were then incubated with a background sniper solution to reduce nonspecific antibody binding. Following blocking, a primary antibody is added to the tissue at a concentration of 1:100 to 1:200 and incubated overnight at 4°C. Following primary staining, tissues were washed and then treated with secondary antibody conjugated to an horse radish perioxidase polymer and incubated for an hour. Following washing, a DAB (3,3′ diaminobenzidine) peroxidase solution is incubated with the tissues. Areas of antibody binding will convert the colorless substrate to a brown product, effectively highlighting the target protein. Tissues were treated with hematoxylin to stain the nucleus of the cells. Along with HPRT treatment, a universal negative antibody was used as a negative control.
Tissues were quantified utilizing ImageJ software. All images were evaluated using the IHC toolbox ImageJ plugin. The DAB option is chosen, and the tissue image is then removed of all other staining except for DAB. Following this analysis, the image is then converted to a gray scale and a threshold is applied in order to eliminate areas of white inherit in the tissue. Once the threshold is applied, the average gray value of the tissue is collected. The same threshold is applied to all tissue samples in order to ensure consistency.
Statistical analysis
Analysis of variance (ANOVA) statistical analysis with the multiple comparison method was used to determine the differential surface expression of various treatments for flow cytometry data on both A549 and H460 cells. In addition, two-way ANOVA tests were performed to compare the mean values of HPRT expression between A549 and H460 cells. EDAX data were analyzed using ANOVA with the multiple comparison method in addition to unpaired t-tests to determine significance between samples. All statistical analyses were performed using GraphPad Prism 7 software. Differences were considered significant when the P-value was <0.05.
Results
DCK and APRT are not found on the surface of non-small-cell lung cancer H460 cells
Flow cytometry utilizing FITC fluorescent antibodies was used to quantify the DCK and APRT surface antigens. Figure 1A and B shows the relative binding of DCK and APRT protein on the surface of H460 cells, while Figure 1C shows the binding of HPRT. In the presence of anti-DCK and anti-APRT antibody, there was no significant increase in the fluorescent intensity of treated samples and no resulting shift in the cell population. Further statistical analysis revealed that DCK and APRT were not significantly different than the secondary IgG antibody controls. These data show no relevant binding of specific antibodies to the cell surface and suggest that the therapeutic potential of DCK and APRT is minimal for non-small-cell lung cancers.
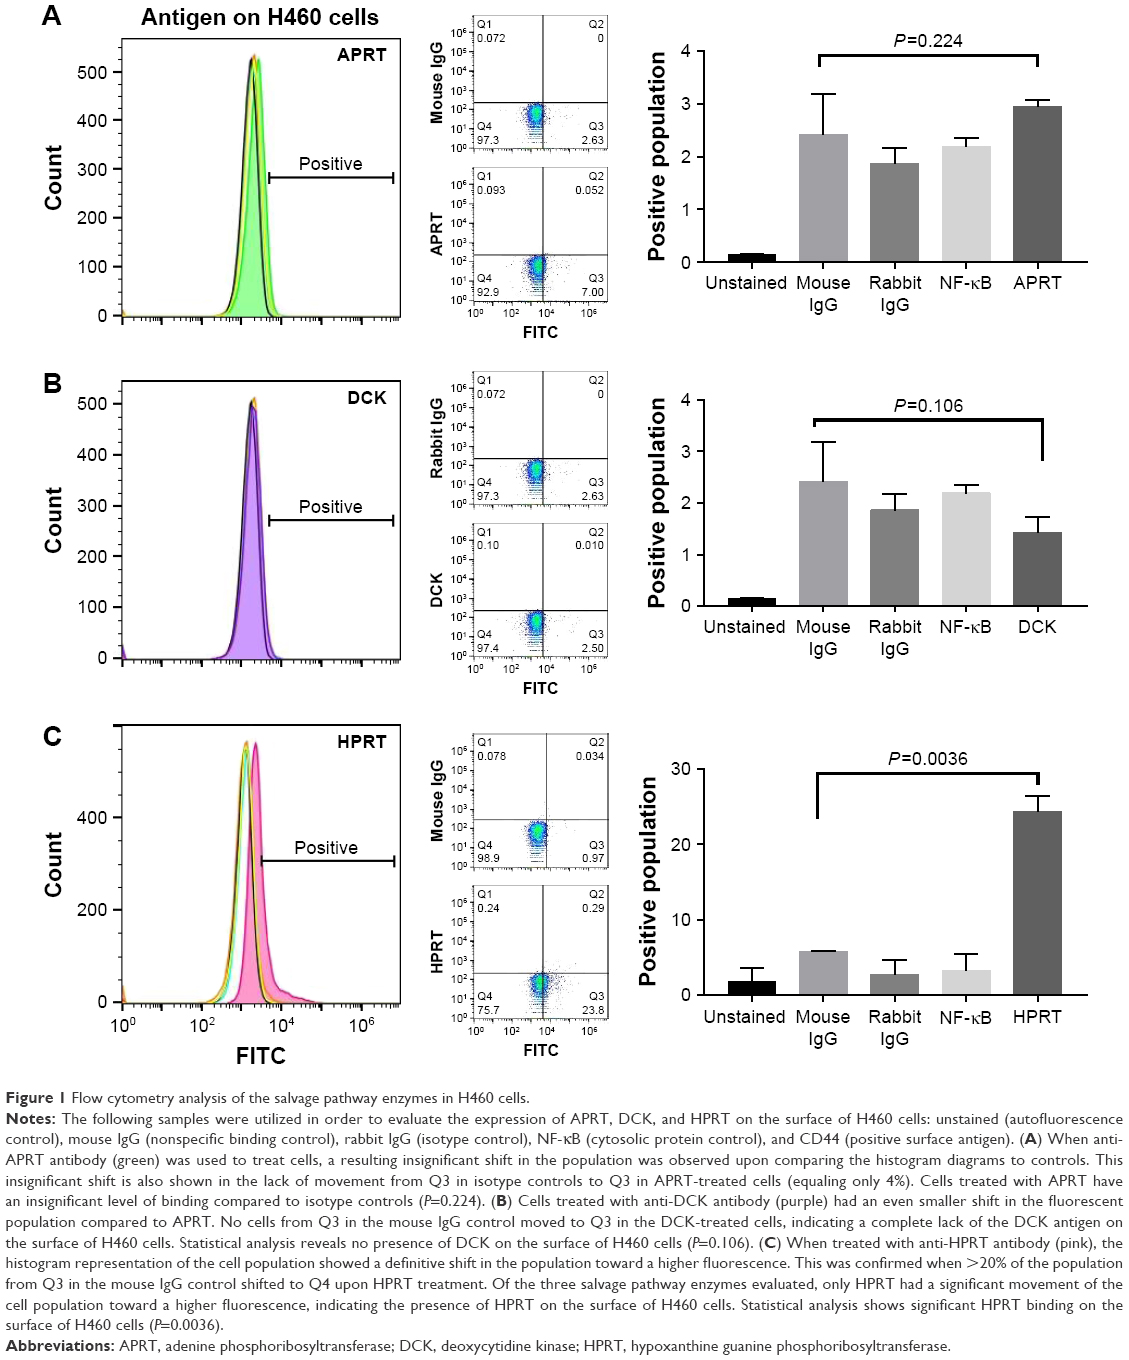 | Figure 1 Flow cytometry analysis of the salvage pathway enzymes in H460 cells. |
Flow cytometry shows significant HPRT expression on the surface of A549 and H460 cells
When treated with anti-HPRT fluorescent antibodies, both A549 and H460 cancer cells had an increase in the fluorescent population (Figures 1C and 2). A 28% shift in the population is observed in H460 cells (Figure 1C), while a 12% shift is observed in A549 cells (Figure 3). Statistical analysis comparing anti-HPRT-treated cells with isotype IgG controls showed a statistically significant difference in H460 and A549 cells (Figures 1C and 2C). Thus, these data show a significant association between HPRT and the surface of non-small-cell lung cancer cells. This analysis also revealed a significantly higher HPRT surface expression in H460 cells when compared to A549 (Figure 3).
 | Figure 2 HPRT surface expression on A549 non-small-cell lung cancer cells. |
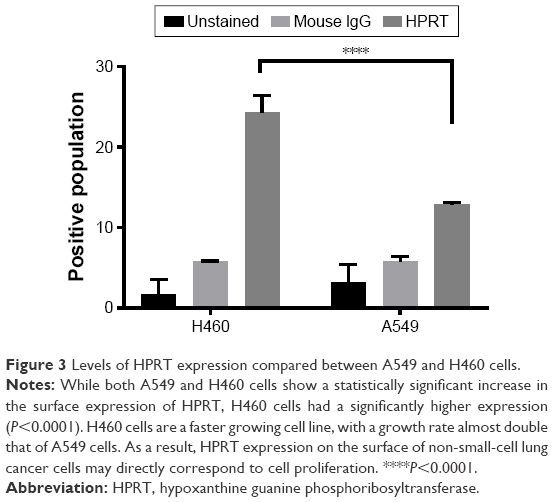 | Figure 3 Levels of HPRT expression compared between A549 and H460 cells. |
Confocal microscopy confirms that HPRT is bound to the surface of the cell
In order to confirm that HPRT was not bound to cytoplasmic protein, the surface expression of HPRT was further evaluated with confocal microscopy (Figure 4). Images obtained from cells treated with membrane dye and FITC antibody stain were overlapped to show colocalization of treated antigen on the plasma membrane of the cancer cell. When cells are treated with anti-HPRT antibody, a yellow pigment appears in the merged image, which indicates a direct relationship between the plasma membrane dye and the FITC dye. No other treatment experienced this same overlapped pigmentation, which confirms the relationship between HPRT and the plasma membrane of H460 cells.
 | Figure 4 Plasma membrane colocalization with HPRT in H460 cells. |
HPRT antigen is scattered randomly across the surface of H460 cells
The location of the HPRT protein on the surface of H460 cells was also analyzed with scanning electron microscopy (Figure 5). The gold elemental peak along with the elemental composition of each sample reveals the changes in the surface gold percentages when cells are exposed to primary antibodies. Images obtained from this analysis show HPRT on the cell surface, but there is no apparent clustering of the antigen as gold particles are scattered across the cell randomly. EDAX analysis showed that cells treated with anti-HPRT antibody had an increase in the average gold weight percentage of 10.39% in comparison with only 8.75% for IgG controls. With a P-value of 0.012 (Figure 6), these data indicate a statistically significant presence of HPRT on the surface of H460 cells while also demonstrating that the antigen shows no patterns of expression.
 | Figure 5 Scanning electron microscopy images and resulting EDAX in H460 cells. |
 | Figure 6 Gold percentage of H460 cells. |
HPRT expression in H460 cells is higher than expression within A549 cells
While HPRT is present on both H460 and A549 cells, there is a statistically significant difference between the amount of the protein expressed between the two cell lines (Figure 3). H460 cells have ~50% more protein on the surface when compared to A549 cells. This altered expression may directly correspond to tumor proliferation as H460 cells grow at a much faster rate, approximately double that of A549 cells. These results suggest that HPRT surface expression may be more prevalent in rapidly proliferating cells as the need for protein is increased.
HPRT is elevated in half of the patients with lung carcinoma
In ~50% of patients evaluated, there was a significant increase in HPRT expression (Figure 7). This increase in protein was significant when compared to normal lung tissue, whose expression was minimal. This different expression demonstrates HPRT variability between patients as only half of the patients experienced this increase in protein levels. In addition, the presence of HPRT also appears to be dependent on cell proliferation. On average, there was an increased expression of HPRT in stage III tissues in comparison with other tissue types (P=0.049). This indicates that HPRT overexpression may depend on cell proliferation as stage III tissue is more aggressive and has a higher proliferative capacity than stage II or stage I tissue (Figure 8).
 | Figure 7 Evaluation of HPRT expression within patient tissue. |
 | Figure 8 Statistical analysis of HPRT expression within patient tissue. |
Discussion
HPRT is a salvage pathway enzyme involved in the production of both guanine and inosine bases. The enzyme functions by transferring phosphoribose from PRPP to hypoxanthine or guanine bases to form IMP and GMP, respectively.23,24 Because of the proliferative capabilities of cancer cells and the large demand for nucleotide production, an upregulated expression at the HPRT locus is hypothesized in these environments.25 We have found that there is significant HPRT colocalization with the plasma membrane in H460 and A549 cancer cells. This same expression is not observed for the salvage pathway enzymes DCK and APRT, indicating that HPRT may possess a role in cancer that is not shared by other salvage pathway enzymes and could be a useful biomarker target for non-small-cell lung cancer.
The reason for the surface expression of HPRT is currently unknown, and the purpose of its external presentation in lung cancer cells can only be speculated.26 We hypothesize that this unique surface expression may point to a secondary function of HPRT that goes beyond its primary role as a purine synthesis enzyme. HPRT is already known to have a secondary regulatory role in neural development and purine synthesis as patients who have a deficiency of the enzyme develop a disease known as Lesch–Nyhan syndrome. This disease is characterized by severe neurological illness, hyperuricemia, and purine overproduction. Purine overproduction is directly related to the loss of HPRT function and demonstrates the enzyme’s necessary responsibility in cells to regulate and control certain pathways. The regulatory role of HPRT may be important for its unique role within cancer. Loss of strict HPRT regulation may enhance cellular proliferation and may contribute to tumor development as cells no longer have regulation of processes normally controlled or limited by HPRT. Further defining these secondary functions may provide additional information about the unique cellular interactions present in the tumor microenvironment.27,28
Although there is significant HPRT expression on A549 and H460 cells, the relative protein level is not equal between the cell lines. The differential expression of HPRT between these two cancer cell lines may be attributed to the growing capacity of the cells, as H460 cells grow at a rate that is nearly double the rate of A549 cells. In addition, H460 cells are known to be highly aggressive due to their increased vascularity and ability to metastasize.29–31 It is likely that the surface expression of HPRT may correspond with proliferation and tumor aggressiveness. This is further explored as stage III tissue stained with HPRT appears to be more prevalent in patient tissue.
We have shown this phenomenon in vitro, but further research into the in vivo expression is required to confirm whether HPRT could be utilized as a biomarker within patients, although we report a significant increase in HPRT within some patients. If found expressed in vivo, HPRT could be utilized in therapies to effectively treat non-small-cell lung cancer.
Conclusion
HPRT is expressed on the surface of NCI-H460 and A549 non-small-cell lung cancer cells and may be used as a biomarker target.
Acknowledgments
We thank the Simmons Center for Cancer Research for funding this work. We also thank Connor Peck for his editorial comments on the manuscript.
Disclosure
The authors report no conflicts of interest in this work.
References
American Cancer Society. Cancer Facts & Figures 2015. Atlanta, GA: American Cancer Society; 2015:1–9. | ||
Molina JR, Yang P, Cassivi SD, Schild SE, Adjei A. Non-small cell lung cancer: Epidemiology, Risk Factors, Treatment, and survivorship. Mayo Clin Proc. 2008;83(5):584–594. | ||
Planque C, Kulasingam V, Smith CR, Reckamp K, Goodglick L, Diamandis EP. Identification of five candidate lung cancer biomarkers by proteomics analysis of conditioned media of four lung cancer cell lines. Mol Cell Proteomics. 2009;8(12):2746–2758. | ||
Hanash SM, Pitteri SJ, Faca VM. Mining the plasma proteome for cancer biomarkers. Nature. 2008;452(7187):571–579. | ||
Singhal S, Vachani A, Antin-ozerkis D, Kaiser LR, Albelda SM. Prognostic implications of cell cycle, apoptosis, and angiogenesis biomarkers in non-small cell lung cancer: a review. Clin Cancer Res. 2005;11(11):3974–3987. | ||
Tan S, Sun C, Wei X, et al. Quantitative assessment of lung cancer associated with genes methylation in the peripheral blood. Exp Lung Res. 2013;39(4–5):182–190. | ||
Palmisano WA, Divine KK, Saccomanno G, et al. Predicting lung cancer by detecting aberrant promoter methylation in sputum. Cancer. 2000;60(21):5954–5958. | ||
Hua F, Fang N, Li X, Zhu S, Zhang W, Gu J. A meta-analysis of the relationship between RARβ gene promoter methylation and non-small cell lung cancer. PLoS One. 2014;9(5):1–8. | ||
Esteller M, Sanchez-Cespedes M, Rosell R, Sidransky D, Baylin SB, Herman JG. Detection of aberrant promoter hypermethylation of tumor suppressor genes in serum DNA from non-small cell lung cancer patients. Cancer Res. 1999;59(1):67–70. | ||
An Q, Liu Y, Gao Y, et al. Detection of p16 hypermethylation in circulating plasma DNA of non-small cell lung cancer patients. Cancer Lett. 2002;188(1–2):109–114. | ||
Zochbauer-Muller S, Fong KM, Virmani AK, Geradts J, Gazdar AF, Minna JD. Aberrant promoter methylation of multiple genes in non-small cell lung cancers. Cancer Res. 2001;61(1):249–255. | ||
Belinsky SA, Nikula KJ, Palmisano WA, et al. Aberrant methylation of p16(INK4a) is an early event in lung cancer and a potential biomarker for early diagnosis. Proc Natl Acad Sci U S A. 1998;95(20):11891–11896. | ||
Phillips M, Altorki N, Austin JHM, et al. Prediction of lung cancer using volatile biomarkers in breath. Cancer Biomark. 2007;3(2):95–109. | ||
Phillips M, Altorki N, Austin JHM, et al. Detection of lung cancer using weighted digital analysis of breath biomarkers. Clin Chim Acta. 2008;393(2):76–84. | ||
Schiller JH, Harrington D, Belani CP, et al. Comparison of four chemotherapy regimens for advanced non-small-cell lung cancer. N Engl J Med. 2002;346(2):92–98. | ||
Kim ES, Herbst RS, Wistuba II, et al. The BATTLE trial: personalizing therapy for lung cancer. Cancer Discov. 2011;1(1):44–53. | ||
Kim B, Lee HJ, Choi HY, et al. Clinical validity of the lung cancer biomarkers identified by bioinformatics analysis of public expression data. Cancer Res. 2007;67(15):7431–7438. | ||
Midna A, Dearden S, McCormack R. EGFR mutation incidence in non-small-cell lung cancer of adenocarcinoma histology: a systematic review and global map of ethnicity (mutMapII). Am J Cancer Res. 2015;5(9):2892–2911. | ||
Rich JN, Rasheed BKA, Yan H. EGFR mutations and sensitivity to gefitinib. N Engl J Med. 2004;351(12):1260–1261. | ||
Shepherd FA, Pereira JR, Ciuleanu T, et al. Erlotinib in previously treated non-small-cell lung cancer. N Engl J Med. 2005;353(2):123–132. | ||
Paez JG, Jänne PA, Lee JC, et al. EGFR mutations in lung cancer: correlation with clinical response to gefitinib therapy. Science. 2004;304(5676):1497–1500. | ||
Gogali A, Charalabopoulos K, Zampira I, et al. Soluble adhesion molecules E-cadherin, intercellular adhesion molecule-1, and E-selectin as lung cancer biomarkers. Chest. 2010;138(5):1173–1179. | ||
Wilson JM, Tarrt GE, Kelley WN. Human hypoxanthine (guanine) phosphoribosyltransferase: an amino acid substitution in a mutant form of the enzyme isolated from a patient with gout. Proc Natl Acad Sci U S A. 1983;80(3):870–873. | ||
Stout JT, Caskey CT. HPRT: gene structure, expression, and mutation. Annu Rev Genet. 1985;19:127–148. | ||
Linehan DC, Goedegebuure PS. CD25+ CD4+ regulatory T-cells in cancer. Immunol Res. 2005;32(1–3):155–168. | ||
Kessenbrock K, Plaks V, Werb Z. Matrix metalloproteinases: regulators of the tumor microenvironment. Cell. 2010;141(1):52–67. | ||
Nyhan WL. The Lesch-Nyhan Syndrome. Annu Rev Med. 1973;24(1):41–60. | ||
Bertelli M, Cecchin S, Lapucci C, et al. Study of the adenosinergic system in the brain of HPRT knockout mouse (Lesch-Nyhan disease). Clin Chim Acta. 2006;373(1–2):104–107. | ||
Gomez-Casal R, Bhattacharya C, Ganesh N, et al. Non-small cell lung cancer cells survived ionizing radiation treatment display cancer stem cell and epithelial-mesenchymal transition phenotypes. Mol Cancer. 2013;12(1):94. | ||
Manley E, Waxman DJ. H460 non-small cell lung cancer stem-like holoclones yield tumors with increased vascularity. Cancer Lett. 2014 April 28;346(1):63–73. | ||
Yue W, Sun Q, Landreneau R, Wu C, Siegfried JM, Zhang L. Fibulin-5 suppresses lung cancer invasion by inhibiting matrix metalloproteinase-7 expression. Cancer Res. 2010;69(15):6339–6346. |
Supplementary materials
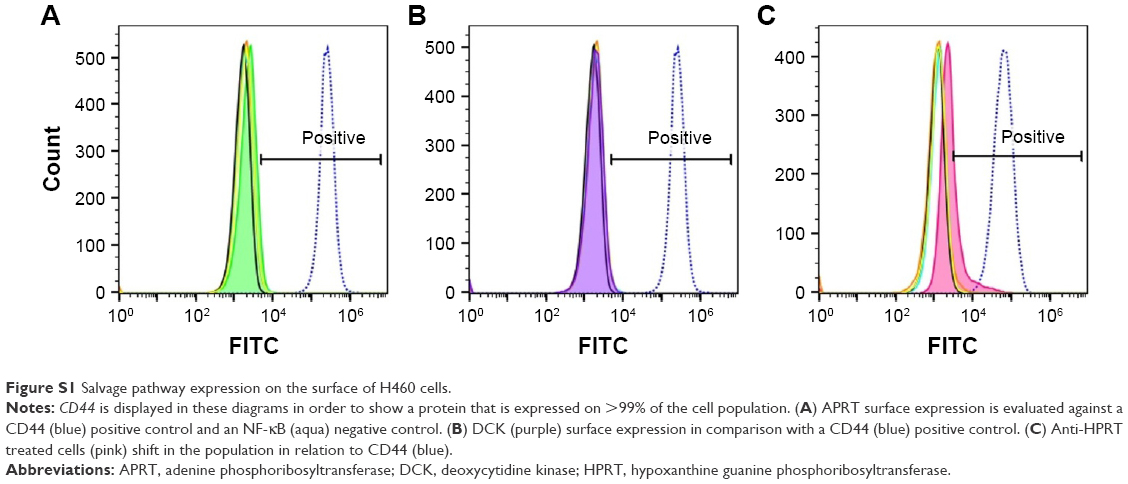 | Figure S1 Salvage pathway expression on the surface of H460 cells. |
 | Figure S2 HPRT surface expression on A549 non-small-cell lung cancer cells. |
 © 2017 The Author(s). This work is published and licensed by Dove Medical Press Limited. The
full terms of this license are available at https://www.dovepress.com/terms
and incorporate the Creative Commons Attribution
- Non Commercial (unported, 3.0) License.
By accessing the work you hereby accept the Terms. Non-commercial uses of the work are permitted
without any further permission from Dove Medical Press Limited, provided the work is properly
attributed. For permission for commercial use of this work, please see paragraphs 4.2 and 5 of our Terms.
© 2017 The Author(s). This work is published and licensed by Dove Medical Press Limited. The
full terms of this license are available at https://www.dovepress.com/terms
and incorporate the Creative Commons Attribution
- Non Commercial (unported, 3.0) License.
By accessing the work you hereby accept the Terms. Non-commercial uses of the work are permitted
without any further permission from Dove Medical Press Limited, provided the work is properly
attributed. For permission for commercial use of this work, please see paragraphs 4.2 and 5 of our Terms.