Back to Journals » Cancer Management and Research » Volume 11
Nomograms for estimating survival in patients with papillary thyroid cancer after surgery
Received 13 November 2018
Accepted for publication 19 February 2019
Published 24 April 2019 Volume 2019:11 Pages 3535—3544
DOI https://doi.org/10.2147/CMAR.S194366
Checked for plagiarism Yes
Review by Single anonymous peer review
Peer reviewer comments 2
Editor who approved publication: Dr Chien-Feng Li
Gang Liu,1 Qin Liu,2 Sheng-Rong Sun1
1Department of Breast and Thyroid Surgery, Renmin Hospital of Wuhan University, Wuhan, Hubei 430060, China; 2Department of Breast Surgery, Thyroid Surgery, Huangshi Central Hospital of Edong Healthcare Group, Hubei Polytechnic University, Huangshi, Hubei, 435000, China
Background: The aim of this study was to develop and validate nomograms to predict the survival in patients with papillary thyroid cancer (PTC).
Patients and methods: Adult patients who were surgically treated for PTC were selected from the Surveillance, Epidemiology and End Results (SEER) program (2004–2013). A multivariate analysis using the Cox proportional hazards regression was performed, and nomograms for predicting 10-year overall survival (OS) and cancer-specific survival (CSS) were constructed. The discrimination and calibration plots were used to measure the accuracy of the nomograms.
Results: The records of 63,219 patients with PTC were retrospectively analyzed. Nine independent factors including age, race, sex, marital status, tumor size, extrathyroidal extension, radioactive iodine, T stage, and M stage were assembled into the OS nomogram. A nomogram predicting CSS was constructed based on eight factors (age, sex, marital status, tumor size, extrathyroidal extension, T stage, N stage, and M stage). With respect to the training set, the nomograms displayed improved discrimination power compared to the TNM staging system (6th edition) in both sets. The calibration curve for the probability of survival showed agreement between the predictive nomograms and the actual observation.
Conclusion: We have successfully developed prognostic nomograms to predict OS and CSS for PTC with excellent discrimination and calibration.
Keywords: papillary thyroid cancer, nomogram, SEER, prognosis
Introduction
Thyroid cancer (TC) is the most common endocrine malignancy, with an estimated 53,990 new cases in the US in 2018.1 The incidence rate for TC has increased more than 2.5 folds (5.57/100,000–13.98/100,000) in the recent decades.2 This progressive increase was nearly entirely attributable to an increase in papillary thyroid carcinoma (PTC). Differentiated thyroid carcinoma is the major subtype of TC, and is subdivided into papillary thyroid carcinoma (PTC) and follicular thyroid carcinoma (FTC). PTC is the most common type of differentiated TC, accounting for approximately 90% of all the cases.3 Radical surgical intervention remains the primary treatment for TC. Despite a favorable rate of survival for PTC, the risk of recurrence ranges from 5% to 21%.4,5
The TNM Cancer Staging System of the American Joint Committee on Cancer (AJCC) is the most widely used system to predict the survival outcomes.6 In this classification system, patients are stratified according to depth of invasion (T), number of metastatic nodes (N), and the status of distant metastasis (M). This system is effective for patient populations but is not very useful in predicting individual patient outcomes.7 In addition, it does not account for other variables, such as sex, race, marital status, multifocality, surgery, presence of vascular invasion, margin status, and radioactive iodine, which have been identified as independent prognostic factors in TC.8–10
Nomograms have been accepted as reliable tools to accurately predict an individual’s clinical outcome by utilizing multiple variables. Nomograms provide a visual explanation for the predicted probabilities of an outcome as obtained by statistical predictive models. They were created by regression analysis and have extended beyond the standard TNM anatomical criteria.11 Nomograms have been widely used in multiple malignancies due to their ability to handle the complexity in a systematic and unbiased manner.12–15 Well-designed nomograms have been incorporated into the National Comprehensive Cancer Network (NCCN) guidelines.16,17 Nevertheless, no nomograms are available for individual PTC patients on the basis of population-based data. Therefore, we aimed to develop a prognostic nomogram based on the large population of PTC data retrieved from the Surveillance, Epidemiology and End Results (SEER) database, to predict the individualized survival in patients with PTC.
Patients and methods
Patients
This study is a retrospective cohort analysis using data from the SEER database which was designed and maintained by the National Cancer Institute (NCI). The SEER database collects clinical information on various cancer types for associated incidence, prevalence, and survival from 17 population-based cancer registries covering approximately 28% of the US population.18 We used the SEER*STAT software (version 8.3.5) to extract data from the SEER database. The cohort for this analysis consisted of adult patients (≥18 years) diagnosed with PTC who underwent thyroid surgery between 2004 and 2013. The histological subtypes of PTC were limited using the site code C73.9 and the International Classification of Diseases for Oncology-3: 8050, 8260, 8340–8344. The exclusion criteria were: (1) patients with second primary malignancies, (2) patients diagnosed at autopsy and those lost to follow-up, and (3) patients with incomplete clinical information (marital status, cause of death, survival month, tumor size, staging information, and follow-up months). All patients were randomly assigned to either the training set for nomograms or the validation set for the purposes of validation. Neither ethical approval nor informed consent was required because the data is publicly available, and the database does not hold any identifying patient data.
Variables
Several variables, including age, sex, race, marital status, tumor size, extrathyroidal extension, multifocality, surgery, radioactive iodine, T stage, N stage, and M stage were collected in the training set. Tumor size was categorized as “≤1.0 cm”, “1.1–2.0 cm”, “2.1–4.0 cm”, and “>4 cm”. The primary end point was the overall survival (OS) and cancer specific survival (CSS). While the OS was defined as the time from diagnosis of PTC to death or censoring, the CSS was defined as the time from diagnosis to death due to PTC or censoring.
Statistical analyses
The baseline patient features were compared using the Chi-square test. Survival curves were depicted using the Kaplan-Meier method and compared using the log-rank test. The construction of nomograms was based on the independent prognostic variables determined by multivariate Cox proportional hazards regression analyses. Variables were selected through the backward stepwise selection method with a threshold of P<0.050. The performance of the nomogram was evaluated by discrimination and calibration. Discrimination was assessed using the concordance index (C-index), which is similar to the area under receiver operating characteristic (ROC) curve (AUC), with values ranging from 0.5 (no discrimination) to 1.0 (perfect discrimination).19 Calibration was performed by comparing the observed versus predicted mean survival rate. Significance was achieved at P<0.05 in a two-tailed test. Statistical analyses were conducted using the SPSS version 23 (IBM, Armonk, NY, USA), and the nomogram was constructed using R version 3.5.1 (
Results
Clinicopathological features
In total, 63,219 eligible PTC patients were selected and randomly assigned into a training set (n=31,610) and a validation set (n=31,609). The flow diagram of data selection is presented in Figure 1. In the whole study cohort, 35,337 (55.9%) patients were older than 45 years. While 49,959 (79.0%) patients were women, 13,260 (21.0%) of them were men. Most tumors (55.6%) were ≤1.0 cm in size. Multifocal tumors were observed in 26,546 (42.0%) patients and a gross extrathyroidal extension of cancer in 10,047 (15.9%) patients. Total thyroidectomy was performed in 83.4% of all the patients, and 49.0% of them received adjuvant radioactive radioiodine. Most patients (62.5%) were categorized as having T1 stage cancer. Additionally, a few patients had lymph node invasion (22.6%) and distant metastasis (99.2%) at diagnosis.
 | Figure 1 Flow chart of the data selection process.Abbreviation: PTC, papillary thyroid cancer. |
The median follow-up was 68 months (1–143 months). By the end of the follow up, 2015 of the 63,219 (3.2%) patients had died, which included 545 deaths due to PTC and 1,470 due to other causes. The clinicopathologic characteristics of the patients are listed in Table 1.
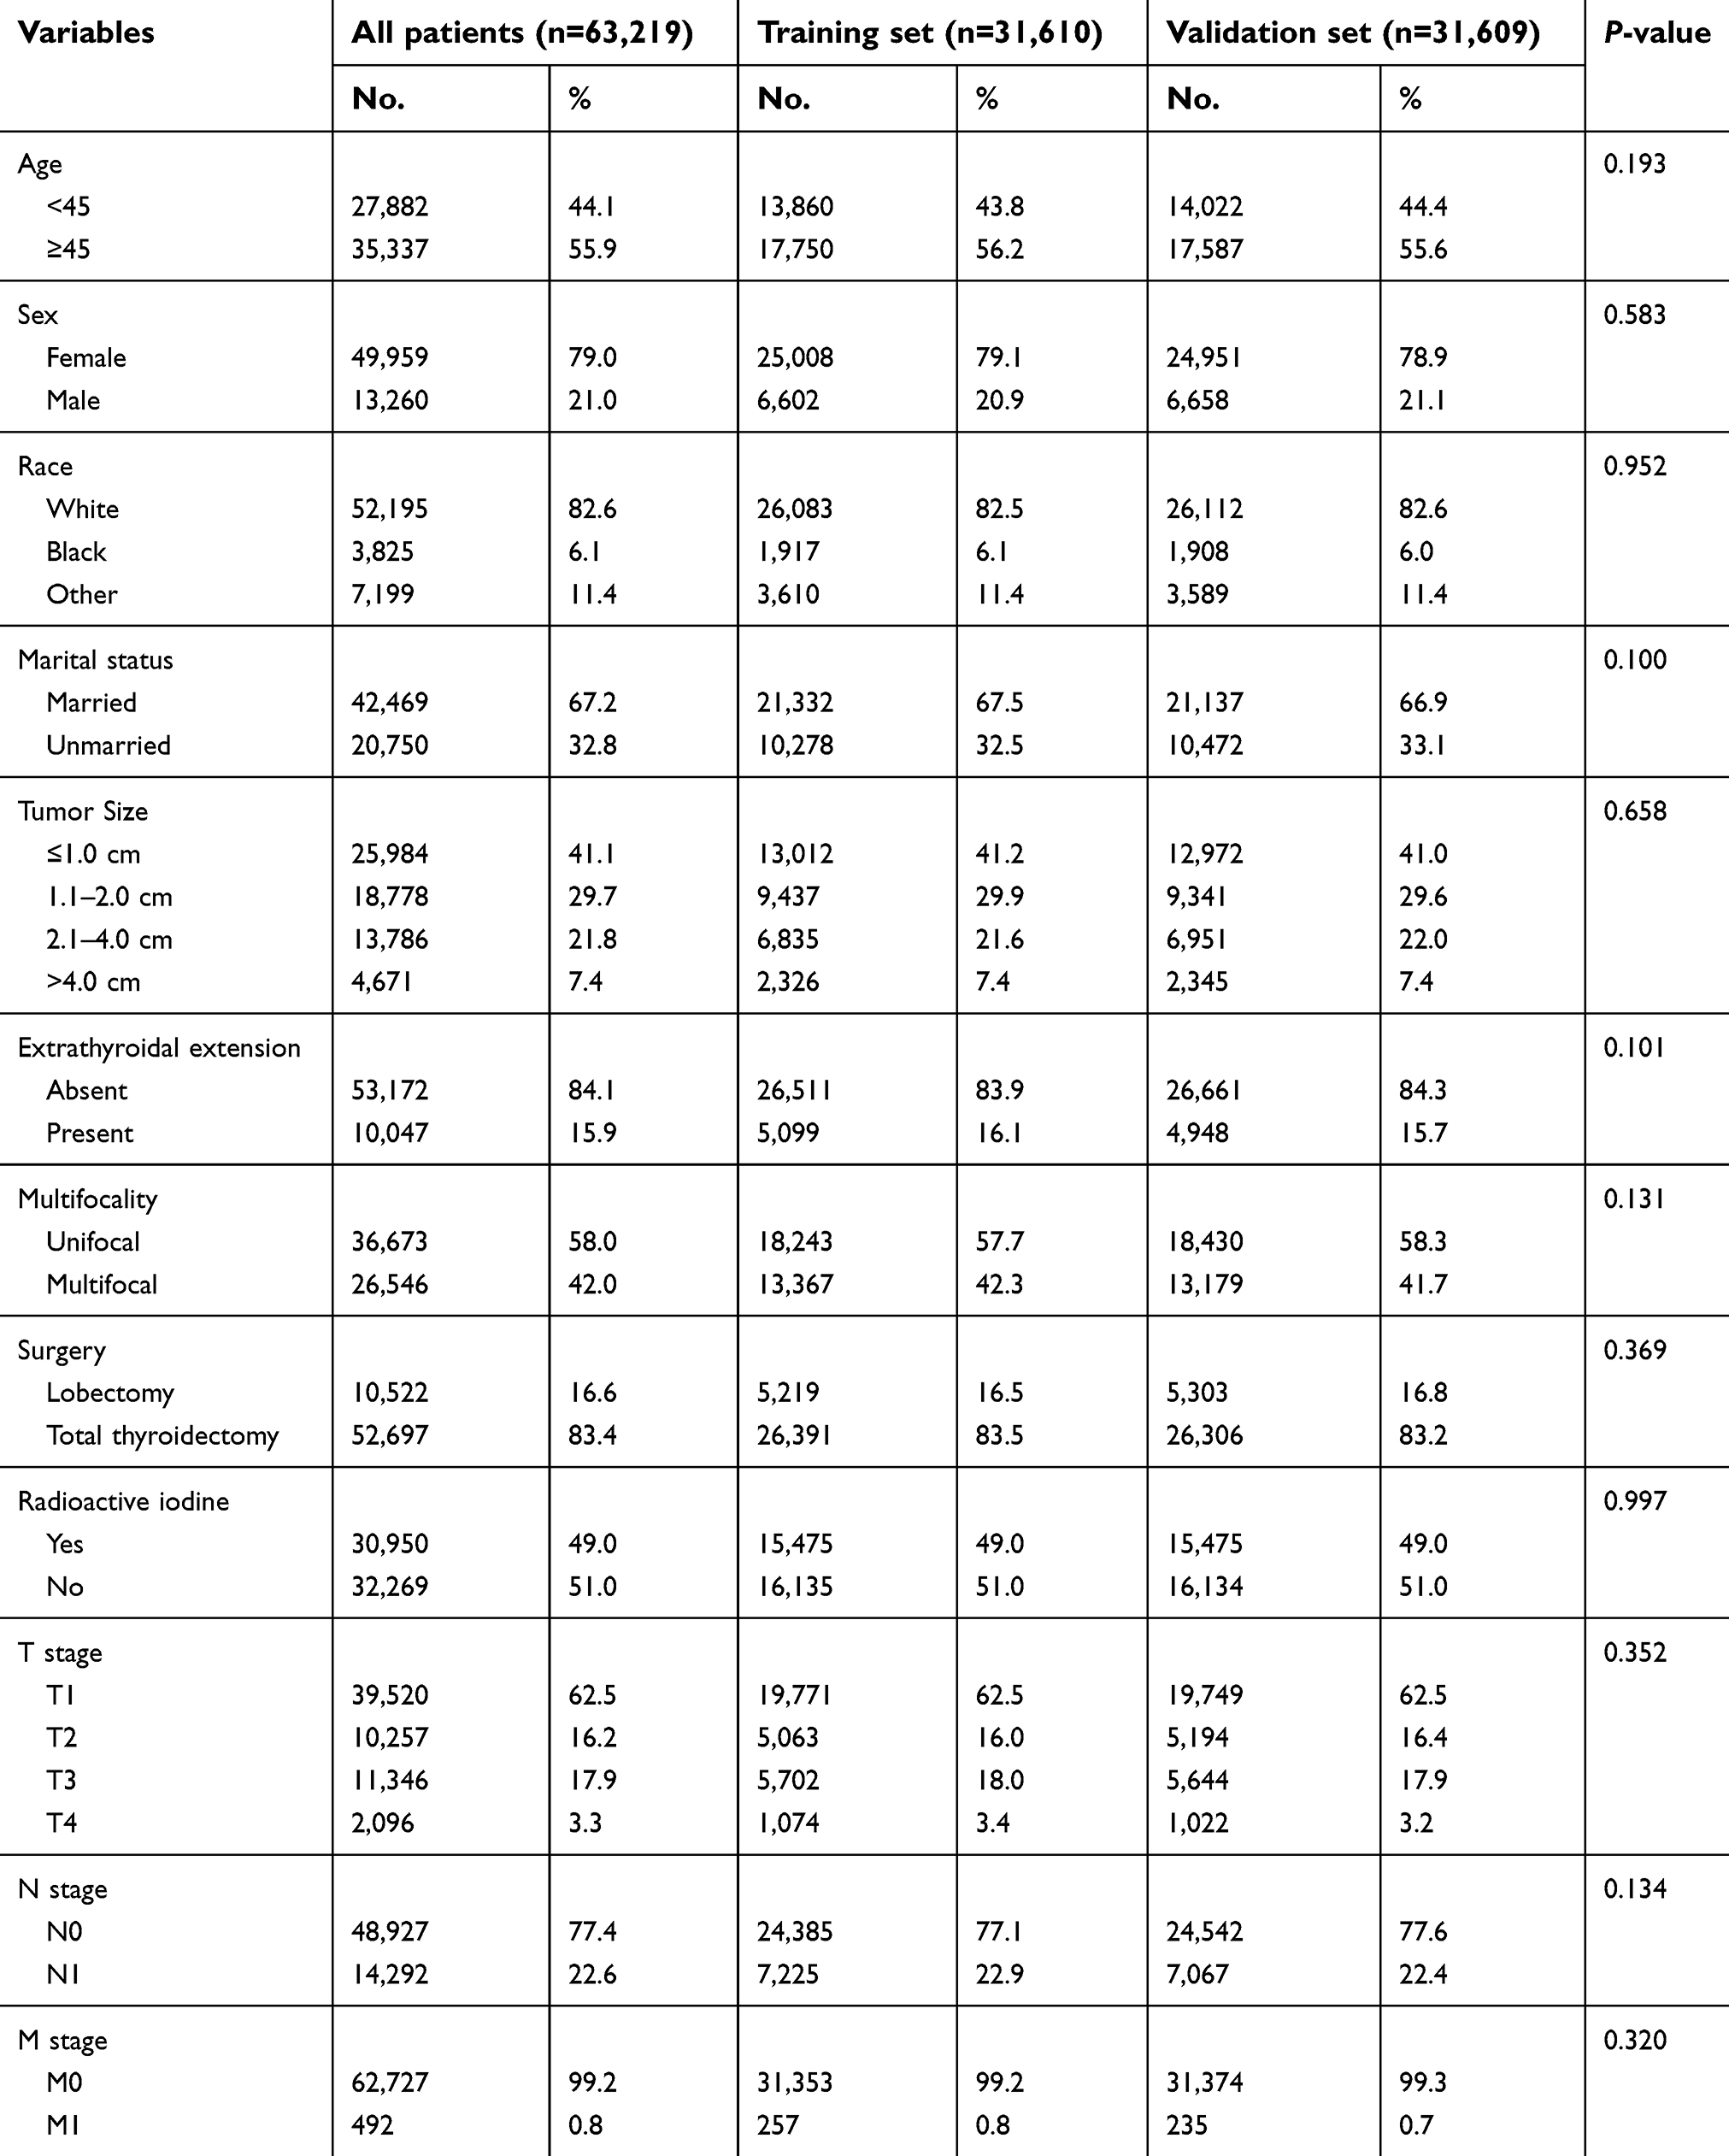 | Table 1 Patient demographics and pathological characteristics |
Construction and validation of nomograms
Data on age at diagnosis, sex, race, marital status, tumor size, extrathyroidal extension, multifocality, surgery, radioactive iodine, T stage, N stage, and M stage were collected and analyzed for patients in both the training and validation sets. Univariate analysis showed that 10 of the above variables were significantly associated with OS in the training set (P<0.05). After performing a multivariate analysis, 9 out of the 10 variables (age, sex, race, marital status, tumor size, extrathyroidal extension, radioactive iodine, T stage, and M stage) were found to be significantly associated with OS (Table 2). Therefore, a nomogram of the OS was established with these independent variables in the training set (Figure 2A). As is shown in Table 3, 8 variables (age, sex, marital status, tumor size, extrathyroidal extension, T stage, N stage, and M stage) were confirmed to have a significant impact on patient CSS by both univariate and multivariate analyses in the training set (P<0.05). A nomogram for predicting the 10-year CSS was constructed based on the independent variables (Figure 2B).
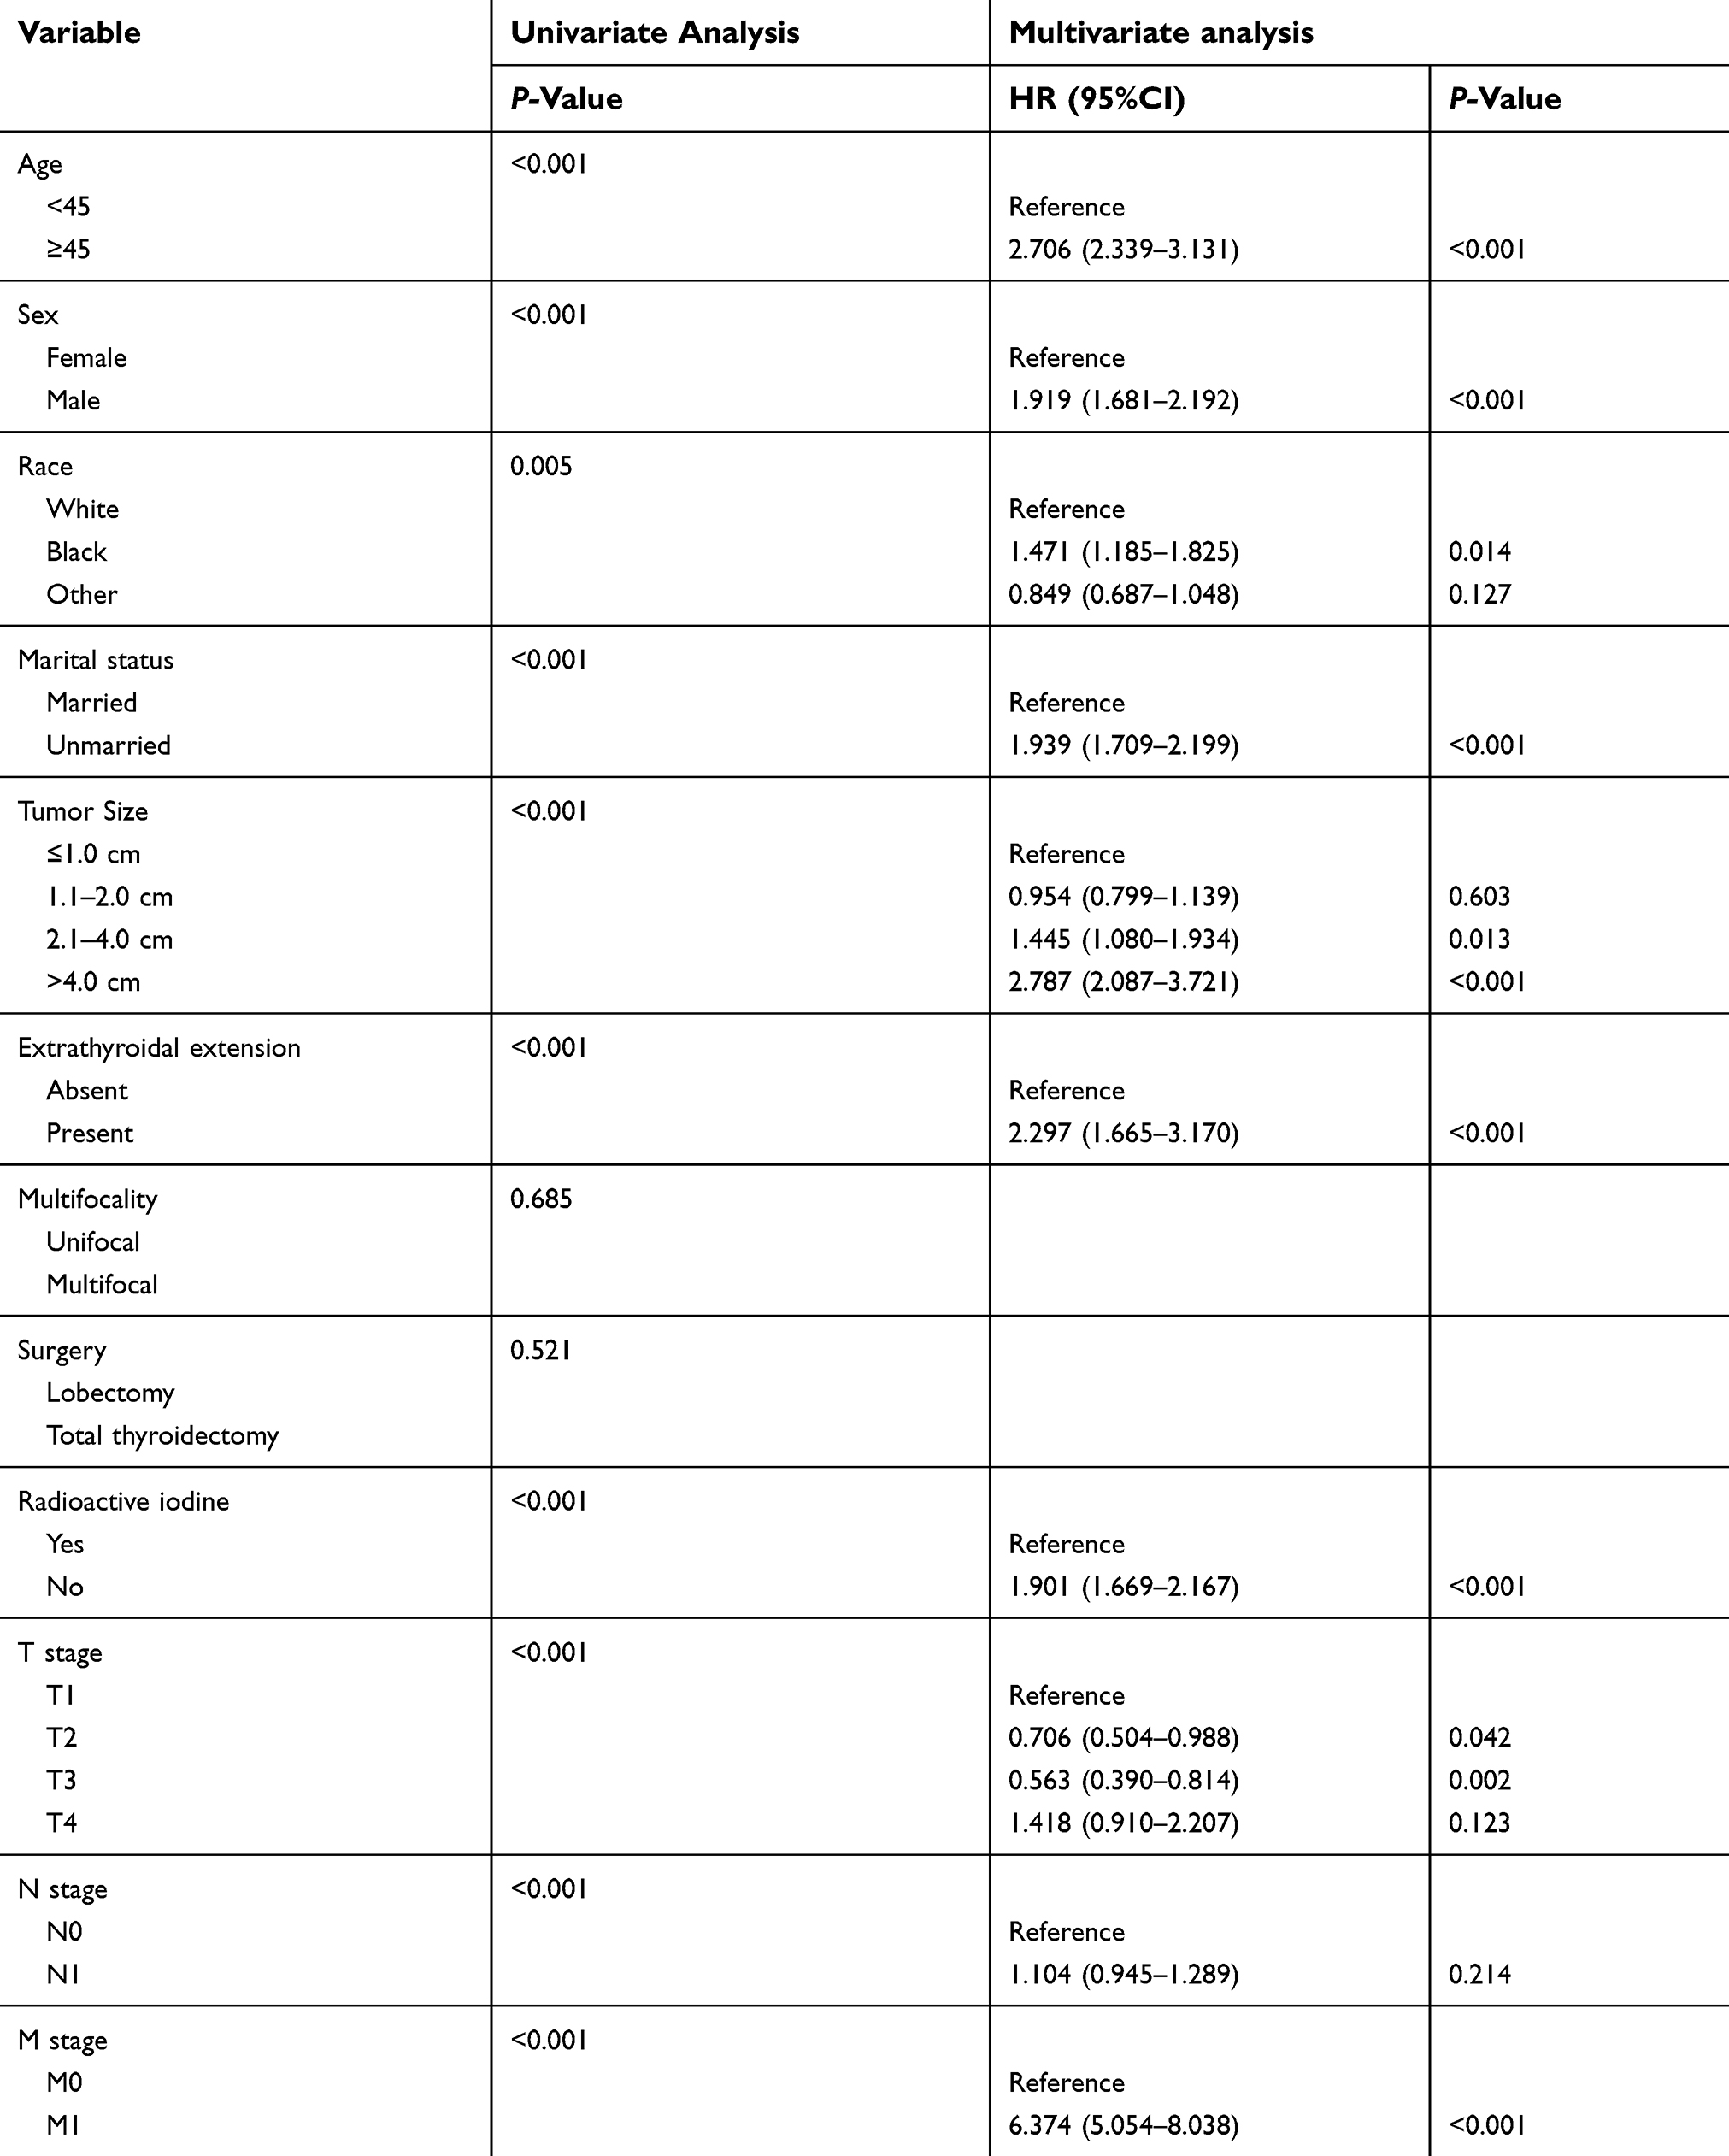 | Table 2 Univariate and multivariate analyses of overall survival in the training set |
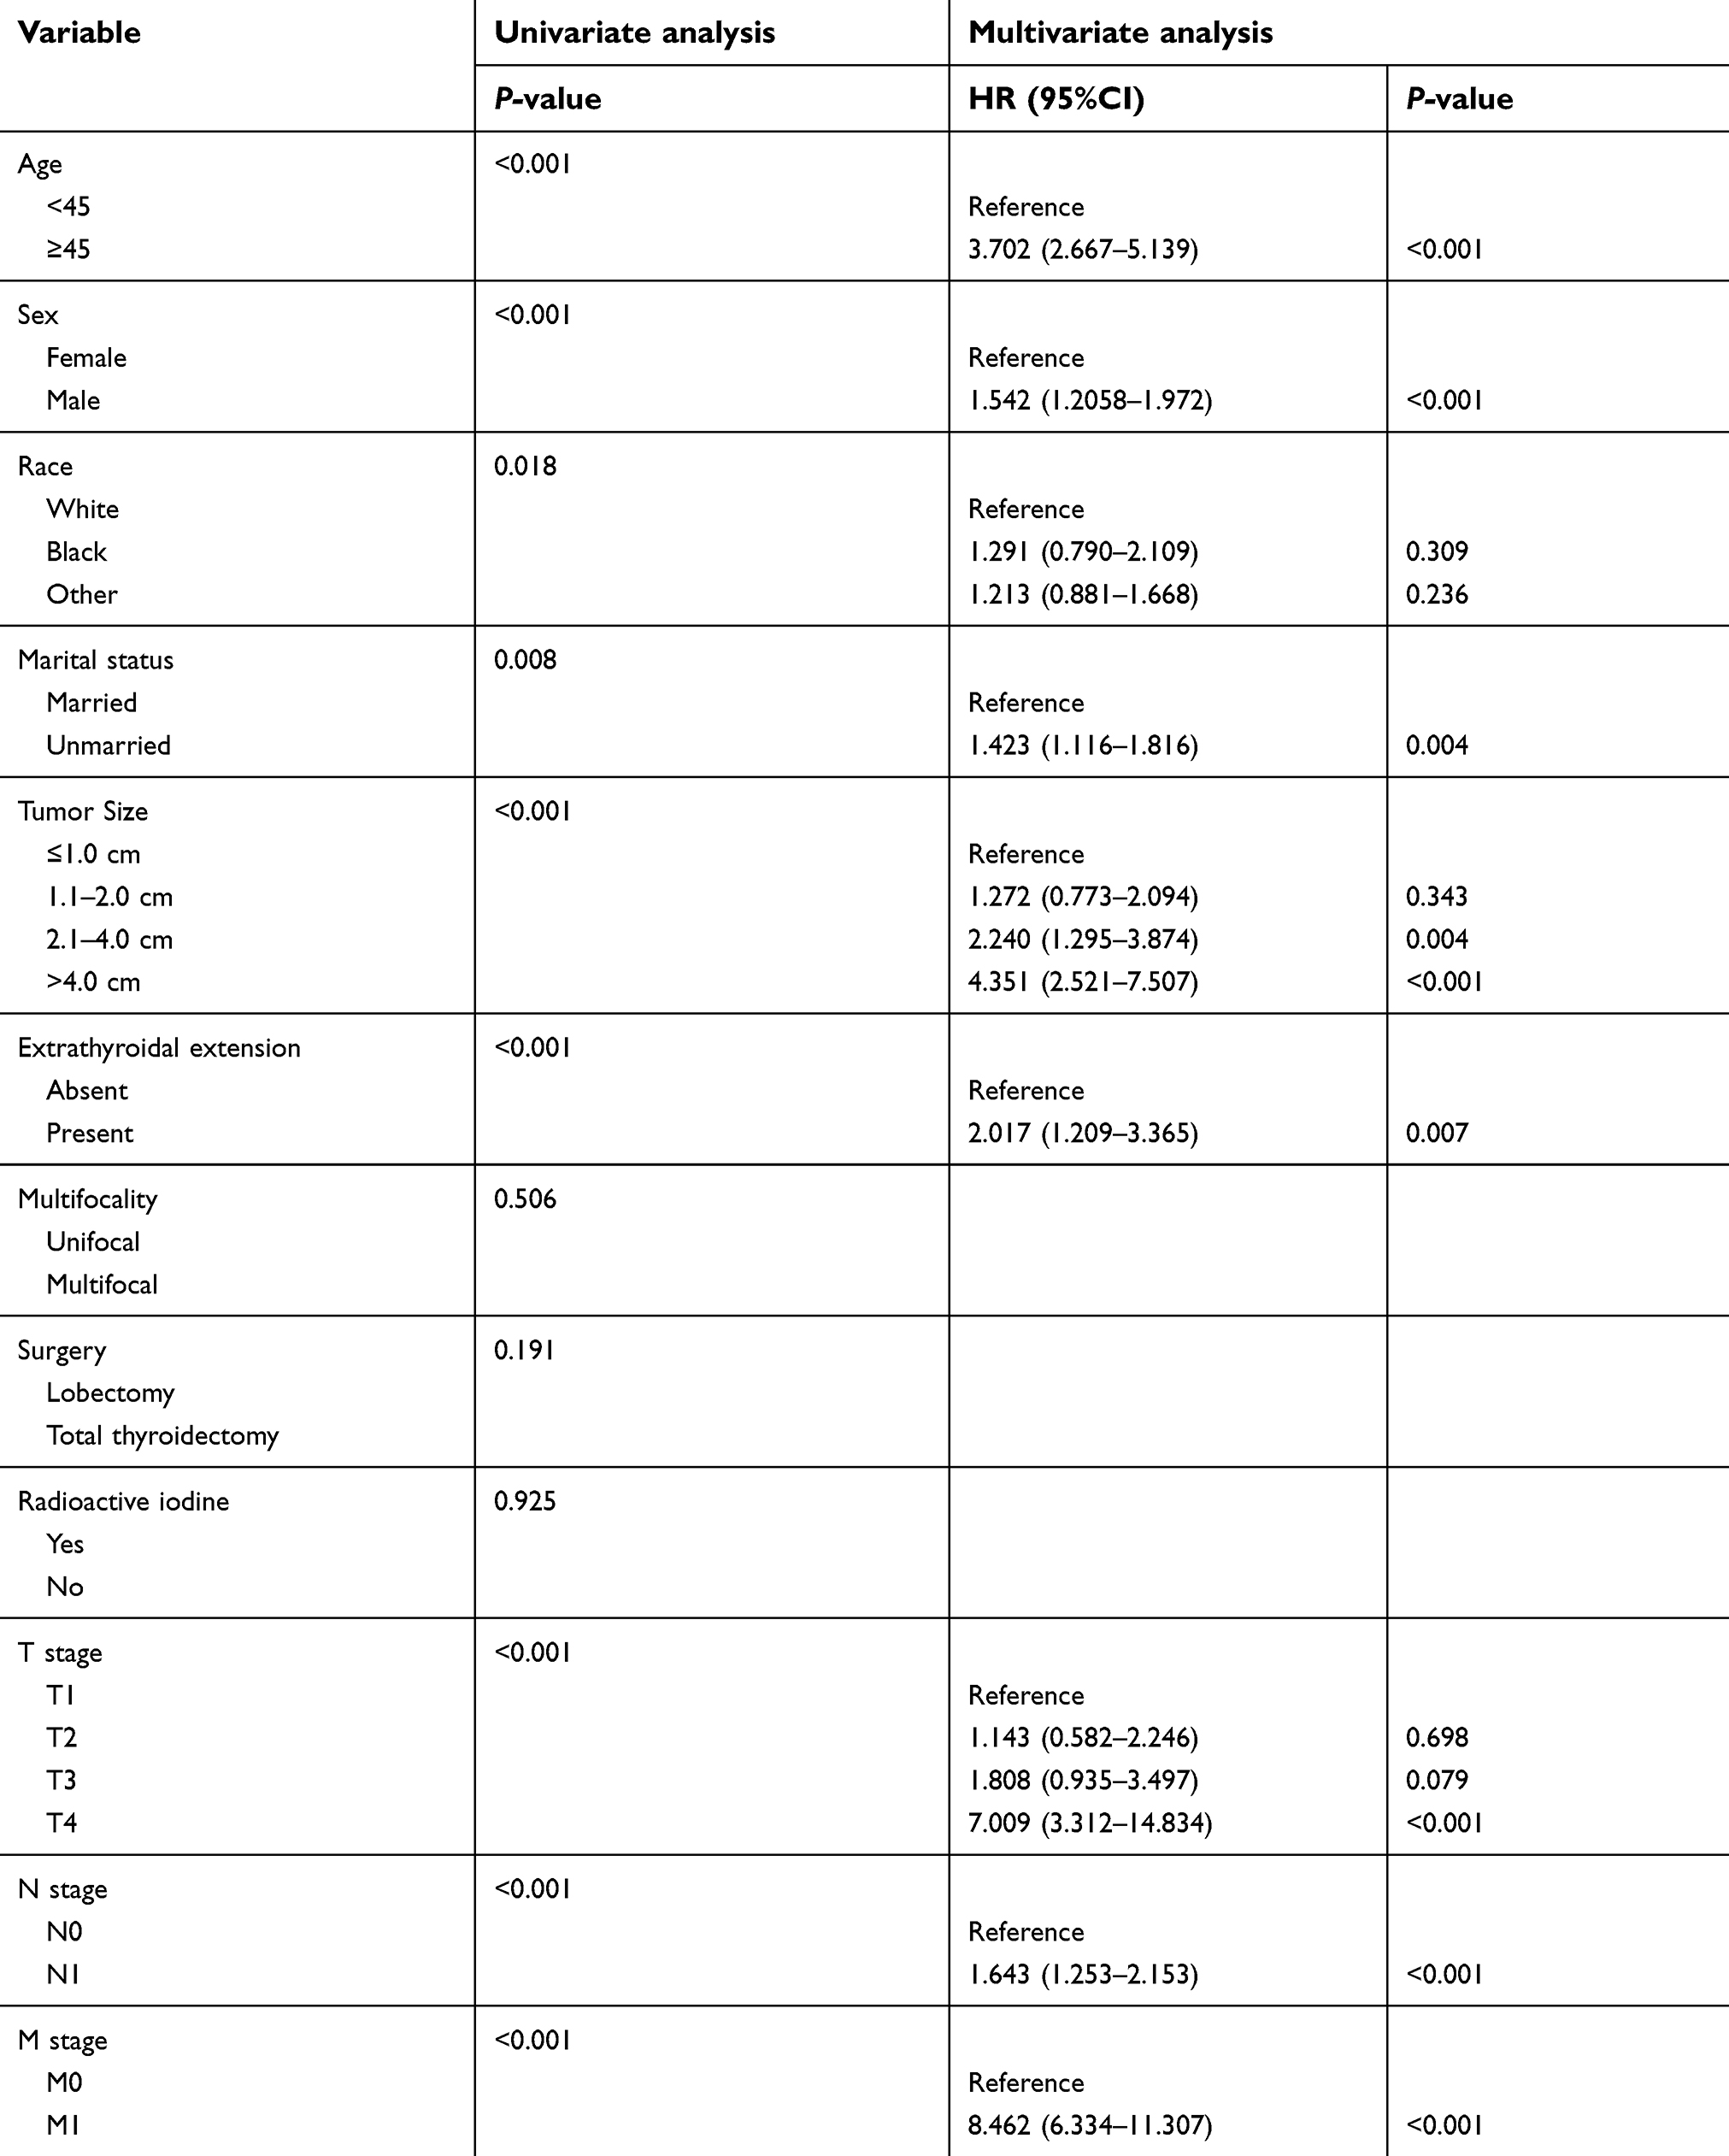 | Table 3 Univariate and multivariate analyses of cancer-specific survival in the training set |
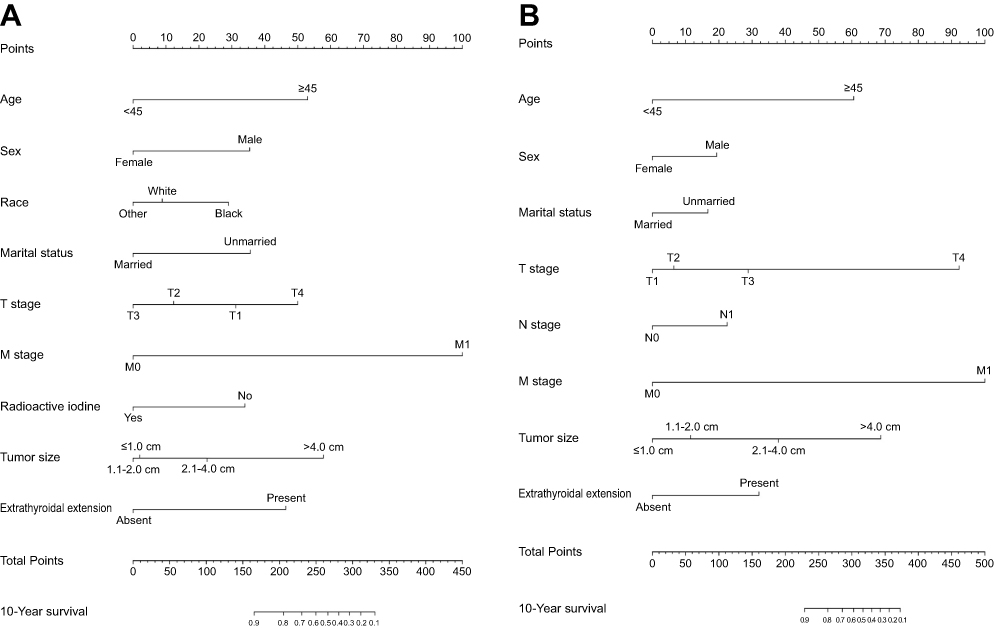 | Figure 2 Nomogram for predicting 10-year OS (A) and CSS (B) of patients with PTC. |
We next validated the nomograms. Following an internal validation in the training set, the C-indices for the nomograms to predict the OS and CSS were 0.776 (95% CI: 0.770–0.792) and 0.924 (95%CI: 0.907–0.941), respectively. Following an external validation using the validation set, C-indices were found to be 0.770 (95% CI: 0.753–0.787) and 0.925 (95% CI: 0.905–0.945) for the OS and CSS nomograms, respectively. The calibration curve showed good agreement between prediction and observation in the probability of 10-year OS and CSS in both the training and validation sets (Figure 3). Furthermore, comparisons were performed between the nomograms and TNM 6th staging system in the training set. Results comparable to those of the TNM staging system were obtained with nomograms for the OS (C-index=0.776, 95% CI: 0.770–0.792 vs 0.317, 95% CI: 0.301–0.333) and CSS (C-index=0.924, 95% CI: 0.907–0.941 vs 0.152, 95% CI: 0.136–0.168). Moreover, discrimination was also enhanced with the nomogram compared to the TNM staging system when analyzed in the validation set (Table 4).
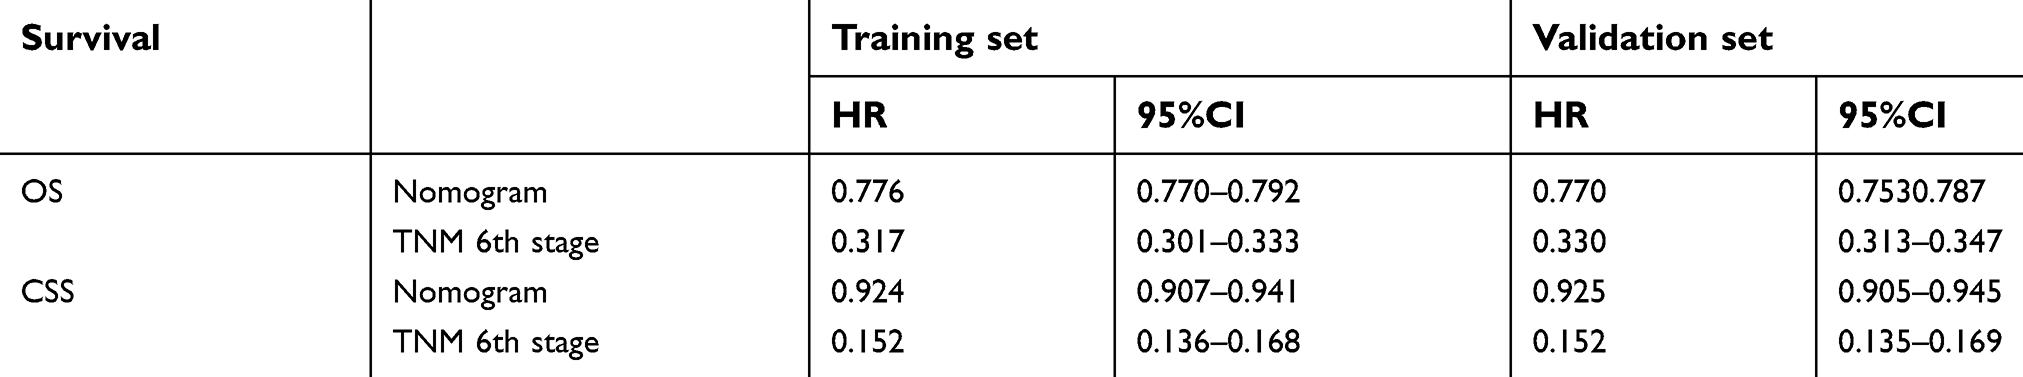 | Table 4 C-indexes for the nomograms and other stage systems in patients with PTC |
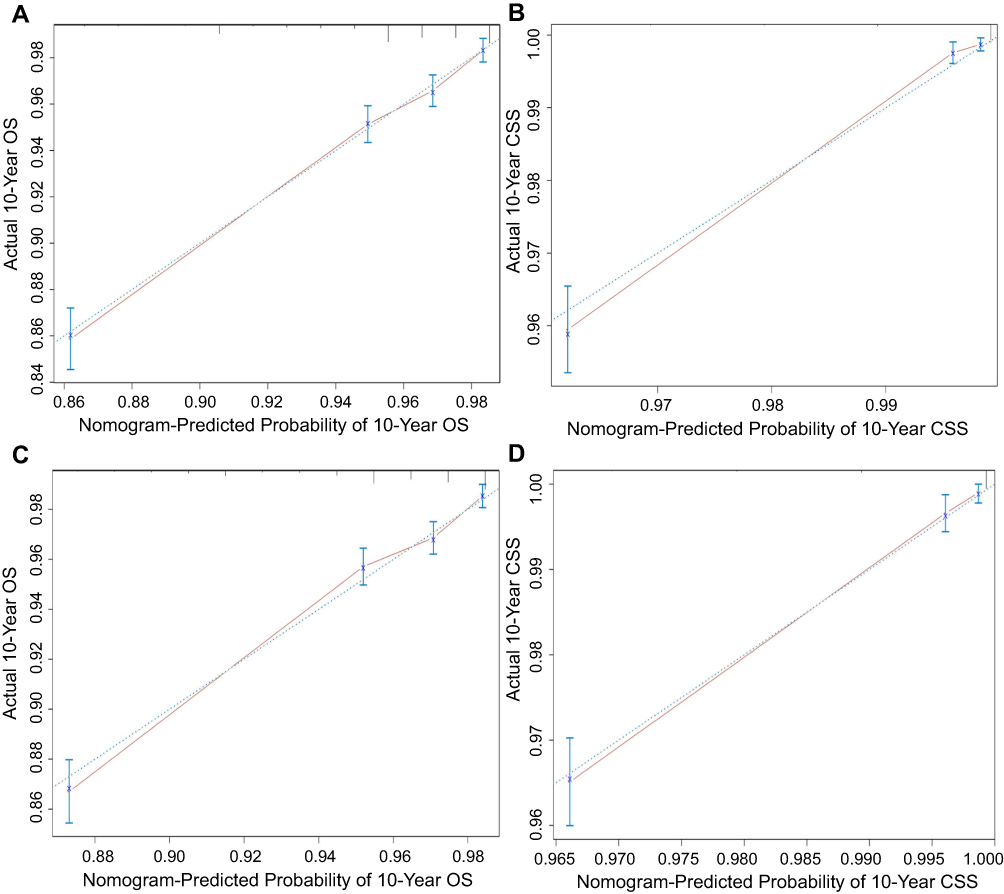 | Figure 3 Calibration plots of the training and validation sets for the OS and CSS associated nomograms.Notes: (A, B) The calibration plots of the training set in 10-year OS and CSS; (C, D) the calibration plots of the validation set in 10-year OS and CSS. The x-axis represents the nomogram-predicted survival rate, whereas the y-axis represents the actual survival rate.Abbreviations: OS, overall survival; CSS, cancer-specific survival. |
Comparison of AUC values of the nomogram and TNM 6th staging system
The predictive abilities of the nomograms and the TNM 6th staging system were compared by analyzing the AUC values (Figure 4). The AUC values for the nomogram and the TNM 6th staging system predicting the 10-year OS rates were 0.734 and 0.524, respectively, while those for predicting the 10-year CSS rates were 0.894 and 0.569, respectively. Taken together, the OS and CSS nomograms showed superior discriminative capacity compared to the TNM 6th staging system.
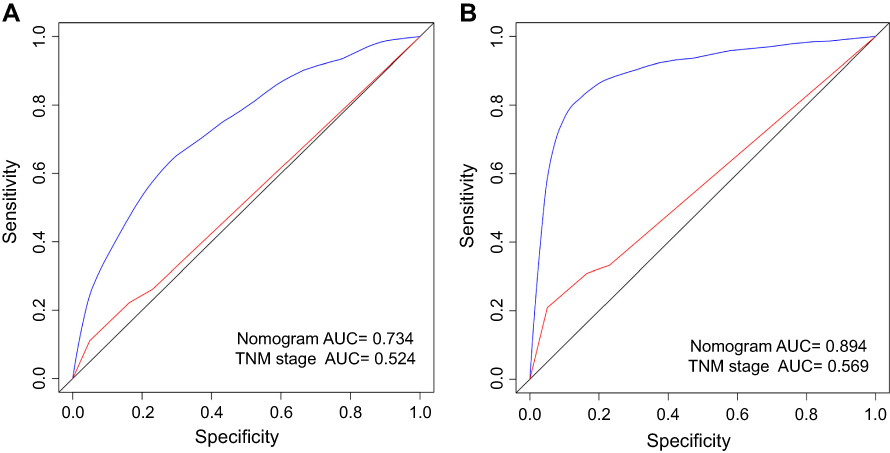 | Figure 4 Comparison of the AUCs of the nomogram and TNM staging system in training set.Notes: Area under the curves of the two models to predict 10-years OS (A) and CSS (B) in the training set. The blue lines represent nomogram-predicted overall survival rates, whereas the red lines represent TNM stage-predicted overall survival rates.Abbreviations: AUC, area under ROC curve; CSS, cancer-specific survival; OS, overall survival; ROC, receiver operating characteristic. |
Discussion
Several scoring systems are used for prognostic purposes. Although these systems are easier to use in the clinic, they provide a stratified population risk assessment rather than an individualized patient risk.6,20–22 Nomograms are useful tools, which have been widely used for predicting survival outcomes in individual patients. They address the complexity of balancing different variables through statistical modelling and risk quantification. Their systematic approach also avoids the bias of individual physicians or individual abnormal clinical variables. Nomograms have been proven to be superior to the traditional staging scoring systems in a variety of tumors.15,23,24 In addition, they may be the most valuable when the potential benefits of added therapy are unclear.25,26 They are also very useful for individualized risk stratification and help doctors in the management of clinical care when no firm guidelines are available.
To the best of our knowledge, this is the first study that describes the development and validation of nomograms to predict 10-year OS and CSS in patients with PTC. A total of 63,219 patients from the SEER dataset were analyzed in this study. Our nomograms displayed favorable discrimination and calibration. Furthermore, the ROC curve showed that the nomograms had better predictive ability than the 6th AJCC staging system. Our nomogram models are easy-to-use clinical tools which can help with patient counselling and personalized treatment.
Our nomograms identified several independent factors that could influence the prognosis in PTC patients. The results showed that most patients older than 45 years of age had the worst OS and CSS. Studies have shown that age is a major determinant of thyroid CSS.27 Older age has been identified as an independent risk factor, suggesting that older patients have lower survival rates.28–30 Multiple studies have found that patients with TC who are older than 45 years of age usually have a poor prognosis.8,31 With advancing age, there is a higher risk of a histological phenotype.32 The previous edition of the AJCC staging system used 45-years as the cut-off value for age, while the recent eight edition uses 55 years. However, regardless of the cut-off value, age is identified as an important prognostic factor.
The difference in the incidence of TC in the two sexes has also been well documented.33 The incidence of TC is higher in women compared to men, though the clinical outcomes are worse in men.34 Our results were consistent with those of previous studies. In addition to the above factors, marital status, tumor size, extrathyroidal extension, T stage, N stage, and M stage were also identified as significant predictors of prognosis. However, we found that multifocality, surgery, and radioactive iodine were not risk factors of the 10-year CSS.
Our study has several limitations. First, the nomograms were constructed from retrospective data. Therefore, the potential risk of selection bias cannot be ruled out. Second, due to the rare specific mortality in PTC, the evaluation of the risk of recurrence may be more meaningful than death. However, the SEER database did not have data on recurrence, and therefore it could not be evaluated. Third, in spite of the patients being chosen randomly, there was still a significant difference between the numbers of male and female patients, which could have resulted in gender bias. Finally, some other critical prognostic factors, such as margin status, calcitonin, extent of surgery, radioiodine dosage, thyrotropin suppression, BRAF point mutation, and TERT promotor point mutation, were unavailable in the SEER database.
In conclusion, we were successful in establishing and validating nomograms to predict the 10-year OS and CSS in individual patients with PTC based on a large study cohort. Our nomograms could be convenient, individualized predictive tools for prognosis, which can help surgeons perform personalized survival evaluation and mortality risk identification in PTC patients.
Acknowledgment
The authors gratefully acknowledge the SEER for allowing open access to their database.
Author contributions
GL and SRS participated in study design and data collection. GL and QL analyzed and interpreted the data. All authors contributed to data analysis, drafting and revising the article, gave final approval of the version to be published, and agree to be accountable for all aspects of the work.
Disclosure
The authors report no conflicts of interest in this work.
References
1. Siegel RL, Miller KD, Jemal A. Cancer statistics, 2018. CA Cancer J Clin. 2018;68(1):7–30. doi:10.3322/caac.21442
2. Mao Y, Xing M. Recent incidences and differential trends of thyroid cancer in the USA. Endocr Relat Cancer. 2016;23(4):313–322. doi:10.1530/ERC-15-0445
3. Haugen BR, Alexander EK, Bible KC, et al. 2015 American Thyroid Association management guidelines for adult patients with thyroid nodules and differentiated thyroid cancer: the American Thyroid Association guidelines task force on thyroid nodules and differentiated thyroid cancer. Thyroid. 2016;26(1):1–133. doi:10.1089/thy.2015.0020
4. Liu FH, Kuo SF, Hsueh C, Chao TC, Lin JD. Postoperative recurrence of papillary thyroid carcinoma with lymph node metastasis. J Surg Oncol. 2015;112(2):149–154. doi:10.1002/jso.23967
5. Grant CS. Recurrence of papillary thyroid cancer after optimized surgery. Gland Surg. 2015;4(1):52–62. doi:10.3978/j.issn.2227-684X.2014.12.06
6. Amin MB, Greene FL, Edge SB, et al. The Eighth Edition AJCC Cancer Staging Manual: continuing to build a bridge from a population-based to a more “personalized” approach to cancer staging. CA Cancer J Clin. 2017;67(2):93–99. doi:10.3322/caac.21388
7. Ho AS, Wang L, Palmer FL, et al. Postoperative nomogram for predicting cancer-specific mortality in medullary thyroid cancer. Ann Surg Oncol. 2015;22(8):2700–2706. doi:10.1245/s10434-014-4208-2
8. Tang J, Kong D, Cui Q, et al. Racial disparities of differentiated thyroid carcinoma: clinical behavior, treatments, and long-term outcomes. World J Surg Oncol. 2018;16(1):45. doi:10.1186/s12957-018-1340-7
9. Feng J, Shen F, Cai W, Gan X, Deng X, Xu B. Survival of aggressive variants of papillary thyroid carcinoma in patients under 55 years old: a SEER population-based retrospective analysis. Endocrine. 2018. doi:10.1007/s12020-018-1644-y
10. Shi LY, Liu J, Yu LJ, Lei YM, Leng SX, Zhang HY. Clinic-pathologic features and prognostic analysis of thyroid cancer in the older adult: a SEER based study. J Cancer. 2018;9(15):2744–2750. doi:10.7150/jca.24625
11. Iasonos A, Schrag D, Raj GV, Panageas KS. How to build and interpret a nomogram for cancer prognosis. Journal Clinical Oncol. 2008;26(8):1364–1370. doi:10.1200/JCO.2007.12.9791
12. Attiyeh MA, Fernandez-Del Castillo C, Al Efishat M, et al. Development and validation of a multi-institutional preoperative nomogram for predicting grade of dysplasia in intraductal papillary mucinous neoplasms (IPMNs) of the pancreas: a report from the pancreatic surgery consortium. Ann Surg. 2018;267(1):157–163. doi:10.1097/SLA.0000000000002015
13. Chen S, Lai Y, He Z, et al. Establishment and validation of a predictive nomogram model for non-small cell lung cancer patients with chronic hepatitis B viral infection. J Transl Med. 2018;16(1):116. doi:10.1186/s12967-018-1496-5
14. Sonpavde G, Pond GR, Rosenberg JE, et al. Nomogram to assess the survival benefit of new salvage agents for metastatic urothelial carcinoma in the era of immunotherapy. Clin Genitourin Cancer. 2018. doi:10.1016/j.clgc.2018.03.016
15. Roberto M, Botticelli A, Strigari L, et al. Prognosis of elderly gastric cancer patients after surgery: a nomogram to predict survival. Med Oncol. 2018;35(7):111. doi:10.1007/s12032-018-1166-8
16. Kawachi MH, Bahnson RR, Barry M, et al. NCCN clinical practice guidelines in oncology: prostate cancer early detection. J Natl Compr Canc Netw. 2010;8(2):240–262.
17. Leyh-Bannurah SR, Budaus L, Pompe R, et al. North American population-based validation of the National Comprehensive Cancer Network practice guideline recommendation of pelvic lymphadenectomy in contemporary prostate cancer. Prostate. 2017;77(5):542–548. doi:10.1002/pros.23292
18. Cronin KA, Ries LA, Edwards BK. The Surveillance, Epidemiology, and End Results (SEER) program of the National Cancer Institute. Cancer. 2014;120(Suppl 23):3755–3757. doi:10.1002/cncr.29049
19. Wolbers M, Koller MT, Witteman JC, Steyerberg EW. Prognostic models with competing risks: methods and application to coronary risk prediction. Epidemiology. 2009;20(4):555–561. doi:10.1097/EDE.0b013e3181a39056
20. Sherman SI, Brierley JD, Sperling M, et al. Prospective multicenter study of thyroiscarcinoma treatment: initial analysis of staging and outcome. National Thyroid Cancer Treatment Cooperative Study Registry Group. Cancer. 1998;83(5):1012–1021.
21. Cady B, Rossi R. An expanded view of risk-group definition in differentiated thyroid carcinoma. Surgery. 1988;104(6):947–953.
22. Shaha AR, Loree TR, Shah JP. Intermediate-risk group for differentiated carcinoma of thyroid. Surgery. 1994;116(6):1036–1040; discussion 1040-1031.
23. Fang C, Wang W, Feng X, et al. Nomogram individually predicts the overall survival of patients with gastroenteropancreatic neuroendocrine neoplasms. Br J Cancer. 2017;117(10):1544–1550. doi:10.1038/bjc.2017.315
24. Wan G, Gao F, Chen J, et al. Nomogram prediction of individual prognosis of patients with hepatocellular carcinoma. BMC Cancer. 2017;17:1. doi:10.1186/s12885-017-3062-6
25. Rudloff U, Jacks LM, Goldberg JI, et al. Nomogram for predicting the risk of local recurrence after breast-conserving surgery for ductal carcinoma in situ. Journal Clinical Oncol. 2010;28(23):3762–3769. doi:10.1200/JCO.2009.26.8847
26. Weiser MR, Landmann RG, Kattan MW, et al. Individualized prediction of colon cancer recurrence using a nomogram. Journal Clinical Oncol. 2008;26(3):380–385. doi:10.1200/JCO.2007.14.1291
27. Shah S, Boucai L. Effect of age on response to therapy and mortality in patients with thyroid cancer at high risk of recurrence. J Clin Endocrinol Metab. 2018;103(2):689–697. doi:10.1210/jc.2017-02255
28. Shen W, Sakamoto N, Yang L. Cancer-specific mortality and competing mortality in patients with head and neck squamous cell carcinoma: a competing risk analysis. Ann Surg Oncol. 2015;22(1):264–271. doi:10.1245/s10434-014-3951-8
29. Skillington SA, Kallogjeri D, Lewis JS
30. Wray CJ, Phatak UR, Robinson EK, et al. The effect of age on race-related breast cancer survival disparities. Ann Surg Oncol. 2013;20(8):2541–2547. doi:10.1245/s10434-013-2913-x
31. Tang J, Kong D, Cui Q, et al. The role of radioactive iodine therapy in papillary thyroid cancer: an observational study based on SEER. Onco Targets Ther. 2018;11:3551–3560. doi:10.2147/OTT.S160752
32. Kwong N, Medici M, Angell TE, et al. The influence of patient age on thyroid nodule formation, multinodularity, and thyroid cancer risk. J Clin Endocrinol Metab. 2015;100(12):4434–4440. doi:10.1210/jc.2015-3100
33. Rahbari R, Zhang L, Kebebew E. Thyroid cancer gender disparity. Future Oncol. 2010;6(11):1771–1779. doi:10.2217/fon.10.127
34. Zhang D, Tang J, Kong D, et al. Impact of gender and age on the prognosis of differentiated thyroid carcinoma: a retrospective analysis based on SEER. Horm Cancer. 2018;9(5):361–370. doi:10.1007/s12672-018-0340-y
 © 2019 The Author(s). This work is published and licensed by Dove Medical Press Limited. The
full terms of this license are available at https://www.dovepress.com/terms
and incorporate the Creative Commons Attribution
- Non Commercial (unported, 3.0) License.
By accessing the work you hereby accept the Terms. Non-commercial uses of the work are permitted
without any further permission from Dove Medical Press Limited, provided the work is properly
attributed. For permission for commercial use of this work, please see paragraphs 4.2 and 5 of our Terms.
© 2019 The Author(s). This work is published and licensed by Dove Medical Press Limited. The
full terms of this license are available at https://www.dovepress.com/terms
and incorporate the Creative Commons Attribution
- Non Commercial (unported, 3.0) License.
By accessing the work you hereby accept the Terms. Non-commercial uses of the work are permitted
without any further permission from Dove Medical Press Limited, provided the work is properly
attributed. For permission for commercial use of this work, please see paragraphs 4.2 and 5 of our Terms.