Back to Journals » Diabetes, Metabolic Syndrome and Obesity » Volume 14
Nomogram Predicting the Risk of Progression from Prediabetes to Diabetes After a 3-Year Follow-Up in Chinese Adults
Authors Liang K ![]() , Guo X, Wang C, Yan F, Wang L, Liu J, Hou X
, Guo X, Wang C, Yan F, Wang L, Liu J, Hou X ![]() , Li W, Chen L
, Li W, Chen L ![]()
Received 19 February 2021
Accepted for publication 11 May 2021
Published 14 June 2021 Volume 2021:14 Pages 2641—2649
DOI https://doi.org/10.2147/DMSO.S307456
Checked for plagiarism Yes
Review by Single anonymous peer review
Peer reviewer comments 3
Editor who approved publication: Professor Ming-Hui Zou
Kai Liang,1– 4 Xinghong Guo,1– 4 Chuan Wang,1– 4 Fei Yan,1– 4 Lingshu Wang,1– 4 Jinbo Liu,1– 4 Xinguo Hou,1– 4 Wenjuan Li,1– 4 Li Chen1– 4
1Department of Endocrinology, Qilu Hospital, Cheeloo College of Medicine, Shandong University, Jinan, 250012, People’s Republic of China; 2Institute of Endocrine and Metabolic Diseases of Shandong University, Jinan, 250012, People’s Republic of China; 3Key Laboratory of Endocrine and Metabolic Diseases, Shandong Province Medicine & Health, Jinan, 250012, People’s Republic of China; 4Jinan Clinical Research Center for Endocrine and Metabolic Diseases, Jinan, 250012, People’s Republic of China
Correspondence: Li Chen; Wenjuan Li
Department Of Endocrinology, Qilu Hospital, Cheeloo College of Medicine, Shandong University, Jinan, 250012, People’s Republic of China
, Tel +86 18560083989
; +86 18560080331
Fax +860531-82169323
Email [email protected]; [email protected]
Purpose: To develop a nomogram for predicting the risk of progression from prediabetes to diabetes and provide a quantitative predictive tool for early clinical screening of high-risk populations of diabetes.
Materials and Methods: This study was a retrospective cohort study and part of the investigation conducted for the Risk Evaluation of cAncers in Chinese diabeTic Individuals: a lONgitudinal (REACTION) study. A total of 1857 prediabetic participants at baseline underwent oral glucose tolerance test and hemoglobin A1c (HbA1c) testing after 3 years. The areas under the receiver operating characteristic curves (AUCs) were adopted to measure the predictive value of progression to diabetes, using baseline fasting plasma glucose (FPG), 2-hr postprandial plasma glucose (2hPG), HbA1c or combined models. Decision curve analysis determined the model with the best discriminative ability. A nomogram was formulated and internally validated, providing an individualized predictive tool by calculating total scores.
Results: After 3 years, 145 participants developed diabetes, and the annual incidence was estimated to be 2.60%. Among the three single indicators and four combined models, model 4 combined of FPG, 2hPG, and HbA1c showed the best performance in risk predication, with an AUC of 0.742. The nomogram constructed via model 4 was validated and demonstrated good prediction for the risk of diabetes. The nomogram score/predicted probability was a numeric value representing the prediction model score of individual patients. Notably, all nomogram scores showed relatively high negative predictive values.
Conclusion: The nomogram constructed in this study effectively predicts and quantifies the risk of progression from prediabetes to diabetes after a 3-year follow-up and could be adopted to identify Chinese patients at high risk for diabetes in order to provide timely interventions.
Keywords: nomogram, diabetes, prediabetes, predictive value
Introduction
Diabetes is a global epidemic that has been associated with high economic costs. Among all countries, China has the highest number of diabetic patients in 2013 and is also predicted to be the most affected country by 2035.1 Studies have confirmed that effective interventions in prediabetes can significantly reduce the risk of its progression to diabetes.2–4 Thus, early screening and effectively managing prediabetes in China are key to preventing or delaying the occurrence of diabetes, which in turn could spare the world from its related burden. How to recognize the prediabetes is thus essential to the prevention of future diabetes outbreaks.
No standard diagnostic criteria for prediabetes have been established to date,5–7 and thus the definition for prediabetes largely varies among populations. In 2019, the concept of prediabetes established by the American Diabetes Association (ADA) was questioned8 because the risk of progression from prediabetes to diabetes is less than 2% per year, and prediabetes has minimal additional risk of cardiovascular disease. However, this has resulted in millions of new patients and requiring additional demand in the healthcare and pharmaceutical industries, prompting its description as an “artificial disease”. Therefore, it is vital to strike a balance between the cost of interventions for prediabetes population and its potential benefits. The solution to this issue is to precisely recognize those with a real high risk of progression to diabetes among the prediabetes population. However, as the country with the highest number of diabetic and prediabetic patients, there is still a lack of powerful and individualized predictive tools for evaluating the risk of progression from prediabetes to diabetes in China.
Recently, some screening scales have been developed to identify individuals with high risk of diabetes from non-diabetes populations based on different risk factors,9–13 but only a few reports on predictive models that can personally assess the risk of progression from prediabetes to diabetes. Among various models for predicting the risk of disease, nomograms transform complex regression equations into simple and visual graphs with highly readable prediction results and have high clinical application value. In previous studies, several nomograms have been formulated to identify individuals with high risk of diabetes, via the combination of traditional risk factors. However, none of these simultaneously utilized fasting plasma glucose (FPG), 2-hours postprandial plasma glucose (2hPG), hemoglobin A1c (HbA1c) as predictors of diabetes.14–17 Here, we construct an internally validated nomogram that predicts and quantifies the risk of progression from prediabetes to diabetes based on FPG, 2hPG, and HbA1c, as well as provide a quantitative and individualized prediction tool for early identification of people at high risk of diabetes.
Materials and Methods
Study Population and Ethics Statement
This study was a retrospective cohort study and part of the baseline and 3-year follow-up investigation conducted for the Risk Evaluation of cAncers in Chinese diabeTic Individuals: a lONgitudinal (REACTION) study.18,19 In 2012, a total of 10,028 subjects (including 6458 women) aged from 40 to 90 from 4 urban communities (3 from Jining city and 1 from Jinan city) were recruited for the baseline survey. In 2015, a 3-year follow-up was performed, serving as the first visit following the baseline survey. The overall follow-up rate was 77.8%, including 4778 subjects who participated in the on-site follow-up, 2864 subjects who received a telephone survey, 159 subjects who failed to survive to follow-up, and 2227 subjects lost. Among the 4778 subjects in our on-site follow-up, 2921 subjects who had normal glucose tolerance, diabetes, splenectomy, chronic kidney disease, liver dysfunction, cancer, or glucocorticoid therapy at baseline were excluded. Finally, 1857 prediabetic subjects (including 1163 women) at baseline were eligible for our analysis. No special intervention was introduced to the cohort. For those subjects excluded according to our exclusion criteria, their information was updated to local health center and their family doctors. This study protocol was approved by the institutional review board at the Department of Endocrinology and Metabolic Disease, Ruijin Hospital, Shanghai Jiao Tong University School of Medicine. Written informed consents were obtained.
Data Collection
All investigators responsible for both surveys underwent extensive training on the use of the study questionnaires and outcome measures before investigation. A standard questionnaire applied through face-to-face interviews was adopted for data on lifestyle and demographic characteristics. The anthropometric data collected included height, weight, blood pressure (BP), and heart rate (HR). BP measurements were obtained at 1-min intervals from the right arm and the mean of three consecutive measurements was used for analysis. HR was measured under resting status. Body mass index (BMI) was calculated as weight (kg) divided by height squared (m2).
Fasting blood samples were collected in the morning after at least 10 h of overnight fasting and post-challenge blood samples were obtained 2 h post 75 g oral glucose load for the OGTT. Plasma glucose levels were measured by glucose oxidase method via an automated clinical chemistry analyzer. HbA1c was measured by ion-exchange high-performance liquid chromatography using an automated glycated hemoglobin meter (Bio-Rad, Variant, USA). Creatinine (CR), total cholesterol (TC), low-density lipoprotein cholesterol (LDL-c), high-density lipoprotein cholesterol (HDL-c), and triglycerides (TG) were determined as previously described.20
Definitions and Diagnostic Criteria
According to the 2010 ADA diagnostic criteria,5 prediabetes is defined as meeting at least one of the following criteria: 1) impaired fasting glucose (IFG): FPG≥5.6 mmol/L and <7.0 mmol/L; 2) impaired glucose tolerance (IGT): 2hPG ≥7.8 mmol/L and <11.1 mmol/L; 3) HbA1c ≥5.7% and <6.5%. Incident diabetes was defined as meeting at least one of the following criteria: FPG ≥7.0 mmol/L, 2hPG ≥11.1 mmol/L, and/or HbA1c ≥6.5%. We did not record the type of diabetes among incident cases. However, all subjects in this study were aged at least 40 at baseline, which means that they were unlikely to have had type 1 diabetes.
Statistical Analysis
Continuous variables were expressed as mean ± SD and compared using unpaired t-test or Kruskal Wallis test. Categorical variables were expressed as the number (proportion) and compared by χ2 test. The areas under curves (AUCs) of receiver operating characteristic (ROC) were used to measure the predictive value of progression to diabetes after 3 years, utilizing the baseline FPG, 2hPG, HbA1c, combined model 1 (combination of FPG and 2hPG), model 2 (combination of FPG and HbA1c), model 3 (combination of 2hPG and HbA1c), and model 4 (combination of FPG, 2hPG and HbA1c). Decision curve analysis (DCA) was used to determine the predictive model with the best discriminative ability.15 Such analyses provide insights into the range of predicted risks for which the model has a higher net benefit than simply either classifying all patients as having the outcome or no patients as having the outcome. For the clinical use of the predictive model with the best discriminative abilities, a nomogram was formulated by traditional logistic regression model methods, so that the total scores of each patient could be calculated based on the nomogram.14 For internal validation of this nomogram, ROC curves constructed by bootstrap resampling (times = 500) were used to obtain 95% CI with the AUC.21 The sensitivity, specificity, predictive value, and likelihood ratio were determined according to the diagnostic testing methodology. The statistical analyses were 2-tailed, and differences with a P value <0.05 were considered statistically significant. All statistical analyses were were established with R version 3.6.3 (http://www.R-project.org) and EmpowerStats software (www.empowerstats.com, X&Y solutions, Inc. Boston, MA, USA).
Results
Baseline Characteristics of Groups with Different Follow-Up Outcomes
A total of 1857 participants defined as prediabetes via the 2010 ADA diagnostic criteria were included in this study. After a 3-year follow-up, 145 of the 1857 participants progressed to diabetes, and the annual incidence was estimated to be 2.60%. Participants were divided into a group that did not progress to diabetes (n = 1712) and a group that progressed to diabetes (n = 145). The baseline characteristics of these groups are presented in Table 1, including age, gender, BMI, BP, HR, FPG, 2hPG, HbA1c, CR, TC, LDL-c, HDL-c, and TG. Compared with the group that did not progress to diabetes, in addition to the obvious higher FPG (p < 0.001), 2hPG (p < 0.001), and HbA1c (p < 0.001), the group that progressed to diabetes were elder (p <0.001), with a higher proportion of males and higher plasma creatinine levels (p <0.001), whereas there was no statistically significant difference in BMI (p =0.569), systolic blood pressure (p =0 0.715), diastolic blood pressure (p = 0.715), TC (p = 0.821), LDL-c (p = 0.725), HDL-c (p = 0.186), or TG (p = 0.083) was observed.
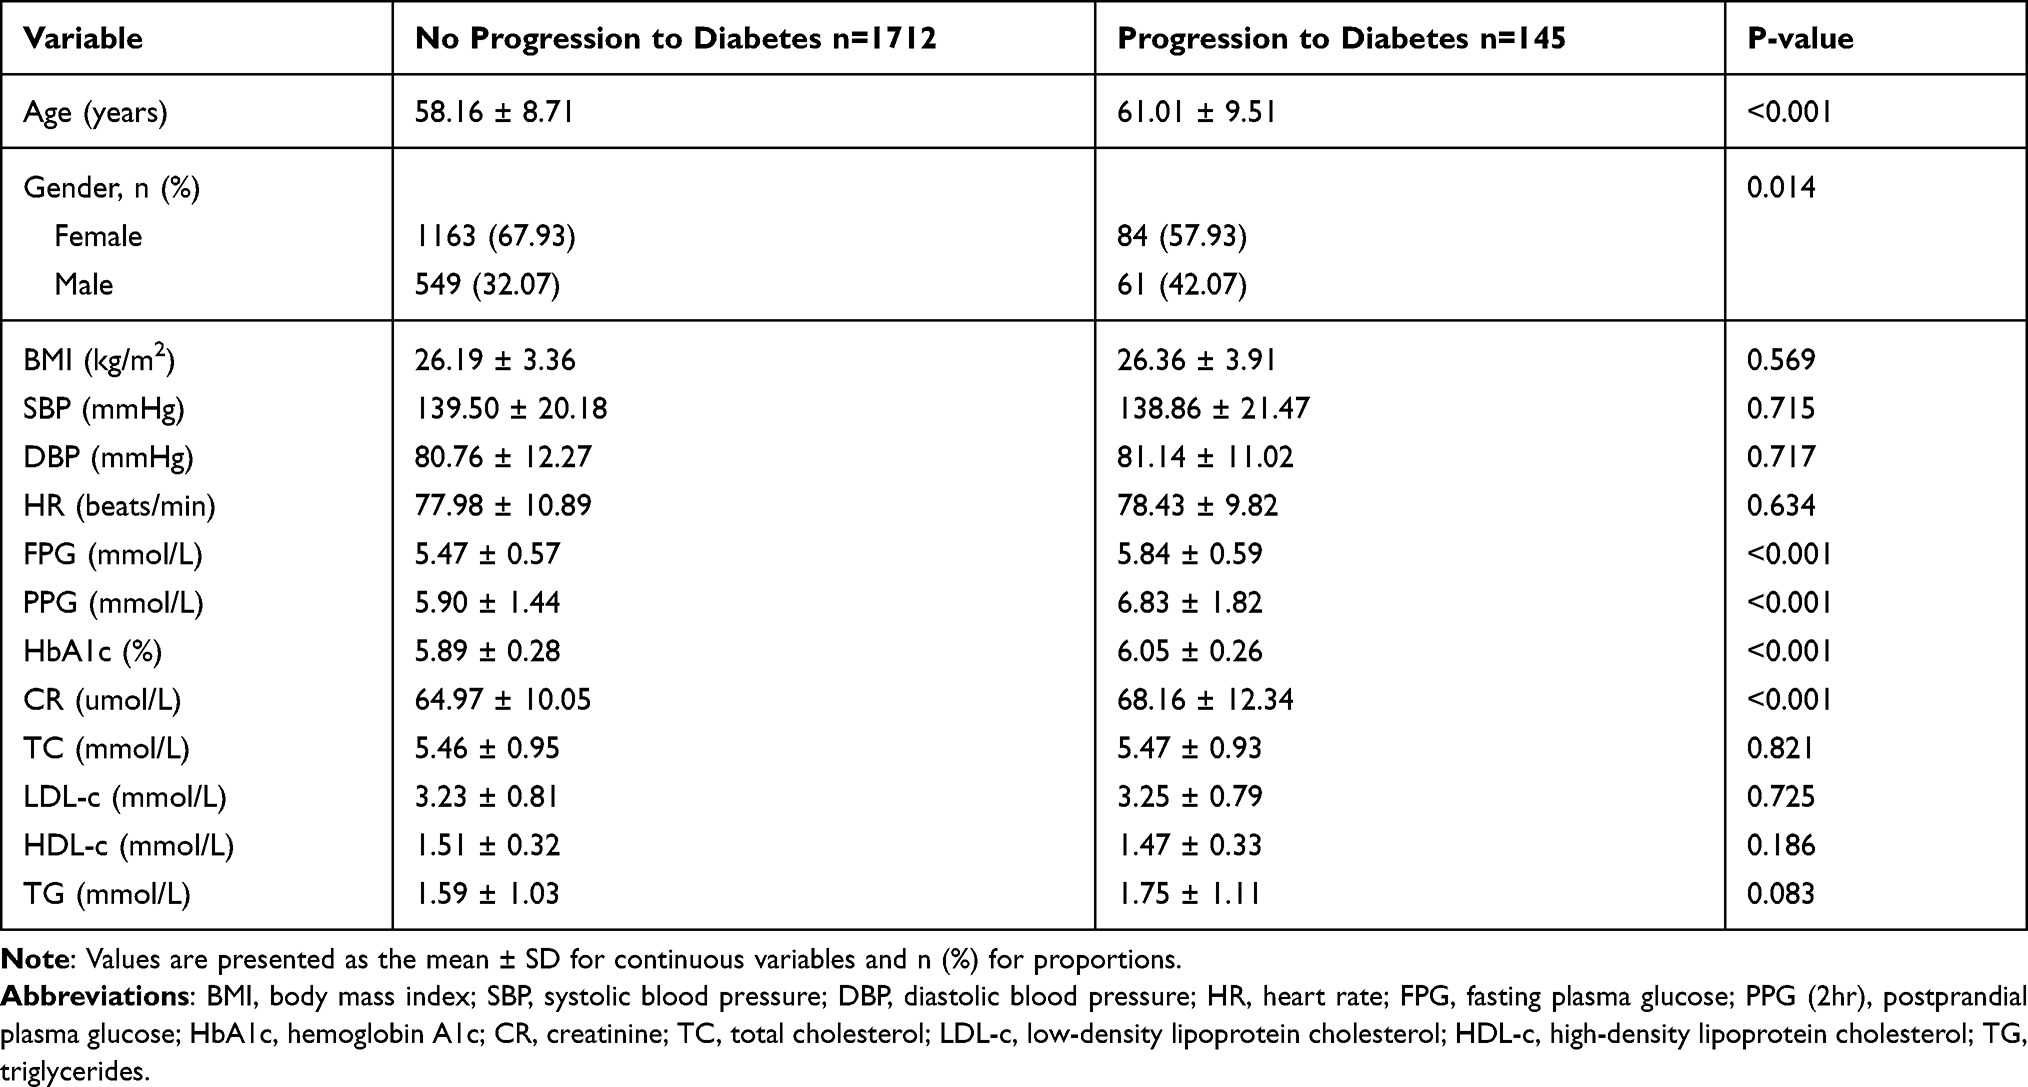 |
Table 1 Characteristics of Subjects with Prediabetes at Baseline and Progression to Diabetes at a 3-Years Follow-Up |
Predictive Values of Progression from Prediabetes to Diabetes via Different Models
We aimed to establish an effective model to clinically predict the risk of progression from prediabetes to diabetes in Chinese population. Because FBG, 2hPG, and HbA1c are recommended glycemic measures that define prediabetes and diabetes in 2010 ADA diagnostic criteria, we analyzed the relationship between the detection incidence of diabetes and these indicators alone or the combined models. As shown in Table 2, the detection incidence of diabetes increased with the number of abnormal glycemic measures. This incidence was higher in individuals with isolated IGT (5.26%, 1/19) than in those with isolated IFG (4.33%, 9/208) or isolated elevated HbA1c (3.94%, 37/940). Furthermore, the incidence of diabetes was higher in individuals with IFG and elevated HbA1c (11.78%, 55/467) and in those with IGT and elevated HbA1c (13.33%, 8/60) than in those with combined IGT and IFG (5.88%, 2/34). Individuals with three abnormal glycemic measures had the highest incidence of diabetes (25.58%, 33/129).
 |
Table 2 Incidence of Diabetes Based on Glucose Tolerance Status After a Follow-Up of 3 Years Among Study Participants with Prediabetes at Baseline |
Furthermore, we constructed ROC curves to quantify the predictive authenticity of the above models. Figure 1 showed the ROC curves of FPG, 2hPG, HbA1c, and their combined models for predicting the risk of progression to diabetes in a 3-year follow-up. The predicted performance of single indicator such as FPG, 2hPG, and HbA1c was relatively insufficient, with the AUCs of 0.673, 0.648, and 0.662, respectively. Among the four combined models, the prediction performance of model 4 (combination of FPG, 2hPG and HbA1c), with an AUC of 0.742, was better than those of model 1 (combination of FPG and 2hPG), with an AUC of 0.696, or model 2 (combination of FPG and HbA1c), with an AUC of 0.732, or model 3 (combination of 2hPG and HbA1c), with an AUC of 0.713. ROC curves suggested that model 4 shows the best authenticity in predicting the risk of progression from prediabetes to diabetes in our study population.
 |
Figure 1 The ROC curves of FPG, 2hPG, HbA1c and their combined models for predicting the risk of progression to diabetes at a 3-years follow-up. Abbreviations: ROC, receiver operating characteristic; AUC, area under curve; DM, diabetes mellitus; FPG, fasting plasma glucose; PPG (2-hr), postprandial plasma glucose; HbA1c, hemoglobin A1c. Notes: MODEL 1 (FPG+PPG): logit (DM AFTER 3 YEARS) = −8.87669+0.84650*FPG+0.25579*PPG. MODEL 2 (FPG+HbA1C): logit (DM AFTER 3 YEARS) = −20.76236+1.07403*FPG+2.05013*HbA1C. MODEL 3 (PPG+HbA1c): logit (DM AFTER 3 YEARS) = −16.38711+0.32623*PPG+1.98712*HbA1c. MODEL 4 (FPG+PPG+HbA1C): logit (DM AFTER 3 YEARS) = −19.95108+0.84133*FPG+0.21615*PPG+1.90585*HbA1C. |
To further evaluate the discriminative ability and net benefits of these models, DCA was performed. The DCA results of the seven predictors are shown in Figure 2. In general, especially for predicted probability thresholds between 0% and 30%, model 4 showed the highest net benefit. Therefore, model 4 exhibited the best accuracy for risk prediction and the highest net benefit. Then based on model 4, a nomogram predicting the risk of progression to diabetes was constructed.
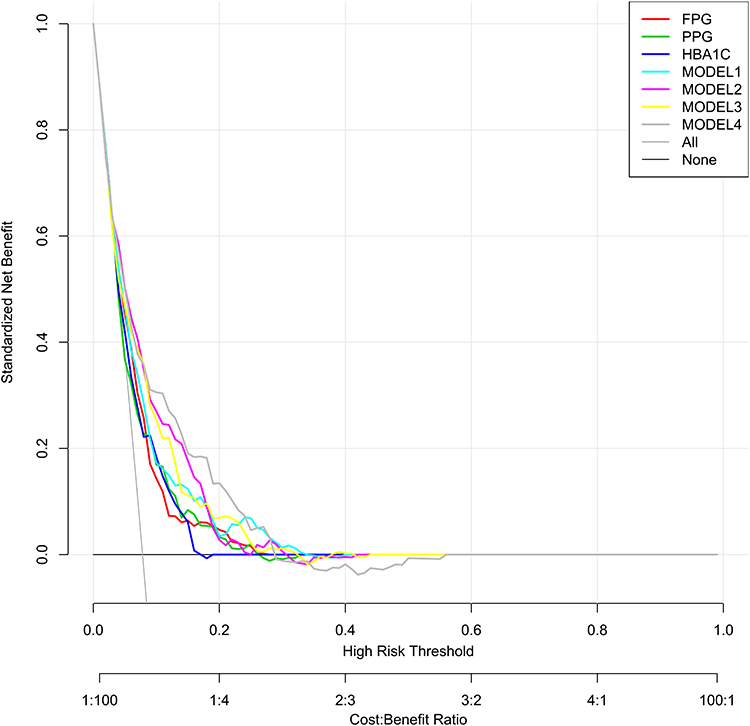 |
Figure 2 The DCA of the seven predictive models for diabetes at a 3-years follow-up. Abbreviation: FPG, fasting plasma glucose; PPG (2-hr), postprandial plasma glucose; HbA1c, hemoglobin A1c. Notes: Net benefit curves of seven predictive models. “None” line=net benefit when no participant is considered as having the outcome (progression to diabetes); “All” line=net benefit when all participants are considered as having the outcome. The preferred model is the model with the highest net benefit at any given threshold. |
Nomogram Effectively Predicting Individual Diabetes Risk
We constructed a nomogram to predict the risk of progression from prediabetes to diabetes based on model 4 (Figure 3). The nomogram consists of graph lines that include risk factors (FPG, 2hPG, and HbA1c), individual scores (Points), total scores (Total Points), and event risk (DM AFTER 3 YEARS). The line segment corresponding to each risk factor is marked by scale, which represents the range of possible values of the factor, and the length of the line segment reflects the contribution of the factor to the outcome event. “Points” at the top of the graph indicate the corresponding scores of risk factors under different values. The total score of all individual scores of the risk factors is “Total Points”, which corresponds to “DM AFTER 3 YEARS” at the bottom of the graph. “DM AFTER 3 YEARS” represents the quantified predicted probability of progression to diabetes risk 3 years later among the prediabetes population, as suggested by our designed nomogram.
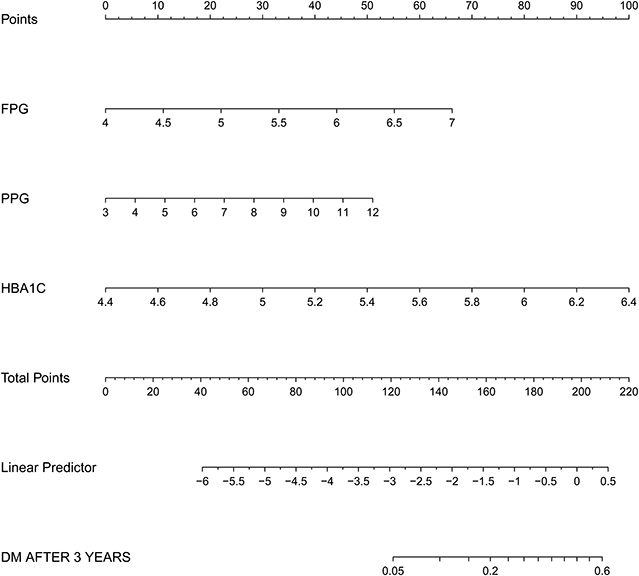 |
Figure 3 Nomogram to predict the risk of progression to diabetes at a 3-years follow-up based on MODEL 4. Abbreviations: DM, diabetes mellitus; FPG, fasting plasma glucose; PPG (2-hr), postprandial plasma glucose; HbA1c, hemoglobin A1c. Notes: The nomogram consists of graph lines that include risk factors (FPG, 2hPG, HbA1C), individual scores (Points), total scores (Total Points), and event risk (DM AFTER 3 YEARS). The line segment corresponding to each risk factor is marked with a scale, which represents the range of possible values of the factor, and the length of the line segment reflects the contribution of the factor to the outcome event. “Points” at the top of the graph indicate the corresponding scores of risk factors under different values. The total score of all the individual scores of the risk factors is “Total Points”, which corresponds to “DM AFTER 3 YEARS” at the bottom of the graph, which represents the predicted probability of progression to diabetes risk 3 years later. |
The nomogram was internally validated by bootstrap resampling and demonstrated good performance in predicting the risk of progression to diabetes, with a corrected AUC of 0.732 and 95% CI 0.688–0.776 (Figure 4). Moreover, the prediction accuracy of the nomogram is presented in Table 3. The nomogram score/predicted probability was a numeric value representing the prediction model score of the individual patient. For example, using a cutoff value of 0.20, sensitivity was 28.96%, specificity was 94.68%, positive predictive value was 31.57%, negative predictive value was 94.02%, positive likelihood ratio was 5.44, and negative likelihood ratio was 0.75. Notably, all nomogram scores showed relatively high negative predictive values.
 |
Table 3 Values of Sensitivity, Specificity, Predictive Value, and Likelihood Ratio of Nomogram Scores at Different Cutoff Points |
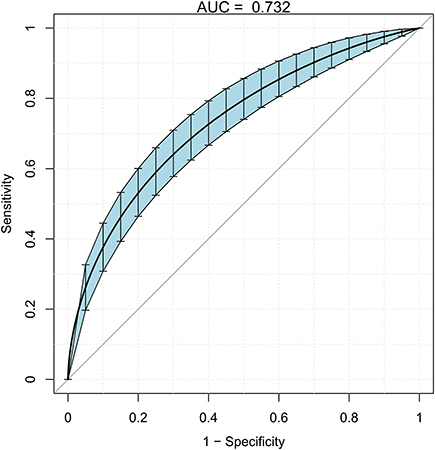 |
Figure 4 The ROC curve after internal validation using bootstrap resampling (times = 500). Notes: The area under the ROC curve (AUC) was 0.732 (95% CI 0.688–0.776). Blue shading shows the bootstrap estimated 95% CI with the AUC. |
Discussion
Latest epidemiological investigation reported that the estimated overall prevalence of prediabetes in China is 35.7%.22 How to perform an effective intervention for prediabetes is thus key to preventing diabetes. However, only a small proportion of prediabetes would develop diabetes, and thus it is not cost-effective to perform an intervention involving the entire prediabetes population, yet there continues to be a need to identify those with real high risk of progression to diabetes among prediabetes. Using this approach, we can rationally allocate the medical expenses for diabetes prevention and treatment.
For this purpose, this study constructed a personalized nomogram to predict the risk of progression from prediabetes to diabetes with commonly used glucose metabolism indexes and proved the accuracy of its prediction results through internal verification. The nomogram transforms complex regression equations into simple and visual graphs, with strong readability of prediction results and high clinical application value. Some nomograms predicting diabetes risk were established. A nomogram developed from a cross-sectional study in South Korea adapted demographic characteristics and past medical history to predict current risk of diabetes. However, this nomogram cannot predict the risk of disease progression, such as the progression from prediabetes and diabetes. In addition, the variables used in this nomogram only indirectly reflected glucose metabolism status.14 Another nomogram was established based on a 3-year follow-up in Chinese population to predict the risk of progression from non-diabetes to diabetes using FPG and other indicators not directly related with glucose metabolism were utilized. However, the risks of progression to diabetes of normal glucose tolerance individuals and prediabetes are largely vary. In addition, HbA1c and 2hPG were not adapted in this nomogram, impairing its clinical application value.15 In our study, the nomogram was based on the follow-up results of the cohort study, adopting FPG, 2hPG, and HbA1c as risk factors, and thus showing a more reliable predictive power in clinical practice.
Many diabetes risk prediction models or scoring standards applicable to the population of various countries have been designed and proven to be effective in identifying people at high risk of diabetes in the future.9–13,23 One research evaluated 25 prediction models from 16 studies for the risk of development of type 2 diabetes and externally validated their finding in a large independent cohort. This study suggested that existing prediction models, even with only limited information, performed well to identify those at high risk, but could not sufficiently the quantify actual risk of future diabetes.24
Based on diagnostic indicators of prediabetes and diabetes, this study constructed a nomogram that predicted the risk of progression from prediabetes to diabetes risk using traditional logistic regression model methods. The nomogram was internally validated by bootstrap resampling and demonstrated good performance in predicting the risk of progression to diabetes. All subjects in this study completed 75g-OGTT and HbA1c testing at baseline and at 3-years of follow-up. Hence, the nomogram we constructed is mainly suitable for people who have been screened for diabetes and have prediabetes or normal glucose metabolism, which helps in the personal prediction of diabetes in high-risk people, and then formulate corresponding prevention or intervention measures. However, this study has a limited sample size, and thus further studies using a larger study cohort is needed. At the same time, the subjects are middle-aged and elderly residents of urban communities in China, and thus there is a need to verify our findings in other individuals from other regions and countries. In addition, because this study was a retrospective cohort study, selective bias exists and may have some impact on its clinical application value. Due to the natural limitations of retrospective cohort studies, our nomogram predicts the risk of progression of prediabetes to diabetes in a 3-year follow-up. The predictive value for other time period requires further confirmation.
Conclusion
This study constructed a nomogram that effectively predicts and quantifies the risk of progression from prediabetes to diabetes in Chinese population after a 3-year follow-up and could be adopted to identify patients with high risk of diabetes in Chinese population so that timely interventions may be performed.
Abbreviations
ADA, American Diabetes Association; DM, diabetes mellitus; FPG, fasting plasma glucose; 2hPG, 2-hours postprandial plasma glucose; HbA1c, hemoglobin A1c; SBP, Systolic blood pressure; DBP, diastolic blood pressure; HR, heart rate; BMI, body mass index; CR, creatinine; TC, total cholesterol; LDL-c, low-density lipoprotein cholesterol; HDL-c, high-density lipoprotein cholesterol; TG, triglycerides; IFG, impaired fasting glucose; IGT, impaired glucose tolerance; ROC, receiver operating characteristic; AUC, area under curve; DCA, decision curve analysis.
Data Sharing Statement
All data generated or analyzed during this study are included in this published article.
Ethics Approval and Informed Consent
This study was conducted in accordance with the Declaration of Helsinki and approved by the Ethics Committee of Ruijin Hospital, Shanghai Jiao Tong University School of Medicine (Clinical Trial Ethics Committee Approval Form [2011]14). Written informed consent was obtained from all participants.
Acknowledgments
The present study was supported by grants from the National Natural Science Foundation of China (No.81800736 and 81900756) and the Shandong Natural Science Foundation (No. ZR2019PH078).
Disclosure
The authors have no competing interests to declare.
References
1. Zimmet PZ, Magliano DJ, Herman WH, et al. Diabetes: a 21st century challenge. Lancet Diabetes Endocrinol. 2014;2(1):56–64. doi:10.1016/S2213-8587(13)70112-8
2. Li G, Zhang P, Wang J, et al. The long-term effect of lifestyle interventions to prevent diabetes in the China Da Qing Diabetes Prevention Study: a 20-year follow-up study. Lancet. 2008;371(9626):1783–1789. doi:10.1016/S0140-6736(08)60766-7
3. Knowler WC, Barrett-Connor E, Fowler SE, et al. Reduction in the incidence of type 2 diabetes with lifestyle intervention or metformin. N Engl J Med. 2002;346:393–403.
4. Lindström J, Ilanne-Parikka P, Peltonen M, et al. Sustained reduction in the incidence of type 2 diabetes by lifestyle intervention: follow-up of the Finnish Diabetes Prevention Study. Lancet. 2006;368(9548):1673–1679. doi:10.1016/S0140-6736(06)69701-8
5. American Diabetes Association; Standards of medical care in diabetes:2010. Diabetes Care. 2010;33(Supplement_1):S11–S61. doi:10.2337/dc10-S011
6. WHO/IDF. Definition and diagnosis of diabetes mellitus and intermediate hyperglycemia: report of a WHO/IDF consultation; 2006.
7. International Expert Committee; International Expert Committee report on the role of the A1C assay in the diagnosis of diabetes. Diabetes Care. 2009;32(7):1327–1334. doi:10.2337/dc09-9033
8. Piller C. Dubious diagnosis. Science. 2019;363(6431):1026–1031. doi:10.1126/science.363.6431.1026
9. Wilson PW, Meigs JB, Sullivan L, et al. Prediction of incident diabetes mellitus in middle-aged adults: the Framingham Offspring Study. Arch Intern Med. 2007;167(10):1068–1074. doi:10.1001/archinte.167.10.1068
10. Lindström J, Tuomilehto J. The diabetes risk score: a practical tool to predict type 2 diabetes risk. Diabetes Care. 2003;26(3):725–731. doi:10.2337/diacare.26.3.725
11. Bernabe-Ortiz A, Perel P, Miranda JJ, et al. Diagnostic accuracy of the Finnish diabetes risk score (FINDRISC) for undiagnosed T2DM in Peruvian population. Prim Care Diabetes. 2018;12(6):517–525. doi:10.1016/j.pcd.2018.07.015
12. Schwarz PE, Li J, Reimann M, et al. The Finnish diabetes risk score is associated with insulin resistance and progression towards type 2 diabetes. J Clin Endocrinol Metab. 2009;94(3):920–926. doi:10.1210/jc.2007-2427
13. Chen L, Magliano DJ, Balkau B, et al. AUSDRISK: an Australian type 2 diabetes risk assessment tool based on demographic, lifestyle and simple anthropometric measures. Med J Aust. 2010;192(4):197–202. doi:10.5694/j.1326-5377.2010.tb03478.x
14. Chung SM, Park JC, Moon JS, et al. Novel nomogram for screening the risk of developing diabetes in a Korean population. Diabetes Res Clin Pract. 2018;142:286–293. doi:10.1016/j.diabres.2018.05.036
15. Wang K, Gong M, Xie S, et al. Nomogram prediction for the 3-year risk of type 2 diabetes in healthy mainland China residents. EPMA J. 2019;10(3):227–237. doi:10.1007/s13167-019-00181-2
16. Lin Z, Guo D, Chen J, et al. A nomogram for predicting 5-year incidence of type 2 diabetes in a Chinese population. Endocrine. 2020;67(3):561–568. doi:10.1007/s12020-019-02154-x
17. Ma CM, Yin FZ. Glycosylated hemoglobin a1c improves the performance of the nomogram for predicting the 5-year incidence of type 2 diabetes. Diabetes Metab Syndr Obes. 2020;13:1753–1762. doi:10.2147/DMSO.S252867
18. Reaction Study Group; Ning G. Risk Evaluation of cAncers in Chinese diabeTic Individuals: a lONgitudinal (REACTION) study. J Diabetes. 2012;4(2):172–173. doi:10.1111/j.1753-0407.2012.00182.x
19. Bi Y, Lu J, Wang W, et al. Cohort profile: risk evaluation of cancers in Chinese diabetic individuals: a longitudinal (REACTION) study. J Diabetes. 2014;6(2):147–157. doi:10.1111/1753-0407.12108
20. Liang K, Sun Y, Li WJ, et al. Diagnostic efficiency of hemoglobin a1c for newly diagnosed diabetes and prediabetes in community-based Chinese adults aged 40 years or older. Diabetes Technol Ther. 2014;16(12):853–857. doi:10.1089/dia.2014.0157
21. Collins GS, Reitsma JB, Altman DG, et al. Transparent reporting of a multivariable prediction model for individual prognosis or diagnosis (TRIPOD): the TRIPOD statement. BMJ. 2015;350(jan07 4):g7594. doi:10.1136/bmj.g7594
22. Wang L, Gao P, Zhang M, et al. Prevalence and ethnic pattern of diabetes and prediabetes in China in 2013. JAMA. 2017;317(24):2515–2523. doi:10.1001/jama.2017.7596
23. Ramachandran A, Snehalatha C, Vijay V, et al. Derivation and validation of diabetes risk score for urban Asian Indians. Diabetes Res Clin Pract. 2005;70(1):63–70. doi:10.1016/j.diabres.2005.02.016
24. Abbasi A, Peelen LM, Corpeleijn E, et al. Prediction models for risk of developing type 2 diabetes: systematic literature search and independent external validation study. BMJ. 2012;345(sep18 2):e5900. doi:10.1136/bmj.e5900
 © 2021 The Author(s). This work is published and licensed by Dove Medical Press Limited. The
full terms of this license are available at https://www.dovepress.com/terms
and incorporate the Creative Commons Attribution
- Non Commercial (unported, 3.0) License.
By accessing the work you hereby accept the Terms. Non-commercial uses of the work are permitted
without any further permission from Dove Medical Press Limited, provided the work is properly
attributed. For permission for commercial use of this work, please see paragraphs 4.2 and 5 of our Terms.
© 2021 The Author(s). This work is published and licensed by Dove Medical Press Limited. The
full terms of this license are available at https://www.dovepress.com/terms
and incorporate the Creative Commons Attribution
- Non Commercial (unported, 3.0) License.
By accessing the work you hereby accept the Terms. Non-commercial uses of the work are permitted
without any further permission from Dove Medical Press Limited, provided the work is properly
attributed. For permission for commercial use of this work, please see paragraphs 4.2 and 5 of our Terms.