Back to Journals » Cancer Management and Research » Volume 11
Nomogram for predicting disease-free survival among a multicenter cohort of Chinese patients with locally advanced rectal cancer
Authors Li ZH ![]() , Xie PY, Zhang DF, Li YJ, Wu L, Dong J, Xiao J, Liu ZY
, Xie PY, Zhang DF, Li YJ, Wu L, Dong J, Xiao J, Liu ZY
Received 30 November 2018
Accepted for publication 1 March 2019
Published 29 March 2019 Volume 2019:11 Pages 2471—2483
DOI https://doi.org/10.2147/CMAR.S196614
Checked for plagiarism Yes
Review by Single anonymous peer review
Peer reviewer comments 3
Editor who approved publication: Professor Harikrishna Nakshatri
Zhen-Hui Li,1 Pei-Yi Xie,2 Da-Fu Zhang,1 Ya-Jun Li,3,4 Lin Wu,5 Jian Dong,6 Jian Xiao,7 Zai-Yi Liu3
1Department of Radiology, The Third Affiliated Hospital of Kunming Medical University, Yunnan Cancer Hospital, Kunming 650118, People’s Republic of China; 2Department of Radiology, The Sixth Affiliated Hospital of Sun Yat-sen University, Guangzhou 510655, People’s Republic of China; 3Department of Radiology, Guangdong General Hospital, Guangdong Academy of Medical Sciences, Guangzhou 510080, People’s Republic of China; 4School of Medicine, South China University of Technology, Guangzhou 510641, People’s Republic of China; 5Department of Pathology, The Third Affiliated Hospital of Kunming Medical University, Yunnan Cancer Hospital, Kunming 650118, People’s Republic of China; 6Department of Colorectal Surgery, The Third Affiliated Hospital of Kunming Medical University, Yunnan Cancer Hospital, Kunming 650118, People’s Republic of China; 7Department of Medical Oncology, The Sixth Affiliated Hospital of Sun Yat-sen University, Guangzhou 510655, People’s Republic of China
Purpose: This study aimed to develop and validate a nomogram for predicting 3-year disease-free survival (DFS) among a multicenter cohort of Chinese patients with locally advanced rectal cancer (LARC) who underwent preoperative therapy followed by surgery. This nomogram might help identify patients who would benefit from postoperative adjuvant chemotherapy and close follow-up.
Materials and methods: All data from 228 patients in two independent Chinese cohorts (118 patients and 110 patients) were pooled and subjected to survival analysis. One cohort’s data were used to develop multivariate nomograms based on Cox regression, and the second cohort was used for external validation. The variables were sex, age, clinical tumor stage, tumor location, preoperative therapy protocol, adjuvant chemotherapy, surgical procedure, surgical approach, pTNM stage, tumor deposit, tumor regression grade, lymphovascular invasion, perineural invasion, pretreatment serum carcinoembryonic antigen (CEA) level, preoperative CEA level, and postoperative CEA level. The model’s performance was evaluated based on its discrimination, calibration, and clinical usefulness.
Results: The nomogram was based on ypT stage and ypN stage, and the C-index values for 3-year DFS were 0.70 in the training cohort (95% confidence interval: 0.62–0.78) and 0.78 in the validation cohort (95% confidence interval: 0.68–0.89). The Hosmer-Lemeshow calibration test revealed good calibration for predicting 3-year DFS in the training and validation cohorts, and decision curve analysis demonstrated that the nomogram was clinically useful.
Conclusion: This nomogram including the ypT stage and ypN stage could predict DFS at 3 years after surgery, which may help better identify Chinese patients who would benefit from additional postoperative adjuvant systemic treatment.
Keywords: rectal cancer, disease-free survival, recurrence, nomogram
Introduction
Colorectal cancer (CRC) is the third most common malignant cancer and the fourth leading cause of cancer-related death among men, with rankings of the second most common and third most lethal cancer among women.1 There are >376,000 cases of CRC in China each year, with approximately 70% being diagnosed as locally advanced rectal cancer (LARC).2,3 The standard treatment for LARC involves preoperative therapy followed by surgery and adjuvant chemotherapy.4 However, only 25% of patients benefit from postoperative adjuvant chemotherapy after preoperative therapy, with no overall reduction in distant metastases (DM) or improved survival.5–7 Thus, patients with LARC who have a low probability of recovery may be appropriate for intensified local or systemic treatment, and there is an urgent need to develop and validate models that can guide personalized treatment decisions in an evidence-based manner.7,8
Some models, which are visualized using nomograms, have been proposed for predicting outcomes during follow-up for LARC in the latest American Joint Committee on Cancer (AJCC) Cancer Staging Manual.9 These predictions models who underwent preoperative radio/radiochemotherapy were based on data from four large European randomized clinical trials.7 The discriminative capability of these prediction models was determined based on the concordance index (C-index) values for local recurrence (0.68), DM (0.73) and overall survival (0.7) after 5–10 years of follow-up, and the models were externally validated using data from another European randomized clinical trial.7 However, before 2015, it was unclear whether these prediction models were generalizable to Asian populations, especially the Chinese population, as differences in population distribution and treatment might influence the discrimination and calibration of these models.10 Thus, Shen et al evaluated these models using routine clinical data from Chinese patients in 2015, and found differences in the clinicopathological features in the European clinical trial data (training set) and the Chinese data, which led the models to overestimate the local control rate versus the outcomes that were observed in clinical practice.10 Furthermore, that study only evaluated data from a single institution, which might not reflect the entire Chinese population.10 Moreover, the study failed to incorporate serum carcinoembryonic antigen (CEA), tumor deposit (TD), tumor regression grade (TRG), circumferential resection margin (CRM), lymphovascular invasion (LVI), perineural invasion (PNI), micro-satellite instability (MSI), KRAS mutations, NRAS mutations, and BRAF mutations, which are considered in the 8th edition of the AJCC Cancer Staging Manual for predicting LARC outcomes.9 Therefore, prediction models must be optimized and validated in the Chinese population using additional prognostic factors and more representative cohorts to determine whether they can enhance the personalized treatment of LARC.
The present study aimed to develop a nomogram for predicting disease-free survival (DSF) among a multicenter cohort of Chinese patients with LARC, and to incorporate six additional factors (CEA, TD, CRM, TRG, LVI, and PNI) that are included in the 8th edition of the AJCC Cancer Staging Manual. The nomogram was then subjected to independent external validation, in order to determine whether it could help identify Chinese patients who would benefit from additional postoperative adjuvant systemic treatment.
Materials and methods
This retrospective study complied with the Declaration of Helsinki and good clinical practice guidelines, and the retrospective protocol was approved by the local ethics committee of the Yunnan Cancer Hospital, Xishan Region, Kunming, People’s Republic of China (KY201824). The committee waived the need for informed consent to be obtained because this study is a retrospective study. All patient information in the study was anonymous.
Patients
We retrospectively identified 228 consecutive Chinese patients with LARC who underwent preoperative therapy between December 2012 and March 2015 at two centers, including 118 patients from the Yunnan Cancer Hospital and 110 patients from The Sixth Affiliated Hospital of Sun Yat-sen University. Figure 1 shows the study flow chart.
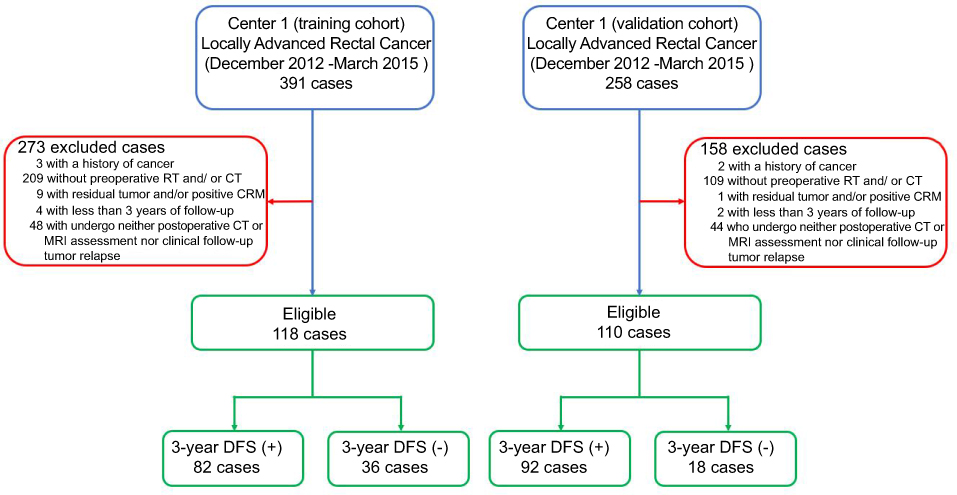 | Figure 1 Study flow chart. Abbreviations: CRM, circumferential resection margin; CT, chemotherapy; DFS, disease-free survival; RCT, radiochemotherapy; RT, radiotherapy. |
Based on the existing literature,7 the inclusion criteria were:
- Primary rectal adenocarcinoma confirmed via biopsy
- A T3 or resectable T4M0 tumor based on pre-treatment computed tomography of the chest and abdomen and pelvis magnetic resonance imaging, according to the 8th edition of the AJCC Staging Manual9
- A tumor that was located within 15 cm of the anal verge
- Age of ≤80 years
- No other treatment before the preoperative therapy
- Radical surgery was performed after the preoperative therapy
The exclusion criteria were:
- Patients with a history of cancer
- Patients who did not complete preoperative radiochemotherapy or chemotherapy or radiotherapy
- Patients with residual tumor and/or circumferential resection margin involvement
- Patients with <3 years of follow-up data
- Patients who did not undergo postoperative imaging or clinical follow-up to detect recurrence
Based on the nomograms for predicting local recurrence and DM from LARC,7,9 the present study analyzed the following factors:
- Patient characteristics, which included sex, age at surgery, pre-treatment clinical tumor (cT) stage, and tumor location
Location was categorized based on distance from the anorectal verge: <5 cm, 5–10 cm, and >10 cm. Clinical nodal (cN) stage was not included in the multivariate model because of its absence in certain data sets (69%) and the low reliability of imaging-based nodal staging.11
The pathological factors were judged based on the 8th edition of the AJCC Cancer Staging Manual and the National Comprehensive Cancer Network guidelines.4,9
The pretreatment CEA level was the value closest to the start of preoperative therapy. The preoperative CEA level was the value closest to the time of surgery. The postoperative CEA level was the last value from <12 weeks after surgery and before starting adjuvant chemotherapy. The CEA levels were categorized as normal (≤5.0 ng/mL) or elevated. (>5.0 ng/mL)
The DFS interval was defined as the time from the start of preoperative therapy to the first confirmed instance of local recurrence, DM, or death due to disease or treatment. Patients who were alive and free from disease (or died from an unrelated cause and without evidence of rectal cancer) were censored at the last follow-up.12
Preoperative therapy protocol
All patients received the preoperative therapy according the National Comprehensive Cancer Network (NCCN) Clinical Practice Guidelines in the Rectal Cancer.4 Preoperative therapy protocol included combined radiochemotherapy, mono chemotherapy or mono radiotherapy. The combined radiochemotherapy included Capecitabine/long-course radiotherapy(45–50 Gy in 25–28 fractions), infusional 5-FU/long-course radiotherapy(45–50 Gy in 25–28 fractions), or bolus 5-FU/leucovorin//long-course radiotherapy(45–50 Gy in 25–28 fractions). The mono chemotherapy included FOLFOX (folinic acid, fluorouracil and oxaliplatin) or CAPEOX (capecitabine and oxaliplatin). The mono radiotherapy was the regimen of 25 Gy in 5 fractions.
Follow-up
All patients were followed every 3–6 months during the first 2 years, every 6 months during the next 3 years, and then annually thereafter. The evaluations included a clinical examination, abdominal ultrasonography or computed tomography, chest radiography, and serum CEA level. All instances of local recurrence or DM were confirmed via histology or imaging.
Statistical analysis
The statistical analyses were performed using R software (version 3.4.0;
Differences in clinicopathological characteristics between the training and validation cohorts were analyzed using the t test or chi-square test. The hazard function for DFS was plotted using the kernel-smoothing method,14 and the 3-year DFS rates according to the different variables were compared using Kaplan-Meier curves and the log-rank test. Multivariate analyses were performed using the Cox proportional hazards model, and hazard ratios (HR) and 95% confidence intervals (CI) were calculated using the model coefficients. Significant predictors of 3-year DFS were selected based on the Cox model using the training data (p<0.05). The model was re-developed with the significant predictors, and all predictors still contributed significantly to the reduced model.
The model’s performance was evaluated based on its discrimination, calibration, and clinical usefulness. Discrimination was evaluated using the Harrell concordance index (C-index) and calibration was evaluated using the Hosmer-Lemeshow calibration test and a calibration curve.15,16 Clinical benefits at different threshold probabilities were evaluated using decision curve analysis.17 The model’s performance was also evaluated using bootstrapping, in which the data set was tested 1,000 times with random resampling each time (ie, patients could occur more than once in the data set), and the model’s output was subsequently converted into a nomogram.18
Results
Clinicopathological characteristics
The clinicopathological characteristics of the two cohorts are shown in Table S1. No significant differences (p=0.051 to 0.861) were detected in terms of sex, age, PNI, pretreatment serum CEA level, preoperative serum CEA level, or postoperative serum CEA level. However, there were significant differences (all p<0.05) in terms of tumor location, cT stage, cN stage, preoperative protocol therapy, adjuvant chemotherapy, surgical procedure, surgical approach, ypT stage, ypN stage, TRG, and LVI.
Follow-up analysis
The median follow-up intervals were 45.5 months in the training cohort (interquartile range [IQR]: 39.9–53.0 months) and 48.6 months in the validation cohort (IQR: 43.5–53.1 months). In the training cohort, the overall survival rate at the last follow-up was 64.8% (95% CI: 55.1–76.4%), the DFS rate at the last follow-up was 45.4% (95% CI: 34.8–59.1%), the 3-year DFS rate was 69.5% (95% CI: 61.2–78.3%), the mean DFS was 38.3 months (95% CI: 35.0–41.6 months), and the median DFS was 42.9 months (IQR: 41.0–45.3 months). In the validation cohort, the overall survival rate at the last follow-up was 91.1% (95% CI: 81.7–100.0%), the DFS rate at the last follow-up was 75.2% (95% CI: 61.2–92.3%), the 3-year DFS rate was 83.6% (95% CI: 77.0–90.8%), the mean DFS was 44.4 months (95% CI: 42.1–46.9 months), and the median DFS was 47.8 months (IQR: 44.6–49.1 months). The smoothed curves for the hazard function in each cohort indicated that the risk of recurrence was slightly higher and peaked slightly earlier in the training cohort (Figure S1). The Kaplan-Meier analyses of the pooled data revealed that the DFS interval was significantly influenced by preoperative therapy protocol, surgical approach, ypT stage, ypN stage, TRG, LVI, PNI, preoperative CEA level, and postoperative CEA level (Table 1).
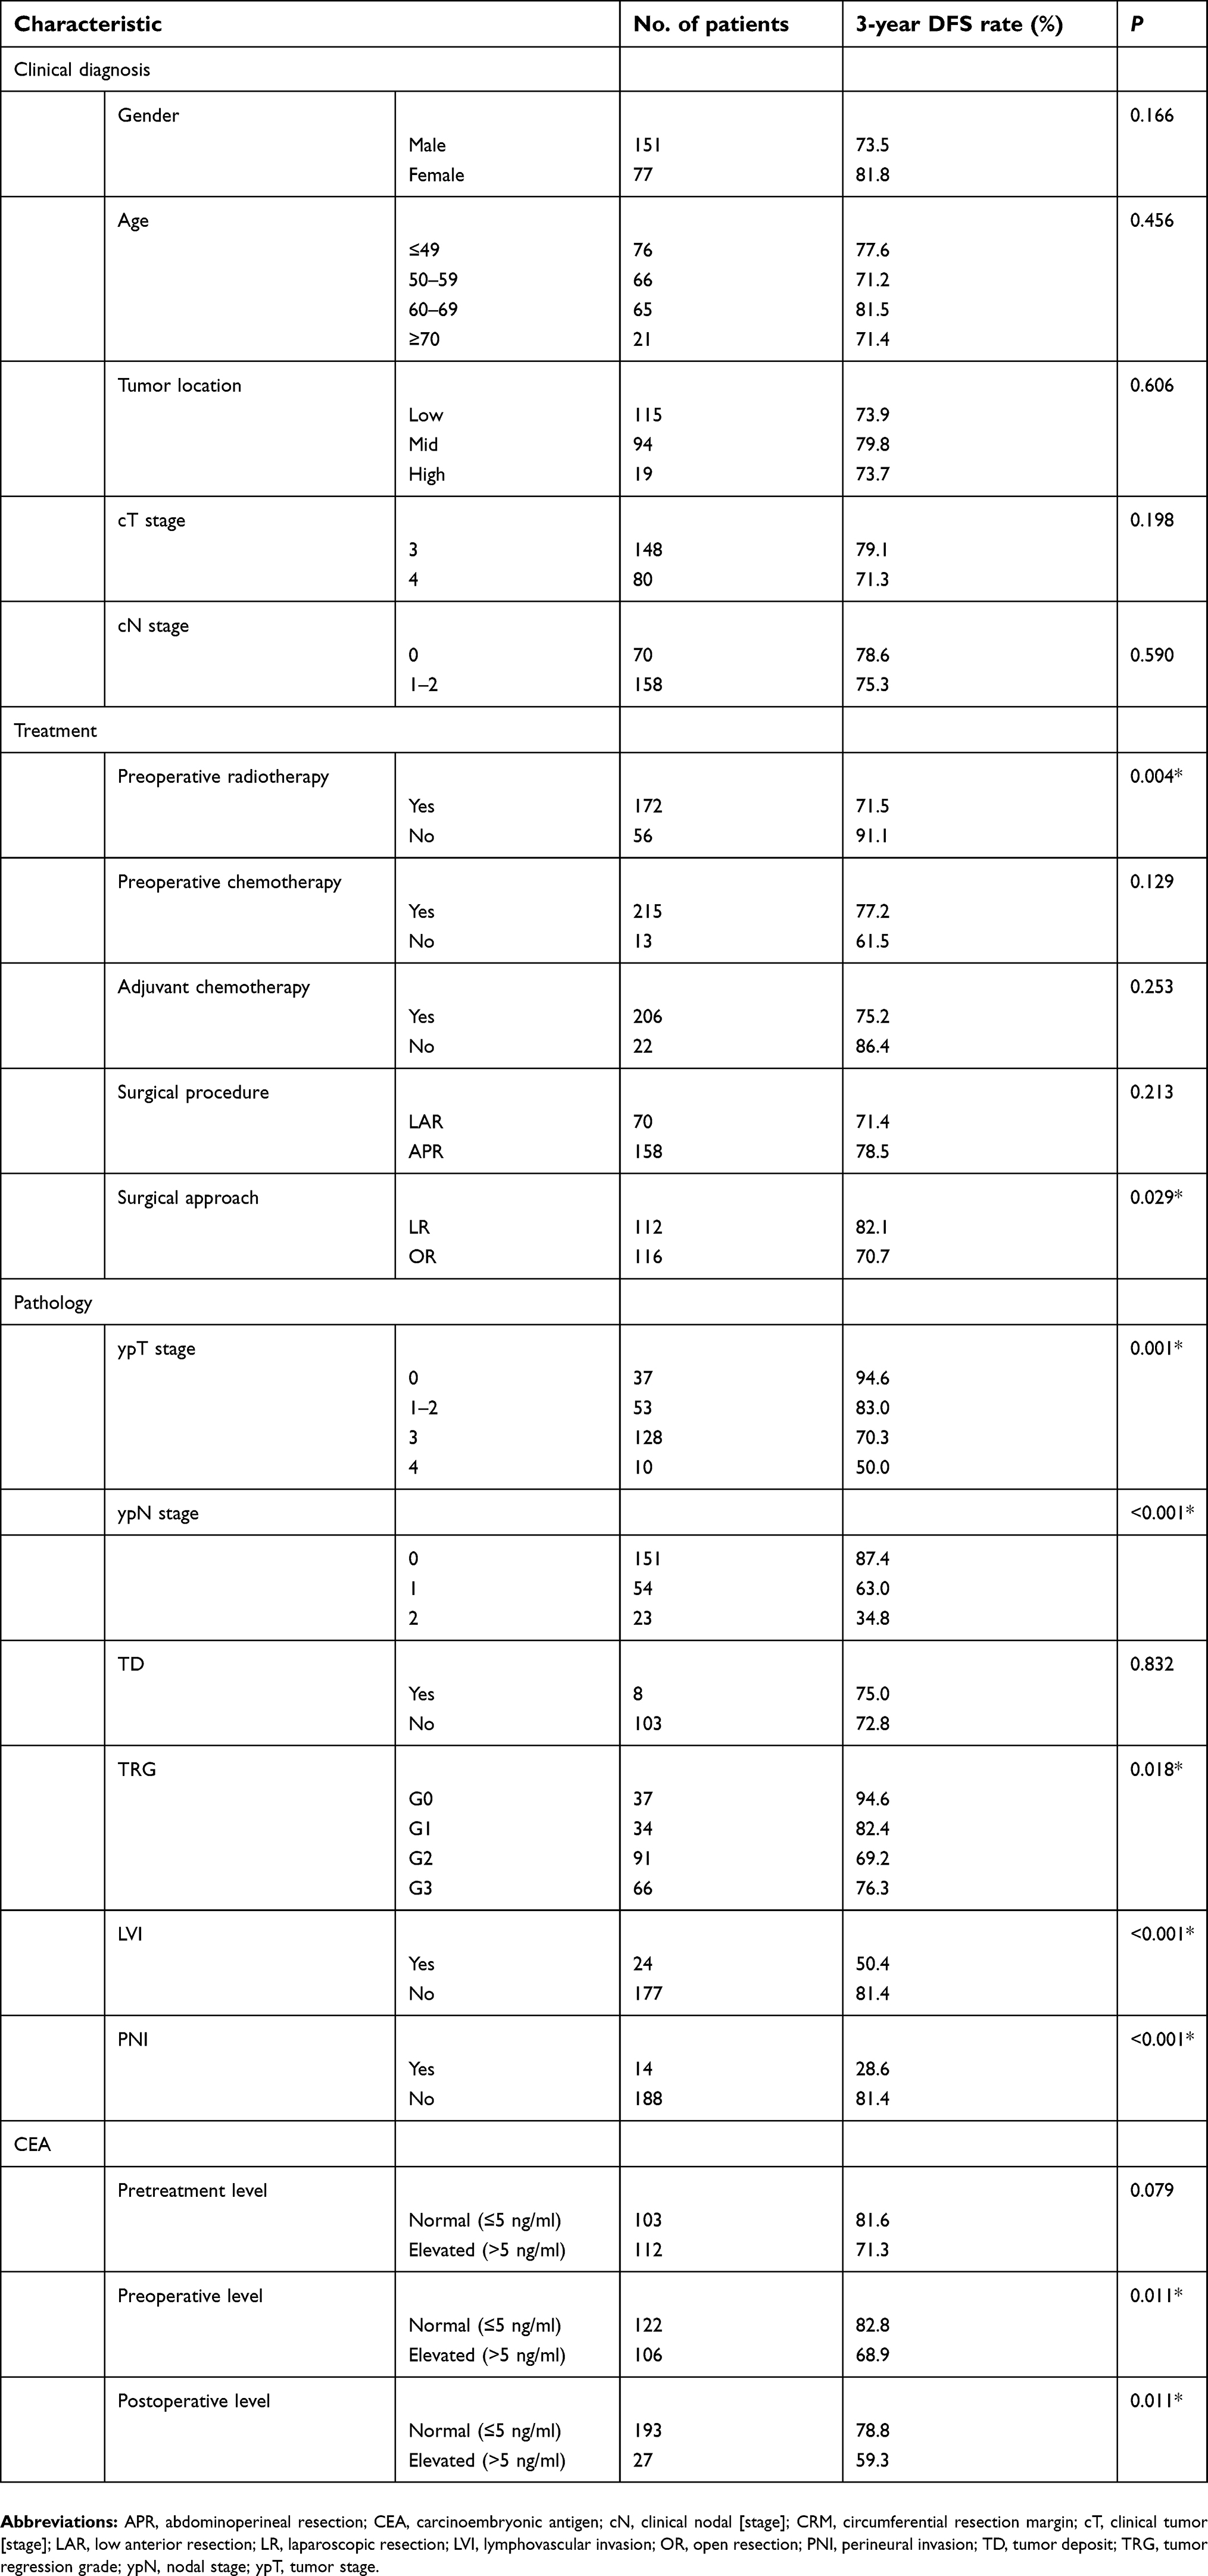 | Table 1 DFS rate at 3 years for the pooled data set, stratified for each variable |
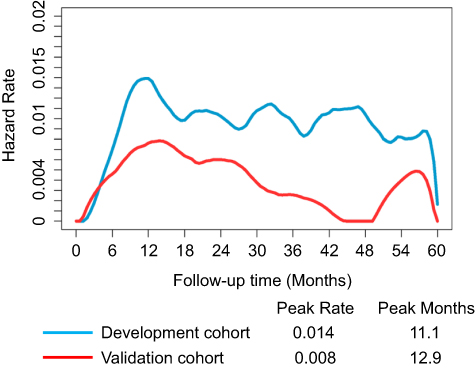 | Figure S1 The smoothed curves of the hazard function for each cohort. |
Nomogram
The nomogram was developed using all patients in the training cohort (N=118). However, some predictive variables from the Kaplan-Meier analyses (Table 1) were not significant in the multivariate models (Table 2), and these variables included preoperative therapy protocol, surgical approach, TRG, LVI, PNI, preoperative CEA level, and postoperative CEA. The predictors that remained significant in the nomogram included ypT stage and ypN stage.
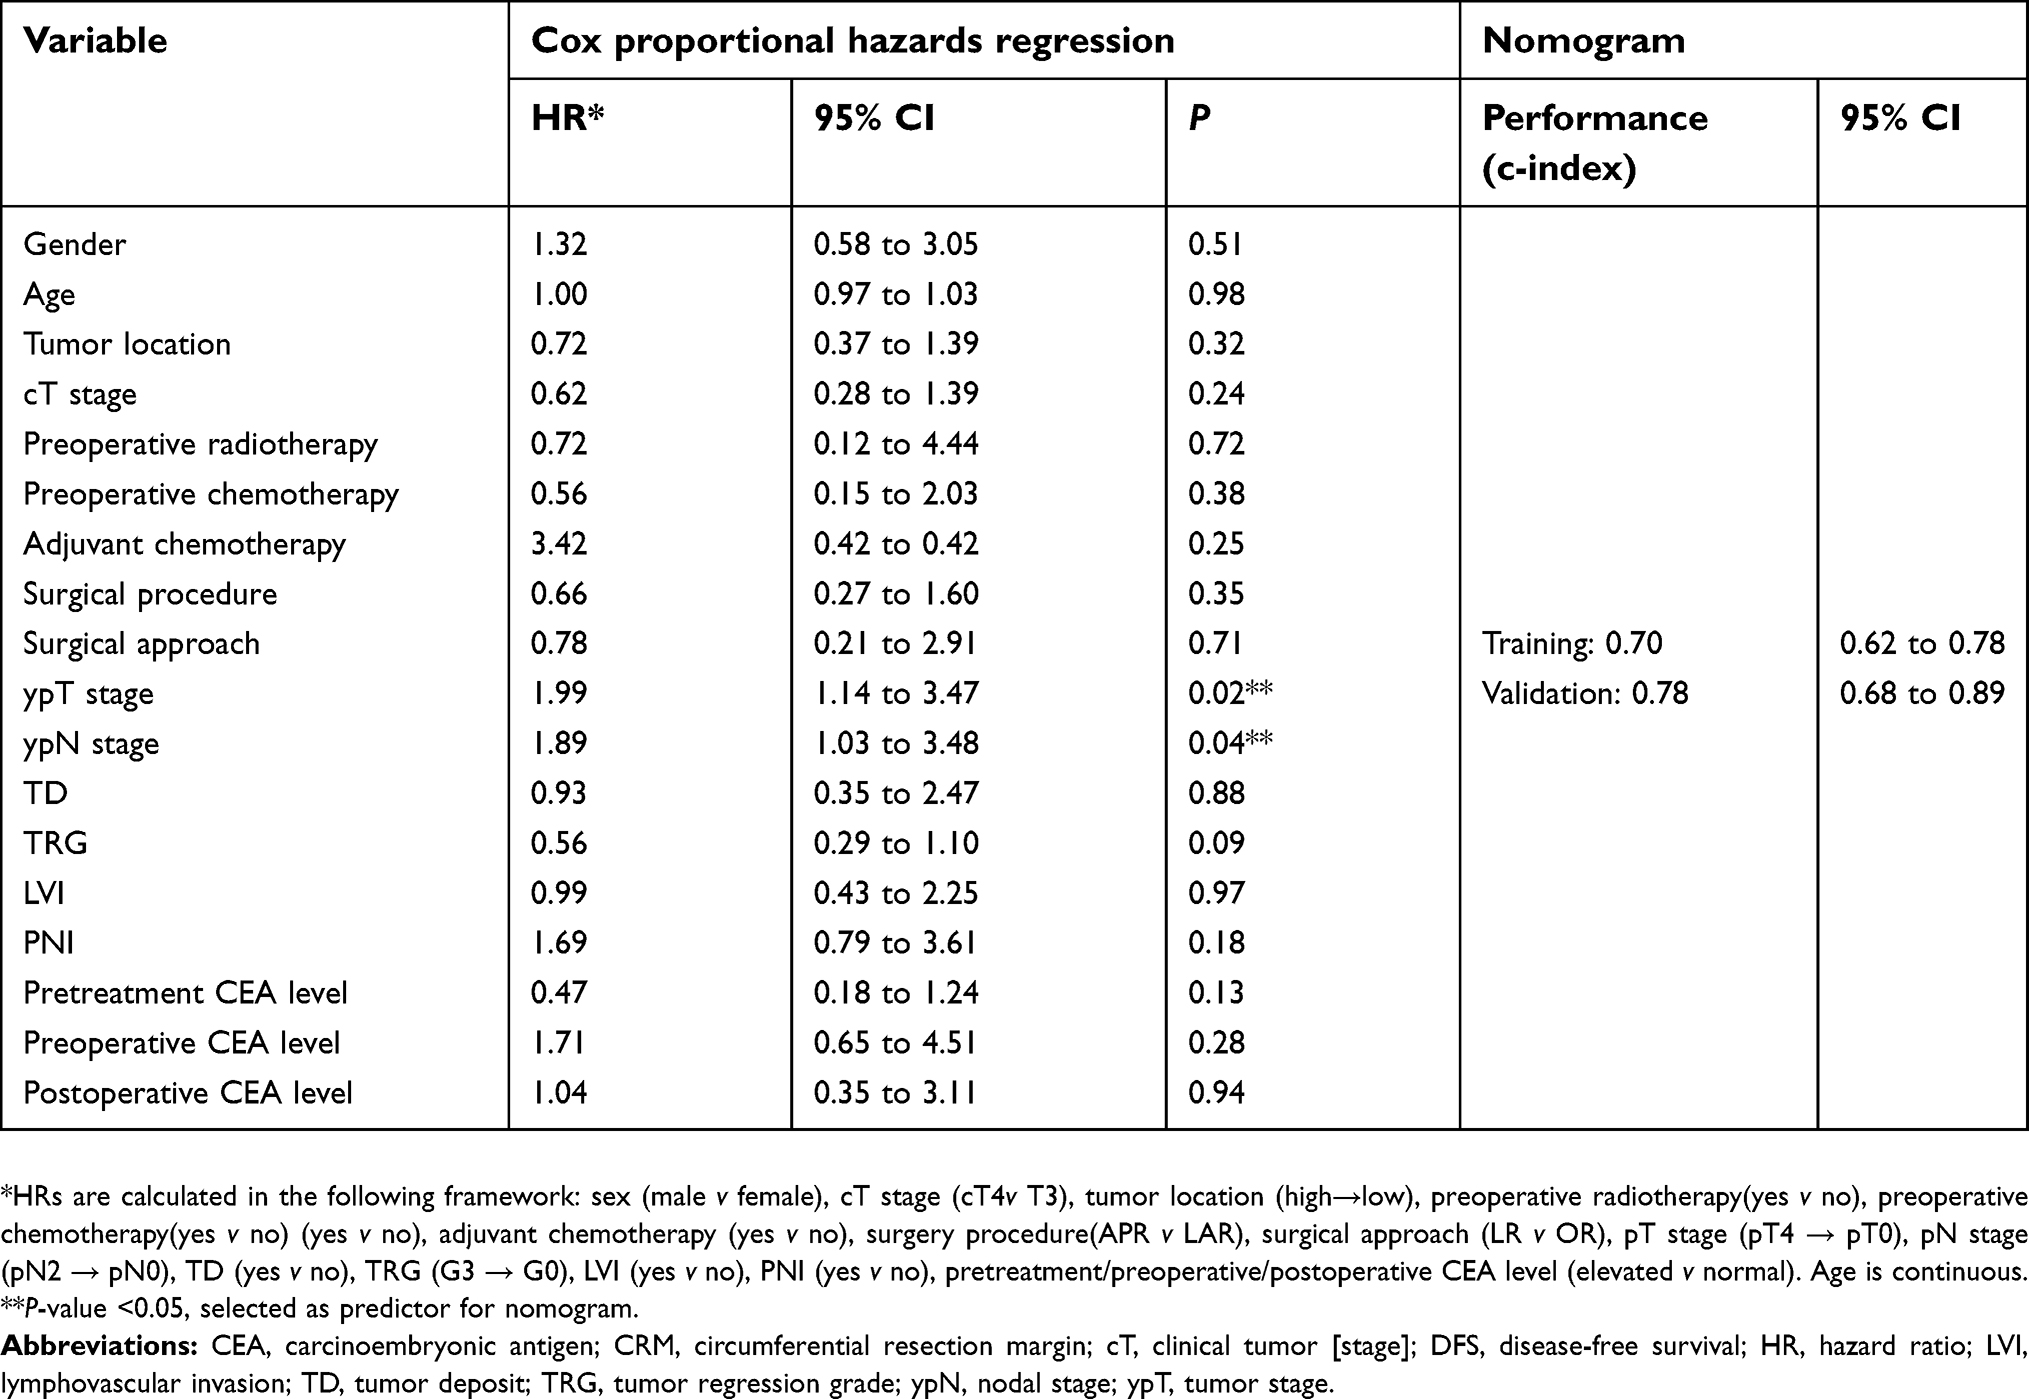 | Table 2 Model development of 3-year DFS: multivariate analyses to determine the final predictors for the nomograms |
The 3-year DFS nomogram is presented in Figure 2. The C-index values were 0.70 in the training cohort (95% CI: 0.62–0.78) and 0.78 in the validation cohort (95% CI: 0.68–0.89). The nomogram’s performance was not significantly difference between the training and validation cohorts. Furthermore, the Hosmer-Lemeshow calibration test failed to detect a significant result in the training and validation cohorts, with Figure 3 showing the calibration plots for external validation at 1 year, 2 years, or 3 years. Figure 4 shows the decision curve at 3 years, and the use of the nomogram’s predictions of 3-year outcomes provided better results than scenarios in which all patients were treated or in which no patients were treated (the risk probabilities ranged from 0.21 to 0.44).
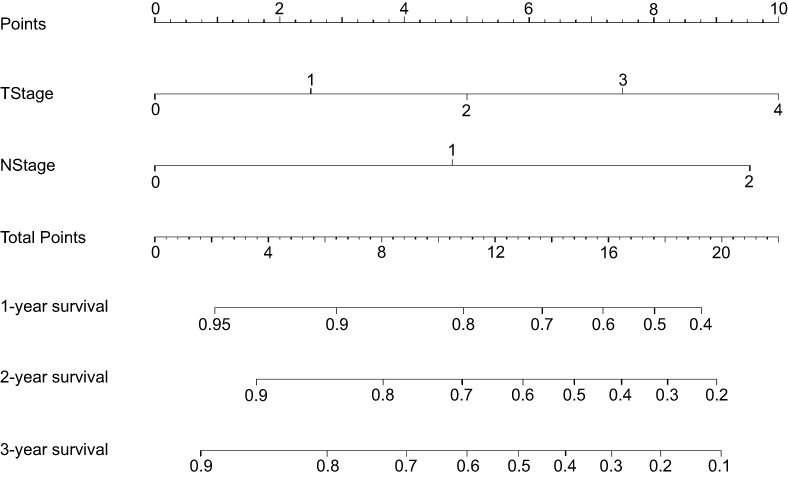 | Figure 2 Nomograms for predicting 3-year disease-free survival among patients with locally advanced rectal cancer. Each variable value was assigned a score and the sum of the scores was converted into a probability in the lowest scale. Abbreviations: ypN, pathological nodal findings [stage]; ypT, pathological tumor findings [stage]. |
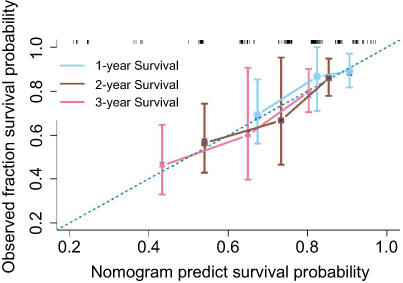 | Figure 3 Calibration plots for external validation of the disease-free survival prediction nomogram. The calibration curve for the disease-free survival (DFS) nomogram revealed good calibration based on agreement between the estimated and observed 1-year, 2-year, and 3-year outcomes. The nomogram-estimated DFS is plotted on the X-axis and the observed tumor recurrence rate is plotted on the Y-axis. The diagonal dotted line indicates perfect calibration based on an ideal model that perfectly reflects the actual outcomes. The solid line indicates the nomogram’s performance, with close alignment of the solid and dotted lines indicating better estimation of the actual outcomes. |
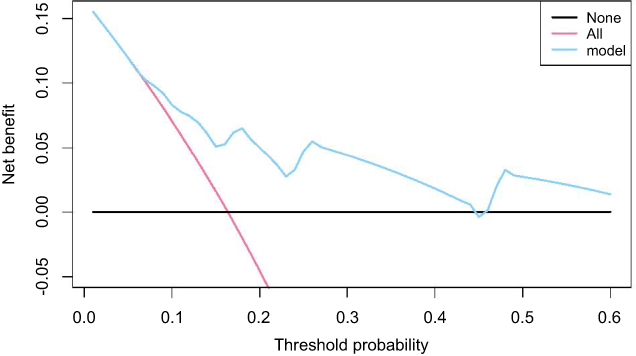 | Figure 4 Decision curve analysis for the 3-year disease-free survival prediction model. The Y-axis measures the net benefit, which is calculated by summing the benefits (true-positive results) and subtracting the harms (false-positive results). The harms are weighted based on a factor related to the relative harm of undetected cancer versus the harm of unnecessary treatment. |
Discussion
We developed and validated a nomogram including the ypT stage and ypN stage for predicting recurrence among Chinese patients with LARC who underwent preoperative therapy followed by surgical resection. This nomogram is simpler and had similar performance to the currently available nomograms.7,10,19,20 Furthermore, based on its focus on recurrence risk, it may be useful for identifying patients who could be cured, especially as the results were externally validated in an independent cohort. In this context, the 8th edition of the AJCC Cancer Staging Manual provided risk assessment models for several cancers,8 and Valentini et al used 2011 data from European clinical trial participants to develop nomograms that predicted various outcomes (local recurrence, DM, and overall survival) among patients with LARC.7,9 In 2015, these models were evaluated in an independent Chinese cohort, which revealed that they overestimated the local control rate (vs the observed rate) in the Chinese cohort.10 Therefore, we attempted to optimize these models using additional factors from the 8th edition of the AJCC Cancer Staging Manual,9 which we believe is the first attempt to develop and validate a model for predicting DFS among Chinese patients with LARC based on data from routine clinical practice.
Our nomogram was successfully subjected to independent external validation, which revealed good calibration and better discrimination in the validation cohort than in the training cohort. Furthermore, the decision analysis curve revealed that, when used for patients with a threshold probability of >21%, our nomogram provided clinical benefits relative to approaches that involved treating all patients or treating no patients. Therefore, our nomogram appears to be robust and useful for predicting 3-year DFS among Chinese patients with LARC.
Our results revealed that, in addition to the traditional staging system, the DFS interval in LARC cases was also affected by preoperative therapy protocol, TRG, LVI, PNI, preoperative CEA level, and postoperative CEA level, which has also been demonstrated in previous studies.21–25 Furthermore, our findings indicate that surgical approach influences the DFS interval, although previous studies failed to detect a significant difference in DFS or recurrence between patients who underwent laparoscopic or open resection of rectal cancer.26,27 This might be related to differences in the preferences of Chinese surgeons. The laparoscopic surgery in the treatment of patients with rectal cancer was introduced to China less than a decade ago. In some underdeveloped areas, such as Yunnan Province, there was no systematic training program for the novice laparoscopic surgeons. Therefore, surgeons’ experiences were gained through the surgery practice. In order to be more experienced, some surgeons preferred performing laparoscopic surgery in the treatment of patients with rectal cancer without the guidance of other senior or experienced surgeons. As a result, the surgeons’ practice had an impact on the performance of the radical surgery, such as the negative distal margin and total mesorectal excision completeness, which is associated with the long-term outcomes in LARC. We also found that most factors (except the traditional ypT and ypN staging) were not significant in the multivariate models, although this might be related to the relatively small sample size. Interestingly, we detected differences in the clinicopathological and treatment characteristics of our Chinese cohort (observed in routine clinical practice) and the European pooled cohort that was used by Valentini et al For example, our Chinese patients were younger, were more likely to have tumors at ≤10 cm from the anal verge, were more likely to undergo abdominoperineal resection, had a higher proportion of ypT0 tumors, and had a lower proportion of preoperative chemotherapy without radiotherapy. These differences agree with the findings that were reported by Shen et al10.
The present study also revealed some differences in the clinicopathological and treatment features of the training and validation cohorts. First, the training cohort had larger proportions of patients with cT4 or cN1–2 disease than the validation cohort. Second, the training cohort had greater proportions of tumors at <5 cm from the anal verge, low anterior resection, and open resection. Third, the validation cohort had a higher proportion of preoperative plus postoperative chemotherapy, along with higher rates of ypT0 disease, ypN0 disease, and 3-year DFS. These differences may be related to the cohorts being collected in a relatively underdeveloped area of China (Yunnan Province) and a relatively developed area of China (Guangdong Province). Nevertheless, these differences did not affect the performance of our nomogram in the validation cohort, which indicates that our nomogram was robust and generalizable when applied to new conditions.
This study has two major limitations. First, the sample size was relatively small compared to the number of predictors, and 273 patients were excluded from the initial population because of the restrictive inclusion criteria, although this resulted in a relatively homogeneous population with ≥3 years of follow-up data. Second, we did not consider the prognostic implications of genetic alterations (eg, MSI, KRAS, NRAS, and BRAF mutations), which is because these variables had >10% missing values and were not eligible for the imputation approach.
Conclusion
In conclusion, we developed and validated a nomogram to predict 3-year DFS among Chinese patients with LARC. This nomogram may help build on the traditional staging system and allow clinicians to perform personalized prediction of DFS among Chinese patients with LARC.
Acknowledgments
This work was supported by grants from the National Key Research and Development Program of China [2017YFC1309100], the National Natural Scientific Foundation of China [81771912], and the Applied Basic Research Projects of Yunnan Province, China [2018FE001-065 and 2018FE001-251].
Author contributions
All authors contributed to data analysis, drafting or revising the article, gave final approval of the version to be published, and agree to be accountable for all aspects of the work.
Disclosure
The authors report no conflicts of interest in this work.
References
1. Bray F, Ferlay J, Soerjomataram I, Siegel RL, Torre LA, Jemal A. Global cancer statistics 2018: GLOBOCAN estimates of incidence and mortality worldwide for 36 cancers in 185 countries. CA Cancer J Clin. 2018;68(6):394–424. doi:10.3322/caac.21492
2. Chen W, Zheng R, Baade PD, et al. Cancer statistics in China, 2015. CA Cancer J Clin. 2016;66(2):115–132. doi:10.3322/caac.21338
3. Liu Z, Zhang XY, Shi YJ, et al. Radiomics analysis for evaluation of pathological complete response to neoadjuvant chemoradiotherapy in locally advanced rectal cancer. Clin Cancer Res. 2017;23(23):7253–7262. doi:10.1158/1078-0432.CCR-17-1038
4.
5. Cunningham D, Allum WH, Stenning SP, et al. Perioperative chemotherapy versus surgery alone for resectable gastroesophageal cancer. N Engl J Med. 2006;355(1):11–20. doi:10.1056/NEJMoa055531
6. Gray R, Barnwell J, McConkey C, et al. Adjuvant chemotherapy versus observation in patients with colorectal cancer: a randomised study. Lancet. 2007;370(9604):2020–2029. doi:10.1016/S0140-6736(07)61866-2
7. Valentini V, van Stiphout RG, Lammering G, et al. Nomograms for predicting local recurrence, distant metastases, and overall survival for patients with locally advanced rectal cancer on the basis of European randomized clinical trials. J Clin Oncol. 2011;29(23):3163–3172. doi:10.1200/JCO.2010.33.1595
8. Amin MB, Greene FL, Edge SB, et al. The eighth edition AJCC cancer staging manual: continuing to build a bridge from a population-based to a more “personalized” approach to cancer staging. CA Cancer J Clin. 2017;67(2):93–99. doi:10.3322/caac.21388
9. Amin MB, Edge S, Greene F, et al. AJCC Cancer Staging Manual.
10. Shen L, van Soest J, Wang J, et al. Validation of a rectal cancer outcome prediction model with a cohort of Chinese patients. Oncotarget. 2015;6(35):38327–38335. doi:10.18632/oncotarget.5195
11. Valentini V, Aristei C, Glimelius B, et al. Multidisciplinary rectal cancer management: 2nd European Rectal Cancer Consensus Conference (EURECA-CC2). Radiother Oncol. 2009;92(2):148–163. doi:10.1016/j.radonc.2009.06.027
12. Sebag-Montefiore D, Stephens RJ, Steele R, et al. Preoperative radiotherapy versus selective postoperative chemoradiotherapy in patients with rectal cancer (MRC CR07 and NCIC-CTG C016): a multicentre, randomised trial. Lancet. 2009;373(9666):811–820. doi:10.1016/S0140-6736(09)60484-0
13. Gadbury G, Schafer JL. Analysis of incomplete multivariate data (Monographs on Statistics And Applied Probability, No. 72) by J. L. Schafer. J Am Stat Assoc. 2000;95(451):1013–1014. doi:10.2307/2669497
14. Hess KR, Serachitopol DM, Brown BW. Hazard function estimators: a simulation study. Stat Med. 1999;18(22):3075–3088. doi:10.1002/(SICI)1097-0258(19991130)18:22<3075::AID-SIM244>3.0.CO;2-6
15. Gönen M, Heller G. Concordance probability and discriminatory power in proportional hazards regression. Biometrika. 2005;92(4):965–970. doi:10.1093/biomet/92.4.965
16. Pencina MJ, D’Agostino RB
17. Fitzgerald M, Saville BR, Lewis RJ. Decision curve analysis. JAMA. 2015;313(4):409–410. doi:10.1001/jama.2015.37
18. Iasonos A, Schrag D, Raj GV, et al. How to build and interpret a nomogram for cancer prognosis. J Clin Oncol. 2008;26(8):1364–1370. doi:10.1200/JCO.2007.15.2777
19. Xie K, Peng J, Ding Y, et al. Prognostic nomograms for predicting survival and distant metastases in locally advanced rectal cancers. PLoS One. 2014;9(8):e106344. doi:10.1371/journal.pone.0106344
20. van Gijn W, van Stiphout RG, van de Velde CJ, et al. Nomograms to predict survival and the risk for developing local or distant recurrence in patients with rectal cancer treated with optional short-term radiotherapy. Ann Oncol. 2015;26(5):928–935. doi:10.1093/annonc/mdv383
21. Breugom AJ, Swets M, Bosset JF, et al. Adjuvant chemotherapy after preoperative (chemo)radiotherapy and surgery for patients with rectal cancer: a systematic review and meta-analysis of individual patient data. Lancet Oncol. 2015;16(2):200–207. doi:10.1016/S1470-2045(14)71199-4
22. Song C, Chung JH, Kang SB, et al. Impact of tumor regression grade as a major prognostic factor in locally advanced rectal cancer after neoadjuvant chemoradiotherapy: a proposal for a modified staging system. Cancers (Basel). 2018. doi:10.3390/cancers10090319
23. Hogan J, Chang KH, Duff G, et al. Lymphovascular invasion: a comprehensive appraisal in colon and rectal adenocarcinoma. Dis Colon Rectum. 2015;58(6):547–555. doi:10.1097/DCR.0000000000000361
24. Yokoyama S, Matsuda K, Watanabe T, et al. Perineural invasion is associated with poor survival after preoperative chemoradiation therapy for advanced lower rectal cancer. Dig Surg. 2017;34(5):387–393. doi:10.1159/000453591
25. Nicholson BD, Shinkins B, Mant D. Blood measurement of carcinoembryonic antigen level for detecting recurrence of colorectal cancer. JAMA. 2016;316(12):1310–1311. doi:10.1001/jama.2016.11212
26. Fleshman J, Branda ME, Sargent DJ, et al. Disease-free survival and local recurrence for laparoscopic resection compared with open resection of stage II to III rectal cancer: follow-up results of the ACOSOG Z6051 randomized controlled trial. Ann Surg. 2018. doi:10.1097/SLA.0000000000003002
27. Stevenson ARL, Solomon MJ, Brown CSB, et al. Disease-free survival and local recurrence after laparoscopic-assisted resection or open resection for rectal cancer: the australasian laparoscopic cancer of the rectum randomized clinical trial. Ann Surg. 2018. doi:10.1097/SLA.0000000000003021
Supplementary materials
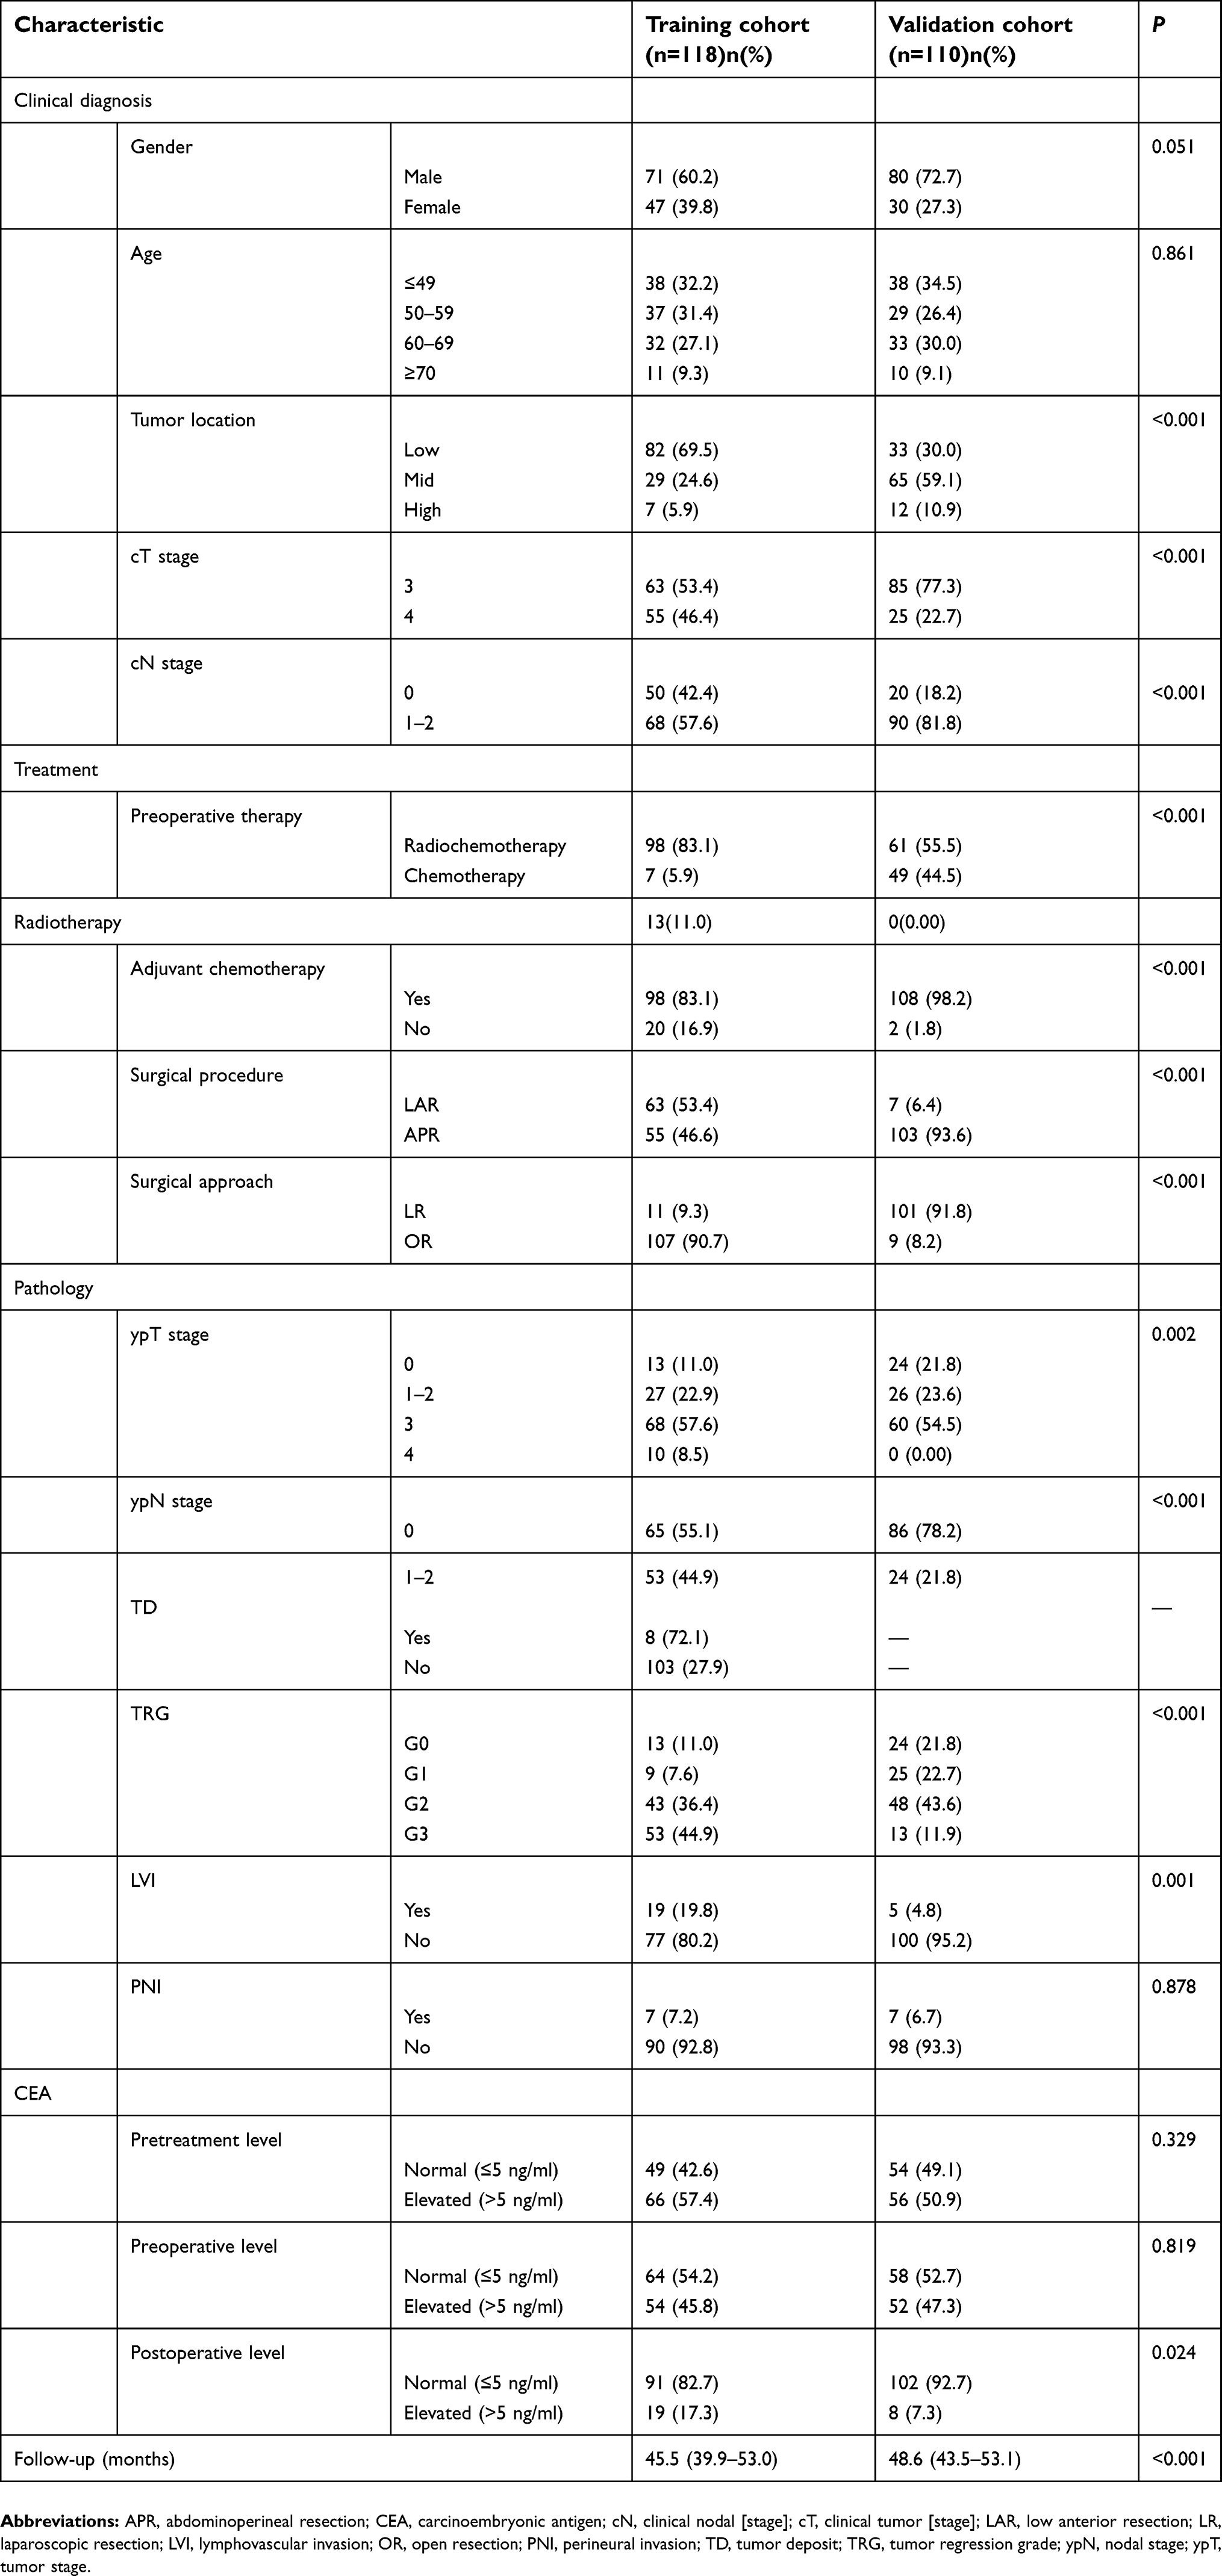 | Table S1 Clinicopathological characteristics of patients with LARC in the training cohort and validation cohort |
 © 2019 The Author(s). This work is published and licensed by Dove Medical Press Limited. The
full terms of this license are available at https://www.dovepress.com/terms
and incorporate the Creative Commons Attribution
- Non Commercial (unported, 3.0) License.
By accessing the work you hereby accept the Terms. Non-commercial uses of the work are permitted
without any further permission from Dove Medical Press Limited, provided the work is properly
attributed. For permission for commercial use of this work, please see paragraphs 4.2 and 5 of our Terms.
© 2019 The Author(s). This work is published and licensed by Dove Medical Press Limited. The
full terms of this license are available at https://www.dovepress.com/terms
and incorporate the Creative Commons Attribution
- Non Commercial (unported, 3.0) License.
By accessing the work you hereby accept the Terms. Non-commercial uses of the work are permitted
without any further permission from Dove Medical Press Limited, provided the work is properly
attributed. For permission for commercial use of this work, please see paragraphs 4.2 and 5 of our Terms.