Back to Journals » Nature and Science of Sleep » Volume 13
Nocturnal Brain Activity Differs with Age and Sex: Comparisons of Sleep EEG Power Spectra Between Young and Elderly Men, and Between 60–80-Year-Old Men and Women
Authors Eggert T ![]() , Dorn H, Danker-Hopfe H
, Dorn H, Danker-Hopfe H
Received 1 July 2021
Accepted for publication 29 August 2021
Published 21 September 2021 Volume 2021:13 Pages 1611—1630
DOI https://doi.org/10.2147/NSS.S327221
Checked for plagiarism Yes
Review by Single anonymous peer review
Peer reviewer comments 2
Editor who approved publication: Prof. Dr. Ahmed BaHammam
Torsten Eggert, Hans Dorn, Heidi Danker-Hopfe
Charité – Universitätsmedizin Berlin, Competence Centre of Sleep Medicine, Berlin, Germany
Correspondence: Heidi Danker-Hopfe Email [email protected]
Purpose: Quantification of nocturnal EEG activity has emerged as a promising extension to the conventional sleep evaluation approach. To date, studies focusing on quantitative sleep EEG data in relation to age and sex have revealed considerable variation across lifespan and differences between men and women. However, sleep EEG power values from elderly individuals are still rare. The present secondary analysis aimed to fill this gap.
Participants and Methods: Sleep EEG data of 30 healthy elderly males (mean age ± SD: 69.1 ± 5.5 years), 30 healthy elderly females (67.8 ± 5.7 years), and of 30 healthy young males (25.6 ± 2.4 years) have been collected in three different studies with the same experimental design. Each individual contributed three polysomnographic recordings without any intervention to the analysis. Sleep recordings were performed and evaluated according to the standard of the American Academy of Sleep Medicine. Sleep EEG signals were derived from 19 electrode sites. Sleep-stage specific global and regional EEG power were compared between samples using a permutation-based statistic in combination with the threshold-free cluster enhancement method.
Results: The present results showed pronounced differences in sleep EEG power between older men and women. The nocturnal EEG activity of older women was generally larger than that of older men, confirming previously reported variations with sex in younger individuals. Aging was reflected by differences in EEG power between young and elderly men for lower frequencies and for the sleep spindle frequency range, again consistent with prior studies.
Conclusion: The findings of this investigation complement those of earlier studies. They add to the understanding of nocturnal brain activity manifestation in senior adulthood and show how it differs with age in males. Unfortunately, the lack of information on young women prevents a similar insight for females.
Keywords: neurophysiology, aging, qEEG, gender, topography, TFCE
Introduction
Polysomnography (PSG) is a sleep recording technique, which is used in sleep research and as a diagnostic tool in sleep medicine. Electroencephalography (EEG) is the most essential component of a PSG. These EEG signals along with recordings of eye movements (electrooculography; EOG) and of activities from the chin muscle (electromyography; EMG) provide the basis for the assignment of sleep stages in healthy and sleep-disturbed individuals.1 Visual and computer-assisted sleep scorings yield a hypnogram from which various variables can be derived that describe the macrostructure of sleep. It is well documented that many of these variables change over the lifespan and/or exhibit sex differences at specific stages of life. Marked age-related variations have been reported, eg, for the total sleep time (decrease with age) and the associated wake time after sleep onset (increase with age), resulting in a reduced sleep efficiency index.2–5 Sex differences in the macrostructure of sleep are less pronounced affecting predominantly variables related to sleep stage proportions. Amongst others, the amount of stage N1 sleep has been shown to be lower in women compared to men,3–5 while at the same time stage N3 sleep was higher in women.3,5 However, older adults are underrepresented in the respective study samples, hence most of the currently known variations with age and sex are more robust for individuals up to an age of 60 years. To address this lack of information on possible sex differences in the elderly, Danker-Hopfe et al6 performed a secondary analysis on macrostructural data that had been collected with the purpose of investigating a possible impact of radiofrequency electromagnetic fields (RF-EMF) on sleep in 60–80-year-old healthy men and women (note that only data recorded under an experimental condition without RF-EMF exposure were considered for the present analysis). For variables related to sleep architecture in elderly, Danker-Hopfe et al6 observed a statistically significant reduced proportion of stage N1 sleep in women compared to men, which was in line with the other studies mentioned above. The amount of rapid eye movement (REM) sleep was also significantly lower in females, whereas stage N2 sleep was increased. Furthermore, sex had a significant effect on sleep parameters related to sleep-wake times (reduced total sleep time, sleep period time, and sleep efficiency in women), related to sleep initiation (longer sleep onset latency and REM sleep latency in women), and related to sleep maintenance (less awakenings and sleep stage shifts in women), respectively. A corresponding comparison of sham data between the senior and young adult male samples is described in Eggert et al.7 They reported age-related differences in objective sleep parameters that were prominent in 22 of the 30 variables analyzed.
Besides the standard evaluation of PSGs, quantitative analyses of the EEG are gaining importance in research as well as in clinical settings. Quantification of EEG (qEEG) is achieved eg, by spectral analysis, a method that converts data from the time domain into the frequency domain. The resulting spectral power values can then be summed and categorized according to commonly accepted frequency ranges. In general, parameters based on EEG spectra have been shown to change with demographic variables such as age.8,9 Specifically, sleep qEEG analyses, for instance, (a) play an increasingly important role in pharmaco-sleep studies (ie, in preclinical research and in all phases of clinical drug development),10 (b) can be used to estimate a “brain age index”11 that has the potential to be a biomarker associated with dementia,12 (c) partly contribute to the clarification of the pathophysiology of sleep disorders like insomnia,13 (d) can help to understand the underlying brain activities characterizing inertia and awakenings during NREM sleep stage N2 and REM sleep,14 and (e) are influential in elucidating the functionality of the different oscillatory EEG activities during sleep. For example, EEG activities in the low-frequency range have been shown to be related to the homeostatic sleep drive15–17 and power values in the sigma frequency range are assumed to be associated with sleep spindle quantity and dynamics.18 Furthermore, RF-EMF exposure is discussed to affect EEG power during sleep, specifically in the sleep spindle frequency range.19 The qEEG analysis technique also includes the possibility of a topographical evaluation of sleep, which allows for the detection and visual representation of any regional features of the sleep EEG.20 Though these examples underline the usefulness of this quantification technique when applied to sleep EEG, comparability as well as interpretation of outcomes between laboratories is hampered due to non-standardized sleep qEEG methodologies.10,21 Hence, establishing recording and analysis guidelines, such as those developed for pharmaco-sleep studies,10 are of particular importance.
To what extent sleep qEEG variables vary with age and sex has already been examined in some studies.3,22–26 As for the macrostructure of sleep, changes in EEG power values during the lifespan as well as EEG power differences between the sexes have been shown to be complex, but as data from elderly individuals are similarly sparse, these effects are again more robust for young and middle-aged adults. Thus, it is still poorly understood whether the age-related changes in sleep EEG power progress into the elderly and if so, how qEEG sleep parameters differ between men and women in this stage of late adulthood.
The present study pursued therefore the following two goals: First, to elaborate sex differences in sleep EEG power for the underrepresented age group of 60+ years, and second, to revisit the age aspect by taking into account quantitative sleep EEG parameters from elderly (60–80 years) men while comparing them with EEG power values from young male adults (18–30 years).
Materials and Methods
General Information About the Included Datasets
The present work represents a re-analysis of sleep data collected in several research projects on health effects of RF-EMF exposure, sponsored either by the German Federal Office for Radiation Protection or the Federal Agency for Public Safety Digital Radio. In total, four research projects were carried out at the Competence Centre for Sleep Medicine, each with the aim to examine possible acute effects of RF-EMF exposure on the central nervous system. These randomized, double-blind experimental cross-over studies differed with respect to the type of RF-EMF exposure under investigation and the demographic characteristics of the participants. One aspect addressed in these studies was whether an all-night exposure to RF-EMF in comparison to a placebo condition without any RF-EMF intervention (in the following referred to as sham condition) affects the sleeping brain. In the present analysis, the sham data of studies in elderly women (study 1), elderly men (study 2) and young men (study 3) were used. All studies were approved by the ethics committee of the Charité – Universitätsmedizin Berlin (EA4/122/13 for studies 1 and 2; EA4/115/09 for study 3) and performed in accordance with the Declaration of Helsinki. All participants gave their written informed consent prior to the eligibility screening and received a monetary compensation for their efforts.
Enrolment Process and Participation Requirements
Individuals screened for eligibility were recruited via Internet and/or word-of-mouth advertising. In all studies, eligibility criteria were evaluated following a four-stage enrolment process: telephone interview, questionnaires, in-person visit to the sleep centre for a medical inspection, and a screening night in the sleep laboratory. During the telephone interview, information about age, sex, profession, handedness, medical conditions, allergies, medication use, sleep/wake rhythm, (subjective) sleep quality and presence of sleep disturbances, electrically conductive implants, tattoos, excessive caffeine/alcohol consumption, drug use, visual and hearing impairments, and the smoking status was collected. At the next stage of eligibility screening, self-reports based on the following six questionnaires were assessed: Pittsburgh Sleep Quality Index (PSQI),27 Epworth Sleepiness Scale (ESS),28 Morningness-Eveningness Questionnaire (MEQ),29 sleep-wake diary,30 and Self-Rating Scales for Depression (SDS),31 and Anxiety (SAS).32 The medical inspection included a neurological-psychiatric-internistic examination, an electrocardiogram, and an ambulatory registration of respiratory parameters, the latter only in case to exclude a suspected sleep-related breathing disorder. Finally, a cardiorespiratory PSG was performed in the sleep laboratory to check for possible sleep disorders (screening night). Exact study-specific inclusion and exclusion criteria are listed in Tables S1 and S2 in the supplement, respectively.
Study Samples
Total numbers of individuals who were contacted with study information, screened for eligibility, and ultimately enrolled in a study are reported in participant flow diagrams provided in the appendices of other publications.6,7 Baseline characteristics of each sample are presented in Table 1. In each study, 30 healthy individuals were included. In all three samples, the apnea-hypopnea index (AHI) was <15 per hour total sleep time. Although the upper cut-off limit for the MEQ was set to ≤69 in all three studies, MEQ scores >69 were allowed for elderly individuals (studies 1 and 2) if they were not reflected by exceedingly early bedtimes in the sleep-wake diary. There were also a few exceptions made to the selection criteria for sleep latency in the older participants.
 |
Table 1 Demographic Features and Baseline Screening Parameter Characteristics of the Three Different Samples |
Study Procedures
The experimental set-up was practically the same in all studies. After arrival in the sleep laboratory participants were equipped with the necessary sensors for sleep recording. The participants spent altogether 10 nights in the sleep laboratory, of which the first one was the abovementioned screening night. This night served further as adaptation to the laboratory environment. During the remaining nine experimental nights, the participants slept three times each either under one of two different RF-EMF exposure conditions or under the sham condition. Thus, three different sham data sets per individual could be considered for the present analyses. A graphical illustration of the protocol is shown in Figure 1. More details on the study procedures can be found elsewhere.6,7
 |
Figure 1 Illustration of the study procedures. The figure shows example visit schedules obtained from studies 1 and 2 (top row) and from study 3 (bottom row), after the three exposure conditions were randomly assigned to the nine EN. Randomization of exposure conditions was performed at the level of experimental night triplets (blocks) with the restriction that each exposure condition could occur only once per block. Participants went to bed at their habitual bedtimes on both the AN/SN and the EN [in the present examples, a lights-off time of 10:00 p.m. for an older individual (studies 1 and 2) and 11:00 p.m. for a younger study participant (study 3) was chosen] and slept for 7.5 h (studies 1 and 2) or 8 h (study 3), respectively. When scheduling the visits, it was further attempted to keep the day of the week as constant as possible for each individual. |
Polysomnographic Recordings
While a cardiorespiratory PSG according to the standard of the American Academy of Sleep Medicine (AASM) introduced by Iber et al33 was performed on the first night, only those signals necessary for the assignment of sleep stages were recorded during the experimental nights, ie, also during the sham nights considered here. For EEG recordings, electrode sites on the participant’s head were prepared using cotton swabs and abrasive peel gel. Cup electrodes were fixed to the head using gaze pads soaked with collodion. Face and body electrodes were fixed using adhesive tape. Electrodes were filled with a conducting gel. Biosignal electrode impedances were kept below 10 kΩ. In the study in young men (study 3) gold-plated electrodes were used, while for the studies in elderly women and men (studies 1 and 2), Ag/AgCl coated electrodes were applied. The different low-frequency impedances resulting from different electrode materials can be neglected as they are still small compared to the high input impedances of EEG recorders used. EEG signals were assessed from the standard 19 locations Fp1, Fp2, F7, F3, Fz, F4, F8, T3, C3, Cz, C4, T4, T5, P3, Pz, P4, T6, O1, O2 and the mastoid positions A1 and A2 according to the 10–20 System.34 Physical reference for the recording was Cz in study 3 and the internally generated mean of C3 and C4 in studies 1 and 2, respectively. Two EOG signals were recorded from locations according to the AASM standard.33 Bipolar mental and submental EMG were also recorded.
A Varioport-based system (Becker Meditec, Karlsruhe, Germany) was used in study 3, whereas a Nihon Kohden/Polysmith EEG2100 system (Nihon Kohden, Tokyo) was used for recordings in studies 1 and 2. In all three studies, the EEG sampling rate was 200 Hz. The frequency response for biosignals was linear up to 70 Hz. For lower frequencies, the effective high pass was 1st order at a time constant of several seconds for studies 1 and 2, hence having a neglectable effect on any biosignal analyzed. As the recorder used in study 3 had a hardware high pass of a shorter time constant, this was compensated numerically in the preprocessing of the data to reach similar properties as in the other two studies.
Sleep scoring, ie, the assignment of sleep stages to epochs of 30 s each, was needed for the artifact management in the spectral analysis. A validated and FDA approved computer‐assisted algorithm (Somnolyzer 24×7) as described in Anderer et al35,36 was used for sleep scoring. This greatly reduces interrater variability.36 Scoring was done according to the AASM standard.33
EEG Spectral Analysis
The idea of spectral analysis arises from the observation that processes in different frequency ranges are found in EEG signals. Spectra are based on a decomposition of signals into components of different frequencies. By averaging spectra over time and/or in the frequency domain (eg, over frequency ranges), a data reduction is achieved while presenting an alternative view onto the data. Signal properties corresponding to the strengths of processes in different frequency ranges of the EEG become easily accessible. Spectral analysis of the EEG usually uses power values (hence power spectra), ie, signal strength metrics that are proportional to the squared amplitude. These are best suited for averaging signals of technically random character. For harmonic (sinusoidal) signals of different frequencies, a linear superposition of the signals themselves results in the power values adding up. And the average amplitude over time is the square root of the mean of the squared amplitude. Power spectral values are preferably provided as power spectral densities, ie, power content per frequency width, expressed, for instance, in (µV)2/Hz. These remain comparably independent from the resolution of spectra. For fixed frequency ranges, the power for the respective frequency band is given (mean power spectral densities are useable as well). Practically, spectra are calculated using a discrete Fourier transform; the respective algorithms are called FFT (fast Fourier transform). The transform delivers a spectrum for a fixed segment of time, and this spectrum describes a process that would be the infinite repetition of that segment of time. This repetition is only a limited approximation of the real EEG of the segment, especially for the beginning and the end of the segment, where the repetition creates discontinuity. To overcome this, the segments are multiplied by taper functions that softly attenuate the beginning and the end of the segments before the transform is done. Spectra of segments are averaged then. An overlap of the segments helps to equally weigh the signal over time despite of the taper. The power reduction caused by the taper can be corrected for to yield power values corresponding to the real EEG amplitudes. The correction depends on the signal characteristics, EEG can be treated like a random signal, here.
Power spectra were calculated for each 30-second PSG epoch. Within epochs, Welch’s method37 was used: Overlapping segments of 4 s each were cut from the epoch (overlap was 2 s), resulting in 14 segments. After applying a von-Hann taper to the segments, power spectra of the segments were calculated, power corrected and averaged. Artifact exclusion was performed at the level of segments. Two criteria were used: An amplitude criterion (A) and an upper frequency range power limit (B).
(A) The difference of the absolute maximum and the absolute minimum of the signal in the segment was calculated. This was done on the original signal before tapering. If the difference exceeded a specific limit (see below), the segment was excluded. A limit had to be set in order not to exclude segments due to strong delta waves or K-complexes while maintaining sensitivity against artifacts. Empirically a value of 300 µV (peak-to-peak) was selected. For sleep stages free of delta waves and K-complexes a higher sensitivity of the artifact detection was desirable. So after several tests, a second threshold of 150 µV was introduced and the hypnograms were included into the artifact exclusion mechanism to select the threshold depending from the sleep stage: 300 µV for stages N2 and N3 and 150 µV for stages N1, REM, and Wake. Disturbances outside of the EEG frequency range would shift the sensitivity as the maximum amplitudes of biosignals and disturbing signals add linearly. This would result in a systematic exclusion of higher amplitude EEG. To prevent that, a notch filter (infinite impulse response, IIR, 2nd order, Q=5) for the power grid frequency of 50 Hz was applied to all EEG data. The filter’s influence in the analyzed EEG frequency range can be neglected.
(B) Similar to an approach by Adamczyk et al,38 the spectral content in the upper frequency range (from 19.8 Hz to 45.5 Hz) of the EEG was calculated from the spectra of the segments. A mean amplitude (root of the mean square) of 5.75 µV was set as a threshold. Real EEG amplitudes for this frequency range are smaller. Segments exceeding the threshold were excluded. The criterion detects eg, muscle artifacts.
The segment length of 4 s results in a frequency resolution of 0.25 Hz. The frequency range from 0.5 Hz to 21.75 Hz was included in the analysis (86 frequency bins). Spectra of epochs were individually averaged for sleep stages. In this averaging, spectra derived from less than 10 artifact-free segments of the epoch were excluded. In addition, frequency bands were computed almost identical to the frequency range specifications defined by the AASM1: slow wave activity [0.50–2.00 Hz), delta activity [0.50–4.00 Hz), theta activity [4.00–8.00 Hz), alpha activity [8.00–13.00 Hz), broad sleep spindle or sigma activity [11.00–16.00 Hz), narrow sleep spindle or sigma activity [12.00–14.00 Hz) and beta activity [13.00–22.00 Hz). Power spectra were computed from all-night sleep EEG recordings at all 19 EEG electrode sites, each referenced to the averaged mastoid signals.
Statistical Analysis
Absolute frequency bin and band EEG power values were transformed using the natural logarithm function.39 For group-level statistics, this was done after the computation of robust means (arithmetic mean) of spectra from the three sham nights at the participant level. Pooling of the individual data was intended to reduce random variance.
To test for age or sex differences in EEG power, the threshold-free cluster-enhancement (TFCE) technique40,41 was applied. The TFCE method has been shown to be statistically integer and sensitive to several types of EEG signals.40 It is a special version of cluster-based permutation testing that aims at finding clusters of any dimensionality in the data sets by combining the information about the magnitude of an effect at a given data point with the information on its support from the neighboring data points. In order to circumvent the thresholding criticism related to classical cluster-based approaches, ie, the use of a single arbitrary threshold to define a cluster, numerous cluster-forming thresholds are considered instead. For each threshold, cluster height and cluster size are determined, and specific weights are assigned to these factors. As a consequence, the EEG signal parameters will be enhanced or weakened, resulting in a newly computed TFCE parameter. Differences in TFCE values between groups are then examined by performing permutation-based statistics together with a maximum-statistic correction method to address the multiple comparison problem. The TFCE algorithm employed in the present study is a MATLAB toolbox that is freely available on the internet.42 MATLAB version 9.70 (R2019b, The MathWorks, Inc. Natick, MA) was used to run this toolbox. The number of permutations was set to 10,000, and the default values of 0.6 and 2 were chosen for the two weighting parameters E (extent) and H (height), respectively. Coordinate information specifying the channel positions was needed to determine the degree of adjacency and thus the correlation between electrodes. For more details on this statistical procedure, see the corresponding research article by Mensen and Khatami.40
Analyses were performed separately for the non rapid eye movement (NREM) sleep stages N1, N2, N3, for NREM sleep as a whole, for REM sleep as well as for the time spent awake between lights out and lights off. To allow for comparisons between data of young and old men, the duration of sleep recordings used for analysis of the young adults was restricted to 7.5 hours. Statistical testing was first carried out for global EEG power, ie, averaged EEG power over all 19 electrodes, at the frequency bin level. To account for regional variations, testing was then expanded to every single electrode. For these electrode-wise analyses, however, differences in EEG power between groups were evaluated at the level of frequency bands. Since both sleep spindle frequency ranges and the slow wave frequency range are sub-bands sharing frequencies with other frequency bands, the frequency domain would no longer be continuous if they all had been treated as equal. Therefore, these sub-bands were analyzed separately.
For illustrative purposes, original, uncorrected t-values were first converted to p-values and then transformed by calculating the negative logarithm to the base 10. The maximum scale of the negative log values was set to 4, which corresponds to a p-value of 0.0001.
To get an idea of the magnitude of the observed effects and its associated uncertainty, Cohen’s d for independent group comparisons and the corresponding 95% confidence intervals (CI) were computed from original, uncorrected t-values. Two-sample t-tests were performed to test for differences between the samples at baseline. The latter was conducted using SAS software, version 9.4 (SAS Institute, North Carolina, USA). A p-value of less than 0.05 was considered statistically significant.
Results
Sample Characteristics at Baseline
Comparisons of baseline data between samples revealed some imbalances (Table 1), but with one exception, these could either be explained by the inclusion criteria or at least had been expected because of known age- and sex-specific differences for certain screening parameters of interest. Elderly individuals of either sex were by definition older than young men. Elderly men also differed from the other two samples with respect to the periodic limb movement arousal index (PLMAI). The PLMAI was lower compared to older women but was larger compared to young men. Sleep onset latency was slightly longer in elderly females as opposed to both male samples. The MEQ score was higher in the elderly, pointing towards a more pronounced morning type in old age, but it also varied slightly between older men and women. Sleep efficiency was largest in young men. The ESS score was also highest in young men, indicating that they felt sleepier during daytime than the participants of the older samples.
Differences in EEG Power Spectra
Age and sex differences in global spectral sleep EEG power are summarized in Figure 2A–7A for the stages NREM sleep, REM sleep, Wake, N1, N2 and N3, respectively. The corresponding regional results are shown in Figure 2B–7B. Descriptive statistics that summarize the data sets of elderly women, elderly men and young men in addition to Cohen’s d effect size estimates are presented in Supplementary Tables S3 and S4. Information about local intensity maxima within the clusters are presented in Table 2 (for continuous frequency bands) and in Supplementary Table S5 (for the three frequency sub-bands).
 |
Table 2 Local Intensity Maxima of the Identified Clusters Within the Continuous Frequency Bands by Sleep Stage Separately for Sex and Age |
 |
Figure 2 Age and sex effects on global (A) and regional (B) sleep EEG power recorded during NREM sleep. The top graph of (a) displays all-night log-transformed power spectral densities averaged across all 19 electrodes for elderly women, elderly men, and young men. The middle and bottom graphs of (A) show transformed p-values resulting from the comparisons of global sleep EEG power between elderly women and men, and from the comparisons of global sleep EEG power between young and elderly men, respectively. Black lines represent the transformed significance threshold of p = 0.05. Shaded areas under the curve indicate statistical significance of the original, uncorrected test statistic. The areas marked with diagonal lines highlight the differences that remained statistically significant after multiple comparison correction (MCC), based on the threshold-free cluster enhanced (TFCE) statistic. For the sake of clarity, frequency bands are depicted below the abscissa. Top row of (B) shows topoplots of statistically significant differences between sleep EEG power values of elderly women and men for all frequency bands of interest. Colored markings point to a statistical significance of the original, uncorrected test statistic; an additional black border indicates a significant difference after MCC based on the TFCE statistic. Corresponding topographical differences between sleep EEG power values of young end elderly men are displayed at the bottom row of (B). Red, blue, and green markings highlight higher sleep EEG power values in elderly women, elderly men, and young men, respectively. Ranges of the frequency bands are given as half-closed intervals, ie the interval contains one endpoint (squared bracket) but not the other (round bracket). |
EEG Power Spectra Variations with Sex
For NREM sleep (Figure 2A), TFCE analysis revealed sex-dependent global EEG power variations with higher values in elderly women than in elderly men, driven by two clusters of connected frequency bins. The first cluster included frequency bins within the delta and lower theta frequency ranges. The other cluster stretched from higher alpha to beta frequency ranges. When the topography was taken into account, these two clusters were found to be connected. The cluster spanned over almost all locations for the delta and beta frequency ranges, whereas the differences in the EEG power of the theta and alpha frequency bands were restricted to central and posterior regions. EEG power of the slow wave and the two sigma frequency bands differed at (almost) all electrode positions (Figure 2B; Table 2 and Supplementary Table S5).
The global spectral power of the EEG during REM sleep showed less sex differences than the EEG recorded during NREM sleep (Figure 3A). Overall, however, a similar pattern of affected frequency ranges emerged. The TFCE approach yielded two separate significant clusters of larger EEG power values in older women than in older men, which encompassed parts of the delta frequency band and the entire beta frequency range, respectively (Figure 3A). At the electrode level, this cluster was merged and was reflected by significant differences at all electrodes for the beta frequency range, significant differences at less electrodes for the delta frequency range and significant differences at only the most posterior electrodes for the theta and alpha frequency bands. The three sub-bands also showed variations with sex, but at fewer electrode positions than the frequency bands to which they (partially) pertain (Figure 3B; Table 2 and Supplementary Table S5).
 |
Figure 3 Age and sex effects on global (A) and regional (B) sleep EEG power recorded during stage REM sleep. For a detailed figure description, see the caption of Figure 2. |
The sex-dependent global EEG power spectral value differences for the time spent awake in bed between lights out and lights on were less pronounced than during sleep (Figure 4A). The TFCE method showed statistically significant differences restricted to a cluster observed for the higher frequencies of the beta band. A closer look at the regional distribution revealed that this cluster comprised electrodes located in parietal and occipital regions only. The same applied to the two sigma frequency bands (Figure 4B; Table 2 and Supplementary Table S5).
 |
Figure 4 Age and sex effects on global (A) and regional (B) sleep EEG power recorded during the time spent awake between lights out and lights off. For a detailed figure description, see the caption of Figure 2. |
When NREM sleep stages were considered separately, sleep stage N2 was the one with the most pronounced sex differences in global EEG power (Figure 6A). Even after correction for multiple comparisons, a significant cluster of higher EEG power in elderly women compared to older men was observed encompassing all frequency bins. Results for global EEG power during sleep stage N3 essentially reflects those observed for sleep stage N2. Since the lower alpha frequency range was omitted, two separate significant clusters were identified (Figure 7A). The pattern of global EEG power values significantly affected by sex during sleep stage N1 resembled that of sleep stage REM; the analysis revealed a significant cluster encompassing the entire beta and a second cluster that included parts of the delta frequency band (Figure 5A). At the regional level, the number of electrodes contributing to the significant clusters increased with sleep depth. The differences between sleep stages N1 to N3 were most pronounced for the theta frequency band. While significant sex differences were found only at the most posterior channels in sleep stage N1, this effect spread over the entire cortex during sleep stage N3. A similar propagation of effects was observed from sleep stage N1 to N2 for the alpha frequency band, but cluster expansion in anterior direction did not cover the frontal regions of the cortex. In sleep stage N3, however, the effect on the EEG power in the alpha frequency range was again less widespread. The significant topographical cluster detected during sleep stage N1 comprised also several electrode locations showing sex differences in EEG delta power. This effect remained quite stable during sleep stage N2 but extended to the entire cortex during deep sleep. Regardless of NREM sleep stage, all electrodes contributed to the sex differences observed in the beta frequency range (Figure 5B–7B). The widespread significant clusters found for both sigma frequency ranges differed with respect to frontal electrodes between the three NREM sleep stages, but in any case, frontal sites were included during sleep stage N2. For the slow wave frequency range, the cluster increased considerably in size from sleep stage N1 and N2 to N3 (Figure 5B–7B; Table 2 and Supplementary Table S5).
 |
Figure 5 Age and sex effects on global (A) and regional (B) sleep EEG power recorded during stage N1 sleep. For a detailed figure description, see the caption of Figure 2. |
In general, sex effects were of such magnitude that the overall outcome before and after multiple comparison correction (MCC) was virtually the same for all sleep stages. The only exception was stage wake, which showed some test statistics related to global and regional sleep EEG power that did not survive the MCC, especially in the delta and sigma band frequencies (Figure 4A and B).
EEG Power Spectra Variations with Age
TFCE permutation analysis revealed significant differences in global EEG power for NREM sleep between young and elderly men (Figure 2A). Two different clusters could be identified. The first cluster encompassed several affected frequency bins in the delta and the lower part of the theta frequency range. Furthermore, statistically significant age differences were observed for frequency bins, which fall into both sigma frequency ranges. Visual inspection of the results of the analysis by frequency bands and region demonstrated that the statistically significant higher spectral power in young men in the lower frequency bands was present at almost all electrodes. Significant EEG power differences in the alpha frequency range showed a midline-parietal, occipital distribution. Although the affected frequency bins at the global level were restricted to the lower frequency range of the beta band, significant EEG power differences for the entire frequency range were again observed for almost all channels. TFCE corrected age differences in the slow wave as well as in the two sigma frequency ranges were statistically significant at all electrodes (Figure 2B; Table 2 and Supplementary Table S5).
Statistically significant age differences in the global spectral power of the REM sleep EEG were restricted to delta (including slow wave) and lower theta frequencies following TFCE analysis (Figure 3A). Younger men have higher values than older men. This is also reflected by results at the regional level. The significant cluster encompassed all electrodes in the delta frequency range, a reduced number of electrodes in the theta frequency range (some frontal and temporal electrodes did not contribute anymore) and only occipital electrodes in the alpha frequency range. For the beta frequency range, the cluster included also electrodes located over the right temporal lobe. All variations in the spindle frequency ranges were not statistically significant. Statistically significant differences in the slow wave frequency band, however, spanned again over the entire cortex (Figure 3B; Table 2 and Supplementary Table S5).
For the time spent awake during time in bed, the pattern of age-dependent differences in global EEG power is very similar to the one observed during REM (Figure 4A). The same was true for the regional results. The main difference to the results of the REM sleep was that the spectral power of alpha and theta during wake did not at all vary with age, thus the topographical TFCE analysis identified two distinct clusters for the time spent awake. Variations in the spindle frequency ranges were only statistically significant at most posterior electrode locations (Figure 4B; Table 2 and Supplementary Table S5).
When NREM sleep stages are considered separately, age differences in the global spectral power during stage N3 are consistently much higher in young men as compared to older men except for the frequencies in the alpha range (Figure 7A). At the regional level, this is reflected by a wide-spread cluster of statistically significant effects omitting only frontal areas in the alpha frequency range (Figure 7B; Table 2). The pattern of age-dependent differences in global EEG power during sleep stage N2 also exhibited two different clusters, but the one observed at higher frequencies was restricted to the sleep spindle frequency ranges (Figure 6A). Regional EEG power during sleep stage N2 resembled that observed during NREM sleep (Figure 6B; Table 2). Likewise, the significant clusters identified for the global and regional EEG power differences between young and older men during sleep stage N1 and stage Wake were also pretty much the same. However, in sleep stage N1, TFCE analysis also detected another small cluster in the alpha frequency range, indicating an increased alpha power in older men compared to young men (Figure 5A+B; Table 2). Statistically significant clusters could also be identified for all three sub-bands during sleep stages N1, N2 and N3 (Figure 5B–7B; Table 2 and Supplementary Table S5).
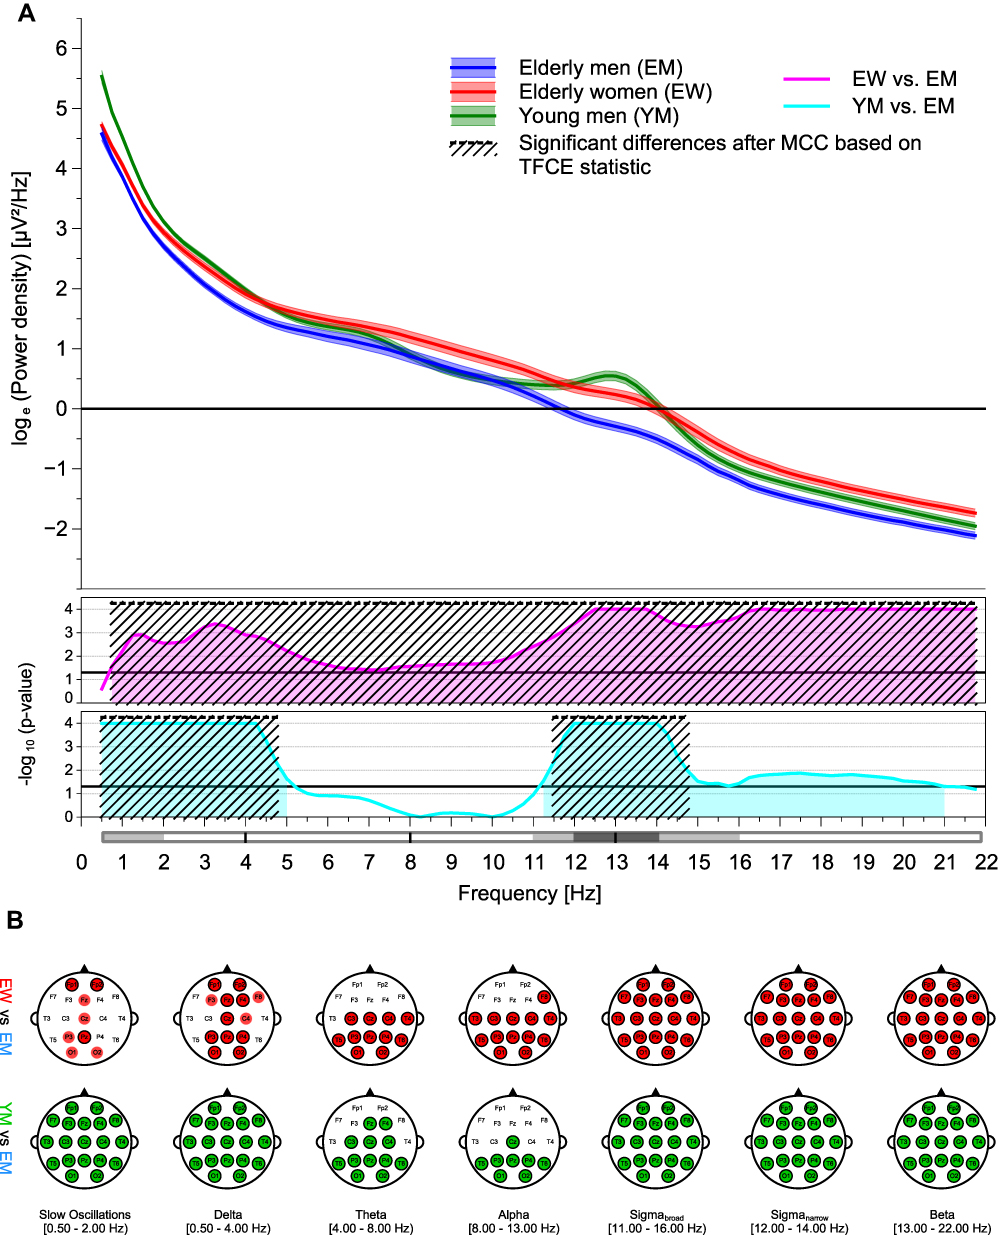 |
Figure 6 Age and sex effects on global (A) and regional (B) sleep EEG power recorded during stage N2 sleep. For a detailed figure description, see the caption of Figure 2. |
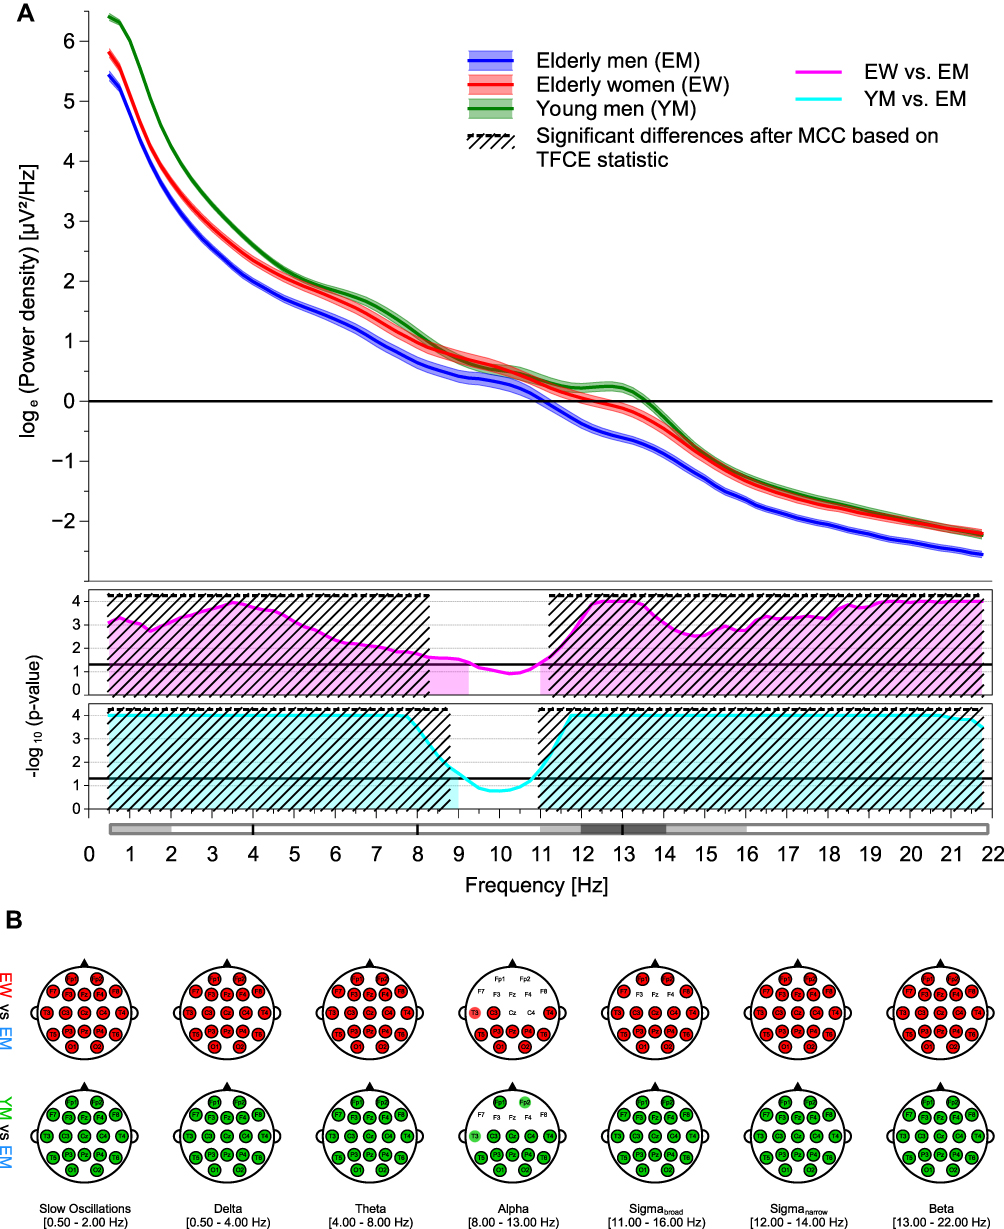 |
Figure 7 Age and sex effects on global (A) and regional (B) sleep EEG power recorded during stage N3 sleep. For a detailed figure description, see the caption of Figure 2. |
In contrast to the sex-specific effects, MCC had a greater impact on age-related outcomes. This was particularly evident for the increased alpha sleep EEG power observed in the old men during sleep stage N1, which originally extended across several electrodes of the frontal and central cortex but appeared to be too weak in total that only a few effects survived the correction (Figure 5A and B).
Discussion
The present results stressed the importance of the factors age and sex with respect to brain activities measured during sleep. Aging was dominated by a decline in EEG power. Differences between young and older men have been found to be most pronounced for lower frequencies and for the sleep spindle frequency range. In old age, females had an overall larger sleep EEG power than males. Strong effects covering a wide range of the frequency spectra were observed for sleep stages N2 and N3 as well as for the NREM sleep.
The more pronounced sleepiness in the sample of young men assessed by the ESS might indicate that young men show a high sleepability without sleepiness, which according to Harrison and Horne43 might reflect the ability to relax and to switch off very efficiently. The observed differences in MEQ scores indicate that preferences for the timing of sleep, which are reflected in the chronotype, change slightly with age and are slightly different between men and women. With increasing age, sleep timing changes towards earlier times.44,45 Randler and Engelke46 reported that sex differences in chronotype decline with increasing age, yet older women were less morning oriented than older men. The increase of the PLMAI with increasing age in the present study agrees with results from healthy subjects described by Frauscher et al.47 While these authors47 did not observe sex differences in a sample of one hundred 19–77-years-old subjects, a significantly higher PLMAI could be found in elderly women as compared to elderly men in the present samples.
Previous studies evaluating spectral characteristics of the sleep EEG in healthy samples consistently identified age and/or sex as sources of variation.3,22–26 The literature pertaining to sex effects provides strong evidence that, irrespective of age, females have overall higher sleep EEG power values than males.3,22,23,26 In general, the present results regarding an overall larger sleep EEG power in women are in line with those observed in these earlier studies, even though some outcomes at the frequency bin and/or band level differ slightly between investigations. Hertenstein et al3 reported that sex was a significant factor in all but one of the considered frequency bands (gamma during stage REM sleep). Carrier et al22 observed a higher spectral power density in women in delta, theta, low alpha and high sleep spindle frequency bins of NREM sleep. In the study by Svetnik et al,26 EEG power was significantly increased in female good sleepers compared to male good sleepers at all ages and for all frequency bands under investigation. The sex-related differences in NREM and REM sleep EEG power observed by Dijk et al23 deviated most from the present results. However, this discrepancy might be explained by the large age differences between the two groups of study participants.
Aging has been found to affect low- and high-frequency sleep EEG power differently.3,22,24–26 Age-related changes in sleep EEG power towards a lighter sleep with increasing age were observed by Hertenstein et al,3 showing an increased EEG power for sigma and beta frequency ranges during stage REM as well as a decline in EEG power for the slow delta and slow sigma frequency bands during stage N2 sleep. Carrier et al22 reported an association of increasing age with an increased sleep EEG power in the beta frequency range but also with a reduction in slow-wave, theta and sigma activity. Svetnik et al26 reported that the absolute power in the delta, theta and sigma frequency range during NREM sleep declines with increasing age in good sleepers of either sex. Sprecher et al25 found that sleep EEG power in the slow wave and low theta frequency ranges during NREM sleep was significantly lower in older age groups compared to younger age groups, whereas it was the opposite for the EEG power in the gamma frequency band. Schwarz et al24 observed age-related reductions in delta (stage N3 and NREM sleep) and sigma (NREM sleep) EEG power. While the age effects observed in the present study regarding a reduced power in the lower EEG power spectrum as well as in the spindle frequency range in older males agree well with the literature, some inconsistencies exist for the impact of age on the power in the higher frequency ranges.
Following Carrier et al,22 the findings regarding a decrease of sleep EEG power in lower frequency ranges (slow oscillatory and delta activities) with increasing age may be interpreted as a less pronounced homeostatic sleep drive in the elderly. The homeostatic sleep drive reflects the sleep pressure that has built up as consequence of continuous wakefulness.48 At present, however, it is assumed that the homeostatic sleep drive is not lower, but rather that its sensitivity is decreased because of a widespread decline in adenosine receptors in the aged brain.49
Given that sigma band activity includes sleep spindle quantity18 which has been shown to decline with advancing age,50 the diminished EEG power peaks in the sigma frequency range of elderly men and women (Figure 6A) seem to reflect this reduced sleep spindle activity. Moreover, as sleep spindles are further assumed to be one of the key actors in sleep-dependent memory consolidation,51 an attenuated sigma band activity might also be related to an impaired memory consolidation process in old age. Unfortunately, as the present study assessed neither discrete sleep spindles nor memory performances, it was not possible to prove these potential relationships.
Apart from such functional attributions, differences in EEG activities may also be anatomical. Amongst others, properties of the tissue structures involved in volume conduction, most importantly the cranial bone,52 determine the electrical potential differences measured at the surface. Variations of these properties with age and/or sex could therefore account for the differences in EEG power between young and old men as well as between elderly men and women. For example, Dijk et al23 considered differences in skull thickness as a likely reason for the overall greater sleep EEG power in young women compared to young men. The human skull is a three-layered bone with a cancellous, fluid filled layer in the middle (diploe) flanked by two layers of compact bone. Tang et al53 were able to show that the resistivity and the thickness of the skull depend on the concrete bone composition, with a better conductivity in bone specimens showing a higher diploic layer component percentage. A recent study evaluated changes in thickness of compact cranial bone layers with age and sex at homologous locations by means of 123 high-resolution clinical computed tomography scans obtained from participants aged between 20 and 99 years.54 These authors found in both sexes a trend towards an increase in average full skull thickness across age, but only in females a statistically significant age-related thinning of the two compact bone layers; the corollary is a thickening of the diploic layer in females during the lifespan, while it remains almost stable in males at all ages. These anatomical differences might have affected the conductive properties of this particular tissue and thus the brain activities collected from the surface. On the other hand, Hagemann et al,55 who examined the relationship between skull thickness and magnitude of EEG alpha activity in a resting situation, observed only a few modest associations between these two variables, leading the authors to conclude that other sources of variation than skull thickness seem to contribute more to the variance of surface EEG. Tan et al56,57 even argued against skull impedance as a potential cause for age-related sleep EEG power variations, because they found that wave incidence is as reliable as wave amplitude if period amplitude analysis is performed.
Another anatomical aspect that could have contributed to the differences in sleep EEG power is cortical thinning, a well-known phenomenon that proceeds during adulthood but appears to vary in its extent between the sexes.58 With regard to the brain activities during sleep, cortical thinning might be responsible for the decline of sleep slow waves throughout aging.59 Since the impedances of skull and skin structures are constant over the EEG frequency range, the influence of anatomy only leads to a constant factor for the power values of all frequencies (for a given location). Therefore, to minimize the influence of anatomical alterations of the brain and skull, normalized brain activity measures such as relative spectral sleep EEG power can be used instead.60 This, on the other hand, increases the dependency in the data.
Since different equipment was used to record the EEG in the studies of young and older men, it could be suspected that the observed differences in sleep EEG power between these two samples could also be due to technical reasons. However, the calibration (representation of EEG amplitudes) of all equipment was checked using external signals and, as already mentioned in the methods section, EEG data of the young and elderly men were harmonized during preprocessing to allow for outcome comparisons. To test the effectiveness of the adjustment measures, data from the present younger sample were contrasted to other data from young male individuals that were collected with the same EEG recording system as in the study on elderly men. Figure S1 demonstrates that these two spectra of young men match very well, therefore technical reasons can most likely be ruled out.
Given the sex and age-related differences in EEG power, approaches to investigate the effect of any intervention on the quantitative sleep EEG should always take these two factors into account. This can be done eg, by stratified analyses, which, however, reduce sample size and thus statistical power, or by eliminating the factors sex and/or age from analyses using standardized values such as z-scores.
A strength of the present study is that the reported values are based on three nights per participant, offering the possibility to calculate robust statistics in order to minimize random variance in group analyses. The present analysis is limited by the lack of any data from young women; therefore, it was unable to determine how aging affects sleep EEG power in females. However, ovarian hormones are known to have a significant effect on female sleep during the reproductive years,61 implying that it is critical to control for the phase of menstrual cycle whenever the sleep of younger women is the outcome of interest. If this aspect were to be taken into account, it would be a logistical challenge to collect data from young women in the same way as it has been done for the other three samples.
Conclusion
A key problem with much of the literature regarding age and sex differences in sleep EEG power is that senior adults are mostly underrepresented. The present work was set out to fill this gap. These findings will prove useful in expanding our understanding of sleep in the elderly and in determining when changes in quantitative sleep EEG variables appear to deviate from the “normal” aging process. They further provide important additional insight into the brain processes during sleep and will therefore not only contribute to a better understanding of certain sleep disorders but may also be helpful in finding any particular sleep EEG patterns that may serve as disease-specific biomarkers. The study confirmed earlier results regarding age and sex differences in nocturnal EEG activities. Aging, as assessed by differences between young and elderly men, was predominantly associated with a decrease in sleep EEG power values, while females showed an overall larger sleep EEG power than males. The present study is limited by the lack of information on young women; therefore, it is unfortunately not possible to make predictions about age-related changes in sleep EEG performance in women based on the available data. A further study that collects this outstanding information could compensate for this deficiency.
Acknowledgments
The authors gratefully acknowledge the voluntary engagement of the study participants in data collection, which is fundamental to any scientific work in humans. We acknowledge support from the German Research Foundation (DFG) and the Open Access Publication Fund of Charité - Universitätsmedizin Berlin.
Author Contributions
All authors made a significant contribution to the work reported, whether that is in the conception, study design, execution, acquisition of data, analysis and interpretation, or in all these areas; took part in drafting, revising or critically reviewing the article; gave final approval of the version to be published; have agreed on the journal to which the article has been submitted; and agree to be accountable for all aspects of the work.
Funding
The TETRA study on young males was sponsored by the Federal Agency for Public Safety Digital Radio (BDBOS; Project number: FM 8846), while funding for the two studies in the elderly was provided by the Federal Office for Radiation Protection (BfS; Project numbers: 3614S30012 and 3616S82430). The Sponsors (BDBOS and BFS) did not exert any influence on the study design, data analysis or on the manuscript. The manuscript reflects the opinion of the authors only.
Disclosure
The authors declare neither financial nor non-financial competing interests.
References
1. Berry RB, Quan SF, Abreu AR, et al. The AASM Manual for the Scoring of Sleep and Associated Events: Rules, Terminology and Technical Specifications, Version 2.6. American Academy of Sleep Medicine, Darien, IL; 2020.
2. Danker-Hopfe H, Schäfer M, Dorn H, et al. Percentile reference charts for selected sleep parameters for 20- to 80-Year-Old healthy subjects from the SIESTA database. Somnologie. 2005;9(1):3–14. doi:10.1111/j.1439-054X.2004.00038.x
3. Hertenstein E, Gabryelska A, Spiegelhalder K, et al. Reference Data for Polysomnography-Measured and Subjective Sleep in Healthy Adults. J Clin Sleep Med. 2018;14(4):523–532. doi:10.5664/jcsm.7036
4. Mitterling T, Hogl B, Schonwald SV, et al. Sleep and Respiration in 100 Healthy Caucasian Sleepers–A Polysomnographic Study According to American Academy of Sleep Medicine Standards. Sleep. 2015;38(6):867–875. doi:10.5665/sleep.4730
5. Yetton BD, McDevitt EA, Cellini N, Shelton C, Mednick SC. Quantifying sleep architecture dynamics and individual differences using big data and Bayesian networks. PLoS One. 2018;13(4):e0194604. doi:10.1371/journal.pone.0194604
6. Danker-Hopfe H, Dorn H, Sauter C, Schmid G, Eggert T. An experimental study on effects of radiofrequency electromagnetic fields on sleep in healthy elderly males and females: gender matters! Environ Res. 2020;183:109181. doi:10.1016/j.envres.2020.109181
7. Eggert T, Dorn H, Sauter C, Schmid G, Danker-Hopfe H. RF-EMF exposure effects on sleep - Age doesn’t matter in men! Environ Res. 2020;191:110173. doi:10.1016/j.envres.2020.110173
8. Puligheddu M, de Munck JC, Stam CJ, et al. Age distribution of MEG spontaneous theta activity in healthy subjects. Brain Topogr. 2005;17(3):165–175. doi:10.1007/s10548-005-4449-2
9. van Albada SJ, Kerr CC, Chiang AK, Rennie CJ, Robinson PA. Neurophysiological changes with age probed by inverse modeling of EEG spectra. Clin Neurophysiol. 2010;121(1):21–38. doi:10.1016/j.clinph.2009.09.021
10. Jobert M, Wilson FJ, Roth T, et al. Guidelines for the recording and evaluation of pharmaco-sleep studies in man: the International Pharmaco-EEG Society (IPEG). Neuropsychobiology. 2013;67(3):127–167. doi:10.1159/000343449
11. Sun H, Paixao L, Oliva JT, et al. Brain age from the electroencephalogram of sleep. Neurobiol Aging. 2019;74:112–120. doi:10.1016/j.neurobiolaging.2018.10.016
12. Ye E, Sun H, Leone MJ, et al. Association of Sleep Electroencephalography-Based Brain Age Index With Dementia. JAMA Netw Open. 2020;3(9):e2017357. doi:10.1001/jamanetworkopen.2020.17357
13. Zhao W, Van Someren EJW, Li C, et al. EEG spectral analysis in insomnia disorder: a systematic review and meta-analysis. Sleep Med Rev. 2021;59:101457. doi:10.1016/j.smrv.2021.101457
14. Marzano C, Ferrara M, Moroni F, De Gennaro L. Electroencephalographic sleep inertia of the awakening brain. Neuroscience. 2011;176:308–317. doi:10.1016/j.neuroscience.2010.12.014
15. Akerstedt T, Gillberg M. Sleep duration and the power spectral density of the EEG. Electroencephalogr Clin Neurophysiol. 1986;64(2):119–122. doi:10.1016/0013-4694(86)90106-9
16. Borbely AA, Baumann F, Brandeis D, Strauch I, Lehmann D. Sleep deprivation: effect on sleep stages and EEG power density in man. Electroencephalogr Clin Neurophysiol. 1981;51(5):483–495. doi:10.1016/0013-4694(81)90225-X
17. Dijk DJ, Brunner DP, Beersma DG, Borbely AA. Electroencephalogram power density and slow wave sleep as a function of prior waking and circadian phase. Sleep. 1990;13(5):430–440. doi:10.1093/sleep/13.5.430
18. Fernandez LMJ, Luthi A. Sleep Spindles: mechanisms and Functions. Physiol Rev. 2020;100(2):805–868. doi:10.1152/physrev.00042.2018
19. ICNIRP (International Commission on Non-Ionizing Radiation Protection). Guidelines for Limiting Exposure to Electromagnetic Fields (100 kHz to 300 GHz). Health Phys. 2020;118(5):483–524. doi:10.1097/HP.0000000000001210
20. Chen W, Black J. Chapter 10 Quantitative analysis of the sleep electroencephalogram. In: Guilleminault C, editor. Handbook of Clinical Neurophysiology. Vol. 6. Elsevier; 2005:103–124.
21. D’Rozario AL, Cross NE, Vakulin A, et al. Quantitative electroencephalogram measures in adult obstructive sleep apnea - Potential biomarkers of neurobehavioural functioning. Sleep Med Rev. 2017;36:29–42. doi:10.1016/j.smrv.2016.10.003
22. Carrier J, Land S, Buysse DJ, Kupfer DJ, Monk TH. The effects of age and gender on sleep EEG power spectral density in the middle years of life (ages 20–60 years old). Psychophysiology. 2001;38(2):232–242. doi:10.1111/1469-8986.3820232
23. Dijk DJ, Beersma DG, Bloem GM. Sex differences in the sleep EEG of young adults: visual scoring and spectral analysis. Sleep. 1989;12(6):500–507. doi:10.1093/sleep/12.6.500
24. Schwarz JFA, Akerstedt T, Lindberg E, Gruber G, Fischer H, Theorell-Haglow J. Age affects sleep microstructure more than sleep macrostructure. J Sleep Res. 2017;26(3):277–287. doi:10.1111/jsr.12478
25. Sprecher KE, Riedner BA, Smith RF, Tononi G, Davidson RJ, Benca RM. High Resolution Topography of Age-Related Changes in Non-Rapid Eye Movement Sleep Electroencephalography. PLoS One. 2016;11(2):e0149770. doi:10.1371/journal.pone.0149770
26. Svetnik V, Snyder ES, Ma J, Tao P, Lines C, Herring WJ. EEG spectral analysis of NREM sleep in a large sample of patients with insomnia and good sleepers: effects of age, sex and part of the night. J Sleep Res. 2017;26(1):92–104. doi:10.1111/jsr.12448
27. Buysse DJ, Reynolds CF, Monk TH, Berman SR, Kupfer DJ. The Pittsburgh Sleep Quality Index: a new instrument for psychiatric practice and research. Psychiatry Res. 1989;28(2):193–213. doi:10.1016/0165-1781(89)90047-4
28. Johns MW. A new method for measuring daytime sleepiness: the Epworth sleepiness scale. Sleep. 1991;14(6):540–545. doi:10.1093/sleep/14.6.540
29. Horne JA, Ostberg O. A self-assessment questionnaire to determine morningness-eveningness in human circadian rhythms. Int J Chronobiol. 1976;4(2):97–110.
30. Hoffmann RM, Müller T, Hajak G, Cassel W. Arbeitsgruppe Diagnostik der Deutschen Gesellschaft für Schlafforschung und Schlafmedizin DGSM. Abend-Morgenprotokolle in Schlafforschung und Schlafmedizin—Ein Standardinstrument für den deutschsprachigen Raum. Somnologie. 1997;1(3):103–109. doi:10.1007/s11818-997-0019-z
31. Zung WW. A Self-Rating Depression Scale. Arch Gen Psychiatry. 1965;12:63–70. doi:10.1001/archpsyc.1965.01720310065008
32. Zung WW. A rating instrument for anxiety disorders. Psychosomatics. 1971;12(6):371–379. doi:10.1016/S0033-3182(71)71479-0
33. Iber C, Ancoli-Israel S, Chesson AL, Quan. The AASM Manual for the Scoring of Sleep and Associated Events: Rules, Terminology and Technical Specifications. American Academy of Sleep Medicine, Westchester, IL; 2007.
34. Jasper HH. Report of the committee on methods of clinical examination in electroencephalography (Appendix: the ten-twenty electrode system of the International Federation). Electroencephalogr Clin Neurophysiol. 1958;10(2):371–375. doi:10.1016/0013-4694(58)90053-1
35. Anderer P, Gruber G, Parapatics S, et al. An E-health solution for automatic sleep classification according to Rechtschaffen and Kales: validation study of the Somnolyzer 24 x 7 utilizing the Siesta database. Neuropsychobiology. 2005;51(3):115–133. doi:10.1159/000085205
36. Anderer P, Moreau A, Woertz M, et al. Computer-assisted sleep classification according to the standard of the American Academy of Sleep Medicine: validation study of the AASM version of the Somnolyzer 24 x 7. Neuropsychobiology. 2010;62(4):250–264. doi:10.1159/000320864
37. Welch PD, Direct Digital A. Method of Power Spectrum Estimation. IBM J Res Dev. 1961;5(2):141–156. doi:10.1147/rd.52.0141
38. Adamczyk M, Genzel L, Dresler M, Steiger A, Friess E. Automatic Sleep Spindle Detection and Genetic Influence Estimation Using Continuous Wavelet Transform. Front Hum Neurosci. 2015;9:624. doi:10.3389/fnhum.2015.00624
39. Gasser T, Bacher P, Mocks J. Transformations towards the normal distribution of broad band spectral parameters of the EEG. Electroencephalogr Clin Neurophysiol. 1982;53(1):119–124. doi:10.1016/0013-4694(82)90112-2
40. Mensen A, Khatami R. Advanced EEG analysis using threshold-free cluster-enhancement and non-parametric statistics. Neuroimage. 2013;67:111–118. doi:10.1016/j.neuroimage.2012.10.027
41. Smith SM, Nichols TE. Threshold-free cluster enhancement: addressing problems of smoothing, threshold dependence and localisation in cluster inference. Neuroimage. 2009;44(1):83–98. doi:10.1016/j.neuroimage.2008.03.061
42. Mensen A. Advances EEG statistics: ept_TFCE-matlab; 2015. Available from: https://github.com/Mensen/ept_TFCE-matlab.
43. Harrison Y, Horne JA. “High sleepability without sleepiness”. The ability to fall asleep rapidly without other signs of sleepiness. Neurophysiol Clin. 1996;26(1):15–20. doi:10.1016/0987-7053(96)81530-9
44. Thomas SJ, Lichstein KL, Taylor DJ, Riedel BW, Bush AJ. Epidemiology of bedtime, arising time, and time in bed: analysis of age, gender, and ethnicity. Behav Sleep Med. 2014;12(3):169–182. doi:10.1080/15402002.2013.778202
45. Didikoglu A, Maharani A, Payton A, Pendleton N, Canal MM. Longitudinal change of sleep timing: association between chronotype and longevity in older adults. Chronobiol Int. 2019;36(9):1285–1300. doi:10.1080/07420528.2019.1641111
46. Randler C, Engelke J. Gender differences in chronotype diminish with age: a meta-analysis based on morningness/chronotype questionnaires. Chronobiol Int. 2019;36(7):888–905. doi:10.1080/07420528.2019.1585867
47. Frauscher B, Gabelia D, Mitterling T, et al. Motor events during healthy sleep: a quantitative polysomnographic study. Sleep. 2014;37(4):
48. Borbely AA. A two process model of sleep regulation. Hum Neurobiol. 1982;1(3):195–204.
49. Mander BA, Winer JR, Walker MP. Sleep and Human Aging. Neuron. 2017;94(1):19–36. doi:10.1016/j.neuron.2017.02.004
50. Martin N, Lafortune M, Godbout J, et al. Topography of age-related changes in sleep spindles. Neurobiol Aging. 2013;34(2):468–476. doi:10.1016/j.neurobiolaging.2012.05.020
51. Rasch B, Born J. About sleep’s role in memory. Physiol Rev. 2013;93(2):681–766. doi:10.1152/physrev.00032.2012
52. Nunez PL, Srinivasan R. Chapter 4: electric Fields and Currents in Biological Tissue. In: Electric Fields of the Brain: The Neurophysics of EEG. Oxford: Oxford University Press; 2006.
53. Tang C, You FS, Cheng G, et al. Correlation between structure and resistivity variations of the live human skull. IEEE T Bio-Med Eng. 2008;55(9):2286–2292. doi:10.1109/TBME.2008.923919
54. Lillie EM, Urban JE, Lynch SK, Weaver AA, Stitzel JD. Evaluation of Skull Cortical Thickness Changes With Age and Sex From Computed Tomography Scans. J Bone Miner Res. 2016;31(2):299–307. doi:10.1002/jbmr.2613
55. Hagemann D, Hewig J, Walter C, Naumann E. Skull thickness and magnitude of EEG alpha activity. Clin Neurophysiol. 2008;119(6):1271–1280. doi:10.1016/j.clinph.2008.02.010
56. Tan X, Campbell IG, Feinberg I. Internight reliability and benchmark values for computer analyses of non-rapid eye movement (NREM) and REM EEG in normal young adult and elderly subjects. Clin Neurophysiol. 2001;112(8):1540–1552. doi:10.1016/S1388-2457(01)00570-3
57. Tan X, Campbell IG, Palagini L, Feinberg I. High internight reliability of computer-measured NREM delta, sigma, and beta: biological implications. Biol Psychiatry. 2000;48(10):1010–1019. doi:10.1016/S0006-3223(00)00873-8
58. Gautam P, Cherbuin N, Sachdev PS, Wen W, Anstey KJ. Sex differences in cortical thickness in middle aged and early old-aged adults: personality and Total Health Through Life study. Neuroradiology. 2013;55(6):697–707. doi:10.1007/s00234-013-1144-y
59. Dube J, Lafortune M, Bedetti C, et al. Cortical thinning explains changes in sleep slow waves during adulthood. J Neurosci. 2015;35(20):7795–7807. doi:10.1523/JNEUROSCI.3956-14.2015
60. Muehlroth BE, Werkle-Bergner M. Understanding the interplay of sleep and aging: methodological challenges. Psychophysiology. 2020;57(3):e13523. doi:10.1111/psyp.13523
61. Brown AMC, Gervais NJ. Role of Ovarian Hormones in the Modulation of Sleep in Females Across the Adult Lifespan. Endocrinology. 2020;161(9):258. doi:10.1210/endocr/bqaa128
 © 2021 The Author(s). This work is published and licensed by Dove Medical Press Limited. The
full terms of this license are available at https://www.dovepress.com/terms
and incorporate the Creative Commons Attribution
- Non Commercial (unported, 3.0) License.
By accessing the work you hereby accept the Terms. Non-commercial uses of the work are permitted
without any further permission from Dove Medical Press Limited, provided the work is properly
attributed. For permission for commercial use of this work, please see paragraphs 4.2 and 5 of our Terms.
© 2021 The Author(s). This work is published and licensed by Dove Medical Press Limited. The
full terms of this license are available at https://www.dovepress.com/terms
and incorporate the Creative Commons Attribution
- Non Commercial (unported, 3.0) License.
By accessing the work you hereby accept the Terms. Non-commercial uses of the work are permitted
without any further permission from Dove Medical Press Limited, provided the work is properly
attributed. For permission for commercial use of this work, please see paragraphs 4.2 and 5 of our Terms.