Back to Journals » OncoTargets and Therapy » Volume 7
Nickel nanoparticle-induced dose-dependent cyto-genotoxicity in human breast carcinoma MCF-7 cells
Authors Ahamed M ![]() , Alhadlaq H
, Alhadlaq H ![]()
Received 22 November 2013
Accepted for publication 21 December 2013
Published 14 February 2014 Volume 2014:7 Pages 269—280
DOI https://doi.org/10.2147/OTT.S58044
Checked for plagiarism Yes
Review by Single anonymous peer review
Peer reviewer comments 5
Maqusood Ahamed,1 Hisham A Alhadlaq1,2
1King Abdullah Institute for Nanotechnology, King Saud University, 2Department of Physics and Astronomy, College of Science, King Saud University, Riyadh, Saudi Arabia
Abstract: Despite the widespread application of nickel nanoparticles (Ni NPs) in industrial, commercial, and biomedical fields, their response to human cells has not been clearly elucidated. In the study reported here, Ni NPs with a 28 nm diameter were used to study their interaction with human breast carcinoma (MCF-7) cells. Dose-dependent decreased cell viability and damaged cell membrane integrity showed the cytotoxic potential of the Ni NPs. We further found that Ni NPs induce oxidative stress in a dose-dependent manner, as evidenced by glutathione depletion and reactive oxygen species (ROS) generation. Comet assay indicated the dose-dependent induction of DNA damage due to Ni NP exposure. The level of messenger RNA, as well as activity of caspase-3 enzyme, was higher in MCF-7 cells exposed to Ni NPs than in control cells. Moreover, we observed statistically significant correlations of ROS with cell viability (R2=0.984), DNA damage (% tail DNA) (R2=0.982), and caspase-3 enzyme activity (R2=0.991). To the best of our knowledge, this is the first study on human breast cancer cells to have shown the cyto-genotoxicity of Ni NPs, which seems to be mediated through ROS.
Keywords: cytotoxicity, genotoxicity, reactive oxygen species, glutathione, caspase-3 enzyme
Introduction
Engineered nanoparticles (NPs) possess astonishing physicochemical properties, which has led to an exponential growth in their development and production worldwide. NPs, by definition, are materials/structures that have at least one dimension in the 1–100 nm range.1,2 While many NPs are commonly used, their interactions with biological systems as well as their environmental and human health effects have not been fully explored.3,4 There is concern that research on the possible health risks of NP exposure is not keeping pace with the number of products containing NPs that are entering the industry and market. The contributing factors to NP toxicity are their size chemical composition, shape, particle aging, and surface charge.5 As they are smaller than cellular organelles, they can penetrate basic biological structures, which may, in turn, disrupt the normal functioning of these structures.6 Further, the unique physico-chemical properties of an NP cannot be simply predicted from the properties of a fine particle or bulk material with the same chemical composition. This is supported by studies which have shown that NPs are more toxic than fine particles or bulk materials with the same chemical composition.7,8
Nickel (Ni) NPs have many characteristics that include a high level of surface energy, high level of magnetism, large surface area, and low melting and burning points. Therefore, Ni NPs are being widely used as catalysts, sensors, and in electronic applications.9,10 Recent studies indicate the great potential of Ni NPs in biomedical applications, including cancer diagnosis and therapy. For example, Hossain and Kleve11 showed that Ni nanowire induces ROS-mediated apoptotic cell death in human pancreatic adenocarcinoma (Panc-1) cancer cells, while Guo et al12 suggested that a combination of Ni NPs and the anticancer drug daunorubicin may have a synergistic effect on the efficient cytotoxicity in leukemia cancer cells. Further, Zhang et al13 indicated that the presence of Ni NPs could facilitate the drug accumulation of daunorubicin inside the leukemia cells. In a recent study, Chen et al14 found a synergistic effect of Ni NPs with the anticancer drug verbascoside on the induction of apoptosis in K562 cells. This in vivo study also indicates that treatment with verbascoside-Ni effectively inhibited tumor growth in mice.
However, researchers have also suggested Ni to be a potent human carcinogen with low mutational activity.5 Pietruska et al15 showed that Ni NPs cause a rapid and prolonged activation of the hypoxia-inducible factor 1-alpha pathway, which is responsible for tumor growth, in human lung cancer cells. Zhao et al16 observed that Ni NPs induced toxicity in mouse epidermal JB6 cells, while Ispas et al17 investigated the effect of different size (30, 60 & 100 nm) of Ni NPs as well as aggregated particle clusters of 60 nm having dendritic structures on mortality and developmental defects in Zebrafish embryos. Ni NPs toxicity was compared to soluble nickel (Ni2+). All three (30, 60 & 100 nm) of Ni NPs were equal to or less toxic than Ni2+ while dendritic clusters (60 nm) were more toxic. Although the potential benefits of Ni NPs are considerable, there is a distinct need to identify any potential hazards associated with Ni NPs. Our knowledge about the interactions between Ni NPs and living cells and the effects of these NPs on human health is still in its infancy. This study was designed to examine the cytogenotoxic effect of Ni NPs using human breast carcinoma (MCF-7) cells. To achieve this goal, we determined the cell viability, cell membrane damage, ROS generation, glutathione (GSH), mitochondrial membrane potential (MMP), DNA damage, and caspase-3 enzyme in MCF-7 cells exposed to different concentrations of Ni NPs for 24 hours. MCF-7 cells, which are derived from human breast carcinoma, have been widely used in toxicological/pharmacological studies.18–20
Materials and methods
Ni NPs and reagents
Ni NPs were synthesized through a solution reduction process using nickel chloride (NiCl2 · 6H2O) as a precursor with hydrate hydrazine solution, as described in our previous publication.21 The prepared Ni NPs were crystalline, spherical in shape with smooth surfaces, and had an average diameter of 28 nm.21
Dulbecco’s Modified Eagle’s Medium (DMEM), Hank’s Balanced Salt Solution, fetal bovine serum (FBS), penicillin-streptomycin, and trypsin were purchased from Life Technologies (Carlsbad, CA, USA), while 3-(4,5-2-yl)-2,5-diphenyltetrazoliumbromide (MTT), 2,7-dichloro-dihydro-fluorescein diacetate (DCFH-DA), and Rhodamine-123 (Rh-123) were obtained from Sigma-Aldrich (St Louis, MO, USA). Kits for caspase-3 enzyme and lactate dehydrogenase (LDH) assays were bought from BioVision Inc. (Milpitas, CA, USA). All other chemicals used were of the highest purity available from commercial sources.
Cell culture and exposure of cells to Ni NPs
MCF-7 cells were cultured in DMEM supplemented with 10% FBS and 100 U/mL penicillin-streptomycin at 5% CO2 and 37°C. At 85% confluence, cells were harvested using 0.25% trypsin and then subcultured according to the experiments. Cells were allowed to attach to the surface for 24 hours prior to NP exposure.
Ni NPs were suspended in cell-culture medium and diluted to appropriate concentrations. Dilutions of the Ni NPs were then sonicated using a sonicator bath at room temperature for 10 minutes at 40 W to avoid NP agglomeration prior to administration to the cells.
Cells not exposed to Ni NPs served as controls in each experiment.
MTT assay
MTT assay was carried out following the method as described by Mossman22 with some modifications.23 MTT assay assesses mitochondrial function by measuring ability of viable cells to reduce MTT into blue formazan product. In brief, 1 × 10⁴ cells/well were seeded in 96-well plates and exposed to different concentrations of Ni NPs (1–100 μg/mL) for 24 hours. At the end of the exposure time, culture medium was removed from each well to avoid the interference of NPs and replaced with new culture medium containing MTT solution in an amount equal to 10% of the culture volume, and incubated for 3 hours at 37°C until a purple-colored formazan product developed. The resulting formazan product was dissolved in acidified isopropanol.
Following this, each 96-well plate was centrifuged at 2,300 g for 5 minutes to settle the remaining NPs present in the solution. Then, 100 μL of supernatant was transferred to the fresh wells of new 96-well plates and absorbance was measured at 570 nm using a Synergy™ HT microplate reader (BioTek, Winooski, VT, USA).
Neutral red uptake assay
Neutral red uptake (NRU) assay was performed following the procedure described by Borenfreund and Puerner24 with some modifications.23 In brief, 1 × 10⁴ cells/well were seeded in 96-well plates and exposed to different concentrations of Ni NPs (1–100 μg/mL) for 24 hours. At the end of the exposure time, the test solution was aspirated and cells were washed with phosphate-buffered saline (PBS) twice before being incubated for 3 hours in medium supplemented with neutral red (50 μg/mL). The medium was washed off rapidly with a solution containing 0.5% formaldehyde and 1% calcium chloride. The cells were then incubated for a further 20 minutes at 37°C in a mixture of acetic acid (1%) and ethanol (50%) to extract the dye. The 96-well plates were then centrifuged at 2,300 g for 5 minutes to settle the remaining NPs present in the solution. Following this, 100 μL of the supernatant was transferred to new 96-well plates and the absorbance was measured at 540 nm using the microplate reader.
LDH assay
LDH assay was carried out using a BioVision LDH-cytotoxicity colorimetric assay kit according to the manufacturer’s protocol. In brief, 1 × 10⁴ cells/well were seeded in 96-well plates and exposed to different concentrations of Ni NPs (1–100 μg/mL) for 24 hours. After the exposure period had elapsed, each 96-well plate was centrifuged at 2,300 g for 5 minutes to settle the NPs present in the solution. Then 100 μL of the supernatant was transferred to the wells of new 96-well plates that already contained 100 μL of the reaction mixture from the BioVision kit and incubated for 30 minutes at room temperature. At the end of incubation time, the absorbance of the solution was measured at 340 nm using the microplate reader. The LDH levels in the culture medium versus those in the cells were quantified and compared with the control values according to the manufacturer of the kit’s instructions.
ROS estimation
ROS generation was measured using DCFH-DA as described by Wang and Joseph.25 ROS generation was determined by two methods – fluorometric analysis and microscopic fluorescence imaging. For the fluorometric analysis, cells (1 × 10⁴ cells/well) were seeded in a 96-well, black-bottomed culture plate and allowed to adhere for 24 hours in a CO2 incubator at 37°C. Next, the cells were exposed to different concentrations of Ni NPs (10–50 μg/mL) for 24 hours. At the end of the exposure time, the cells were washed twice with Hank’s Balanced Salt Solution (Sigma-Aldrich) before being incubated in 1 mL of working solution of DCFH-DA at 37°C for 30 minutes. Following this, the cells were lysed in alkaline solution and centrifuged at 2,300 g for 10 minutes. A 200 μL amount of the supernatant was transferred to a 96-well plate, and fluorescence was measured at 485 nm excitation and 520 nm emission using the microplate reader. The values were expressed as a percent of fluorescence intensity relative to the control wells.
A parallel set of cells (5 × 10⁴ cells/well) was analyzed for intracellular fluorescence using an Olympus CKX41 fluorescence microscope (Olympus Corporation, Tokyo, Japan), with images taken at 20× magnification.
GSH assay
For the measurement of reduced GSH, cells were cultured in a 75 cm2 culture flask and exposed to 0, 10, 25, and 50 μg/mL of Ni NPs for 24 hours. After the treatment, cell extracts were prepared from the control and treated cells as described in our previous publication.26 GSH levels in the cell extracts were determined using Ellman’s method.27 Briefly, a mixture of 0.1 mL of cell extract and 0.9 mL of 5% trichloroacetic acid was centrifuged at 2,300 g for 15 minutes at 4°C. Then 0.5 mL of the supernatant was added into 1.5 mL of 0.01% 5,5-dithio-bis-2-nitrobenzoic acid (DTNB) and the reaction was monitored at 412 nm. The amount of GSH was expressed in terms of nmol/mg protein.
MMP assay
MMP was measured following the protocol of Zhang et al28 with some modifications.29 In brief, cells (5 × 10⁴ cells/well) treated with 0, 10, 25 and 50 μg/mL of Ni NPs for 24 hours, were harvested and washed twice with PBS. Cells were further exposed with 10 μg/mL of Rh-123 fluorescent dye for 1 hour at 37°C in dark. Again, cells were washed twice with PBS then the fluorescence intensity of Rh-123 dye was measured using the Olympus CKX41 upright fluorescence microscope by capturing images at 20× magnification. A parallel set of cells (1 × 10⁴ cells/well) in a 96-well plate was analyzed for quantification of Rh-123 using the microplate reader.
Comet assay
Comet assay was performed as described by Singh et al30 with some specific modifications.31 Briefly, 70,000 cells were seeded in each well of a 12-well plate. After 24 hours of seeding, the cells were treated with different concentrations of Ni NPs (10–50 μg/mL) for 24 hours. At the end of the exposure period, the cells were trypsinized and resuspended in DMEM supplemented with 10% FBS and the cell suspension was then centrifuged at 2,300 g for 5 minutes at 4°C. Finally, the resultant cell pellet was suspended in ice-chilled PBS for comet assay.
At this point, 15 μL of the cell suspension (containing approximately 20,000 cells) was mixed with 85 μL of low-melting-point agarose (0.5%) and layered on one end of a plain frosted glass slide, pre-coated with a layer of 200 μL normal agarose (1%). Thereafter, it was covered with a third layer of 100 μL low-melting-point agarose (0.5%). After solidification of the gel, the slide was immersed in a freshly prepared lysing solution (2.5 M NaCl, 100 mM disodium ethylenediaminetetraacetic acid [Na2EDTA] and 10 mM Tris pH 10 with 10% dimethyl sulfoxide [DMSO] and 1% Triton™ X-100 [The Dow Chemical Co, Midland, MI, USA]) overnight at 4°C.
The slides were then placed in a horizontal gel electrophoresis unit. Fresh, cold alkaline electrophoresis buffer (300 mM NaOH, 1 mM Na2EDTA, and 0.2% DMSO, pH 13.5) was poured into the chamber and left for 20 minutes at 4°C for DNA unwinding and the conversion of alkali-labile sites to single-strand breaks. Electrophoresis was carried out using the same solution at 4°C for 20 minutes at 15 V. The slides were neutralized gently with 0.4 M Tris buffer at pH 7.5 and stained with 75 μL ethidium bromide (20 μg/mL). The slides were stored at 4°C in a humidified slide box until scoring.
Slides were scored at a final magnification of 400× using an image analysis system (Komet-5.0, Kinetic Imaging, Liverpool, UK) attached to a fluorescent microscope (DMLB model, Leica Microsystems GmbH, Wetzlar, Germany) equipped with appropriate filters. An undamaged cell resembles an intact nucleus without a tail and a damaged cell has the appearance of a comet. The comet parameter used to measure DNA damage in the cells was % tail DNA (fraction of DNA in the tail). Images from 50 random cells (25 from each replicate slide) were analyzed for each experiment.
Quantitative real-time polymerase chain reaction analysis of caspase-3 gene
Cells were exposed to different concentrations (10–50 μg/mL) of Ni NPs for 24 hours. At the end of the exposure time, total RNA was extracted using an RNeasy Mini Kit (Qiagen, Valencia, CA, USA) according to the manufacturer’s instructions. The concentrations of the extracted RNAs were determined using a NanoDrop 8000 Spectrophotometer (Thermo Fisher Scientific, Waltham, MA, USA) and the integrity of the RNAs was visualized on 1% agarose gel using a Universal Hood II gel documentation system (BioRad, Hercules, CA, USA). The first-strand complementary DNA was synthesized from 1 μg of total RNA by reverse transcriptase using M-MLV (Promega, Madison, WI, USA) and oligo (dT) primers (Promega) according to the manufacturer’s protocol. Quantitative real-time polymerase chain reaction (RT-PCRq) was performed using a QuantiTect SYBR Green PCR Kit (Qiagen) with an ABI Prism® 7900HT Sequence Detection System (Applied Biosystems, Foster City, CA, USA). Two microliters of template complementary DNA were added to the final volume of 20 μL of reaction mixture. The first RT-PCRq cycle was undertaken for 10 minutes at 95°C and this was followed by 40 cycles involving denaturation at 95°C for 15 seconds, annealing at 60°C for 20 seconds, and elongation at 72°C for 20 seconds. The sequence of the specific sets of primers for caspase-3 has been given in our previous publication.23 The primer sequence of the GAPDH gene was 5′F-GCTGCCTTCTCTTGTGACAAAGT-3′, 5′R-CTCAGCCTTGACTGTGCCATT-3′. The expressions of selected genes were normalized to the GAPDH gene, which was used as an internal housekeeping control. All the RT-PCRq experiments were performed in triplicate and the data expressed as the mean of at least three independent experiments.
Casapase-3 enzyme assay
The activity of the caspase-3 enzyme was measured in both treated and control cells using a Caspase-3 Colorimetric Assay Kit (BioVision). This assay is based on the principle that activated caspases in apoptotic cells cleave the synthetic substrates to release free chromophore p-nitroanilide (pNA), which is measured at 405 nm.23,32 The pNA was a by-product after specific action of caspase-3 on tertrapeptide substrates DEVD-pNA. Briefly, the reaction mixture – consisting of 50 μL of cell extract protein (50 μg) (from control and treated cells), 50 μL of 2X Reaction Buffer (BioVision Inc.; containing 10 mM dithiothreitol), and 5 μL of 4 mM DEVD-pNA substrate in a total volume of 105 μL – was incubated at 37°C for 1 hour then the absorbance of the product was measured using the microplate reader at 405 nm according to the manufacturer’s instructions.
Protein estimation
The total protein content in the cell extracts was estimated by the Bradford method33 using bovine serum albumin as the standard.
Statistical analysis
Statistical significance was determined by one-way analysis of variance followed by Dunnett’s multiple comparison test. Significance was ascribed at P<0.05.
Results
Dose-dependent cell viability in response to Ni NP exposure
Cells were exposed to Ni NPs at the concentrations of 0, 1, 2, 5, 10, 25, 50, and 100 μg/mL for 24 hours and cell viability was determined using MTT and NRU assays. Both assays demonstrated that Ni NPs up to the concentration of 5 μg/mL did not produce significant reduction in cell viability. As the concentration of the NPs increased from 10 to 100 μg/mL, reduction in cell viability was observed in a dose-dependent manner.
The MTT assay indicated that cell viability decreased to 86%, 74%, 62%, and 44% when cells were exposed to Ni NPs at the concentrations of 10, 25, 50, and 100 μg/mL, respectively (Figure 1A). Figure 1B shows the results of cell viability obtained by NRU assay, which showed that cell viability decreased to 83%, 76%, 64%, and 53% when cells were exposed to Ni NPs at the concentrations of 10, 25, 50, and 100 μg/mL, respectively.
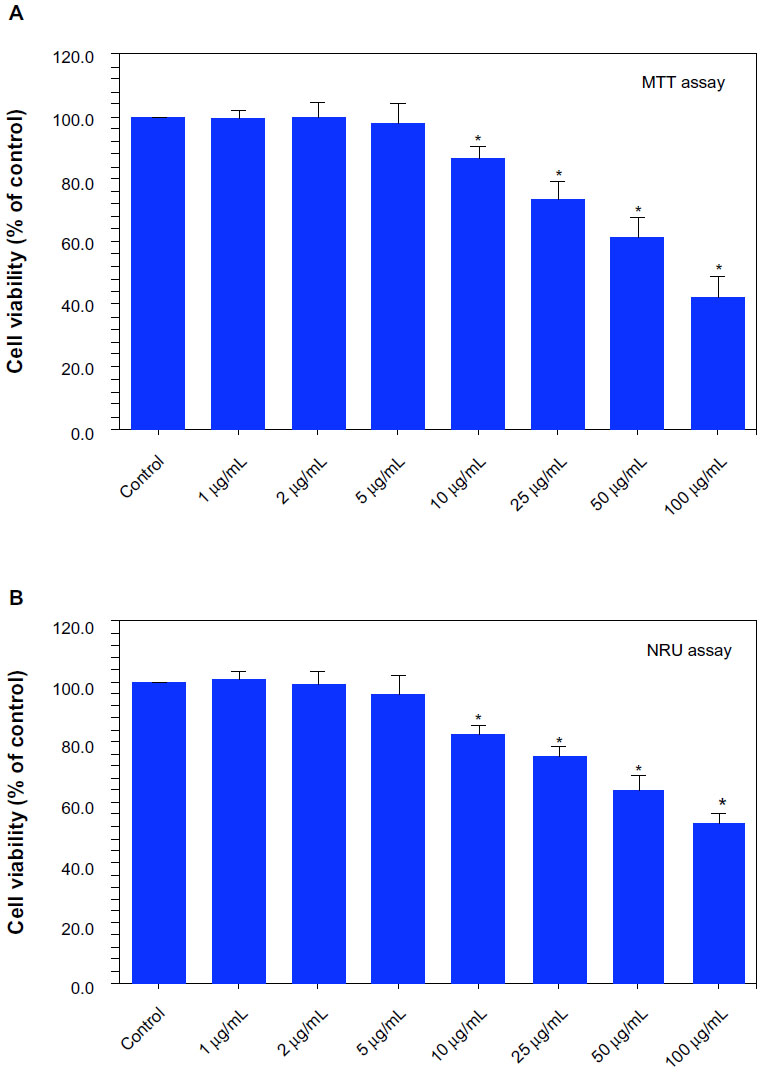 | Figure 1 Dose-dependent reduction of viability of MCF-7 cells after nickel nanoparticle (Ni NP) exposure: (A) 3-(4,5-dimethylthiazol-2-yl)-2,5-diphenyltetrazolium bromide (MTT) assay and (B) neutral red uptake (NRU) assay. |
Dose-dependent induction of cell membrane damage due to Ni NP exposure
LDH is an enzyme extensively present in the cytosol that converts lactate to pyruvate. When plasma membrane integrity is disrupted, LDH leaks into culture medium and its extracellular levels are elevated depending on the toxicity of the NPs. Consequently, higher LDH values in culture medium indicate cell membrane damage. In this study, we found that Ni NP increases LDH level in cell culture medium in a dose-dependent manner (Figure 2A). A significant negative correlation was also observed between LDH leakage and MTT cell viability (Figure 2B).
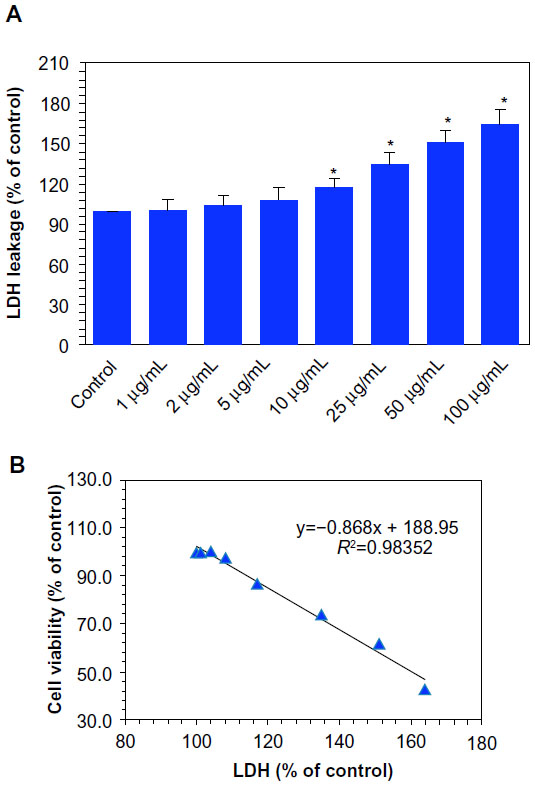 | Figure 2 Dose-dependent induction of membrane damage to MCF-7 cells after nickel nanoparticle (Ni NP) exposure. (A) Lactate dehydrogenase (LDH) leakage.a (B) A significant negative correlation between the cell viability (3-(4,5-dimethylthiazol-2-yl)-2,5-diphenyltetrazolium bromide [MTT] assay) and membrane damage (LDH leakage) after 24 hours’ exposure to 0, 1, 2, 5, 10, 25, 50, and 100 μg/mL of Ni NPs. |
Dose-dependent induction of ROS generation due to Ni NP exposure
The higher production of ROS in cells due to pollutants has been suggested as signaling molecules involved in the initiation and execution of DNA damage and apoptosis.2,34 Both fluorescence microscopy (Figure 3A) and quantitative data (Figure 3B) revealed that the Ni NPs (10–50 μg/mL) induced intracellular ROS generation in a dose-dependent manner.
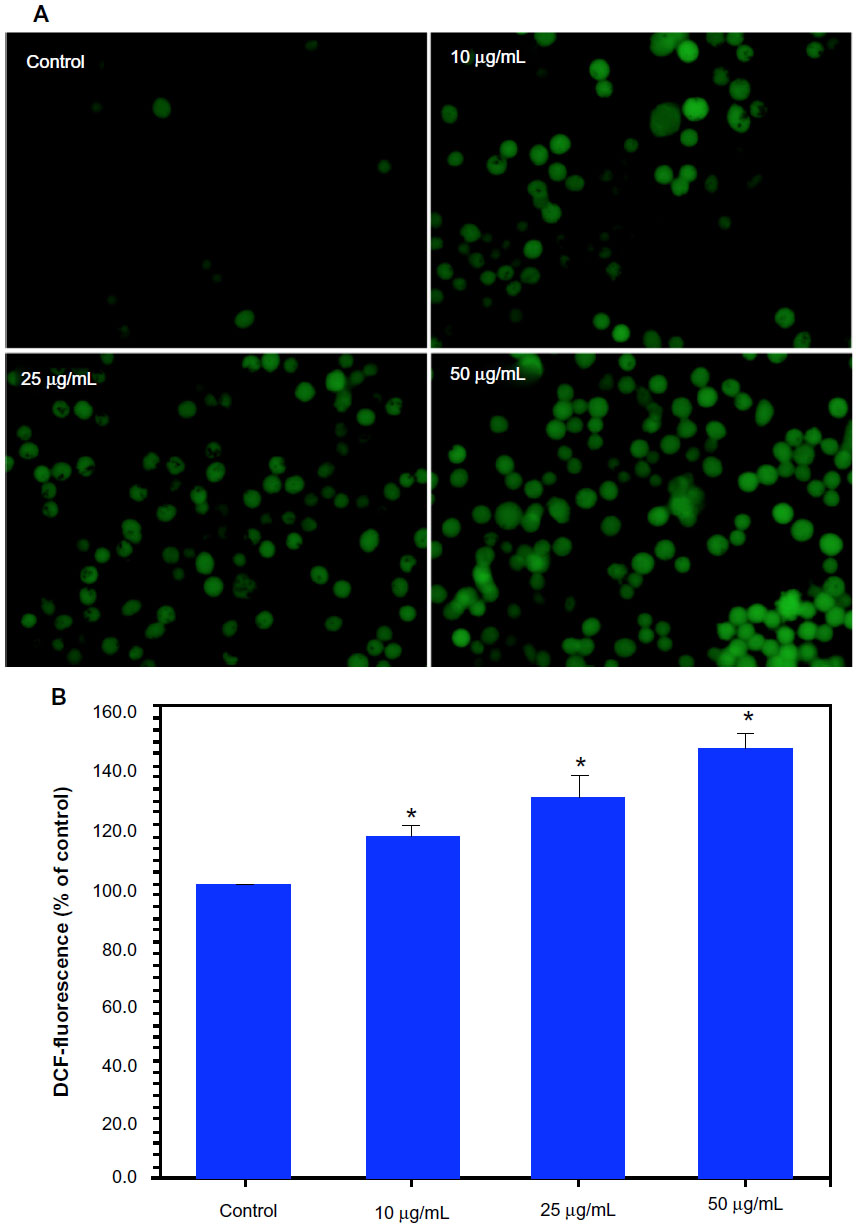 | Figure 3 Dose-dependent induction of oxidant production in MCF-7 cells after nickel nanoparticle (Ni NP) exposure. (A) Representative microphotographs showing Ni NP-induced reactive oxygen species (ROS) generation in MCF-7 cells.a (B) Percentage change in ROS generation of MCF-7 cells due to Ni NPs exposure.b |
Dose-dependent depletion of GSH levels due to Ni NP exposure
The depletion of GSH, which is indicative of ROS generation, has also been implicated in the oxidative damage of cellular macromolecules such as protein and DNA.23,35 We evaluated the GSH levels in MCF-7 cells treated with Ni NPs at concentrations of 10, 25, and 50 μg/mL for 24 hours. Results showed that the GSH levels were depleted with all concentrations of Ni NPs (Figure 4A). We also observed inverse correlations of ROS with GSH (R2=0.9953; Figure 4B) and MTT cell viability (R2=0.9981; Figure 4C).
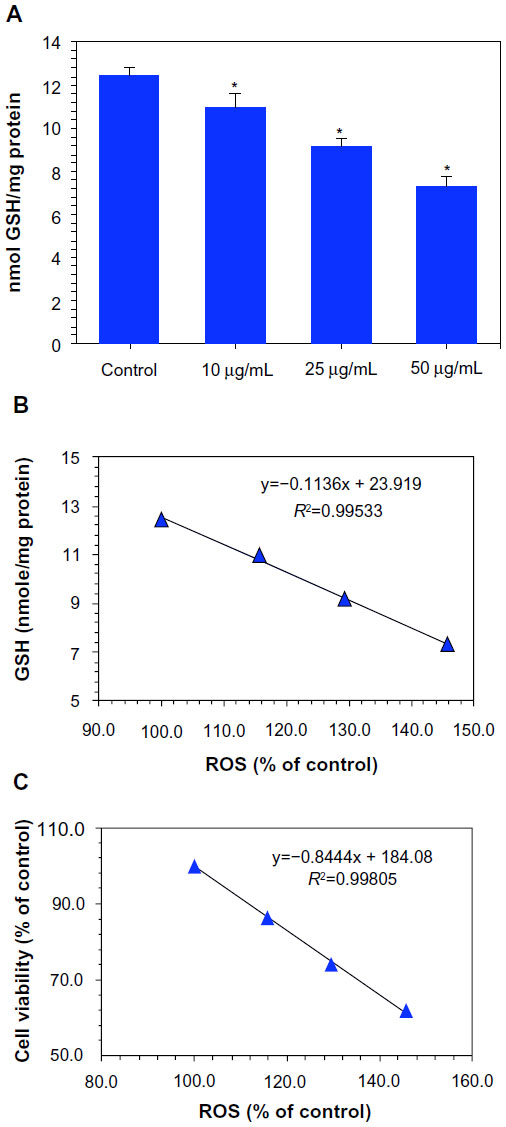 | Figure 4 Dose-dependent depletion of antioxidant levels in MCF-7 cells after nickel nanoparticle (Ni NP) exposure. (A) Glutathione (GSH) levels.a (B) A significant negative correlation between reactive oxygen species (ROS) and GSH in MCF-7 cells after 24 hours’ exposure to 10, 25, and 50 μg/mL of Ni NPs. (C) A significant negative correlation between ROS and cell viability (3-(4,5-dimethylthiazol-2-yl)-2,5-diphenyltetrazolium bromide [MTT]) in MCF-7 cells after 24 hours’ exposure to 10, 25, and 50 μg/mL of Ni NPs. |
Dose-dependent depletion of MMP due to Ni NP exposure
It is well-known that during apoptosis, the MMP of cells decreases. Ni NP-induced differences in MMP in MCF-7 cells were recorded in terms of the fluorescence intensity of the mitochondria-specific dye Rh-123. Both fluorescence microscopy (Figure 5A) and quantitative data (Figure 5B) revealed that the Ni NPs decreased the MMP of MCF-7 cells in a dose-dependent manner.
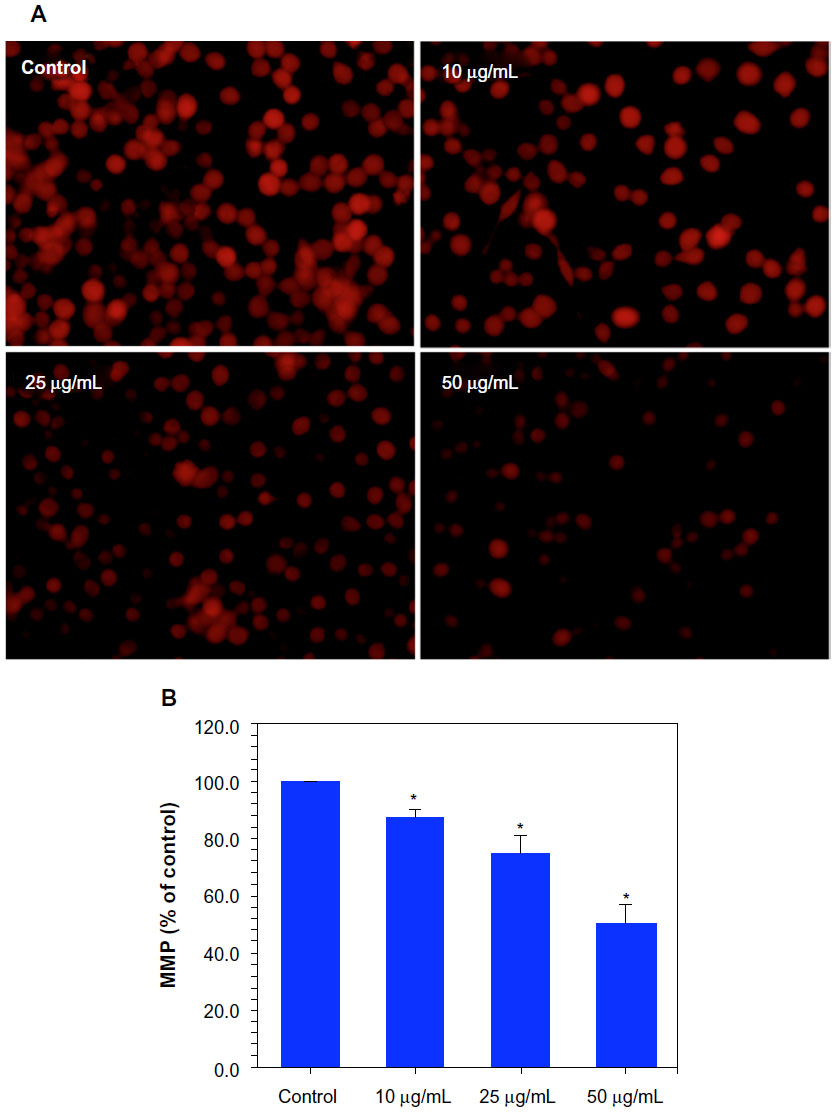 | Figure 5 Dose-dependent induction of mitochondrial membrane potential (MMP) in MCF-7 cells after nickel nanoparticle (Ni NP) exposure. (A) Representative microphotographs showing Ni NP-induced MMP in MCF-7 cells.a (B) Percentage change in MMP of MCF-7 cells due to Ni NP exposure.b |
Dose-dependent induction of DNA damage due to Ni NP exposure
One sign of genotoxicity is the induction of DNA damage that can be determined by comet assay, a widely used method for the detection as well as measurement of DNA strand breaks.30 Comet assay was carried out in MCF-7 cells against Ni NPs at the concentrations of 10, 25, and 50 μg/mL for 24 hours. A dose-dependent increase in DNA damage was observed in Ni NP-treated cells, as evidenced by an increase in % tail DNA and Olive tail moment (arbitrary unit; Figure 6A and B). We also found a significant positive correlation between ROS and % tail DNA (R2=0.9816; Figure 6C).
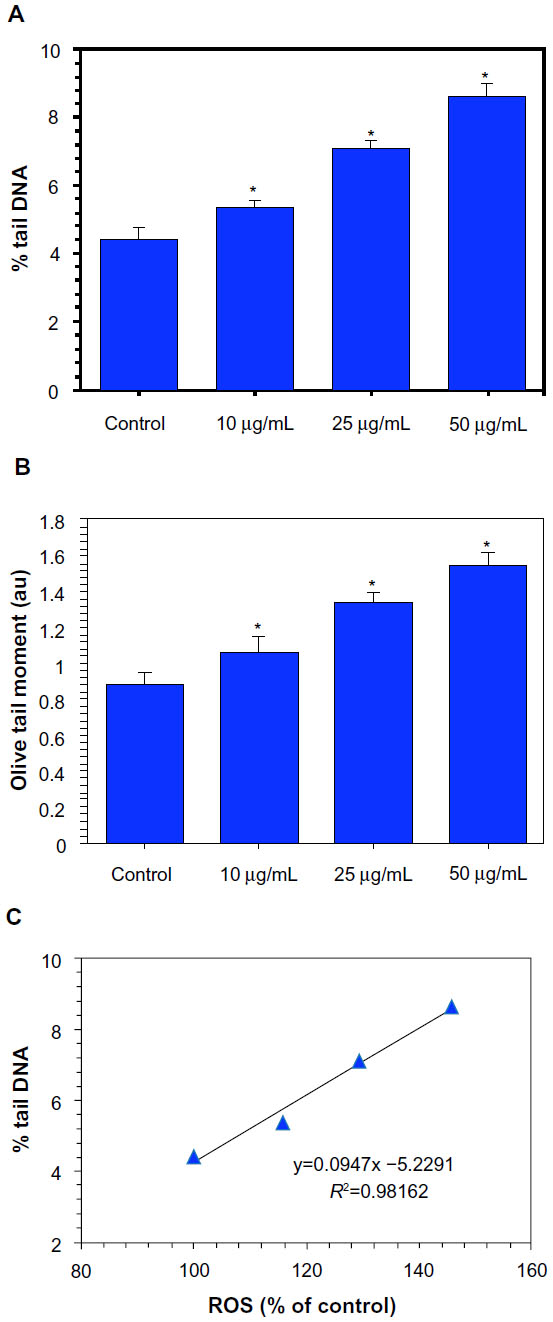 | Figure 6 Dose-dependent induction of DNA damage (comet assay) in MCF-7 cells after nickel nanoparticle (Ni NP) exposure. (A) Percent tail DNA and (B) Olive tail moment (arbitrary unit).a (C) Significant positive correlations between reactive oxygen species (ROS) and DNA damage (% tail DNA) in MCF-7 cells after 24 hours’ exposure to 10, 25, and 50 μg/mL of Ni NPs. |
Dose-dependent induction of apoptosis due to Ni NP exposure
RT-PCRq was used to analyze the messenger RNA (mRNA) levels of apoptotic gene caspase-3 in MCF-7 cells exposed to Ni NPs at the concentrations of 10, 25, and 50 μg/mL for 24 hours. We observed that Ni NPs significantly induced the expression of this gene in a dose-dependent manner (Figure 7A). In agreement with the mRNA results, we also found that the Ni NPs induced the activity of the caspase-3 enzyme dose dependently (Figure 7B). A significant positive correlation was also observed between ROS and the caspase-3 enzyme (R2=0.9911; Figure 7C).
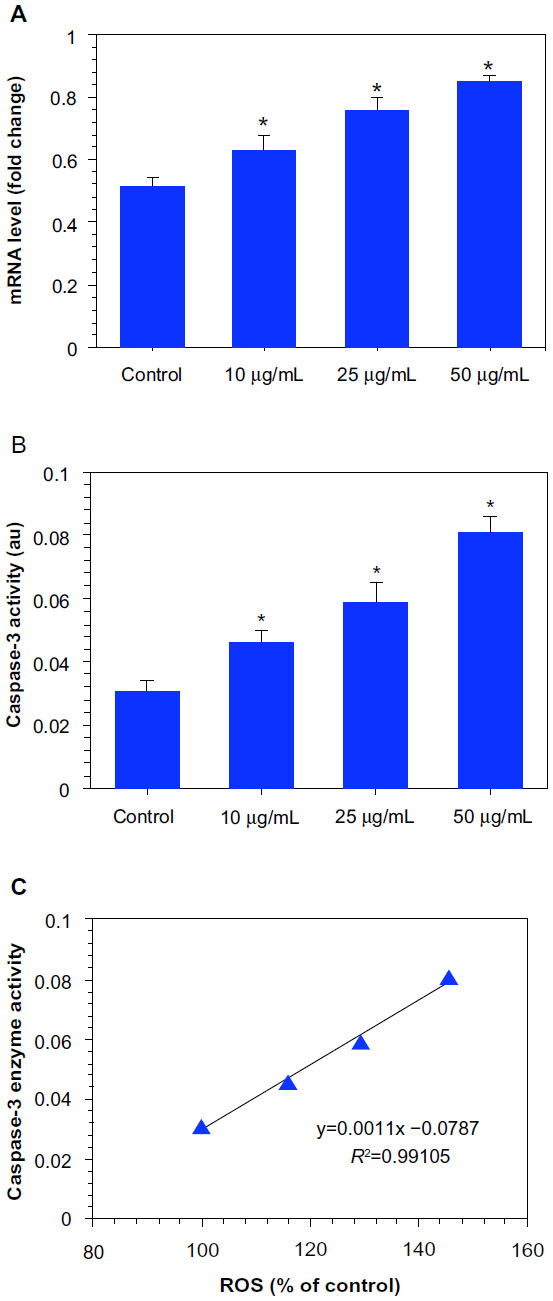 | Figure 7 Dose-dependent induction of apoptosis in MCF-7 cells after nickel nanoparticle (Ni NP) exposure. (A) Ni NPs induced the expression of mRNA levels of apoptotic gene caspase-3 in MCF-7 cells. (B) Ni NPs also induced the activity of the caspase-3 enzyme in MCF-7 cells.a (C) A significant positive correlation between reactive oxygen species (ROS) and the caspase-3 enzyme in MCF-7 cells after 24 hours’ exposure to 10, 25, and 50 μg/mL of Ni NPs. |
Discussion
With the potential use of Ni NPs in the biomedical field, concerns about their toxic effects for humans and their environment have increased rapidly.36 Some recent studies have shown that Ni NPs are cytotoxic to various tissues and cells.15–17,21 The major routes of exposure to NPs are inhalation, ingestion, and dermal contact. Because of the physical and chemical characteristics of the respiratory and gastrointestinal mucosal barriers, NPs can invade other tissues and organs via the circulatory system.37 Studies have shown that inhaled as well as ingested NPs can be distributed in different vital organs.38–40 Information on the interaction of Ni NPs with human breast cells is scarce. This prompted us to examine the biological response of Ni NPs in human breast carcinoma (MCF-7) cells. In our study, we found that the treatment of MCF-7 cells with Ni NPs induced cytotoxicity, genotoxicity, and oxidative stress in the MCF-7 cells.
We employed MTT and NRU assays for cell viability measurements. Both assays demonstrated that the Ni NPs (28 nm) reduced the viability of the MCF-7 cells in a dose-dependent manner in the concentration range of 10–100 μg/mL. Ni NPs at the concentration of ≤5 μg/mL did not produce significant cytotoxicity in the MCF-7 cells. Our earlier study showed that Ni NPs (28 nm) produce cytotoxicity at the concentration of ≥10 μg/mL in human liver (HepG2) cells.21 However, another study by our group has shown that the minimum concentration of Ni NPs (size: 65 nm) that causes cytotoxicity in human lung epithelial (A549) cells is 2 μg/mL.41 These results suggest that human breast cells are more susceptible to Ni NP exposure than liver cells and less susceptible than lung cells. MTT and NRU assays represent the damage in mitochondrial and lysosomal membranes, respectively, that eventually triggers cell death.42,43 These assays serve as sensitive and integrated measures of cell integrity and of the inhibition of cell proliferation. Our assay results are consistent with the observed low MMP in cells exposed to Ni NPs. Damage to lysosomal membranes is known to release lysosome protease into intracellular spaces, which affects the neighboring cells and triggers cell death due to apoptosis.44 LDH leakage from cells is further evidence for both the penetration of NPs into cells and cell membrane damage.45,46 In the present study, we also found that LDH leakage increased as the concentration of Ni NPs was increased in MCF-7 cells. A significant reverse correlation between MTT and LDH was also observed.
ROS generation is likely to be one of the possible mechanisms of NP toxicity. NPs may increase ROS production and thereby cause interference in the biological antioxidant defense system.47–49 ROS induce DNA damage, including a multitude of oxidized base lesions, abasic sites, and single- and double-strand breaks, all of which can be cytotoxic and/or mutagenic.50,51 However, studies on the exact mechanisms through which NPs generate ROS in cells are still underway. In this study, we evaluated the toxicity mechanisms of Ni NPs in MCF-7 cells. We hypothesized that the Ni NPs induced cytotoxicity in the MCF-7 cells through oxidant generation and antioxidant depletion. Indeed, Ni NPs were shown to generate ROS (oxidant) and GSH (antioxidant) depletion in MCF-7 cells in a dose-dependent manner. Further, the negative linear correlation between the ROS and GSH indicated that free oxygen radical species were generated by exposure to Ni NPs, which reduced intracellular antioxidant GSH levels. There was also a strong inverse correlation between cell viability (MTT) and increased ROS level. Consequently, the higher production of ROS and concomitant decrease in antioxidants such as GSH to scavenge free oxygen radicals appear to be the underlying mechanisms of Ni NP toxicity in MCF-7 cells. These results confirm the oxidant potential of Ni NPs described in previous studies.16,21,41
Alkaline comet assay was used to analyze the DNA damage caused by Ni NPs in MCF-7 cells. This assay is able to detect single-strand breakage or other lesions, such as alkali-labile sites, DNA cross-links, and incomplete excision repair events.52,53 This technique offers considerable advantages over other cytogenetic methods like chromosome aberrations, sister chromatid exchanges, and micronucleus tests used to detect DNA damage, because the cells do not need to be mitotically active for comet assay.54 Therefore, this assay has been widely used in the field of genetic toxicology.53 Investigators have utilized the comet assay to examine the genotoxic potential of different types of NPs.31,55 In this study, we observed that Ni NPs induce DNA damage, as evidenced by % tail DNA and Olive tail moment. We also found a strong positive correlation between DNA damage (% tail DNA) and ROS, suggesting that oxidative stress may be one of the causes of DNA damage in Ni NP toxicity. We further analyzed the mRNA expression of an apoptotic gene caspase-3 in response to Ni NP exposure in MCF-7 cells. Our RT-PCRq results showed that the Ni NPs upregulated the mRNA level of this gene. Further, the activity of the caspase-3 enzyme was also higher in Ni NPs treated MCF-7 cells. A positive correlation between caspase-3 enzyme activity and ROS level was also observed. Studies have shown that ROS work as signaling molecules for the initiation and execution of the apoptotic pathways.56,57
The recent literature has shown that Ni ions release from the surface of Ni NPs when they are suspended in aqueous solutions such as water and cell-culture media. However, in our study, we did not examine the degree of ionization of Ni NPs in water or culture media and the effects of this on MCF-7 cells. A recent study reported that Ni ions and nickel(II) oxide (NiO) NPs were equally toxic to human lung epithelial cells, followed by metallic Ni NPs but not by metallic Ni microparticles.15 Therefore, toxicity due to the dissolution of metallic Ni NPs in cells or tissues needs further study.
Conclusion
We observed that Ni NPs induce cytotoxicity in MCF-7 cells in a dose-dependent manner in the concentration range of 10–100 μg/mL. This NP was also found to induce oxidative stress, as evidenced by ROS production and GSH depletion. The mRNA level, as well as the activity of the caspase-3 enzyme, was increased due to Ni NP exposure. Taken together, these results suggest that Ni NPs induce cyto-genotoxicity in MCF-7 cells, which is likely to be mediated through ROS. Further studies are underway examining the molecular mechanism of the toxicity induced by Ni NPs in human breast cancer cells.
Acknowledgment
The authors extend their appreciation to the Deanship of Scientific Research at King Saud University for funding this work through research group number RGP-VPP-308.
Disclosure
The authors declare no conflicts of interest in this work.
References
Oberdörster G, Oberdörster E, Oberdörster J. Nanotoxicology: an emerging discipline evolving from studies of ultrafine particles. Environ Health Perspect. 2005;113(7):823–839. | |
Nel A, Xia T, Mädler L, Li N. Toxic potential of materials at the nanolevel. Science. 2006;311(5761):622–627. | |
Borm PJ, Robbins D, Haubold S, et al. The potential risks of nanomaterials: a review carried out for ECETOC. Part Fibre Toxicol. 2006;3:11. | |
Gwinn MR, Vallyathan V. Nanoparticles: health effects – pros and cons. Environ Health Perspect. 2006;114(12):1818–1825. | |
Magaye R, Zhao J. Recent progress in studies of metallic nickel and nickel-based nanoparticles’ genotoxicity and carcinogenicity. Environ Toxicol Pharmacol. 2012;34(3):644–650. | |
Buzae C, Blandino II, Robbie K. Nanomaterials and nanoparticles: sources and toxicity. Biointerphases. 2007;2(4):MR17–MR71. | |
Elder A, Yang H, Gwiazda R, Teng X, Thurston S, He H, Oberdörster G. Testing nanomaterials of unknown toxicity: An example based on platinum nanoparticles of different shapes. Adv Mater. 2007;19(20):3124–3129. | |
Lewinski N, Colvin V, Drezek R. Cytotoxicity of nanoparticles. Small. 2008;4(1):26–49. | |
Zhang Q, Kusaka Y, Zhu X, et al. Comparative toxicity of standard nickel and ultrafine nickel in lung after intratracheal instillation. J Occup Health. 2003;45(1):23–30. | |
Clancy HA, Costa M. Nickel: a pervasive carcinogen. Future Oncol. 2012;8(12):1507–1509. | |
Hossain MZ, Kleve MG. Nickel nanowires induced and reactive oxygen species mediated apoptosis in human pancreatic adenocarcinoma cells. Int J Nanomed. 2011;6:1475–1485. | |
Guo D, Wu C, Hu H, Wang X, Li X, Chen B. Study on the enhanced cellular uptake effect of daunorubicin on leukemia cells mediated via functionalized nickel nanoparticles. Biomed Mater. 2009;4(2):025013. | |
Zhang R, Wang X, Wu C, et al. Synergistic enhancement effect of magnetic nanoparticles on anticancer drug accumulation in cancer cells. Nanotechnology. 2006;17(14):3622–3626. | |
Chen M, Zhang Y, Huang B, et al. Evaluation of the antitumor activity by Ni nanoparticles with verbascoside. J Nanomat. 2013;2013:Article ID 623497. | |
Pietruska JR, Liu X, Smith A, et al. Bioavailability, intracellular mobilization of nickel, and HIF-1α activation in human lung epithelial cells exposed to metallic nickel and nickel oxide nanoparticles. Toxicol Sci. 2011;124(1):138–148. | |
Zhao J, Bowman L, Zhang X, et al. Metallic nickel nano- and fine particles induce JB6 cell apoptosis through a caspase-8/AIF mediated cytochrome c-independent pathway. J Nanobiotechnology. 2009;7:2. | |
Ispas C, Andreescu D, Patel A, Goia DV, Andreescu S, Wallace KN. Toxicity and developmental defects of different sizes and shape nickel nanoparticles in zebrafish. Environ Sci Technol. 2009;43(16):6349–6356. | |
Monks A, Harris E, Hose C, Connelly J, Sausville EA. Genotoxic profiling of MCF-7 breast cancer cell line elucidates gene expression modifications underlying toxicity of the anticancer drug 2-(4-amino-3-methylphenyl)-5-fluorobenzothiazole. Mol Pharmacol. 2003;63(3):766–772. | |
Sandhya T, Mishra KP. Cytotoxic response of breast cancer cell lines, MCF 7 and T 47 D to triphala and its modification by antioxidants. Cancer Lett. 2006;238(2):304–313. | |
Siddiqui MA, Ahamed M, Ahmad J, et al. Nickel oxide nanoparticles induce cytotoxicity, oxidative stress and apoptosis in cultured human cells that is abrogated by the dietary antioxidant curcumin. Food Chem Toxicol. 2012;50(3–4):641–647. | |
Ahmad J, Alhadlaq HA, Siddiqui MA, et al. Concentration-dependent induction of reactive oxygen species, cell cycle arrest and apoptosis in human liver cells after nickel nanoparticles exposure. Environ Toxicol. 2013. Epub June 17. | |
Mossman T. Rapid colorimetric assay for cellular growth and survival: application to proliferation and cytotoxicity assays. J Immunol Methods. 1983;65(1–2):55–63. | |
Ahamed M, Akhtar MJ, Siddiqui MA, et al. Oxidative stress mediated apoptosis induced by nickel ferrite nanoparticles in cultured A549 cells. Toxicology. 2011;283(2–3):101–108. | |
Borenfreund E, Puerner JA. A simple quantitative procedure using monolayer cultures for cytotoxicity assays (HTD/NR-90). J Tissue Cult Methods. 1985;9(1):7–9. | |
Wang H, Joseph JA. Quantifying cellular oxidative stress by dichlorofluorescein assay using microplate reader. Free Radic Biol Med. 1999;27(5–6):612–616. | |
Ahmad J, Ahamed M, Akhtar MJ, et al. Apoptosis induction by silica nanoparticles mediated through reactive oxygen species in human liver cell line HepG2. Toxicol Appl Pharmacol. 2012;259(2):160–168. | |
Ellman GI. Tissue sulfhydryl groups. Arch Biochem Biophys. 1959;82(1):70–77. | |
Zhang Y, Jiang L, Jiang L, et al. Possible involvement of oxidative stress in potassium bromate-induced genotoxicity in human HepG2 cells. Chem Biol Interact. 2011;189(3):186–191. | |
Siddiqui MA, Kashyap MP, Kumar V, Al-Khedhairy AA, Musarrat J, Pant AB. Protective potential of trans-resveratrol against 4-hydroxynonenal induced damage in PC12 cells. Toxicol In Vitro. 2010;24(6):1592–1598. | |
Singh NP, McCoy MT, Tice RR, Schneider EL. A simple technique for quantitation of low levels of DNA damage in individual cells. Exp Cell Res. 1988;175(1):184–191. | |
Ali D, Ray RS, Hans RK. UVA-induced cyototoxicity and DNA damaging potential of benz (e) acephenanthrylene. Toxicol Lett. 2010;199(2):193–200. | |
Berasain C, García-Trevijano ER, Castillo J, et al. Novel role for amphiregulin in protection from liver injury. J Biol Chem. 2005;280(19):19012–19020. | |
Bradford MM. A rapid and sensitive method for the quantitation of microgram quantities of protein utilizing the principle of protein-dye binding. Anal Biochem. 1976;72:248–254. | |
Ott M, Gogvadze V, Orrenius S, Zhivotovsky B. Mitochondria, oxidative stress and cell death. Apoptosis. 2007;12(5):913–922. | |
Akhtar MJ, Ahamed M, Kumar S, Ahmad J, Khan MA, Alrokayan SA. Zinc oxide nanoparticles selectively induce apoptosis in human cancer cells through reactive oxygen species. Int J Nanomedicine. 2012;7:845–857. | |
Maynard AD, Kuempel ED. Airborne nanostructured particles and occupational health. J Nanopart Res. 2005;7(6):587–614. | |
Fröhlich E, Roblegg E. Models for oral uptake of nanoparticles in consumer products. Toxicology. 2012;291(1–3):10–17. | |
Chen Z, Meng H, Yuan H, et al. Identification of target organs of copper nanoparticles with ICP-MS technique. Journal of Radioanalytical and Nuclear Chemistry. 2007;272(3):599–603. | |
Kim YS, Kim JS, Cho HS, et al. Twenty-eight-day oral toxicity, genotoxicity, and gender-related tissue distribution of silver nanoparticles in Sprague-Dawley rats. Inhal Toxicol. 2008;20(6):575–583. | |
Wang B, Feng W, Wang M, et al. Acute toxicological impact of nano- and submicro-scaled zinc oxide powder on healthy adult mice. J Nanopart Res. 2008;10(2):263–276. | |
Ahamed M. Toxic response of nickel nanoparticles in human lung epithelial A549 cells. Toxicol In Vitro. 2011;25(4):930–936. | |
Nicoletti I, Migliorati G, Pagliacci MC, Grignani F, Riccardi C. A rapid and simple method for measuring thymocyte apoptosis by propidium iodide staining and flow cytometry. J Immunol Methods. 1991;139(2):271–279. | |
Ravi S, Chiruvella KK, Rajesh K, Prabhu V, Raghavan SC. 5-Isopropylidene-3-ethyl rhodanine induce growth inhibition followed by apoptosis in leukemia cells. Eur J Med Chem. 2010;45(7):2748–2752. | |
Leist M, Jäättelä M. Four deaths and a funeral: from caspases to alternative mechanisms. Nat Rev Mol Cell Biol. 2001;2(8):589–598. | |
Hussain SM, Hess KL, Gearhart JM, Gieiss KT, Schlager JJ. In vitro toxicity of nanoparticles in BRL 3A rat liver cells. Toxicol In Vitro. 2005;19(7):975–983. | |
Akhtar MJ, Ahamed M, Kumar S, et al. Nanotoxicity of pure silica mediated through oxidant generation rather than glutathione depletion in human lung epithelial cells. Toxicology. 2010;276(2):95–102. | |
Xia T, Kovochich M, Liong M, et al. Comparison of the mechanism of toxicity of zinc oxide and cerium oxide nanoparticles based on dissolution and oxidative stress properties. ACS Nano. 2008;2(10):2121–2134. | |
Barillet S, Jugan ML, Laye M, et al. In vitro evaluation of SiC nanoparticles impact on A549 pulmonary cells: cyto-, genotoxicity and oxidative stress. Toxicol Lett. 2010;198(3):324–330. | |
Ahamed M, Ali D, Alhadlaq HA, Akhtar MJ. Nickel oxide nanoparticles exert cytotoxicity via oxidative stress and induce apoptotic response in human liver cells (HepG2). Chemosphere. 2013;93(10):2514–2422. | |
Diakowska D, Lewandowski A, Kopeć W, Diakowski W, Chrzanowska T. Oxidative DNA damage and total antioxidant status in serum of patients with esophageal squamous cell carcinoma. Hepatogastroenterology. 2007;54(78):1701–1704. | |
Paz-Elizur T, Sevilya Z, Leitner-Dagan Y, Elinger D, Roisman LC, Livneh Z. DNA repair of oxidative DNA damage in human carcinogenesis: potential application for cancer risk assessment and prevention. Cancer Lett. 2008;266(1):60–72. | |
Gedik CM, Ewen SW, Collins AR. Single-cell gel electrophoresis applied to the analysis of UV-C damage and its repair in human cells. Int J Radiat Biol. 1992;62(3):313–320. | |
Tice RR, Agurell E, Anderson D, et al. Single cell gel/comet assay: guidelines for in vitro and in vivo genetic toxicology testing. Environ Mol Mutagen. 2000;35(3):206–221. | |
Buschini A, Carboni P, Martino A, Poli P, Rossi C. Effects of temperature on baseline and genotoxicant-induced DNA damage in haemocytes of Dreissena polymorpha. Mutat Res. 2003;537(1):81–92. | |
Shukla RK, Sharma V, Pandey AK, Singh S, Sultana S, Dhawan A. ROS-mediated genotoxicity induced by titanium dioxide nanoparticles in human epidermal cells. Toxicol In Vitro. 2011;25(1):231–241. | |
Stone V, Donaldson K. Nanotoxicology: signs of stress. Nat Nanotech. 2006;1(1):23–24. | |
Lunov O, Syrovets T, Büchele B, et al. The effect of carboxydextran-coated superparamagnetic iron oxide nanoparticles on c-Jun N-terminal kinase-mediated apoptosis in human macrophages. Biomaterials. 2010;31(19):5063–5071. |
 © 2014 The Author(s). This work is published and licensed by Dove Medical Press Limited. The
full terms of this license are available at https://www.dovepress.com/terms
and incorporate the Creative Commons Attribution
- Non Commercial (unported, 3.0) License.
By accessing the work you hereby accept the Terms. Non-commercial uses of the work are permitted
without any further permission from Dove Medical Press Limited, provided the work is properly
attributed. For permission for commercial use of this work, please see paragraphs 4.2 and 5 of our Terms.
© 2014 The Author(s). This work is published and licensed by Dove Medical Press Limited. The
full terms of this license are available at https://www.dovepress.com/terms
and incorporate the Creative Commons Attribution
- Non Commercial (unported, 3.0) License.
By accessing the work you hereby accept the Terms. Non-commercial uses of the work are permitted
without any further permission from Dove Medical Press Limited, provided the work is properly
attributed. For permission for commercial use of this work, please see paragraphs 4.2 and 5 of our Terms.