Back to Journals » International Journal of General Medicine » Volume 14
New Thresholds for AFP and Des-γ-Carboxy Prothrombin in Chronic Liver Disease Depending on the Use of Nucleoside Analogs and an Integrated Nomogram
Authors Sun T, Li R, Qiu Y ![]() , Shen S, Wang W
, Shen S, Wang W ![]()
Received 21 August 2021
Accepted for publication 16 September 2021
Published 27 September 2021 Volume 2021:14 Pages 6149—6165
DOI https://doi.org/10.2147/IJGM.S335400
Checked for plagiarism Yes
Review by Single anonymous peer review
Peer reviewer comments 2
Editor who approved publication: Dr Scott Fraser
Ting Sun,1 Ruicen Li,2 Yiwen Qiu,1 Shu Shen,1 Wentao Wang1
1Department of Liver Surgery & Liver Transplantation Center, West China Hospital of Sichuan University, Chengdu, People’s Republic of China; 2Health Management Center, West China Hospital of Sichuan University, Chengdu, People’s Republic of China
Correspondence: Wentao Wang
Department of Liver Surgery & Liver Transplantation Center, West China Hospital of Sichuan University, 37 Guoxue Road, Chengdu, 610041, People’s Republic of China
Tel +86 18980601895
Email [email protected]
Background: The thresholds of alpha-fetoprotein (AFP) and des-gamma-carboxy prothrombin (PIVKA-II) when detecting hepatocellular carcinoma (HCC) in chronic hepatitis B (CHB) patients with antiviral nucleoside analog (NA) remain controversial. A relevant integrated nomogram needs to be developed.
Methods: We enrolled a consecutive series of 5666 cases diagnosed with CHB either with or without antiviral agents and randomly allocated them to the training set (n=3966, 70.00%) and the validation set (n=1700, 30.00%).
Results: In the training set, the levels of AFP and PIVKA-II of NA-treated patients were significantly lower than those of untreated patients. The most appropriate cut-off values of AFP and PIVKA-II were 151.40 ng/mL (a sensitivity of 39.77% and a specificity of 92.17%) and 35.50 mAU/mL (a sensitivity of 84.85% and a specificity of 69.43%) for NA-treated patients. As for BCLC-0/A HCC, the most appropriate cut-off values of AFP and PIVKA-II were 151.40 ng/mL and 32.50 mAU/mL for NA-treated patients, respectively. A logistic regression model composed of AFP, PIVKA-II and other clinical parameters to predict the risk of HBV-related HCC for NA-treated patients was established and verified to have an AUROC of 0.868 (95% CI, 0.827– 0.909) for all-stage HCC and an AUROC of 0.856 (95% CI, 0.809– 0.903) for BCLC-0/A HCC.
Conclusion: The new detection thresholds of AFP and PIVKA-II might lead to the ability to perform early detection for hepatoma in NA-treated patients and the innovative risk prediction model is a valuable tool for identifying high-risk CHB patients.
Keywords: hepatitis B virus, hepatocellular carcinoma, alpha-fetoprotein, des-gamma-carboxy prothrombin, antiviral agents, nomogram
Introduction
Hepatocellular carcinoma (HCC) is the third most frequent cause of cancer-related mortality and the sixth most common cancer in the world.1 Hepatitis B virus (HBV) infection has a profound influence on approximately 292 million people according to a study in 2016.2 The dominant role that the hepatitis B virus plays in HCC has been proven by previous studies,3 and the effect of antiviral NA treatment in reducing the occurrence of HBV-related HCC has been confirmed.4 As a result, surveillance of HBV-related HCC and long-term antiviral NA treatments, such as entecavir (ETV) or tenofovir (TDF), are recommended for chronic hepatitis B (CHB) patients according to various international guidelines.5–7
Alpha-fetoprotein (AFP) has been extensively used as a cheap and convenient biomarker in the surveillance of HCC for years,8 even though its unsatisfactory sensitivity and specificity.9 On the other hand, several studies have demonstrated that Des-gamma-carboxy prothrombin, which is also known as protein induced by vitamin K absence or antagonist-II, or PIVKA-II, is a significant tumor marker, especially for HCC.10−11 However, some studies have shown that NA treatment could change levels of serum AFP and PIVKA-II in CHB patients and levels of tumor markers might be connected with HBV-related HCC.12–14 Thus, we further speculated that antiviral NA treatment may have an effect on the detection thresholds of serum AFP and PIVKA-II for HBV-related HCC.
In addition to antiviral therapy and tumor markers, clinical and laboratory parameters have been validated to have a relation with HCC.15–18 Risk estimation for hepatocellular carcinoma in chronic hepatitis B (REACH-B) was developed in Asian cohorts of patients without cirrhosis or NA treatment.17 REACH-B score included sex, age, alanine aminotransferase (ALT), HBeAg as well as HBV-DNA level, and presented an area under the curve (AUROC) of 0.811 at 3 years in the validation set. Jung et al included NA-treated as well as untreated patients, and proposed modified REACH-B (mREACH-B) score where liver stiffness (LS) values were incorporated into REACH-B instead of serum HBV-DNA levels.18 Compared with REACH-B, the modified REACH-B score had higher AUROCs for the prediction of HCC but did not include tumor markers. PAGE-B, including platelet (PLT), age and gender, was generated from Caucasian CHB patients with NA treatment and characterized by strong operability.16 However, PAGE-B was based on Caucasian population only and still did not take tumor markers into consideration. Although the present models of risk assessment for HBV-related HCC have partly been used as auxiliary bases for HCC surveillance, they have not yet attracted enough attention to be reflected in the current guidelines.5–7 An integrated model which includes sensitive and specific tumor markers to estimate the risk of HCC and even early-stage HCC in Asian CHB patients with NA treatment is lacking.
Because the detection thresholds of AFP and PIVKA-II for HBV-related HCC remain unclear and models of risk assessment for HBV-related HCC needs further perfection, we conducted a real-world study to address the issues. We compared the levels of AFP and PIVKA-II between NA-treated patients and untreated patients, as well as determine the thresholds of these two biomarkers in NA-treated patients. Furthermore, an integrated regression model was established to assess the risk of HBV-related HCC in CHB patients.
Methods
Patients
This retrospective cross-sectional study initially consecutively enrolled 27,817 cases diagnosed with CHB in the Department of Infectious Disease and the Department of General Surgery of West China Hospital, Sichuan University between January 1, 2012, and October 31, 2019.
The enrolled patients should meet one of the inclusion criteria (1)-(3) and simultaneously meet the criterion (4):
(1) Patients with HBV-related HCC were all diagnosed by histopathology.
(2) Patients with only CHB were all diagnosed according to the AASLD guideline7 and must have an ultrasonography (US), computed tomography (CT) or magnetic resonance imaging (MRI) examination showing no evidence of hepatic mass within 6 months.
(3) CHB-related liver cirrhosis patients without HCC were defined as having CHB with a clinical diagnosis of liver cirrhosis but not having HCC. Liver cirrhosis was diagnosed by 1) histology, or 2) findings characteristic of cirrhosis or portal hypertension in cross-sectional imaging (nodular configuration of the liver or signs of portal hypertension) and/or thrombocytopenia (PLT<150K).19,20 Those patients must have an US, CT or MRI examination showing no evidence of hepatic mass within 6 months.
(4) Patients who were receiving NA treatment (ETV or TDF) at the recommended dose (0.5 mg orally daily for ETV and 300 mg orally daily for TDF) for at least 6 months and were regularly reexamined for HCC surveillance every 3 months or who had never undergone any NA treatment.
The exclusion criteria were as follows:
(1) Patients previously diagnosed with CHB, hepatitis B cirrhosis or HCC and who had received other treatments, such as interferon (IFN).
(2) Any cancer of the digestive system other than HCC.
(3) Patients with other liver diseases, such as schistosomiasis cirrhosis, alcoholic cirrhosis, autoimmune liver disease (ALD), or viral hepatitis A or C.
(4) Patients with other severe complications or diseases such as hepatic failure or acquired immune deficiency syndrome (AIDS).
(5) Those taking anticoagulant drugs, vitamin K or other drugs that could cause any interference with recent laboratory examinations.
All cases meeting the criteria were randomly allocated to one of two sets: a training set or a validation set, at a ratio of 7:3.
This study was conducted in accordance with the Declaration of Helsinki and was approved by the Medical Ethics Committee of West China Hospital (IRB number: 2019022). The need for informed consent was waived by the Medical Ethics Committee because the study was an observational, retrospective study using a database from which the patients’ identifying information had been removed.
Measurements of Hematology Parameters and Tumor Markers
All hematology and biochemistry profiles were derived from peripheral blood samples collected at the time of initial diagnosis of HCC, hepatitis B cirrhosis or CHB at West China Hospital, Sichuan University. All the analyses were performed in strict accordance with the manufacturer’s instructions by laboratory technicians in the clinical laboratory of West China Hospital, Sichuan University. The technicians did not know the patients’ clinical information.
Statistical Analysis
Continuous variables and nonparametric tests were compared using Mann–Whitney U or Kruskal–Wallis H-tests, while categorical data were compared using Chi-square or Fisher’s exact tests. The receiver operating characteristic (ROC) curves were used to assess sensitivity, specificity, positive-predictive value (PPV), negative-predictive value (NPV), and the corresponding cut-off values and the AUROCs were calculated at a 95% confidence interval (CI). Statistical differences in the AUROCs were compared using the method of DeLong et al.21 We obtained the optimal cutoff value by maximizing the sensitivity and specificity. Logistic regression analysis was used to perform univariate and multivariate analyses. We used smooth curve fitting to examine whether the independent predictors were partitioned into intervals. We applied piece-wise regression that was using a separate line segment to fit each interval. All the reported probability (p) values were 2-tailed, and a p<0.05 was considered statistically significant. All the statistical analyses were performed using SPSS software, version 26.0 (SPSS, Inc.), Empower® (www.empowerstats.com, X&Y Solutions Inc.) and R (https://www.r-project.org).
Results
Baseline Characteristics of Enrolled Subjects
We screened 27,817 cases strictly in accordance with the inclusion and exclusion criteria, and all the data were integrated with no deletions. The final study population included 5666 cases randomly allocated to the training set and validation set at a ratio of 7:3 (Figure 1). All HBV-associated HCC patients were diagnosed with histopathology. The baseline characteristics of the two sets showed no significant differences except for PLT (Table S1).
 |
Figure 1 Participant flow diagram. |
For the training set, we performed a specialized comparison of the baseline data of patients receiving NA treatment and not receiving NA treatment to ensure that the two cohorts were comparable (Table S2). The median age and percentage of males were similar in NA-treated and untreated patients regardless of whether the patients had CHB, HBV-induced cirrhosis or HBV-related HCC. Most of other baseline characteristics including maximum tumor diameter and tumor stage in HBV-related HCC patients were balanced between NA-treated patients and untreated patients.
For NA-treated patients, we performed a comparison of baseline data of patients in the training set and validation set (Table S3). Most of the baseline data were balanced except for PLT.
Comparisons of the Levels of AFP and PIVKA-II of NA-Treated and Untreated Patients in the Training Set
Compared with the patients not receiving NA treatment, the levels of AFP and PIVKA-II in patients receiving NA treatment were significantly lower regardless of whether the patients had CHB, HBV-induced cirrhosis or HBV-related HCC (Figure 2).
 |
Figure 2 Comparisons of levels of AFP and PIVKA-II between NA-treated and untreated patients with CHB, HBV-related cirrhosis or HBV-related HCC in the training set. (A) Comparison of AFP between NA-treated and untreated patients with CHB (6.10 ng/mL versus 11.91 ng/mL, p<0.001). (B) Comparison of PIVKA-II between NA-treated and untreated patients with CHB (28.00 mAU/mL versus 39.00 mAU/mL, p<0.001). (C) Comparison of AFP between NA-treated and untreated patients with HBV-related cirrhosis (13.58 ng/mL versus 18.94 ng/mL, p=0.002). (D) Comparison of PIVKA-II between NA-treated and untreated patients with HBV-related cirrhosis (31.00 mAU/mL versus 41.00 mAU/mL, p<0.001). (E) Comparison of AFP between NA-treated and untreated patients with HBV-related HCC (64.05 ng/mL versus 140.05 ng/mL, p=0.003). (F) Comparison of PIVKA-II between NA-treated and untreated patients with HBV-related HCC (157.00 mAU/mL versus 343.50 mAU/mL, p=0.002). |
In addition, we compared the levels of AFP and PIVKA-II among patients with CHB, HBV-induced cirrhosis and HBV-related HCC (Figure 3). For all the patients with CHB, HBV-related cirrhosis and HBV-related HCC in the training set, the median levels of AFP and PIVKA-II were significantly different (p<0.001 for AFP and PIVKA-II, Figure 3A and B). When we made pairwise comparisons, only the comparison between CHB patients and HCC patients and the comparison between cirrhosis patients and HCC patients showed significant differences (p<0.001 for AFP and PIVKA-II). For patients receiving NA treatment or not receiving NA treatment, respective comparisons of the levels of AFP and PIVKA-II were performed among the three categories of patients, and similar results were found (Figure 3C–F). The levels of AFP and PIVKA-II in the patients with HBV-related HCC were also higher than those with CHB or HBV-related cirrhosis (p<0.001 for all comparisons).
 |
Figure 3 Comparisons of AFP and PIVKA-II levels among patients with CHB, HBV-related cirrhosis and HBV-related HCC in the training set. (A) Comparison of AFP among CHB, HBV-related cirrhosis and HBV-related HCC patients with and without NA treatment; (B) Comparison of PIVKA-II among CHB, HBV-related cirrhosis and HBV-related HCC patients with and without NA treatment; (C) Comparison of AFP among CHB, HBV-related cirrhosis and HBV-related HCC patients with NA treatment; (D) Comparison of PIVKA-II among CHB, HBV-related cirrhosis and HBV-related HCC patients with NA treatment; (E) Comparison of AFP among CHB, HBV-related cirrhosis and HBV-related HCC patients without NA treatment; (F) Comparison of PIVKA-II among CHB, HBV-related cirrhosis and HBV-related HCC patients without NA treatment. |
Detection Performances of AFP and PIVKA-II for NA-Treated and Untreated Patients in the Training Set
The ROC curves of AFP, PIVKA-II and the combined two tumor markers for NA-treated and untreated patients are shown in Figure 4A and B. For patients receiving NA treatment, PIVKA-II showed a superior AUROC when compared with AFP (p<0.001) or the combination (p<0.01). However, no significant differences were found between AFP and the combination (Figure 4A). PIVKA-II also showed a superior AUROC for untreated patients (p<0.001 for both). The AUROC of the combination was significantly larger than that of AFP (p<0.01) for untreated patients (Figure 4B). When we compared the AUROCs of AFP, PIVKA-II or the combination between patients receiving therapy and those not receiving therapy, no significant differences were observed.
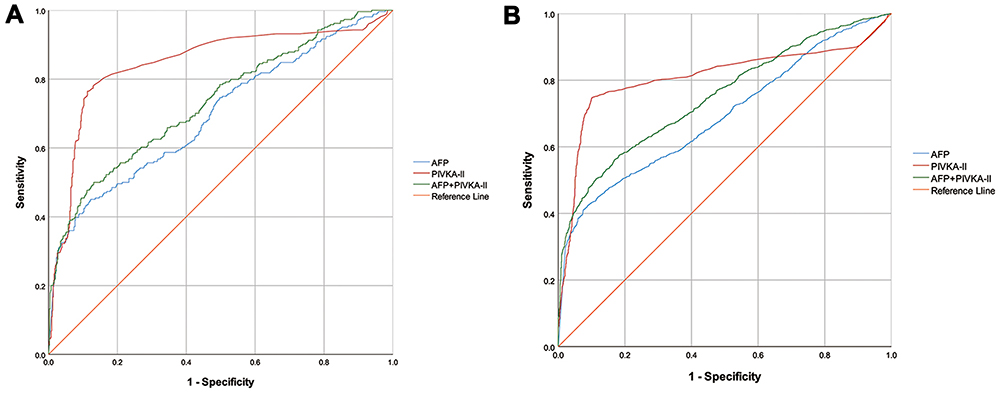 |
Figure 4 ROC curves of indicators and regression model for detecting HBV-related HCC. ROC curves of AFP, PIVKA-II and the combination of two tumor markers for detecting HBV-related HCC in the training set. (A) ROC curves of patients receiving NA treatment with AUROCs of 0.696 (95% CI, 0.657–0.736) for AFP, 0.847 (95% CI, 0.815–0.879) for PIVKA-II and 0.733 (95% CI, 0.695–0.770) for the combined two markers; (B) ROC curves of patients not receiving NA treatment with AUROCs of 0.692 (95% CI, 0.673–0.711) for AFP, 0.809 (95% CI, 0.792–0.826) for PIVKA-II and 0.751 (95% CI, 0.733–0.768) for the combination. |
More importantly, we determined that the optimal cut-off values of AFP and PIVKA-II were differed distinguishably between NA-treated and untreated patients. The optimal cut-off values of AFP were 104.60 ng/mL for NA-treated patients and 376.70 ng/mL for untreated patients obtained by maximizing the sum of sensitivity and specificity. Using a similar approach, the optimal cut-off values of PIVKA-II were 47.50 mAU/mL for NA-treated patients and 67.50 mAU/mL for untreated patients (Table 1). Because the optimal cut-off value for NA-treated patients was distinctly lower than that of untreated patients in the training set, we attempted to determine the most appropriate detection thresholds for AFP and PIVKA-II, especially for NA-treated patients, based on the common surveillance thresholds of AFP and PIVKA-II at present. It is generally believed that AFP≥400 ng/mL22,23 and PIVKA-II≥40 mAU/mL11,24–26 are thresholds for surveillance of HCC and indicate a high probability of HCC. Therefore, we kept the sensitivity or specificity as similar as possible when respectively adopting AFP=400 ng/mL and PIVKA-II=40 mAU/mL as common surveillance thresholds for HCC and determined the corresponding appropriate detection thresholds of AFP and PIVKA-II for NA-treated patients (Table 1). On one hand, the sensitivity and specificity were 40.26% and 92.58%, respectively, at the cut-off of 400 ng/mL for untreated patients. On the other hand, we obtained a similar sensitivity (40.15%) and a similar specificity (92.62%) at cut-off values of 141.25 ng/mL and 172.10 ng/mL respectively, for the treated patients. Next, we obtained 151.40 ng/mL (a sensitivity of 39.77% and a specificity of 92.17%) as the most appropriate detection threshold between 141.25 ng/mL and 172.10 ng/mL by maximizing the Youden index and the diagnostic odds ratio (DOR) simultaneously. Similarly, when the sensitivity and specificity were 84.39% and 50.25% at the cut-off of 40 mAU/mL for the untreated patients, close sensitivity (84.85%) and specificity (51.05%) could be achieved at the cut-off values of 35.50 mAU/mL and 29.50 mAU/mL respectively, for the treated patients. Therefore, we determined 35.50 mAU/mL (a sensitivity of 84.85% and a specificity of 69.43%) as the most appropriate detection threshold between 29.50 mAU/mL and 35.50 mAU/mL by maximizing the Youden index and the DOR simultaneously.
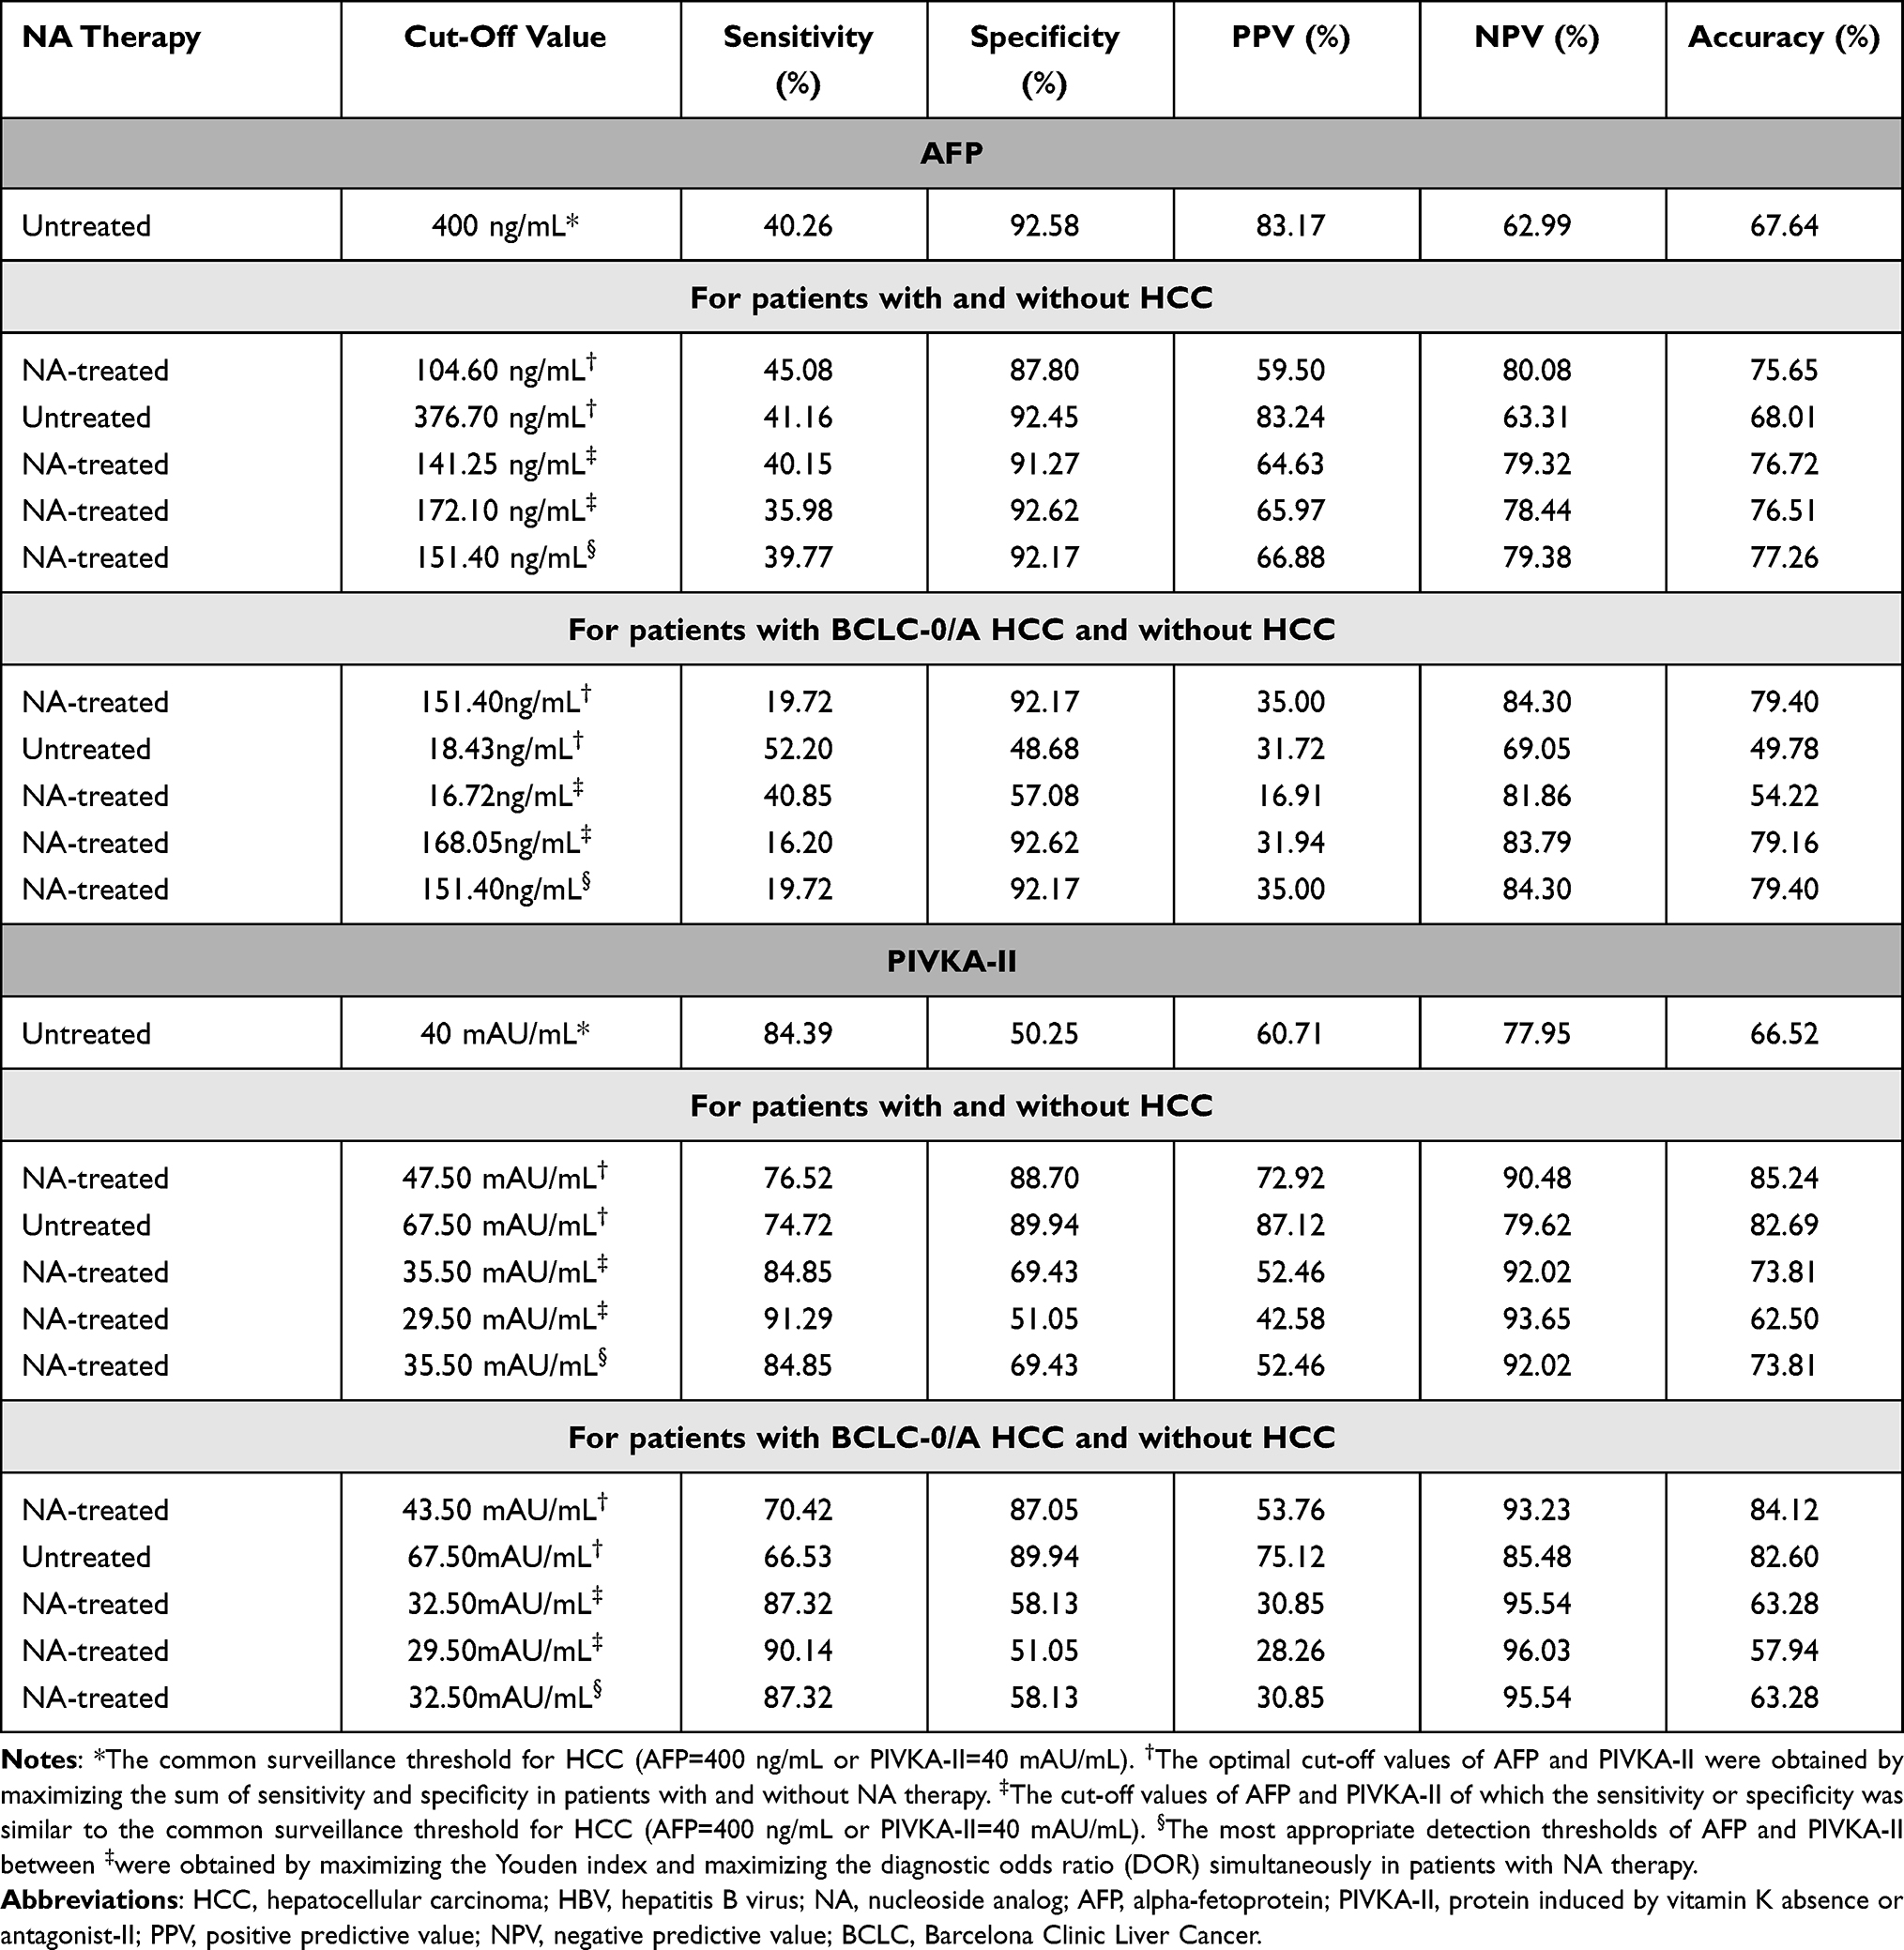 |
Table 1 HBV-Related HCC Detection Thresholds of Serum AFP and PIVKA-II in the Training Set |
Then we validated that adjusted cut-off values of AFP (151.40 ng/mL) and PIVKA-II (35.50 mAU/mL) were more appropriate to indicate high suspicion of HBV-related HCC for NA-treated patients. In the validation set, the sensitivity, specificity, PPV, NPV, and accuracy were 37.38%, 90.75%, 60.61%, 79.19% and 76.03%, respectively, at the cut-off of AFP=151.40 ng/mL for treated patients. In contrast, the sensitivity, specificity, PPV, NPV, and accuracy were 23.36%, 94.31%, 60.98%, 76.37% and 74.74%, respectively, at the cut-off of AFP=400 ng/mL for treated patients in the validation set. Similarly, we could achieve a sensitivity of 84.11%, a specificity of 71.17%, a PPV of 52.63%, an NPV of 92.17%, and an accuracy of 74.74% at the cut-off of PIVKA-II=35.50 mAU/mL for treated patients in the validation set while the sensitivity, specificity, PPV, NPV, and accuracy were 77.57%, 73.31%, 52.53%, 89.57% and 74.48% respectively at the cut-off of PIVKA-II=40 mAU/mL.
Using the similar approach, we also conducted a subgroup analysis for patients with BCLC-0/A HCC and without HCC (Table 1). In the subgroup analysis, we obtained AFP=151.40 ng/mL (a sensitivity of 19.72% and a specificity of 92.17%) and PIVKA-II=32.50 mAU/mL (a sensitivity of 87.32% and a specificity of 58.13%) as the most appropriate detection thresholds by maximizing the Youden index and the DOR simultaneously. Similarly, we validated that adjusted cut-off values of AFP (151.40 ng/mL) and PIVKA-II (32.50 mAU/mL) were more appropriate to indicate high suspicion of BCLC-0/A HCC for NA-treated patients. In the validation set, the sensitivity, specificity, PPV, NPV, and accuracy were 68.97%, 38.08%, 18.69%, 85.60% and 43.36%, respectively, at the cut-off of AFP=151.40 ng/mL for treated patients. In contrast, the sensitivity, specificity, PPV, NPV, and accuracy were 62.07%, 40.93%, 17.82%, 83.94% and 44.54%, respectively, at the cut-off of AFP=400 ng/mL for treated patients in the validation set. We could also achieve a sensitivity of 86.21%, a specificity of 53.02%, a PPV of 27.47%, an NPV of 94.90%, and an accuracy of 58.70% at the cut-off of PIVKA-II=32.50 mAU/mL for treated patients in the validation set while the sensitivity, specificity, PPV, NPV, and accuracy were 79.31%, 58.72%, 28.40%, 93.22% and 62.24% respectively at the cut-off of PIVKA-II=40 mAU/mL.
Logistic Regression Analyses and an Integrated Nomogram to Assess the Risk of HBV-Related Hepatocellular Carcinoma for NA-Treated Patients in the Training Set
We performed logistic regression analyses for NA-treated patients in the training set to determine the potential correlations between the hematological parameters or clinical parameters and HBV-related HCC. The results of regression analyses are shown in Table 2. The univariate analysis showed that male, old age, high AFP levels, high PIVKA-II levels and other factors were predictors of HBV-related HCC. The multivariate regression analysis selected male, old age, low ALT levels, low international normalized ratio (INR) levels, high gamma-glutamyl transferase (GGT) levels, low total bilirubin levels, high AFP levels and high PIVKA-II levels as independent predictors of HCC.
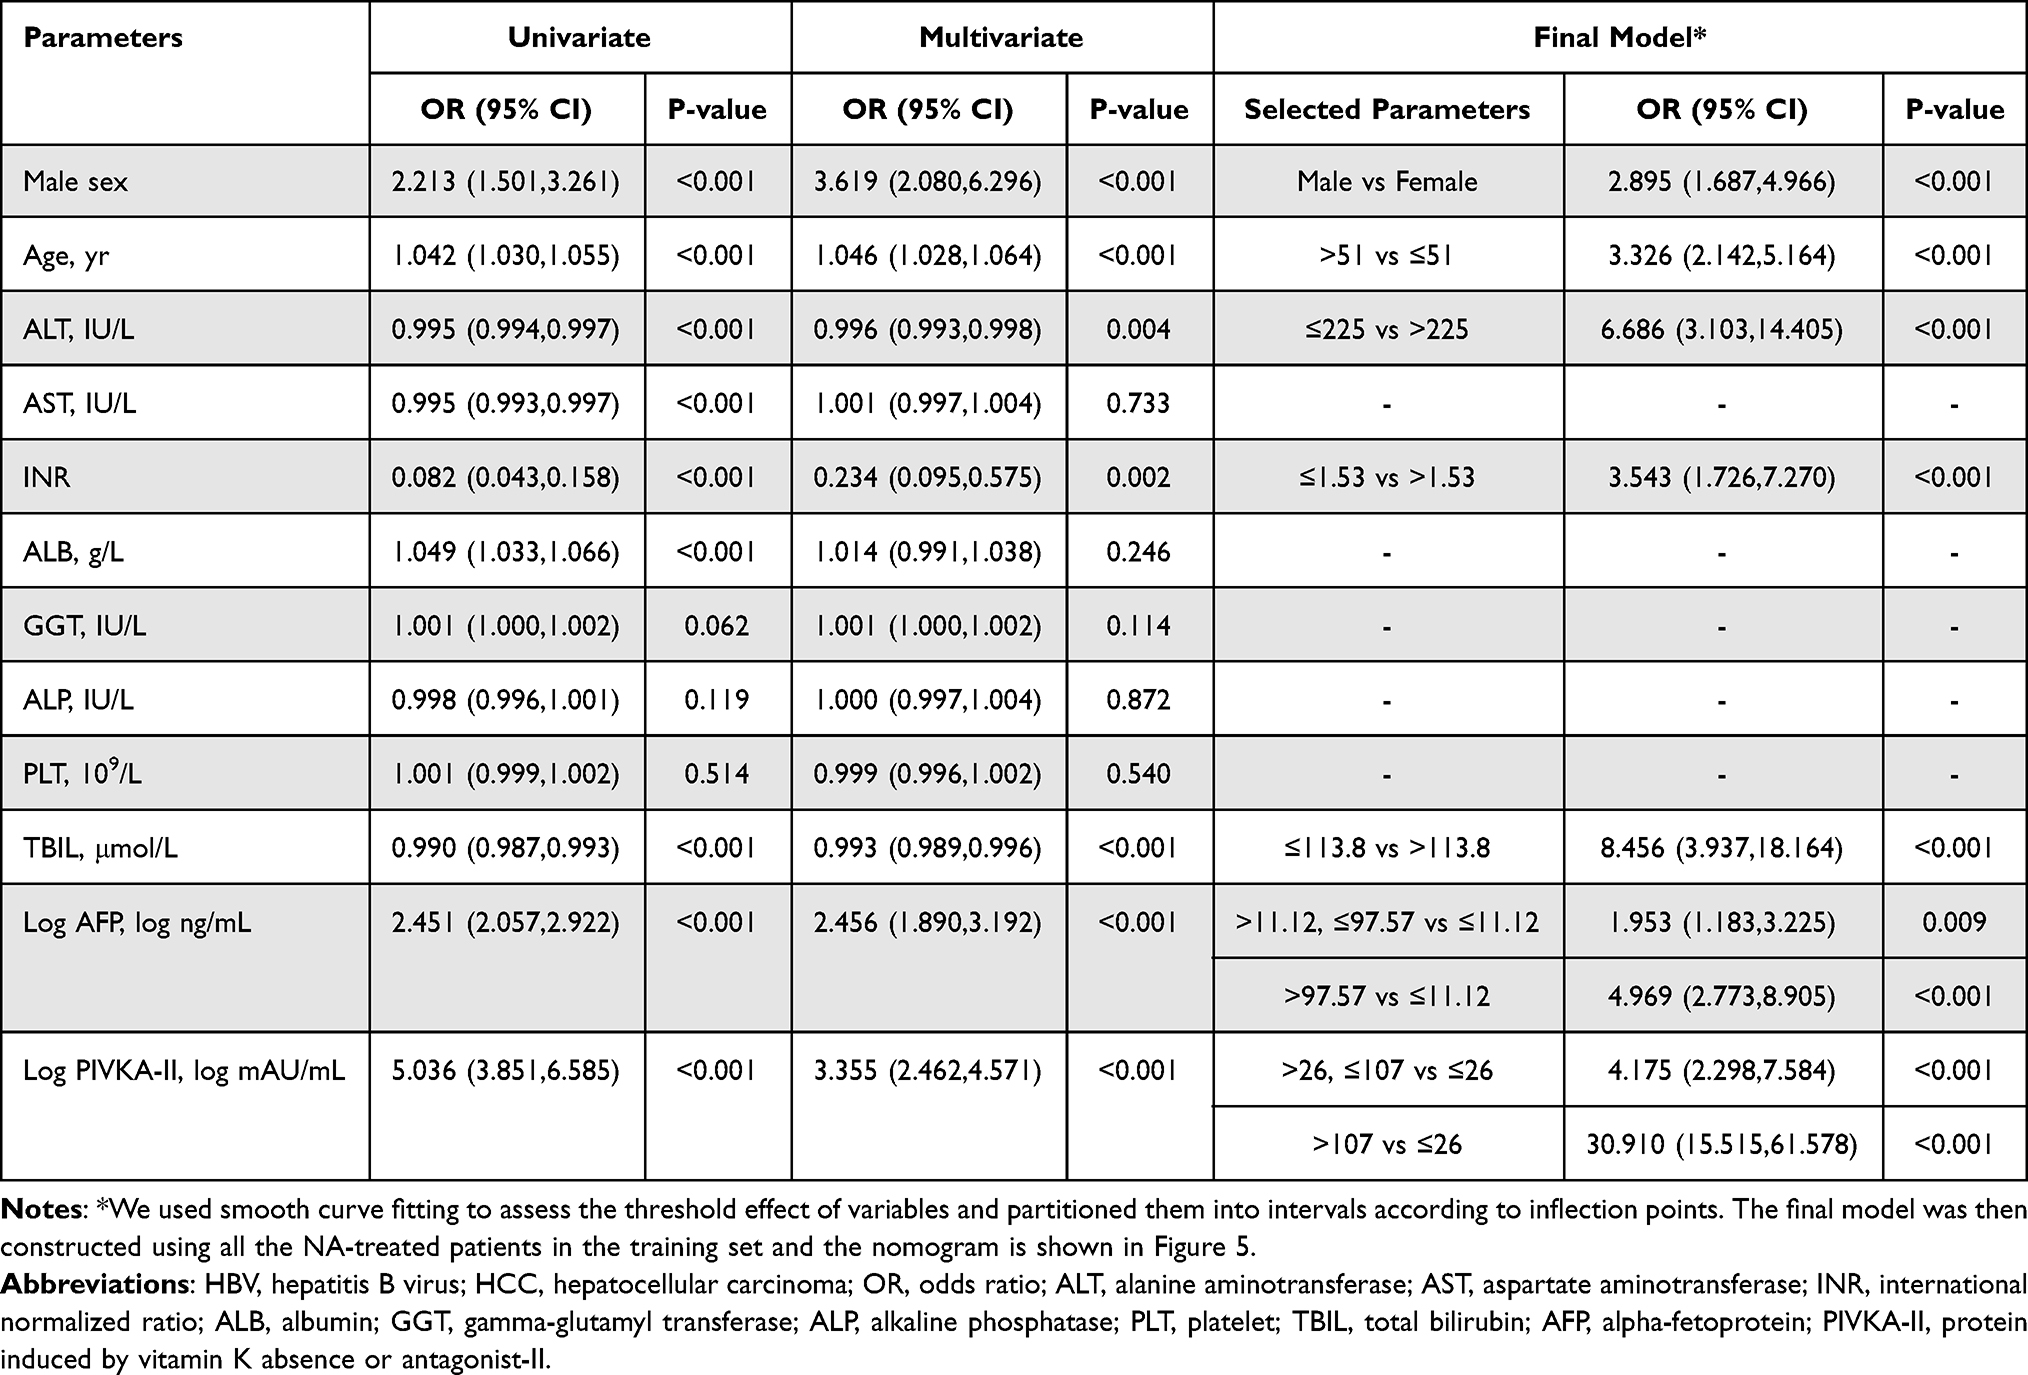 |
Table 2 Logistic Regression Analysis of Predictors of HBV-Related HCC for NA-Treated Patients |
 |
Figure 5 The nomogram predicting the risk of HBV-related HCC for NA-treated patients. The nomogram maps the predicted probability of HBV-related HCC on a scale of 0 to 400. For each covariate, please draw a vertical line upwards and note down the corresponding points. This is repeated for each covariate ending with a total score that corresponds to a predicted probability of HBV-related HCC at the bottom of the nomogram. |
We next assessed the threshold effect of every independent predictor except the gender (Figure S1) and partitioned variables into intervals according to inflection points. The multivariate logistic regression model was constructed using all the NA-treated patients in the training set for predicting the risk of HBV-related HCC and the nomogram is shown in Figure 5 with an AUROC of 0.914 (95% CI, 0.893–0.935).
Then we used all the untreated patients and NA-treated patients in the validation set to assess the validity of the logistic regression model respectively. When the nomogram was applied to untreated patients, the AUROC was 0.864 (95% CI, 0.854–0.875). The corresponding ROCs and comparison of calibration curves are shown in Figure 6A and B. When the nomogram was validated in NA-treated patients in the validation set, we got an AUROC of 0.868 (95% CI, 0.827–0.909). The ROCs and calibration curves are shown in Figure 6C and D. In addition, we purposely applied the nomogram to NA-treated patients with BCLC-0/A HCC and without HCC in the validation set to validate the performance of the nomogram in early-stage (BCLC-0/A) HBV-related HCC. The AUROC was 0.856 (95% CI, 0.809–0.903). The corresponding ROCs and calibration curves are shown in Figure 6E and F. The ROC curve analysis and outcomes of calibration curves showed that the regression model could indicate a high risk of HBV-related HCC with relatively satisfactory AUROC and fitting effect, especially for NA-treated patients. The analyses of ROCs and calibration curves also indicate that the nomogram could be used as a convenient and affordable screening tool to detect early-stage HBV-related HCC.
 |
Figure 6 ROC curves and calibration curves for the validation of the nomogram (A) The comparison of ROC curves between NA-treated patients in the training set and all untreated patients. The AUROCs were 0.914 (95% CI, 0.893–0.935) and 0.864 (95% CI, 0.854–0.875) respectively. (B) The comparison of calibration curves between NA-treated patients in the training set and all untreated patients. (C) The comparison of ROC curves between NA-treated patients in the training set and NA-treated patients in the validation set. The AUROCs were 0.914 (95% CI, 0.893–0.935) and 0.868 (95% CI, 0.827–0.909) respectively. (D) The comparison of calibration curves between NA-treated patients in the training set and NA-treated patients in the validation set. (E) The comparison of ROC curves between NA-treated patients in the training set and NA-treated patients with BCLC-0/A HCC and without HCC in the validation set. The AUROCs were 0.914 (95% CI, 0.893–0.935) and 0.856 (95% CI, 0.809–0.903) respectively. (F) The comparison of calibration curves between NA-treated patients in the training set and NA-treated patients with BCLC-0/A HCC and without HCC in the validation set. |
Additionally, we also compared the nomogram with AFP, PIVKA-II and the combination of AFP and PIVKA-II in NA-treated patients in the validation set. The ROC curves and decision curve analysis (DCA) curves are shown in Figure 7. The comprehensive comparison by considering AUROCs and DCA curves simultaneously indicated that the detection performance of the new logistic regression model was better than that of AFP, PIVKA-II or the combination of both.
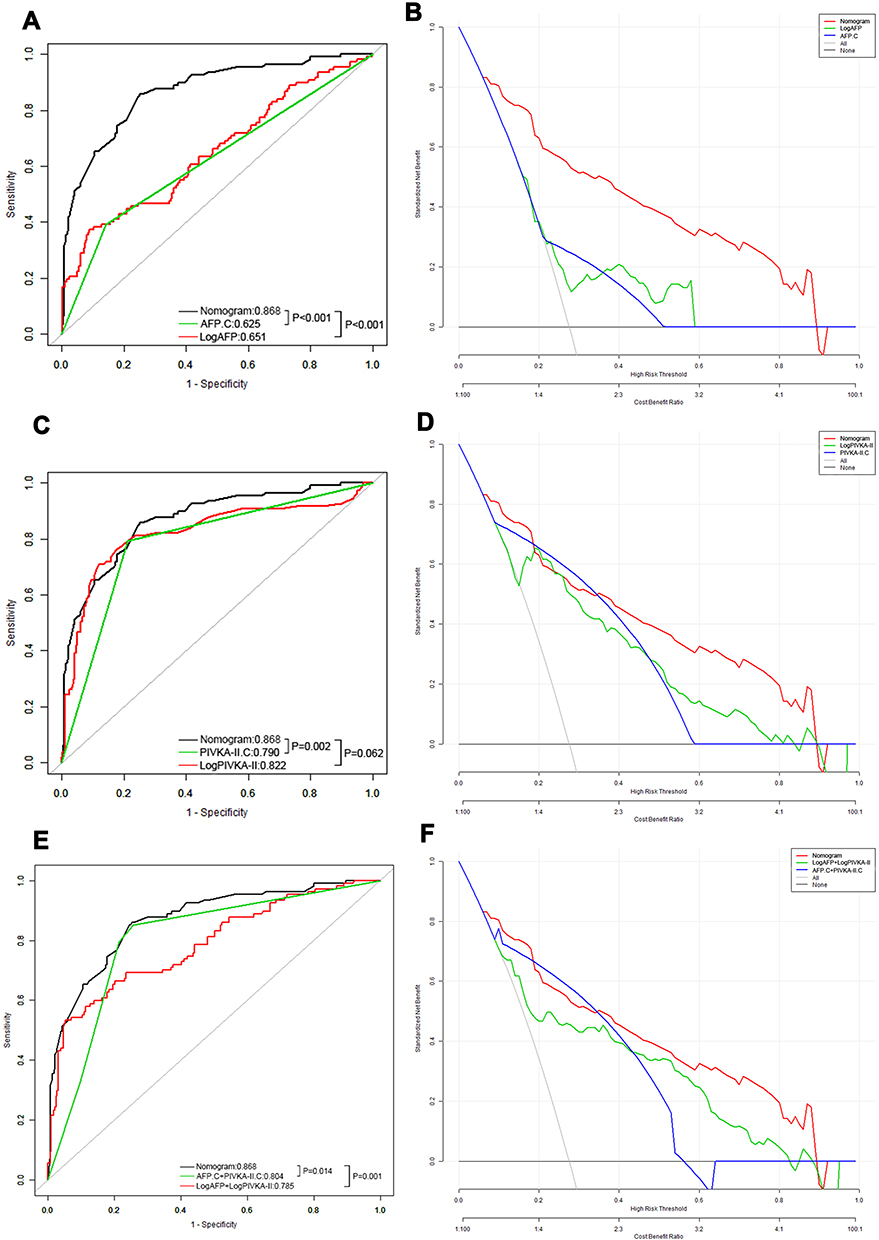 |
Figure 7 ROC curves and decision curve analysis (DCA) curves for the comparison among the nomogram, AFP and PIVKA-II. (A and B): The comparison of ROC curves and DCA curves among the nomogram, AFP.C and LogAFP in NA-treated patients in the validation set. The AUROCs were 0.868 (95% CI, 0.827–0.909), 0.625 (95% CI, 0.574–0.676) and 0.651 (95% CI, 0.587–0.715) respectively. (C and D): The comparison of ROC curves and DCA curves among the nomogram, PIVKA-II.C and LogPIVKA-II in NA-treated patients in the validation set. The AUROCs were 0.868 (95% CI, 0.827–0.909), 0.790 (95% CI, 0.745–0.836) and 0.822 (95% CI, 0.768–0.877) respectively. (E and F): The comparison of ROC curves and DCA curves among the nomogram, the combination of AFP.C and PIVKA-II.C and the combination of LogAFP and LogPIVKA-II in NA-treated patients in the validation set. The AUROCs were 0.868 (95% CI, 0.827–0.909), 0.804 (95% CI, 0.759–0.850) and 0.785 (95% CI, 0.731–0.840) respectively. AFP.C means that AFP≥100 ng/mL was adopted as the cut-off value for the diagnosis of HCC. PIVKA-II.C means that PIVKA-II≥40 mAU/mL was adopted as the cut-off value for the diagnosis of HCC. |
Discussion
In this real-world study, we compared the levels of serum AFP and PIVKA-II between patients receiving NA treatment and those not receiving NA treatment, determined the more reasonable detection thresholds of AFP and PIVKA-II for NA-treated patients, and built a logistic regression model to assess the risk of HBV-related HCC in patients with CHB.
When we made comparisons for patients with CHB, cirrhosis or HCC, the results indicated that NA treatment might reduce the levels of serum AFP and PIVKA-II in CHB patients, which became the basis of our subsequent study. A few studies have investigated the relationship between NAs and AFP or PIVKA-II in CHB patients and reached the similar results.13,14 Some researchers have tried to clarify the associated mechanisms.12 Zhang et al found that the expression of the AFP gene in hepatic cells was reported to be activated and to participate in hepatitis B virus x protein (HBx)-induced hepatocarcinogenesis.27
We also compared AFP and PIVKA-II among patients with CHB, HBV-induced cirrhosis and HBV-related HCC and obtained lower serum AFP and PIVKA-II levels in CHB and HBV-related cirrhosis patients than in HBV-related HCC patients, which corroborates findings from previous studies.28
In this study, we compared the detection performances of AFP, PIVKA-II and the combined two markers in NA-treated and untreated patients. We determined that serum PIVKA-II showed the best AUROC in both NA-treated and untreated patients. However, significant differences in detection performance between AFP and the combination were not observed in the treated patients but were observed in the untreated patients. The comparison between the detection performance of AFP and PIVKA-II remains controversial.26,29 Nevertheless, more studies have reported that PIVKA-II is superior to AFP for HCC surveillance,8,10 especially for HBV-related HCC.30 It is still disputable whether the combination of AFP and PIVKA-II can improve the diagnostic effectiveness.29 However, Durazo et al showed that the combination was no more accurate than PIVKA-II alone, which is similar to our finding.10
By maximizing the Youden index, we determined that the optimal cut-off values for AFP were 104.60 ng/mL for NA-treated patients and 376.70 ng/mL for untreated patients. The optimal cut-off values for PIVKA-II were 47.50 mAU/mL for NA-treated patients and 67.50 mAU/mL for untreated patients in the training set. Previous studies have determined a range of 10 to 400 ng/mL as the cut-off values of serum AFP.31,32 However, a very recent meta-analysis and the recent standardization for diagnosis and treatment in China recommended that AFP=400 ng/mL should be adopted as the threshold for HCC detection.22,23 Regarding PIVKA-II, most studies have recommended 40 mAU/mL as the cut-off value,24–26 especially in Asian countries.11 Therefore, we determined that the appropriate detection threshold of AFP was 151.40 ng/mL and that of PIVKA-II was 35.50 mAU/mL for NA-treated patients under the premise of maintaining sensitivity or specificity similar to recommended thresholds (AFP=400 ng/mL and PIVKAII=40 mAU/mL) and maximizing the Youden index and the DOR simultaneously. Except for Kobashi et al14 hardly any other similar studies regarding NA-treated patients could be found. Furthermore, we also use the same approach to conduct a subgroup analysis to determine the appropriate early detection thresholds of AFP (151.40 ng/mL) and PIVKA-II (32.50 mAU/mL) for BCLC-0/A HCC patients who were treated by NAs. For patients with BCLC-0/A HCC and without HCC in the training set, we found that the optimal cut-off values of AFP for untreated patients (18.43 ng/mL) was lower than NA-treated patients (151.40 ng/mL). The reasons for this may be manifold. On the one hand, it has been reported that the level of AFP in early-stage HCC was lower than in middle-stage HCC or late-stage HCC.33,34 On the other hand, Yuan et al35 found that after a 12-month antiviral treatment for CHB patients with positive AFP, more than half of individuals remained AFP-positive and non-AFP response to antiviral treatment was independent factors associated with HCC occurrence, which may partially explain the results. In addition, AFP levels of patients with hepatic necro-inflammation were often elevated and the liver cell regeneration process upon liver injury was always accompanied by AFP production.36,37 Previous studies have reported that NA treatment may lead to immune regulation, inflammation response or even abnormal liver function for CHB patients.38–40 This is perhaps another reason for the higher AFP level in NA-treated patients than untreated patients. The new detection thresholds, which are lower than the previously recommended thresholds, are validated to be able to indicate high suspicion of HBV-related HCC and BCLC-0/A HCC with a relatively larger Youden index and DOR, especially for NA-treated patients.
Because NA treatment has been recommended for CHB patients,5–7 we should pay more attention to the patients receiving NA treatment when predicting the risk of HBV-related HCC. Another significant finding is the risk prediction model for HBV-related HCC, in which, AFP and PIVKA-II play important roles. Previous studies tended to incorporate age, sex, and hepatic function and the AUROCs of models ranged from about 0.78 to about 0.935.15–17,41 In 2014, Johnson et al42 developed the GALAD model and the diagnostic performance of the GALAD model has been validated in China, the UK, Germany, Japan and the USA.20,43,44 A recent study performed external validations to compare the predictability of REACH-B, PAGE-B, mPAGE-B and CU-HCC in patients with CHB in China and the AUROCs of those scores ranged from 0.703 to 0.825.45 Compared to previous studies, our model includes a larger number of NA-treated patients, includes more comprehensive partitioned indicators which were convenient for practical application, and achieves better detection performance for HBV-related HCC especially in NA-treated patients. It is worth mentioning that our model was validated to be able to detect early-stage (BCLC-0/A) HCC with relatively good AUROC and fitting effect, which will further help in the early diagnosis and early treatment of HBV-related HCC. ALT≤225IU/L and total bilirubin (TBIL)≤113.8μmol/L were found to be correlated with HCC in the nomogram. It might be attributed to the close association between high ALT or TBIL levels and liver failure,46,47 and we initially excluded patients with hepatic failure and other severe complications as the exclusion criteria.
However, there are still some limitations in our study. First, our study was a retrospective cross-sectional design using patients from a single center and we had not performed propensity score matching. More longitudinal follow-up data will improve the grade evidence of the outcomes and long-term follow-up prospective multicenter studies are needed to support our conclusions. Second, most of patients included were Chinese and the applicability of our outcomes to people in different countries remains to be verified. Third, some indicators such as Lens culinaris agglutinin-reactive fraction of alpha-fetoprotein (AFP-L3) and osteopontin (OPN) were not included due to higher examination costs of patients. Fourth, compared with previous studies,48,49 the newly established AFP cut-off value provided limited sensitivity when solely diagnosing HCC. This could be partly due to the heterogeneity of the different populations and partly due to the approach for obtaining the thresholds. When determining the thresholds, we adopted AFP=400 ng/mL as the reference and the cut-off value of AFP in our study was determined by maximizing the Youden index and the DOR simultaneously, which took both the sensitivity and specificity into account.
Conclusions
In conclusion, we demonstrated that the levels of AFP and PIVKA-II in NA-treated patients were significantly lower than those in untreated patients, regardless of whether the patients had CHB, HBV-induced cirrhosis or HBV-related HCC. Moreover, this study showed that the optimal detection thresholds of AFP and PIVKA-II were 104.60 ng/mL and 47.50 mAU/mL, respectively, and the most appropriate thresholds changed to become 151.40 ng/mL and 35.50 mAU/mL, respectively, based on the present common detection thresholds, which indicated the markedly elevated risk of HBV-related HCC for NA-treated patients. As for BCLC-0/A HCC, detection thresholds of AFP and PIVKA-II should change to be 151.40 ng/mL and 32.50 mAU/mL. In addition, we constructed a logistic regression model composed of gender, age, ALT, INR, TBIL, AFP and PIVKA-II that can better predict the risk of HBV-related HCC and early-stage (BCLB-0/A) HCC for NA-treated CHB patients.
Abbreviations
AFP, alpha-fetoprotein; PIVKA-II, des-gamma-carboxy prothrombin; HCC, hepatocellular carcinoma; CHB, chronic hepatitis B; NA, nucleoside analog; HBV, Hepatitis B virus; ETV, entecavir; TDF, tenofovir; LS, liver stiffness; ALT, alanine aminotransferase; INR, international normalized ratio; PLT, platelet; TBIL, total bilirubin; GGT, gamma-glutamyl transferase; US, ultrasonography; CT, computed tomography; MRI, magnetic resonance imaging; IFN, interferon; ALD, autoimmune liver disease; AIDS, acquired immune deficiency syndrome; ROC, receiver operating characteristic; PPV, positive-predictive value; NPV, negative-predictive value; AUROC, area under the receiver operating characteristic curve; CI, confidence interval; DOR, diagnostic odds ratio; DCA, decision curve analysis; OPN, osteopontin.
Data Sharing Statement
The datasets generated and analyzed during the current study are available from the corresponding author on reasonable request.
Ethics Approval and Informed Consent
This study was conducted in accordance with the Declaration of Helsinki and was approved by the Medical Ethics Committee of West China Hospital. The IRB number is 2019022. The need for informed consent was waived by the Medical Ethics Committee because the study was an observational, retrospective study using a database from which the patients’ identifying information had been removed. All methods were carried out in accordance with relevant guidelines and regulations.
Author Contributions
All authors made a significant contribution to the work reported, whether that is in the conception, study design, execution, acquisition of data, analysis and interpretation, or in all these areas; have drafted, revised or critically reviewed the article; read and approved the final manuscript; have agreed on the journal to which the article would be submitted; and agree to take responsibility for the contents of the article.
Funding
This research was supported by the Science and Technology Program of Sichuan Science and Technology Department (No. 2019YFS0029, 2019YFS0529), the National Natural Science Foundation of China (No. 81770566, 82000599) and the New Medical Technology Foundation of West China Hospital of Sichuan University (No. XJS2016004). Corresponding author Wentao Wang and Shu Shen are the guarantors. The funding body financed the costs of the study and contributed to the design of the study, interpretation of data, and revising the manuscript.
Disclosure
The authors report no conflict of interest.
References
1. Venook AP, Papandreou C, Furuse J, de Guevara LL. The incidence and epidemiology of hepatocellular carcinoma: a global and regional perspective. Oncologist. 2010;15(Suppl 4):5–13. doi:10.1634/theoncologist.2010-S4-05
2. Razavi-Shearer D, Gamkrelidze I, Nguyen MH, et al. Global prevalence, treatment, and prevention of hepatitis B virus infection in 2016: a modelling study. Lancet Gastroenterol Hepatol. 2018;3(6):383–403. doi:10.1016/S2468-1253(18)30056-6
3. Perz JF, Armstrong GL, Farrington LA, Hutin YJF, Bell BP. The contributions of hepatitis B virus and hepatitis C virus infections to cirrhosis and primary liver cancer worldwide. J Hepatol. 2006;45(4):529–538. doi:10.1016/j.jhep.2006.05.013
4. Lok AS, McMahon BJ, Brown RJ, et al. Antiviral therapy for chronic hepatitis B viral infection in adults: a systematic review and meta-analysis. Hepatology. 2016;63(1):284–306. doi:10.1002/hep.28280
5. Sarin SK, Kumar M, Lau GK, et al. Asian-Pacific clinical practice guidelines on the management of hepatitis B: a 2015 update. Hepatol Int. 2016;10(1):1–98.
6. Lampertico P, Agarwal K, Berg T, et al. EASL 2017 clinical practice guidelines on the management of hepatitis B virus infection. J Hepatol. 2017;67(2):370–398. doi:10.1016/j.jhep.2017.03.021
7. Terrault NA, Lok ASF, McMahon BJ, et al. Update on prevention, diagnosis, and treatment of chronic hepatitis B: AASLD 2018 hepatitis B guidance. Hepatology. 2018;67(4):1560–1599.
8. Lim TS, Kim DY, Han KH, et al. Combined use of AFP, PIVKA-II, and AFP-L3 as tumor markers enhances diagnostic accuracy for hepatocellular carcinoma in cirrhotic patients. Scand J Gastroenterol. 2016;51(3):344–353. doi:10.3109/00365521.2015.1082190
9. Bruix J, Sherman M. Management of hepatocellular carcinoma: an update. Hepatology. 2011;53(3):1020–1022. doi:10.1002/hep.24199
10. Durazo FA, Blatt LM, Corey WG, et al. Des-γ-carboxyprothrombin, α-fetoprotein and AFP-L3 in patients with chronic hepatitis, cirrhosis and hepatocellular carcinoma. J Gastroen Hepatol. 2008;23(10):1541–1548. doi:10.1111/j.1440-1746.2008.05395.x
11. Sultanik P, Ginguay A, Vandame J, et al. Diagnostic accuracy of des-gamma-carboxy prothrombin for hepatocellular carcinoma in a French cohort using the Lumipulse® G600 analyzer. J Viral Hepatitis. 2017;24(1):80–85. doi:10.1111/jvh.12622
12. Inagaki Y, Tang W, Makuuchi M, Hasegawa K, Sugawara Y, Kokudo N. Clinical and molecular insights into the hepatocellular carcinoma tumour marker des-γ-carboxyprothrombin. Liver Int. 2011;31(1):22–35. doi:10.1111/j.1478-3231.2010.02348.x
13. Luo K, Liu Z, Karayiannis P. Effect of antiviral treatment on alfa-fetoprotein levels in HBV-related cirrhotic patients: early detection of hepatocellular carcinoma. J Viral Hepatitis. 2009. doi:10.1111/j.1365-2893.2009.01208.x
14. Kobashi H, Miyake Y, Ikeda F, et al. Long-term outcome and hepatocellular carcinoma development in chronic hepatitis B or cirrhosis patients after nucleoside analog treatment with entecavir or lamivudine. Hepatol Res. 2011;41(5):405–416. doi:10.1111/j.1872-034X.2011.00785.x
15. Yuen MF, Tanaka Y, Fong DY, et al. Independent risk factors and predictive score for the development of hepatocellular carcinoma in chronic hepatitis B. J Hepatol. 2009;50(1):80–88. doi:10.1016/j.jhep.2008.07.023
16. Papatheodoridis G, Dalekos G, Sypsa V, et al. PAGE-B predicts the risk of developing hepatocellular carcinoma in Caucasians with chronic hepatitis B on 5-year antiviral therapy. J Hepatol. 2016;64(4):800–806. doi:10.1016/j.jhep.2015.11.035
17. Yang H, Yuen M, Chan HL, et al. Risk estimation for hepatocellular carcinoma in chronic hepatitis B (REACH-B): development and validation of a predictive score. Lancet Oncol. 2011;12(6):568–574. doi:10.1016/S1470-2045(11)70077-8
18. Jung KS, Kim SU, Song K, et al. Validation of hepatitis B virus-related hepatocellular carcinoma prediction models in the era of antiviral therapy. Hepatology. 2015;62(6):1757–1766. doi:10.1002/hep.28115
19. Schotten C, Ostertag B, Sowa JP, et al. GALAD score detects early-stage hepatocellular carcinoma in a European cohort of chronic hepatitis B and C patients. Pharmaceuticals. 2021;14(8):735. doi:10.3390/ph14080735
20. Yang JD, Addissie BD, Mara KC, et al. GALAD score for hepatocellular carcinoma detection in comparison with liver ultrasound and proposal of GALADUS score. Cancer Epidemiol Biomarkers Prev. 2019;28(3):531–538. doi:10.1158/1055-9965.EPI-18-0281
21. DeLong ER, DeLong DM, Clarke-Pearson DL. Comparing the areas under two or more correlated receiver operating characteristic curves: a nonparametric approach. Biometrics. 1988;44(3):837–845. doi:10.2307/2531595
22. Zhou J, Sun H, Wang Z, et al. Guidelines for the Diagnosis and Treatment of Hepatocellular Carcinoma (2019 Edition). Liver Cancer. 2020; 9(6):682–720
23. Zhang J, Chen G, Zhang P, et al. The threshold of alpha-fetoprotein (AFP) for the diagnosis of hepatocellular carcinoma: a systematic review and meta-analysis. PLoS One. 2020;15(2):e228857.
24. Li C, Zhang Z, Zhang P, Liu J. Diagnostic accuracy of des-gamma-carboxy prothrombin versus α-fetoprotein for hepatocellular carcinoma: a systematic review. Hepatol Res. 2014;44(10):E11–E25. doi:10.1111/hepr.12201
25. Tateishi R, Yoshida H, Matsuyama Y, Mine N, Kondo Y, Omata M. Diagnostic accuracy of tumor markers for hepatocellular carcinoma: a systematic review. Hepatol Int. 2008;2(1):17–30. doi:10.1007/s12072-007-9038-x
26. Marrero JA, Feng Z, Wang Y, et al. α-fetoprotein, des-γ carboxyprothrombin, and lectin-bound α-fetoprotein in early hepatocellular carcinoma. Gastroenterology. 2009;137(1):110–118. doi:10.1053/j.gastro.2009.04.005
27. Zhang C, Chen X, Liu H, et al. Alpha fetoprotein mediates HBx induced carcinogenesis in the hepatocyte cytoplasm. Int J Cancer. 2015;137(8):1818–1829. doi:10.1002/ijc.29548
28. Yamamoto K, Imamura H, Matsuyama Y, et al. Significance of alpha-fetoprotein and des-γ-carboxy prothrombin in patients with hepatocellular carcinoma undergoing hepatectomy. Ann Surg Oncol. 2009;16(10):2795–2804. doi:10.1245/s10434-009-0618-y
29. Yu R, Ding S, Tan W, et al. Performance of protein induced by vitamin K absence or antagonist-II (PIVKA-II) for hepatocellular carcinoma screening in Chinese population. Hepat Mon. 2015;15(7). doi:10.5812/hepatmon.28806v2.
30. Ji J, Wang H, Li Y, et al. Diagnostic evaluation of des-gamma-carboxy prothrombin versus α-fetoprotein for hepatitis B virus-related hepatocellular carcinoma in china: a large-scale, multicentre study. PLoS One. 2016;11(4):e153227. doi:10.1371/journal.pone.0153227
31. Chan SL, Mo F, Johnson PJ, et al. Performance of serum α-fetoprotein levels in the diagnosis of hepatocellular carcinoma in patients with a hepatic mass. HPB. 2014;16(4):366–372. doi:10.1111/hpb.12146
32. Trevisani F, D’Intino PE, Morselli-Labate AM, et al. Serum alpha-fetoprotein for diagnosis of hepatocellular carcinoma in patients with chronic liver disease: influence of HBsAg and anti-HCV status. J Hepatol. 2001;34(4):570–575. doi:10.1016/S0168-8278(00)00053-2
33. Zhang L, Wu GY, Wu YJ, Liu SY. The serum metabolic profiles of different Barcelona stages hepatocellular carcinoma associated with hepatitis B virus. Oncol Lett. 2018;15(1):956–962.
34. Liu C, Xiao GQ, Yan LN, et al. Value of alpha-fetoprotein in association with clinicopathological features of hepatocellular carcinoma. World J Gastroenterol. 2013;19(11):1811–1819. doi:10.3748/wjg.v19.i11.1811
35. Yuan G, Zhou Y, Liu J, et al. AFP specificity for HCC surveillance is increased by mitigating liver injury among treated chronic hepatitis B patients with elevated AFP. Int J Clin Exp Pathol. 2019;12(4):1315–1323.
36. Wang L, Huang J, Jiang M, Zheng X. AFP computational secreted network construction and analysis between human hepatocellular carcinoma (HCC) and no-tumor hepatitis/cirrhotic liver tissues. Tumour Biol. 2010;31(5):417–425. doi:10.1007/s13277-010-0050-8
37. Notarpaolo A, Layese R, Magistri P, et al. Validation of the AFP model as a predictor of HCC recurrence in patients with viral hepatitis-related cirrhosis who had received a liver transplant for HCC. J Hepatol. 2017;66(3):552–559. doi:10.1016/j.jhep.2016.10.038
38. Cai D, Pan C, Yu W, et al. Comparison of the long-term efficacy of tenofovir and entecavir in nucleos(t)ide analogue-naive HBeAg-positive patients with chronic hepatitis B: a large, multicentre, randomized controlled trials. Medicine. 2019;98(1):e13983. doi:10.1097/MD.0000000000013983
39. Zhang JY, Song CH, Shi F, Zhang Z, Fu JL, Wang FS. Decreased ratio of Treg cells to Th17 cells correlates with HBV DNA suppression in chronic hepatitis B patients undergoing entecavir treatment. PLoS One. 2010;5(11):e13869. doi:10.1371/journal.pone.0013869
40. Chang TT, Lai CL, Kew YS, et al. Entecavir treatment for up to 5 years in patients with hepatitis B e antigen-positive chronic hepatitis B. Hepatology. 2010;51(2):422–430. doi:10.1002/hep.23327
41. Tseng CH, Tseng CM, Wu JL, Hsu YC, El-Serag HB. Magnitude of and prediction for risk of hepatocellular carcinoma in patients with chronic hepatitis B taking entecavir or tenofovir therapy: a systematic review. J Gastroen Hepatol. 2020;35:1684–1693. doi:10.1111/jgh.15078
42. Johnson PJ, Pirrie SJ, Cox TF, et al. The detection of hepatocellular carcinoma using a prospectively developed and validated model based on serological biomarkers. Cancer Epidem Biomar. 2014;23(1):144–153. doi:10.1158/1055-9965.EPI-13-0870
43. Berhane S, Toyoda H, Tada T, et al. Role of the GALAD and BALAD-2 serologic models in diagnosis of hepatocellular carcinoma and prediction of survival in patients. Clin Gastroenterol Hepatol. 2016;14(6):875–886.
44. Liu M, Wu R, Liu X, et al. Validation of the GALAD model and establishment of GAAP model for diagnosis of hepatocellular carcinoma in Chinese patients. J Hepatocell Carcinoma. 2020;7:219–232. doi:10.2147/JHC.S271790
45. Lou T, Li B, Xiong P, Jin C, Chen Y. External validation of hepatocellular carcinoma risk scores in patients with chronic hepatitis B virus infection in China. J Viral Hepat. 2021. doi:10.1111/jvh.13569
46. Wu T, Li J, Shao L, et al. Development of diagnostic criteria and a prognostic score for hepatitis B virus-related acute-on-chronic liver failure. GUT. 2018;67(12):2181–2191. doi:10.1136/gutjnl-2017-314641
47. Liu H, Zhang H, Wan G, et al. Neutrophil-lymphocyte ratio: a novel predictor for short-term prognosis in acute-on-chronic hepatitis B liver failure. J Viral Hepatitis. 2014;21(7):499–507. doi:10.1111/jvh.12160
48. Wong GL, Chan HL, Tse YK, et al. On-treatment alpha-fetoprotein is a specific tumor marker for hepatocellular carcinoma in patients with chronic hepatitis B receiving entecavir. Hepatology. 2014;59(3):986–995. doi:10.1002/hep.26739
49. Kim GA, Seock CH, Park JW, et al. Reappraisal of serum alpha-foetoprotein as a surveillance test for hepatocellular carcinoma during entecavir treatment. Liver Int. 2015;35(1):232–239. doi:10.1111/liv.12516
 © 2021 The Author(s). This work is published and licensed by Dove Medical Press Limited. The
full terms of this license are available at https://www.dovepress.com/terms
and incorporate the Creative Commons Attribution
- Non Commercial (unported, 3.0) License.
By accessing the work you hereby accept the Terms. Non-commercial uses of the work are permitted
without any further permission from Dove Medical Press Limited, provided the work is properly
attributed. For permission for commercial use of this work, please see paragraphs 4.2 and 5 of our Terms.
© 2021 The Author(s). This work is published and licensed by Dove Medical Press Limited. The
full terms of this license are available at https://www.dovepress.com/terms
and incorporate the Creative Commons Attribution
- Non Commercial (unported, 3.0) License.
By accessing the work you hereby accept the Terms. Non-commercial uses of the work are permitted
without any further permission from Dove Medical Press Limited, provided the work is properly
attributed. For permission for commercial use of this work, please see paragraphs 4.2 and 5 of our Terms.