Back to Journals » Cancer Management and Research » Volume 11
New Preoperative Nomogram Using the Centrality Index to Predict High Nuclear Grade Clear Cell Renal Carcinoma
Authors Feng Z, Lou S, Zhang L, Zhang L, Lan W, Wang M, Shen Q, Hu Z, Chen F ![]()
Received 2 September 2019
Accepted for publication 2 December 2019
Published 3 January 2020 Volume 2019:11 Pages 10921—10928
DOI https://doi.org/10.2147/CMAR.S229571
Checked for plagiarism Yes
Review by Single anonymous peer review
Peer reviewer comments 4
Editor who approved publication: Dr Eileen O'Reilly
Zhan Feng,1 Shuangshuang Lou,1 Lixia Zhang,1 Liang Zhang,2 Wenting Lan,3 Minhong Wang,4 Qijun Shen,5 Zhengyu Hu,6 Feng Chen1
1Department of Radiology, The First Affiliated Hospital, College of Medicine, Zhejiang University, Hangzhou 310003, People’s Republic of China; 2Department of Radiology, Zhejiang Cancer Hospital, Hangzhou 310003, People’s Republic of China; 3Department of Radiology, Ningbo First Hospital, Ningbo 315000, People’s Republic of China; 4Department of Radiology, Yijishan Hospital of Wannan Medical College, Wuhu 241000, People’s Republic of China; 5Department of Radiology, Hangzhou First People’s Hospital, Hangzhou 310003, People’s Republic of China; 6Department of Radiology, Second People’s Hospital of Yuhang District, Hangzhou 310003, People’s Republic of China
Correspondence: Feng Chen
Department of Radiology, The First Affiliated Hospital, College of Medicine, Zhejiang University, 79 Qingchun Road, Hangzhou 310003, People’s Republic of China
Email [email protected]
Objective: Nuclear grading is an independent prognosis factor of clear-cell renal cell carcinoma (ccRCC). A non-invasive preoperative predictive WHO/International Society of Urologic Pathology (WHO/ISUP) grading of ccRCC model is needed for clinical use. The anatomical complexity scoring system can span a variety of image modalities. The Centrality index (CI) is a quantitatively anatomical score commonly used for renal tumors. The purpose of this study was to develop a simple model to predict WHO/ISUP grading based on CI.
Materials and methods: The data in this study were from 248 ccRCC patients from five hospitals. We developed three predictive models using training data from 167 patients: a CI-only model, a valuable clinical parameter model and a fusion model of CI with valuable clinical parameters. We compared and evaluated the three models by discrimination, clinical usefulness and calibration, then tested them in a set of validation data from 81 patients.
Results: The fusion model consisting of CI and tumor size (valuable clinical parameter) had an area under the curve (AUC) of 0.82. In the validation set, the AUC was 0.85. The decision curve showed that the model had a good net benefit between the threshold probabilities of 5–80%. And the calibration curve showed good calibration in the training set and validation set.
Conclusion: This study confirms that CI is associated with the WHO/ISUP grade of ccRCC, and the possibility that a bivariate model incorporating tumor size may help urologist’s evaluation patients’ prognostic.
Keywords: kidney, carcinoma, renal cell, nomograms, validation studies, decision support techniques, anatomy, nephrectomy
Introduction
Renal cell carcinoma (RCC) is the most common adult malignant epithelial tumor of the kidney.1 The most common pathological type is clear-cell renal cell carcinoma (ccRCC). The nuclear grading of RCC is deemed as an important and independent prognosis indicator. The higher the nuclear grading, the worse the prognosis of patients.2 Fuhrman grading (FG) is the most widely used nuclear grading system. The interpretation is based on the size of tumor-cell nucleus, the shape of nucleus and nucleolar prominence. However, these three pathological parameters are equally important, which leads to difficulties in interpretation and poor repeatability in practical application.3 Therefore, WHO proposed to replace FG with WHO/International Society of Urologic Pathology (WHO/ISUP) grading system. The new grading system classifies RCC into grades 1–4 according to evaluation of nucleoli. The new criteria are simple and clear, which improves the accuracy of RCC grading.4
A large number of previous radiological studies have proven that ccRCC imaging features are correlated to FG. The study methods included Magnetic resonance (MR) perfusion,5 MR diffusion,6 enhancement on multiphase contrast-enhanced computerized tomography (CT),7 CT histogram analysis8 and radiomics,9 etc. However, such studies are relatively complicated and highly device-dependent and require tedious post-processing. Therefore, practical clinical application is difficult.
In addition, CT and MR can accurately assess the anatomy of blood vessels, renal collection systems, renal parenchyma, and renal tumors and provide a basis for the development of preoperative plans.10 Currently, the application of renal tumor anatomical complexity scoring system based on CT imaging has been widely used. There are many available anatomical scores, but the most popular ones are the RENAL nephrometry score (RNS),11 the PADUA score12 and the centrality index (CI).13 CI quantifies the anatomical location of the tumor by calculating the ratio of the distance between the tumor center and the kidney center and the tumor radius.14 Many studies have confirmed the association between the FG of RCC and the anatomical features of the tumor,15–17 and Kutikov et al performed the first study on the use of RNS for FG prediction of RCC on CT.18 It is worth noting that the anatomical complexity scoring system is not constrained by image modalities and that the measurement is easy and convenient.
Currently, the studies based on new grading are underway. Compared with FG, WHO/ISUP grading is more accurate and can provide better prognosis information in ccRCC.19 Delahunt et al have also proven that WHO/ISUP grading is an independent prognosis factor of ccRCC.20 The relation between radiographic and the new WHO/ISUP grading also needs to be reassessed. This study focused on ccRCC and tried to use relatively simple CI to process multi-center and multi-mode image data and establish a WHO/ISUP grading prediction model to provide a convenient and useful tool for accurate nuclear grading prediction before clinical decision-making.
Materials and Methods
Patients
This retrospective study was conducted in accordance with the ethical standards of Declaration of Helsinki and was approved by the Hospital Review Board. The requirement for informed consent was waived because this research involved no more than minimal risk to the participants and the waiver will not adversely affect the rights and welfare of the participants. We ensure the confidentiality of patient data. The CT/MR data of 248 patients with ccRCC from January 2017 to May 2019 were included in the study. All the tumors were pathologically confirmed ccRCC based on surgically resected or percutaneous biopsied tissues. Of these, 167 cases as training dataset were from three hospitals (The First Affiliated Hospital, College of Medicine, Zhejiang University, Zhejiang Cancer Hospital and Hangzhou First People’s Hospital) and 81 cases from the other hospitals (Ningbo First Hospital and Yijishan Hospital of Wannan Medical College) were used as external validation dataset (Table 1). Consistent with previous FG-related studies, the data were divided into low-level groups (WHO/ISUP I–II) and high-level groups (WHO/ISUP III–IV).
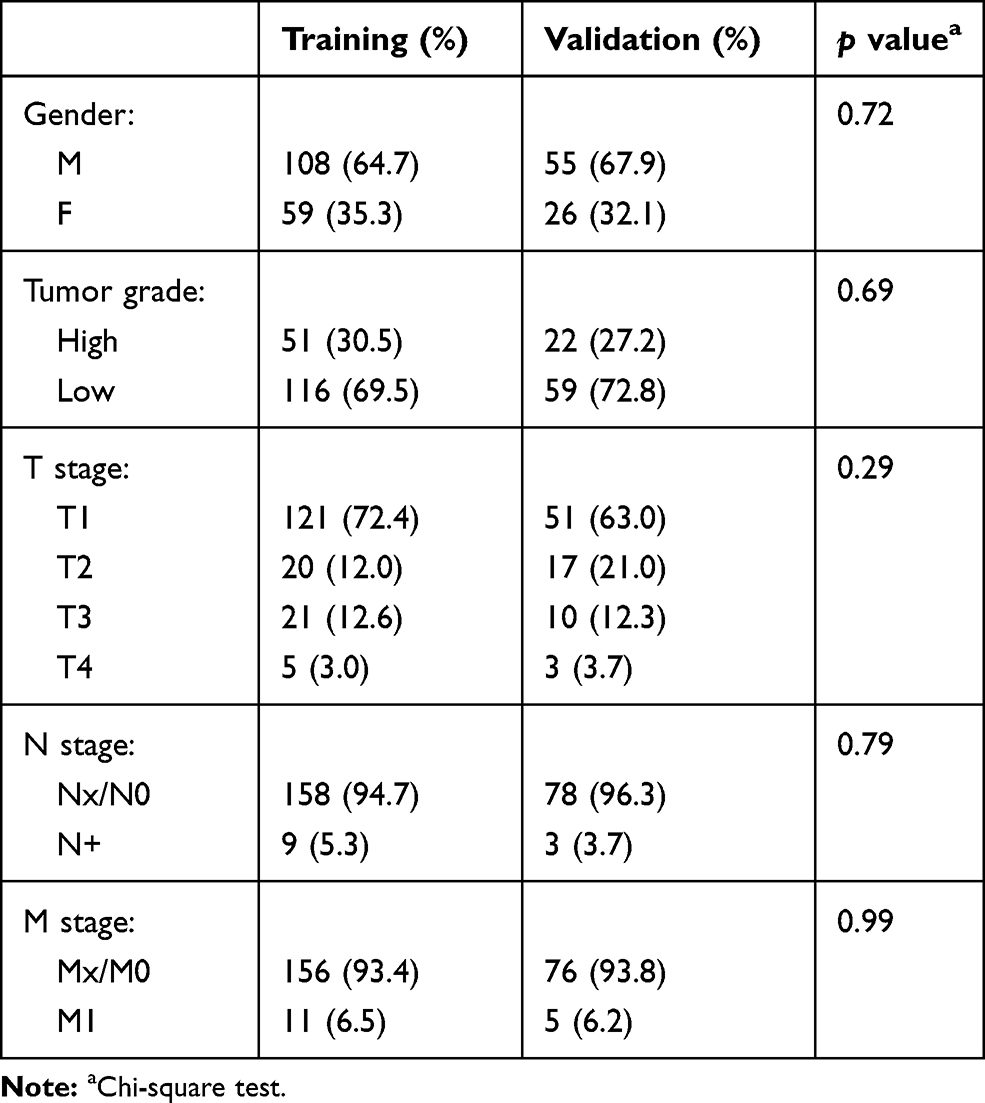 |
Table 1 Clinicopathological Characteristics of Training and Validation Data Sets |
CI Measurement
Two senior radiologists independently measured the image data without knowing the pathological results. Figure 1 shows CI calculates the distance from the center of the tumor to the center of the kidney using the Pythagorean theorem. First, the layer of the center of the renal sinus and the maximum axial axis of the tumor were determined, and then the maximum radius of the tumor, r, the vertical distance from the center of the renal tumor to the longitudinal axis of the renal sinus, x, and the kidney, and the distance from the center of the renal sinus to the horizontal axis of the tumor center, y, were measured. The CI formula was 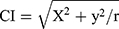 as described previously.13
 |
Figure 1 CI score. Distance y (blue line) between middle axial plane and plane of maximum tumor diameter is calculated by multiplying the number of sections by thickness of the section. Distance x (green line) is measured from the central 90-degree axial reference point to the tumor center. Distance c (red line) is calculated and divided by tumor radius to determine CI. |
Statistical Analysis
The 3.3.2 version of the R software (http://www.R-project.org) was used for statistical analysis of the data in this study. Consistency analysis of the measured data collected by the two physicians was performed using intra-group correlation coefficients (ICC). We performed descriptive statistical analysis for training and validation cohorts, comparing the qualitative variables using the chi-square test and the continuous variable data using the two-sample t-test or Wilcoxon test.
To develop the models for the individual prediction of the WHO/ISUP grade based on the data of training cohorts, a logistic regression with one variable or multiple variables was performed on the basis of CI (Model A), of valuable clinical parameters (p < 0.05 in Table 2) (Model B), and of CI with valuable clinical parameters (Model C). The detailed evaluation of the prediction model based on the training data was divided into three parts: discrimination, clinical usefulness and calibration. The receiver operating characteristic curves (ROC) are used to evaluate the low- and high-level discrimination of the model for ccRCC. 1000 bootstrap resampling calculates the 95% confidence interval for the area under the curve (AUC). Because the ROC is not sufficient to show whether the model can facilitate actual clinical decision-making in a practical way, the clinical usefulness is shown by the decision curve. Calibration was used to show the relationship between the predicted value and the actual value. In addition, Akaike’s information (AIC) criterion is used to select the best prediction model, and a nomogram is used to display the best model.
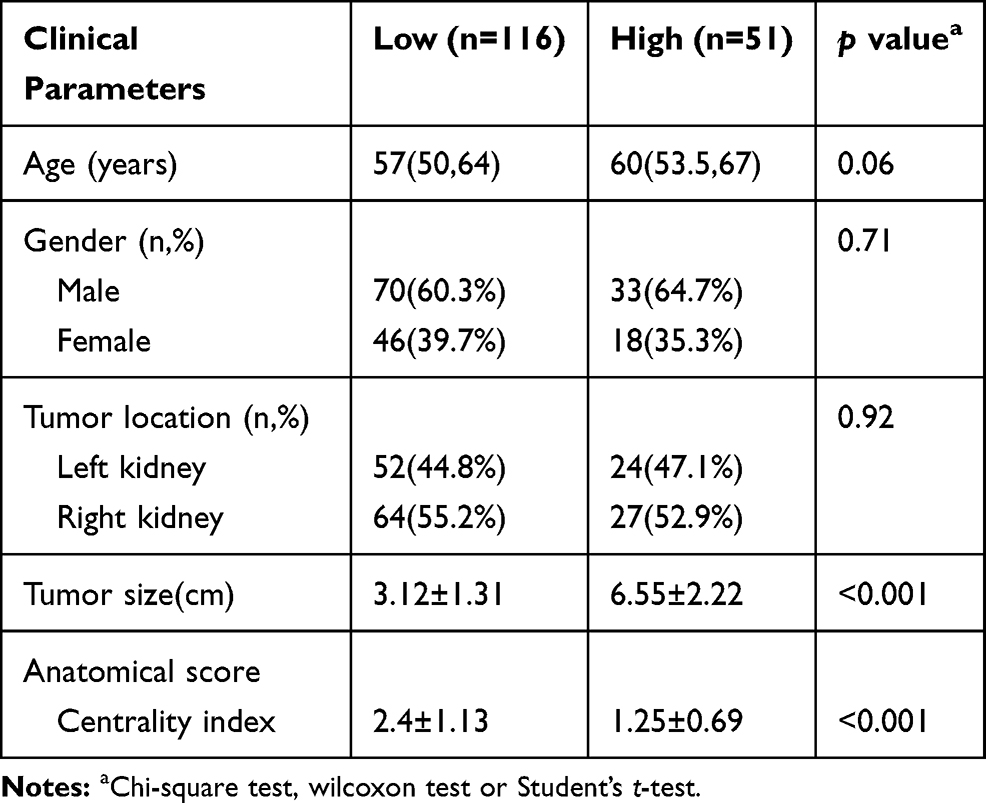 |
Table 2 Comparison of Clinical Parameters and Anatomical Score of Cases with Different WHO/ISUP Grade |
Finally, we used the most reliable model for the validation data, and we also performed diagnostic performance evaluation using three factors: discrimination, clinical usefulness and calibration.
Results
The ICC of CI was 0.83. These results suggest that the consistency of the CI values is quite satisfactory, and the final data used in this work were the average of the two observers. Table 2 lists the clinical parameters and CI for low/high ccRCC patients in the training and validation groups. In the training and validation group, there were no significant differences in age, gender, or tumor location among the low/high-grade patients (p>0.05), but there were statistically significant differences in tumor size and CI (p<0.05).
According to the results in Table 2, only tumor size remained after clinical parameters screening. Further combination with CI, a total of 3 models were constructed, Model A based on CI alone, Model Bbased on tumor size of clinical parameter and Model C combining CI and tumor size. Table 3 lists the contributions of each of the three models and the performance of the models in the training/validation set. In the training set, the AUC of CI univariate model was 0.77 (95% Confidence Interval 0.69–0.83), and the AUC of tumor size-based Model B was 0.72 (95% Confidence Interval 0.74–0.88), slightly smaller than the CI model. The fusion model of CI and tumor size showed the optimal performance, with AUC of 0.82 (95% Confidence Interval 0.74–0.88) (Figure 2). Comparison of the decision curve revealed that the net benefit of Model C was significantly superior to that of Model A and Model B (Figure 3). Finally, the AIC of Model C was the smallest among the three models. Through the above comparative analysis, fusion Model C is undoubtedly the optimal model in this study.
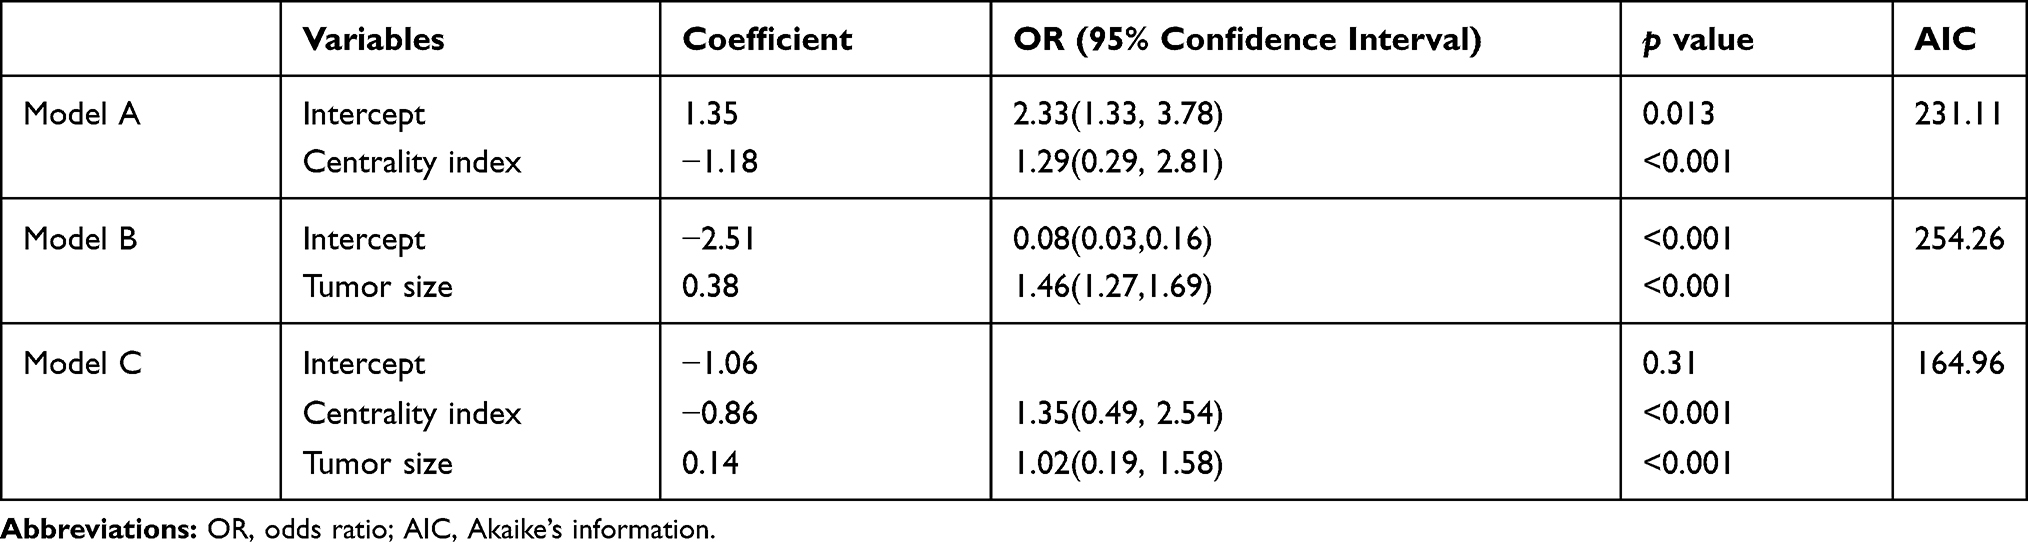 |
Table 3 Risk Factors for the Differentiation of the High- from Low-Grade ccRCC in the Different Models |
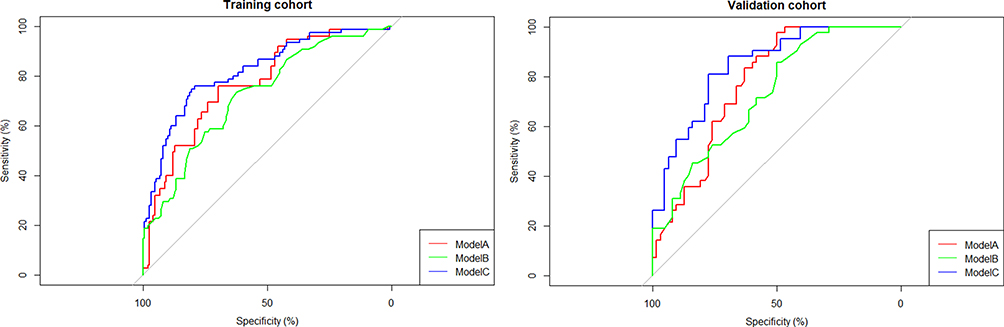 |
Figure 2 ROC curve. |
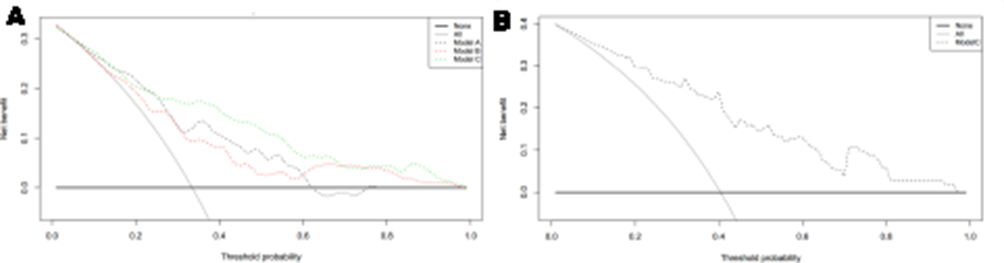 |
Figure 3 Decision curve analysis. (A) Training cohort. (B) Validation cohort. |
In the external validation set, Model C had an AUC of 0.85 (95% confidence interval 0.77–0.91), the ROC curve of the three models in the validation set is shown in Figure 2. It is not difficult to find that Model C was optimal. The decision curve showed that this model had good clinical net benefit within 5–80% (Figure 3). The final calibration curve of the fusion model showed good consistency between the predicted probability and the actual grade in the training and validation sets (Figure 4). Model C showed a good performance in external data validation. The nomogram of the fusion model is presented in Figure 5.
 |
Figure 4 Calibration plot of nomogram. (A) Training cohort. (B) Validation cohort. |
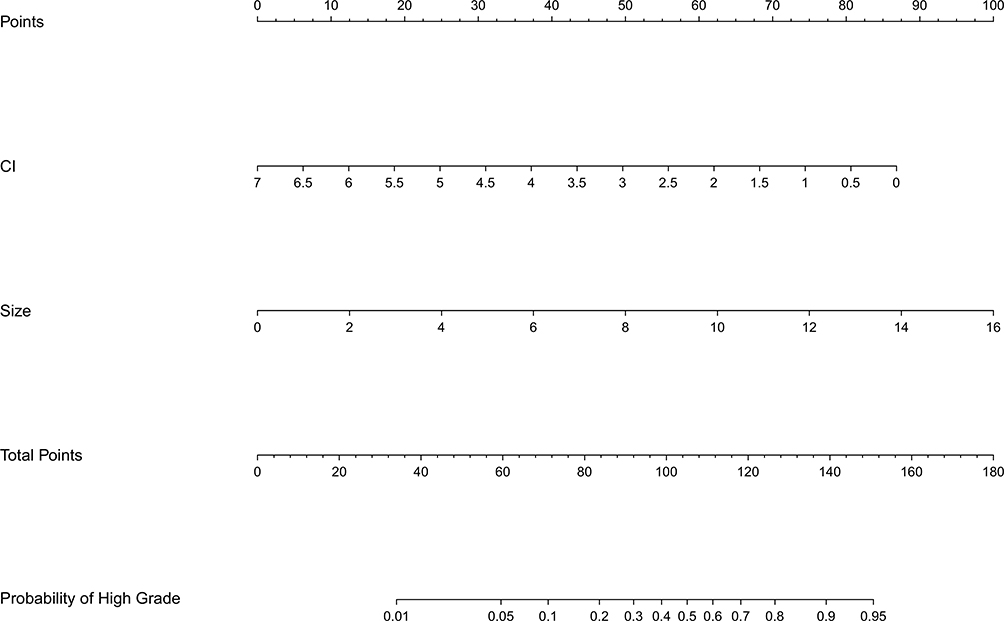 |
Figure 5 Nomogram evaluating risks of a clear-cell renal cell carcinoma being high grade. |
Discussion
The pathological grading of ccRCC is related to metastatic potential,21 and sunitinib is not effective in the treatment of high-grade metastatic RCC.22 In the era of precision therapy, the prediction of nuclear grade will be helpful for clinical decision-making. Our results demonstrate that WHO/ISUP grade of ccRCC is also related to the anatomical characteristics of tumors. In this study, we found that CI is an effective ccRCC low/high-grade prediction factor, which is consistent with the studies in which the RCC nuclear grading was predicted by anatomical scores. When tumor size was also introduced into the model, the bivariate prediction model showed excellent performance. The prediction of WHO/ISUP grading can be completed by a simple measurement.
Besides, we found that the efficiency of the CI model in predicting WHO/ISUP grading is slightly higher than that in the previous studies in which FG was predicted by RNS.18 We speculate that this may be correlated to FG. Previously, FG was determined by nuclear size and shape, and nucleolar prominence, but these three parameters may be inconsistent at times, and the determination of nuclear shape and size has large subjective deviation.20 The WHO/ISUP grading system was simplified to the primary assessment of nucleoli. In previous FG studies, it is likely that partial FG was ambiguous, and wrong classification influenced the study results. The WHO/ISUP grading solved this problem. It might be the improved accuracy of nuclear grading that made this prediction model more efficient.
CI is a simpler model, and the results are only one value. CI equals 0 indicates that the tumor is in the center of the kidney. The greater the value of CI, the further the tumor is from the center of the kidney. A CI greater than 2.5 is considered indicative of low anatomical complexity and scores below 2.5 indicate high complexity. Analysis of results showed that high-grade tumors are closer to the center of the kidney, which makes them highly complex, while the lower grade tumors are far from the center and are of lower complexity.13 Venkatesh et al reported that only 3.7% of high FG tumors were exogenous, about 25% were endogenous, and 96% of exogenous tumors were low FG.17 Tumors involving the collection system are associated with higher grade, and this has been validated in previous studies.23,24 Because there are many thin-walled veins and lymphatic vessels in the renal sinus, if the tumor invades the renal sinus and veins, the sufficient blood oxygen supply will promote further tumor growth, which promotes invasiveness.25 This may be one mechanism underlying the development of low CI in kidney cancer associated with high WHO/ISUP grading.
Tumor size is also recognized as an independent prognostic factor for RCC.26 Frank et al reported that 90.8% of renal tumors smaller than 2 cm had a low grade,27 and Chen et al’s multiple regression analysis also suggested that larger tumor size predicted ccRCC pathology.25 Many studies have demonstrated that the larger the ccRCC lesion, the more likely it is to be associated with a higher grade.28,29 The introduction of tumor size undoubtedly improved the predictive performance of the model.
In previous nuclear grading prediction studies led by radiologists, based on the quantitative analysis of MR functional imaging, data acquisition was limited by device and was difficult to implement clinically. The studies based on CT were relatively simple; thus, the application of the recently popular radiomic analysis in FG prediction achieved good results.9 However, Orlhac et al pointed out that there is difference in texture parameters between different CT scanners and that the scanning parameters of different hospitals are different, which will affect the generalization ability of the model.30 The CT radiomic model based on multi-phase enhancement cannot be generalized to CTA data and more impossible to be applied to the MR image. However, anatomical scores can cover different image modalities. The data in this study came from 5 different hospitals, and the scanning devices and parameters were different. Such data included the multi-modal image data of CT, CTA and MR. Only anatomical scores can analyze these data. With the development of multidisciplinary consultations, these anatomical scores are coming to be understood by radiologists. Alsaikhan et al proposed that CT reports of kidney cancer should include anatomical scores.31 Therefore, if the functional image parameters can be utilized and integrated on the basis of the deep reconstruction anatomical score in the future, the prediction model would be improved further.
The limitations of this study are as follows: 1) Since WHO/ISUP grading has not been applied for a long time and many hospitals are still using FG, so the sample size in this study was relatively small. Our data are limited to Chinese hospitals, so there are selection biases, and data from other countries are needed for further validation. 2) This study did not include RNS and PADUA score for comparative analysis. And the central area of some tumors was difficult to determine, and the scorers were subjective, leading to poor consistency of CI in these cases. These cases may be difficult to be analyzed using anatomical scores. 3) The prediction model in this study was only limited to distinguish high- and low-grade ccRCC. However, in clinical practice, it is more important to differentiate benign and malignant masses of kidney. 4) A small amount of pathological results was obtained from puncture biopsy, which might have sampling error.
Conclusion
This study confirmed that large tumors and smaller CIs are helpful in predicting high-grade nuclear ccRCC. The WHO/ISUP grading predictive model of ccRCC developed according to these two parameters also performed well in external validation. The parameters required for the model are simple to measure, without the need for special software, and the final nomogram is also very concise, without the need for complex conversions. Objectively quantified prediction probabilities will help urologists make clinical decisions.
Abbreviations
AUC, the area under the curve; ccRCC, clear-cell renal cell carcinoma; CI, centrality index; CT, computed tomography; FG, Fuhrman grade; RCC, renal cell carcinoma; MR, magnetic resonance; ROC, receiver operating characteristic; RNS, renal nephrometry score; WHO/ISUP, WHO/International Society of Urologic Pathology.
Acknowledgments
This study has received funding by the Department of Health of Zhejiang Province, China (No. 2017KY051, 2018KY582 and 2019KY551).
Disclosure
The authors report no conflicts of interest in this work.
References
1. Capitanio U, Montorsi F. Renal cancer. Lancet. 2015;387(10021):894. doi:10.1016/S0140-6736(15)00046-X
2. Srigley JR, Delahunt B, Eble JN, et al. The International Society of Urological Pathology (ISUP) vancouver classification of renal neoplasia. Am J Surg Pathol. 2013;37(10):1469–1489. doi:10.1097/PAS.0b013e318299f2d1
3. Tran T, Jones CL, Williamson SR, et al. Tubulocystic renal cell carcinoma is an entity that is immunohistochemically and genetically distinct from papillary renal cell carcinoma. Histopathology. 2016;68(6):850–857. doi:10.1111/his.2016.68.issue-6
4. Moch H. The WHO/ISUP grading system for renal carcinoma. Pathologe. 2016;37(4):355–360. doi:10.1007/s00292-016-0171-y
5. Yuan Q, Kapur P, Zhang Y, et al. Intratumor heterogeneity of perfusion and diffusion in clear-cell renal cell carcinoma: correlation with tumor cellularity. Clin Genitourin Cancer. 2016;14(6):e585. doi:10.1016/j.clgc.2016.04.007
6. Rosenkrantz AB, Niver BE, Fitzgerald EF, Babb JS, Chandarana H, Melamed J. Utility of the apparent diffusion coefficient for distinguishing clear cell renal cell carcinoma of low and high nuclear grade. AJR Am J Roentgenol. 2010;185(6):2099.
7. Zhu Y-H, Wang X, Zhang J, Chen Y-H, Kong W, Huang Y-R. Low enhancement on multiphase contrast-enhanced CT images: an independent predictor of the presence of high tumor grade of clear cell renal cell carcinoma. AJR Am J Roentgenol. 2014;203(3):295–300. doi:10.2214/AJR.13.12297
8. Huhdanpaa H, Hwang D, Cen S, et al. CT prediction of the fuhrman grade of clear cell renal cell carcinoma (RCC): towards the development of computer-assisted diagnostic method. Abdom Imaging. 2015;40(8):3168–3174. doi:10.1007/s00261-015-0531-8
9. Ding J, Xing Z, Jiang Z, et al. CT-based radiomic model predicts high grade of clear cell renal cell carcinoma. Eur J Radiol. 2018;103:51–56. doi:10.1016/j.ejrad.2018.04.013
10. Millet I, Doyon FC, Pages E, Thuret R, Taourel P. Morphometric scores for renal tumors: what does the radiologist need to know? Eur J Radiol. 2014;83(8):1303–1310. doi:10.1016/j.ejrad.2014.04.025
11. Kutikov A, Uzzo RG. The R.E.N.A.L. nephrometry score: a comprehensive standardized system for quantitating renal tumor size, location and depth. J Urol. 2009;182(3):844–853. doi:10.1016/j.juro.2009.05.035
12. Ficarra V, Novara G, Secco S, et al. Preoperative aspects and dimensions used for an anatomical (PADUA) classification of renal tumours in patients who are candidates for nephron-sparing surgery. Eur Urol. 2009;56(5):786–793. doi:10.1016/j.eururo.2009.07.040
13. Simmons MN, Ching CB, Samplaski MK, Park CH, Gill IS. Kidney tumor location measurement using the C index method. J Urol. 2010;183(5):1708–1713. doi:10.1016/j.juro.2010.01.005
14. Okhunov Z, R-B S, AK G, et al. The comparison of three renal tumor scoring systems: C-index, P.A.D.U.A., and R.E.N.A.L. nephrometry scores. J Endourol. 2011;25(12):1921. doi:10.1089/end.2011.0301
15. Lipke MC, Ha SP, Fischer CD, Rydberg J, Bonsib SM, Sundaram CP. Pathologic characteristics of exophytic renal masses. J Endourol. 2007;21(12):1489–1491. doi:10.1089/end.2007.9874
16. Schachter LR, Bach AM, Snyder ME, Kattan MW, Russo P. The impact of tumour location on the histological subtype of renal cortical tumours. BJU Int. 2010;98(1):63–66. doi:10.1111/j.1464-410X.2006.06179.x
17. Venkatesh R, Weld K, CD A, et al. Laparoscopic partial nephrectomy for renal masses: effect of tumor location. Urology. 2006;67(6):1169–1174. doi:10.1016/j.urology.2006.01.089
18. Kutikov A, Smaldone MC, Egleston BL, et al. Anatomic features of enhancing renal masses predict malignant and high-grade pathology: a preoperative nomogram using the RENAL nephrometry score. Eur Urol. 2011;60(2):241–248. doi:10.1016/j.eururo.2011.03.029
19. Delahunt B, Cheville JC, Martignoni G, et al. The International Society of Urological Pathology (ISUP) grading system for renal cell carcinoma and other prognostic parameters. Am J Surg Pathol. 2013;37(10):1490. doi:10.1097/PAS.0b013e318299f0fb
20. Delahunt B, Egevad L, Samaratunga H, Martignoni G, Nacey JN, Srigley JR. Gleason and Fuhrman no longer make the grade. Histopathology. 2016;68(4):475–481. doi:10.1111/his.2016.68.issue-4
21. Guðmundsson E, Hellborg H, Lundstam S, Erikson S, Ljungberge B. Metastatic potential in renal cell carcinomas ≤7 cm: Swedish kidney cancer quality register data. Eur Urol. 2011;60(5):975–982. doi:10.1016/j.eururo.2011.06.029
22. Powles T, Blank C, Chowdhury S, et al. The outcome of patients treated with sunitinib prior to planned nephrectomy in metastatic clear cell renal cancer. Eur Urol. 2011;60(3):448–454. doi:10.1016/j.eururo.2011.05.028
23. Kikuchi H, Abe T, Matsumoto R, et al. Nephrometry score correlated with tumor proliferative activity inT1 clear cell renal cell carcinoma. Urol Oncol. 2019;37(5):
24. Karakiewicz PI, Trinh QD, Riouxleclercq N, et al. Collecting duct renal cell carcinoma: a matched analysis of 41 cases. Eur Urol. 2007;52(4):1140–1146. doi:10.1016/j.eururo.2007.01.070
25. Chen SH, Wu YP, Li XD, et al. R.E.N.A.L. nephrometry score: a preoperative risk factor predicting the Fuhrman grade of clear-cell renal carcinoma. J Cancer. 2017;8(18):3725–3732. doi:10.7150/jca.21189
26. Lam JS, Klatte T, Kim HL, et al. Prognostic factors and selection for clinical studies of patients with kidney cancer. Crit Rev Oncol Hematol. 2008;65(3):235–262. doi:10.1016/j.critrevonc.2007.08.003
27. Frank I, Blute ML, Cheville JC, Lohse CM, Weaver AL, Zincke H. Solid renal tumors: an analysis of pathological features related to tumor size. J Urol. 2003;170(6):2217–2220. doi:10.1097/01.ju.0000095475.12515.5e
28. Tsivian M, Mouraviev V, Albala DM, et al. Clinical predictors of renal mass pathological features. BJU Int. 2015;107(5):735–740. doi:10.1111/j.1464-410X.2010.09629.x
29. Rothman J, Egleston B, Wong YN, Iffrig K, Lebovitch S, Uzzo RG. Histopathological characteristics of localized renal cell carcinoma correlate with tumor size: a SEER analysis. J Urol. 2009;181(1):29–34. doi:10.1016/j.juro.2008.09.009
30. Orlhac F, Frouin F, Nioche C, Ayache N, Buvat I. Validation of a method to compensate multicenter effects affecting CT radiomics. Radiology. 2019;291(1):53–59. doi:10.1148/radiol.2019182023
31. Alsaikhan N, Alshehri W, Cassidy F, Aganovic L, Vahdat N. Renal tumor structured reporting including nephrometry score and beyond: what the urologist and interventional radiologist need to know. Abdom Radiol. 2018;1–11.
 © 2020 The Author(s). This work is published and licensed by Dove Medical Press Limited. The
full terms of this license are available at https://www.dovepress.com/terms
and incorporate the Creative Commons Attribution
- Non Commercial (unported, 3.0) License.
By accessing the work you hereby accept the Terms. Non-commercial uses of the work are permitted
without any further permission from Dove Medical Press Limited, provided the work is properly
attributed. For permission for commercial use of this work, please see paragraphs 4.2 and 5 of our Terms.
© 2020 The Author(s). This work is published and licensed by Dove Medical Press Limited. The
full terms of this license are available at https://www.dovepress.com/terms
and incorporate the Creative Commons Attribution
- Non Commercial (unported, 3.0) License.
By accessing the work you hereby accept the Terms. Non-commercial uses of the work are permitted
without any further permission from Dove Medical Press Limited, provided the work is properly
attributed. For permission for commercial use of this work, please see paragraphs 4.2 and 5 of our Terms.