
Back to Journals » International Journal of General Medicine » Volume 19
New Methods for Activated Partial Thromboplastin Time -Based Clot Waveform Analysis: Normalization and Multi-Parameter Combination
Authors Dong H, Hu Q, Wang H, Li C, Chen H
Received 5 November 2025
Accepted for publication 19 February 2026
Published 10 March 2026 Volume 2026:19 579403
DOI https://doi.org/10.2147/IJGM.S579403
Checked for plagiarism Yes
Review by Single anonymous peer review
Peer reviewer comments 2
Editor who approved publication: Professor David E. Stec
Hongmei Dong,1,* Qi Hu,1,* Huan Wang,1 Cong Li,2 Hong Chen1
1Department of Laboratory Medicine, The Second Affiliated Hospital of Chongqing Medical University, Chongqing, People’s Republic of China; 2Research and Development Department, Shenzhen Mindray Medical Instrument Co., Ltd, Shenzhen, People’s Republic of China
*These authors contributed equally to this work
Correspondence: Hong Chen, Department of Laboratory Medicine, The Second Affiliated Hospital of Chongqing Medical University, No. 74 Linjing Road, Yuzhong District, Chongqing, 400010, People’s Republic of China, Tel +86-15111948330, Email [email protected]
Background: The evaluation of a prolonged activated partial thromboplastin time (APTT) traditionally relies on a diagnostic cascade, including mixing studies to screen for inhibitors, specific factor activity assays, and specialized tests like lupus anticoagulant detection. Activated partial thromboplastin time-based clot waveform analysis (CWA-APTT) has emerged as an optical technique that captures the entire kinetic profile of clot formation, offering potential for enhanced diagnostic triage and monitoring. However, conventional analysis of CWA-APTT parameters, particularly peak-related metrics, is confounded by variables like fibrinogen concentration, limiting their specificity for accurately quantifying coagulation factor activity. Furthermore, the diagnostic utility of time-distribution parameters remains underexplored, especially for distinguishing between factor deficiencies and phospholipid-dependent inhibitors. This study aims to improve the correlation between peak-related parameters in APTT-based clotting curves and coagulation factor activity through novel data analysis methods and to investigate the potential clinical utility of time-distribution parameters in distinguishing sample types.
Methods: A total of 263 blood samples collected from patients with hemophilia A, hemophilia B, or lupus anticoagulant positivity were used to perform CWA-APTT. Normalization methods were applied to process the characteristic parameters in CWA-APTT. Then, the correlation between the processed peak-related parameters and coagulation factor activity was analyzed, and the ability of time-distribution parameters to distinguish different sample types was investigated.
Results: Following normalization, peak-related parameters more accurately reflect coagulation factor activity. Time-distribution parameters can also monitor coagulation factor activity and exhibit a certain degree of sample specificity. Combined analysis of time-distribution parameters enhances the ability to distinguish sample types, achieving a higher concordance rate in curve feature recognition compared to APTT correction tests.
Conclusion: This study innovatively explored new applications of CWA-APTT characteristic parameters. It was found that normalization enables peak-related parameters to more accurately reflect coagulation factor activity, and multi-parameter combined analysis can significantly enhance the ability of CWA-APTT to distinguish clinical samples.
Keywords: normalization, multi-parameter combination, coagulation, CWA-APTT
Introduction
Coagulation function indicators, such as prothrombin time (PT), activated partial thromboplastin time (APTT), and thrombin time (TT), are critical clinical parameters for assessing patients’ risk of bleeding and thrombosis.1–3 However, when these coagulation indicators are measured using automated coagulation analyzers based on the clotting method, the results only reflect a single fixed time point and fail to capture the overall coagulation profile.4,5 Activated partial thromboplastin time (APTT)-based clot waveform analysis (CWA) is a coagulation detection technology based on optical principles. By analyzing changes in transmitted or scattered light during the coagulation process, it generates a clotting curve and derives parameters such as the APTT clotting time (CT), maximum clotting reaction rate (|Min1) |and maximum clotting acceleration rate (|Min2|) of the coagulation reaction.6 APTT-based CWA has a wide range of applications, including the diagnosis of coagulation abnormalities, monitoring of anticoagulant therapy, assessment of thrombotic and hemorrhagic diseases, and research.7–10
CWA-APTT can be used for the early prevention and treatment of venous thromboembolism (VTE). Studies have shown that the first and second derivatives of CWA-APTT can predict hypercoagulable states in patients.11,12 In hemophilia, CWA-APTT parameters can effectively distinguish the clinical severity of the disease.13,14 When FVIII concentration ranges between 0 and 100 IU/dL, CWA-APTT parameters such as CT, |Min1|, and |Min2| exhibit a strong dose-dependent relationship with FVIII concentration.15 Additionally, the combined use of CWA-APTT and thrombin generation assays can serve as an effective approach to differentiate coagulation disorders16 and identify the causes of prolonged APTT.17
The characteristic parameters of clotting curves are primarily divided into two categories: peak-related parameters and time-distribution parameters. The former is mainly used to describe changes in coagulation intensity, including peak height, weighted average height, and curve average integral. The latter is primarily used to describe the temporal distribution characteristics of the waveform, with skewness being the most representative. Peak-related parameters have been widely applied, achieving notable results in areas such as assessing the severity of hemophilia and monitoring the efficacy of hemophilia treatment. However, existing studies indicate that the correlation between clotting curve characteristic parameters (e.g., peak-related parameters) and coagulation factor activity is generally not high, and they cannot be directly used to evaluate coagulation factor activity. This study aims to enhance the correlation between peak-related parameters and coagulation factor activity through new data analysis methods, with the goal of further improving the clinical utility of these parameters. As for time-distribution parameters, there is currently limited research in this area. This study seeks to explore their value in distinguishing sample types and monitoring factor activity.
Methods
Instruments and Reagents
CX-9000 fully automated coagulation analyzer and its complementary reagents and quality control materials (Mindray Medical, Shenzhen, China).
Clinical Samples
A total of 263 blood samples, collected from hemophilia A, hemophilia B, or lupus anticoagulant positivity patients of the Second Affiliated Hospital of Chongqing Medical University (From October 2023 to September 2024), were enrolled in this study. Inclusion criteria for patients: Prolonged APTT, confirmed by diagnostic tests as hemophilia A, hemophilia B, or lupus anticoagulant-positive patients. Exclusion criteria for patients: Insufficient sample volume or samples from patients currently undergoing anticoagulant therapy.
Sample Processing
The collected blood samples were centrifuged at 1500–2000 × g for 10–15 minutes to separate the plasma. The obtained plasma samples were then subjected to CWA-APTT testing using the CX-9000 fully automated coagulation analyzer. If not tested immediately, the plasma samples could be aliquoted and stored at −80°C, with testing completed within 1 month to avoid repeated freeze–thaw cycles.
Data Processing and Analysis
The characteristic parameters of the activated partial thromboplastin time clot waveform analysis (CWA-APTT) can be broadly classified into two categories: peak-related parameters and time-distribution parameters.
Peak-related parameters primarily describe the intensity of enzymatic activity and include the peak (or valley) value, the average area under the curve, and centroid Y. In particular, the peak of the first derivative curve corresponds to the maximum thrombin generation rate.
Time-distribution parameters reflect the temporal characteristics of the coagulation process, including enzyme activation and inactivation, and are represented by skewness, kurtosis, and centroid X.
The extraction of CWA-APTT characteristic parameters followed a systematic procedure. After the addition of APTT reagents—comprising a contact activator, phospholipids, and calcium ions (Ca2⁺)—to the plasma sample, changes in transmitted light intensity within the reaction cuvette were continuously recorded. The resulting plot of transmitted light intensity versus time constituted the coagulation reaction curve.
Subsequently, the absorbance difference curve was computed, and its first and second derivative curves were obtained.
For parameter extraction, specific analysis ranges were defined. In the first derivative curve, the main analysis focused on the peak region. In the second derivative curve, both the peak and valley regions were analyzed separately, denoted as 2nd-peak and 2nd-valley, respectively.
Each parameter was then calculated based on the selected region. For the first derivative curve, the peak (or valley) value represented the maximum (or minimum) point of the curve, while the standard deviation quantified the dispersion of the selected data points. The centroid X and centroid Y values were determined as the weighted averages of the corresponding coordinates, analogous to the centroid calculation of a geometric shape bounded by the X-axis and the derivative curve.
The average area under the curve was defined as the mean of the selected peak (or valley) values, providing a more stable indicator than a single peak parameter.
The skewness and kurtosis parameters described the asymmetry and sharpness of the curve, respectively. For their computation, deviations of each selected data point from the centroid X were calculated separately for the right and left sides of the curve (denoted as Ai and Bi). The differences (Ai − Bi) were raised to the third power for skewness and to the fourth power for kurtosis, and the mean value across all points was taken as the final statistic.
This analytical approach enabled quantitative characterization of both the magnitude and temporal distribution of coagulation-related enzymatic activity in plasma samples.
Statistical Analysis
Continuous variables were summarized as mean ± SD or median (IQR) based on their distribution; categorical variables were summarized as counts (percentages). Normality was assessed with the Shapiro–Wilk test and variance homogeneity with Levene’s test. Between-group comparisons of CWA-APTT parameters used one-way ANOVA with Tukey’s post-hoc tests when assumptions were met or Kruskal–Wallis tests with Dunn’s post-hoc corrections; otherwise, Welch’s ANOVA was applied when variances were unequal. Associations with coagulation factor activities were evaluated using Pearson’s or Spearman correlation, as appropriate. Diagnostic performance was examined with ROC analysis, reporting AUCs with 95% CIs (DeLong method) and Youden’s J for threshold selection. Multiple comparisons were controlled using the Benjamini–Hochberg false discovery rate. Two-sided P < 0.05 was considered statistically significant. Analyses were performed in R (v4.3+) and/or SPSS (v26+); figures were generated in GraphPad Prism (v10).
Results
Application of Normalization Processing for Peak-Related Parameters
The primary purpose of parameter normalization is to reduce interference from other factors on the parameters. Taking the first derivative curve as an example, the absorbance of the coagulation reaction curve (or the change in light transmittance for some instruments) is positively correlated with the fibrinogen (FIB) content in the sample. The peak value of the first derivative curve is generally considered to be related to the activity of thrombin in cleaving FIB. Therefore, peak-related parameters are associated with both thrombin activity and FIB concentration. Normalization processing can minimize the influence of FIB, thereby enhancing the correlation between peak-related parameters and coagulation factors (Figure 1).
 |
Figure 1 Schematic diagram of first derivative parameters of the coagulation curve. After obtaining the aforementioned curve characteristic parameters, diagnostic information, coagulation factor activity, and curve characteristic parameters were consolidated in Excel. The correlation between clinical indicators and curve characteristic parameters was statistically analyzed to evaluate the potential clinical value of individual parameters or multi-parameter combinations. Arrow indicated Centroid point. |
Following the conversion of the light transmittance curve to an absorbance curve (Y-axis: absorbance; X-axis: time), normalization was performed to minimize the confounding effect of FIB concentration on peak-related parameters. This was achieved by linearly rescaling the absorbance values of each sample’s curve. Specifically, the original minimum and maximum absorbance values of a given curve were mapped to a standardized range (eg., 0 to 1, representing the baseline and plateau phases of clot formation, respectively) using a simple linear scaling transformation. The transformation coefficients derived from this operation were then applied to all relevant data points (eg., peak height) within that sample’s derivative curves to generate normalized parameters. This process effectively corrects for inter-sample variations in FIB concentration, allowing the normalized peak parameters to more directly reflect thrombin activity. The resulting normalized values are presented in Table 1. By analyzing the CWA-APTT data from samples of hemophilia A/B patients and lupus anticoagulant-positive patients, we found that normalization processing enables peak-related parameters to more accurately reflect coagulation factor activity. As shown in Figures 2A and B, in hemophilia B patient samples, the peak value of the first derivative curve gradually decreased with the reduction in coagulation factor activity (Figure 2A and C). After normalization, not only did the trend become more pronounced, but the correlation also became more significant (Figure 2B and D).
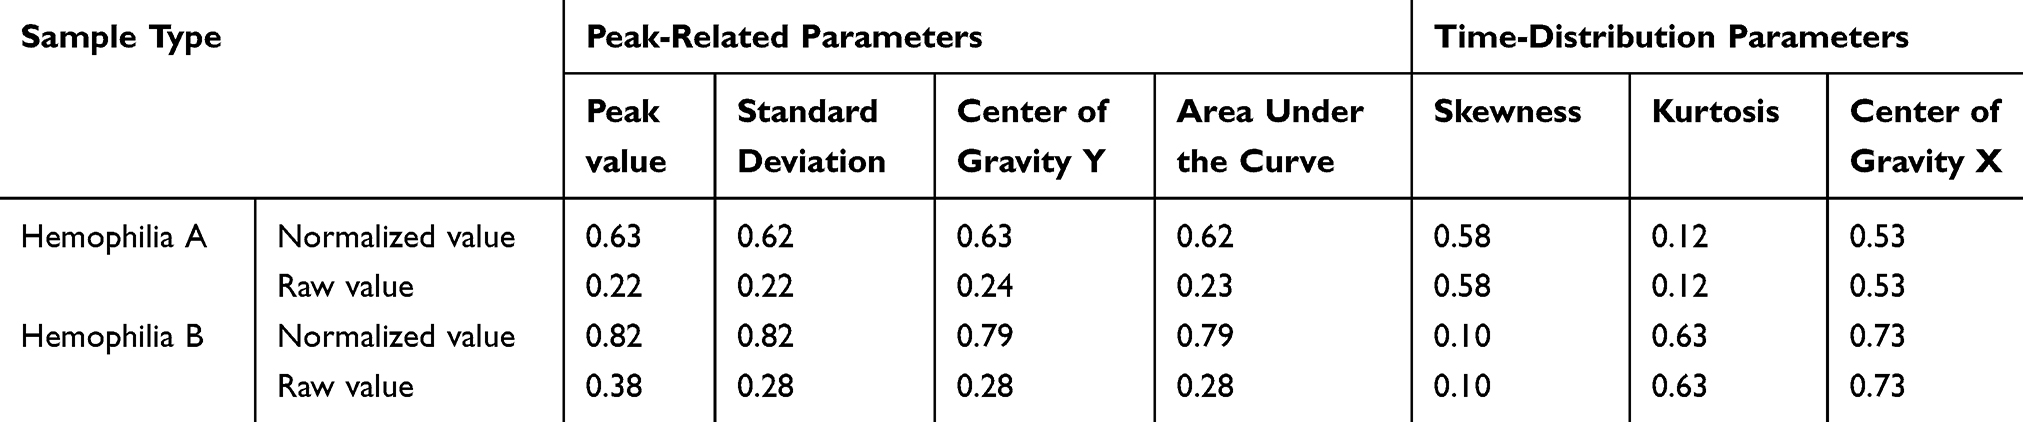 |
Table 1 Normalized Processing of Peak-Related Parameters and Time-Distribution Parameters |
 |
Figure 2 Correlation between peak-related parameters and coagulation factor activity. (A–D) Effect of normalization on the correlation between peak height parameters and coagulation factor activity (Hemophilia (A and B), and some of them have inhibitors). |
Analysis of Time-Distribution Parameters in Different Sample Types
Further analysis of the derivative curves demonstrated that time-distribution parameters are also capable of reflecting coagulation factor activity (Figures 3A–C), including centroid X of the first derivative curve, kurtosis of the first derivative curve, and centroid X of the second derivative curve, among others. Unlike peak-related parameters, time-distribution parameters are not influenced by fibrinogen (FIB) concentration. Consequently, no significant differences were observed between the original and normalized time-distribution parameters (Figure 3D). This stability suggests that time-distribution parameters provide more robust and reliable information in CWA-APTT analysis.
 |
Figure 3 Correlation between time-distribution parameters and coagulation factor activity. (A–C) Correlation between time-distribution parameters and coagulation factor activity (Hemophilia (B)), (A) centroid X of 1st curve, (B) kurtosis of 1st curve, (C) centroid X of 2nd curve. (D). Under normal distribution, the skewness equals to 0 and the kurtosis equals to 1.5 (B). Difference between original and normalized parameter. |
Among the second derivative parameters, the skewness of the trough curve in hemophilia A and B samples showed a positive skew compared to normal samples, while samples from lupus anticoagulant-positive (LA) patients and hemophilia A with inhibitors exhibited both positive and negative skewness (Figure 4A). The kurtosis of the second derivative trough curve remained largely unchanged in hemophilia B and mild/moderate hemophilia A but showed a positive shift in severe hemophilia A, hemophilia A with inhibitors, and LA samples (Figure 4B). The centroid X of the second and third derivative trough curves showed almost no overlap between hemophilia A, hemophilia B, and normal samples, while LA and hemophilia A with inhibitors samples exhibited both positive and negative skewness (Figure 4C and D).
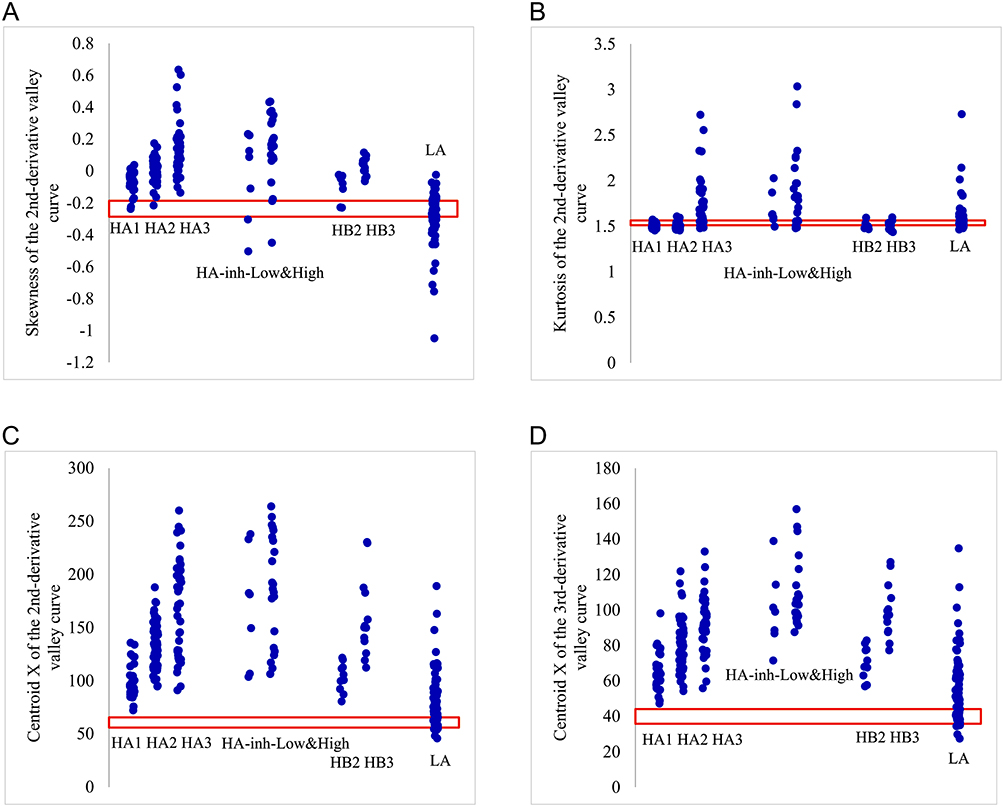 |
Figure 4 Characteristics of time-distribution parameters in different sample types. (A) Skewness of the second derivative valley curve; (B) Kurtosis of the second derivative valley curve; (C) Centroid X of the second derivative valley curve; (D) Centroid X of the third derivative peak curve; Yellow lines represent normal samples. Blue dots represent diseased samples, where HA1/HA2/HA3 represents Hemophilia (A) mild, moderate, and severe, in which inhibitors are less than 0.6 BU, HA2/HA3 represents Hemophilia (B) moderate, and severe, HA-inh-Low&High represents Hemophilia A with Low or High titer inhibitor, and LA represents Lupus Anticoagulant. The red box indicates normal reference interval. |
A summary of the characteristics of time-distribution parameters in different sample types is presented in Table 2. These findings suggest that derivative analysis of time-distribution parameters may be useful for distinguishing between different disease samples. For example, those curve characteristics are observed: skewness and kurtosis of the second derivative valley curve are not changed, and centroid X of the third second peak curve is increased, then this sample is about HA (mild/moderate) or HB, and severe HA and HA with inhibitors are ruled out. However, there is a very difficult question: how to separate LA samples from others?
 |
Table 2 Summary of Characteristics Analysis of Time-Distribution Parameters in Different Samples |
Combined Analysis of Time-Distribution Parameters Enhances Sample Type Differentiation
Since the characteristics of CWA-APTT parameters vary across different sample types, multi-parameter combinations can be used to enhance the ability to differentiate between sample types. Firstly, multiple parameter combinations can distinguish LA samples from other samples, and two of them are shown in Figure 5. Parameter combination group A is equivalent to the sum of the skewness and kurtosis of the 2nd derivative valley curve (Figure 5A), and parameter combination group B is equal to the difference between the centroid X of the 2nd derivative valley curve and centroid X of the 3rd derivative peak curve (Figure 5B). Above parameter distributions of LA samples are wide, and a large overlap area with other samples. As shown in Figure 5A and B, parameter distributions of LA samples are compressed and become very small. Then, some parameter combinations are selected to enhance the difference among different samples to set up critical values more accurately. The sum of the skewness and normalized peak value of the 2nd derivative valley curve is set as parameter combination group C (Figure 5C), which makes Hemophilia A&B samples more different from the normal samples. The difference between the skewness of the 1st derivative curve and 2nd derivative valley curve is considered as parameter combination group D (Figure 5D), and most values of Hemophilia A&B samples are negative, while most values of LA samples are positive.
 |
Figure 5 Characteristics of parameter combinations in different sample types. (A) the sum of the skewness and kurtosis of the 2nd derivative valley curve, (B) the difference between the centroid X of the 2nd derivative valley curve and centroid X of the 3rd derivative peak curve, (C) the sum of the skewness and peak value of the 2nd derivative valley curve, and (D) the difference between the skewness of the 1st derivative curve and 2nd derivative valley curve. The red box indicates normal reference interval. |
Yellow lines represent normal samples. Blue dots represent diseased samples, where HA1/HA2/HA3 represents Hemophilia A: mild, moderate, and severe, in which inhibitors are less than 0.6 BU, HA2/HA3 represents Hemophilia B: moderate, and severe, HA-inh-Low&High represents Hemophilia A with Low or High titer inhibitor, and LA represents Lupus Anticoagulant.
Furthermore, a judgment process used to distinguish sample types is designed. At first, some representative parameters are selected. Centroid X of the 2nd derivative valley curve or 3rd derivative peak curves is used to divide into normal samples and others. Parameter combination group A, the sum of the skewness and kurtosis of the 2nd derivative valley curve, is selected to separate LA samples from others. Kurtosis of the 2nd derivative valley curve is taken as the flag of Severe HA or HA with inhibitors. Critical values of those parameters are shown in Table 3. If the sample value is bigger than critical value, it will be marked as “+” (positive); otherwise, it’s marked as “-” (negative), and the decision logic is shown in Table 4. From the concordance rates shown in Table 5, it can be seen that the above multi-parameter combination can effectively differentiate between sample types. Concordance rates in all sample types are over 75%, and this is over 90% for Mild/moderate HA, which almost reaches the level of the APTT mixing test. And concordance rate between LA and Hemophilia Samples is up to 90.5%, which is important for distinguishing the risk of bleeding or thrombosis.
 |
Table 3 Critical Values of Three Parameters |
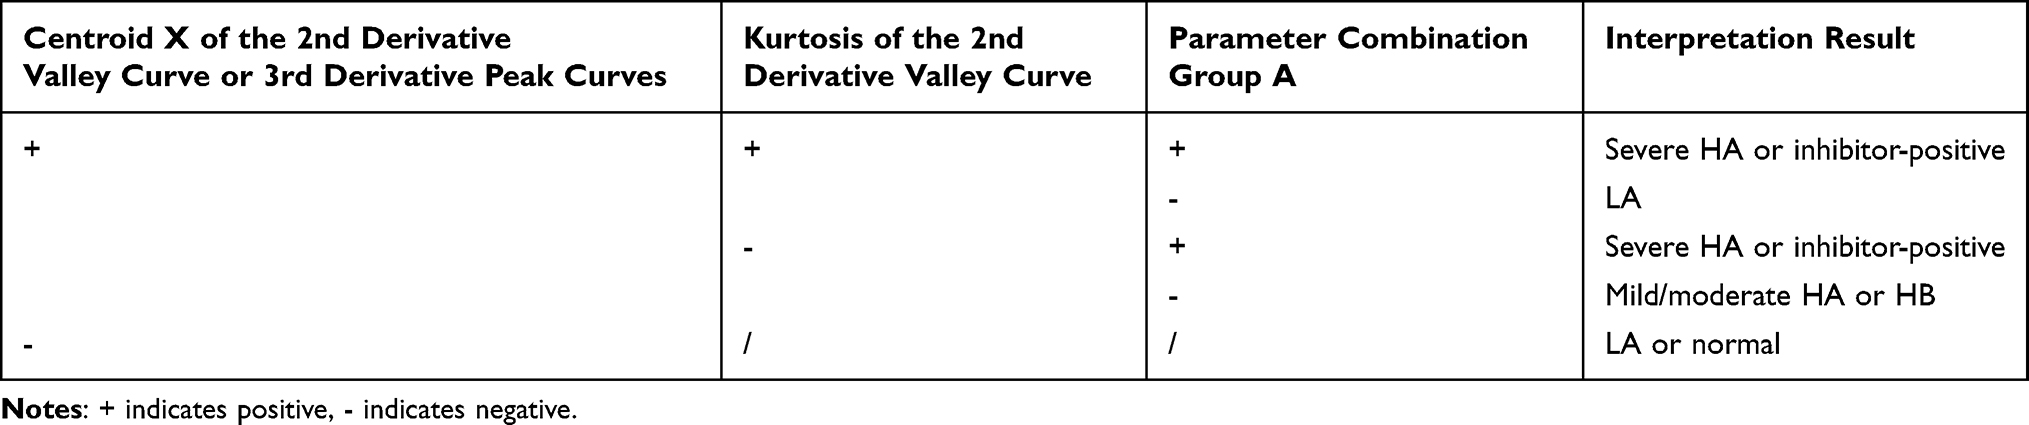 |
Table 4 Judgment Logic of Three Parameter Combinations |
 |
Table 5 The Judgment Coincidence Rate of Three Parameter Combinations in Distinguishing Different Sample Types |
Discussion
Since the International Society on Thrombosis and Haemostasis (ISTH) recommended the clinical application of CWA in 2013, an increasing number of studies have focused on the use of CWA in various diseases.6,18 However, the peak-related parameters derived from existing analytical methods lack specificity. Whether due to coagulation factor deficiency, LA positivity, or the use of anticoagulant drugs, all can lead to a reduction in peak height.19 This restricts the applicability of peak-related parameters primarily to monitoring disease severity in known sample types, such as the severity of hemophilia.20 Additionally, previous studies have shown a trend of correlation between peak-related parameters and coagulation factor activity, but the correlation is not strong. This is related to the influence of FIB on peak-related parameters.21 Therefore, the characteristic parameters of CWA-APTT have not been fully utilized.19,22 In this study, we, for the first time, eliminated the interference of FIB concentration on peak-related parameters through normalization. The normalized peak-related parameters demonstrated a higher correlation with coagulation factor activity, providing an important theoretical basis for the clinical use of peak-related parameters to assess coagulation factor activity.
Time-distribution parameters focus on describing the changes in enzymatic reaction rates, with representative parameters including skewness, kurtosis, and centroid X. Clinical application of these parameters remains limited. Taking the first derivative curve as an example, it primarily describes the efficiency of thrombin in cleaving FIB. As shown in Figure 1, the left side of the curve represents the gradual activation of thrombin, with a high concentration of FIB, where the reaction rate is mainly limited by thrombin activity. The right side of the curve represents the rapid generation of thrombin, with the concentration of FIB decreasing as it is converted to fibrin, where the reaction rate is mainly limited by the remaining FIB concentration. Different sample types exhibit significant differences in the reaction rates on both sides—hemophilia A and B samples lack intrinsic coagulation factors, resulting in a slow thrombin generation process and thus predominantly showing left skewness (defined here as negative skewness). Samples from patients taking anti-IIa drugs have thrombin binding sites occupied, preventing thrombin from cleaving FIB for an extended period (prolonged baseline phase). Once the anti-IIa drugs are depleted, FIB is rapidly cleaved, causing the curve to skew right (defined here as positive skewness). LA samples contain phospholipid antibodies that interfere with the entire coagulation process, resulting in a mean skewness close to 0, with significant variability and a wide range of positive and negative skewness values. Therefore, time-distribution parameters exhibit certain specificity across different sample types. They can not only be used to monitor coagulation factor activity (eg., in hemophilia A and B samples, parameters such as centroid X and kurtosis show significant correlations with coagulation factor activity) but also to differentiate sample types. In this study, we sequentially analyzed the ability of single time-distribution parameters and multi-parameter combinations to differentiate between sample types. We found that multi-parameter combinations can better distinguish sample types, with a differentiation capability comparable to that of the APTT mix test, while offering the advantage of simpler operation. For medical institutions that do not perform coagulation factor activity testing, CWA-APTT parameters can be used to effectively identify hemophilia patients, reducing medical costs and associated risks.
The limitations of this study are as follows: First, the curve feature analysis has poor identification ability for HA with inhibitors samples, mainly due to the inability to perform time-dependent analysis. Therefore, using curve features to identify time-dependent disease samples is less accurate than APTT mix test. Second, this study only analyzed the differences in CWA-APTT parameters in hemophilia patients and lupus-positive patients, and did not apply these parameters to other diseases. A 2021 study showed that CWA-APTT can reveal subtle changes in the hemostatic system after major hepatobiliary and pancreatic surgeries.23 Future research could expand the analysis methods and application of these parameters to the diagnosis and treatment of other diseases. Finally, this study only analyzed CWA-APTT parameters and did not combine them with other coagulation curve parameters. A 2024 study on coagulation curves demonstrated that CWA analysis based on APTT and PT is a valuable tool for evaluating bleeding tendencies in acute promyelocytic leukemia (APL), providing a new method for assessing systemic hemostasis, predicting bleeding risk, and improving APL patient management.24 Future research could comprehensively analyze different coagulation curve parameters to offer new insights into the diagnosis and treatment of thrombotic and hemostatic disorders.
In summary, this study effectively improved the correlation between coagulation curve parameters and coagulation factor activity by standardizing the absorbance curve. It also found that time-distribution parameters are correlated with coagulation factor activity and can identify the severity of hemophilia. Different types of plasma samples exhibit significant differences in time-distribution parameters, and multi-parameter combinations can be used for sample type differentiation. This study provides new ideas and methods for better utilizing CWA-APTT parameters in clinical practice.
Conclusion
This study proposes a new approach to applying APTT coagulation curve characteristic parameters. Normalization processing enables peak-related parameters to more accurately reflect coagulation factor activity, and multi-parameter combined analysis enhances sample type differentiation. This provides a new strategy for utilizing APTT coagulation curve characteristic parameters in clinical practice: first, combining time-distribution parameters to differentiate sample types, and then using peak-related parameters to monitor disease severity.
Data Sharing Statement
The datasets used and analyzed during the current study are available from the corresponding author on reasonable request.
Ethics Statement
All patients provided written informed consent. This study was approved by the Ethics Committee of the Second Affiliated Hospital of Chongqing Medical University (Approval No.: 2023640). This study complies with the Declaration of Helsinki.
Author Contributions
All authors made a significant contribution to the work reported, whether that is in the conception, study design, execution, acquisition of data, analysis, and interpretation, or in all these areas; took part in drafting, revising, or critically reviewing the article; gave final approval of the version to be published; have agreed on the journal to which the article has been submitted; and agree to be accountable for all aspects of the work.
Funding
There is no funding to report.
Disclosure
The authors report no conflicts of interest in this work.
References
1. Chornenki NLJ, Fralick M, Sholzberg M. International normalized ratio and activated partial thromboplastin time testing. Can Med Assoc J. 2022;194(33):E1135. doi:10.1503/cmaj.220629
2. Song J, Li N, Li R, Xu Y. Clinical value of coagulation function indicators in children with severe pneumonia. Int J Gen Med. 2024;17:4659–12. doi:10.2147/IJGM.S478443
3. Intagliata NM, Caldwell SH, Tripodi A. Diagnosis, development, and treatment of portal vein thrombosis in patients with and without cirrhosis. Gastroenterology. 2019;156(6):1582–1599. doi:10.1053/j.gastro.2019.01.265
4. O’Connor SD, Taylor AJ, Williams EC, Winter TC. Coagulation concepts update. Am J Roentgenol. 2009;193(6):1656–1664. doi:10.2214/AJR.08.2191
5. Favaloro EJ, Pasalic L. Routine coagulation. Clin Lab Med. 2024;44(3):527–539. doi:10.1016/j.cll.2024.04.012
6. Wada H, Matsumoto T, Ohishi K, Shiraki K, Shimaoka M. Update on the clot waveform analysis. Clin Appl Thromb-Hem. 2020;26:1076029620912027. doi:10.1177/1076029620912027
7. Nogami K. Clot waveform analysis for monitoring hemostasis. Semin Thromb Hemost. 2023;49(6):592–599. doi:10.1055/s-0042-1756706
8. Tan CW, Cheen MHH, Wong WH, et al. Elevated activated partial thromboplastin time-based clot waveform analysis markers have strong positive association with acute venous thromboembolism. Biochem Medica. 2019;29(2):20710.
9. Milos M, Coen Herak D, Mahmoud Hourani Soutari N, et al. Overall hemostasis potential and aPTT-clot waveform analysis as powerful laboratory diagnostic tools for identification of hemophilia A patients with unexpected bleeding phenotype. Int J Lab Hematol. 2021;43(2):273–280. doi:10.1111/ijlh.13347
10. Gupta D, Arya V, Dass J, et al. Assessment of the phenotypic severity of hemophilia A: using rotational thromboelastometry (ROTEM) and APTT-clot waveform analysis. Blood Res. 2024;59(1):19. doi:10.1007/s44313-024-00018-6
11. Ruberto MF, Marongiu F, Mandas A, et al. The venous thromboembolic risk and the clot wave analysis: a useful relationship? Clin Chem Lab Med. 2018;56(3):448–453. doi:10.1515/cclm-2017-0678
12. Ruberto MF, Sorbello O, Civolani A, Barcellona D, Demelia L, Marongiu F. Clot wave analysis and thromboembolic score in liver cirrhosis: two opposing phenomena. Int J Lab Hematol. 2017;39(4):369–374. doi:10.1111/ijlh.12635
13. Shima M, Matsumoto T, Fukuda K, et al. The utility of activated partial thromboplastin time (aPTT) clot waveform analysis in the investigation of hemophilia A patients with very low levels of factor VIII activity (FVIII:C). Thromb Haemostasis. 2002;87(3):436–441. doi:10.1055/s-0037-1613023
14. Matsumoto T, Shima M, Takeyama M, et al. The measurement of low levels of factor VIII or factor IX in hemophilia A and hemophilia B plasma by clot waveform analysis and thrombin generation assay. J Thromb Haemost. 2006;4(2):377–384. doi:10.1111/j.1538-7836.2006.01730.x
15. Matsumoto T, Nogami K, Tabuchi Y, et al. Clot waveform analysis using CS-2000i distinguishes between very low and absent levels of factor VIII activity in patients with severe haemophilia A. Haemophilia. 2017;23(5):e427–e435. doi:10.1111/hae.13266
16. Suzuki A, Suzuki N, Kanematsu T, et al. Clot waveform analysis in Clauss fibrinogen assay contributes to classification of fibrinogen disorders. Thromb Res. 2019;174:98–103. doi:10.1016/j.thromres.2018.12.018
17. Matsumoto T, Nogami K, Shima M. A combined approach using global coagulation assays quickly differentiates coagulation disorders with prolonged aPTT and low levels of FVIII activity. Int J Hematol. 2017;105(2):174–183. doi:10.1007/s12185-016-2108-x
18. Sevenet PO, Depasse F. Clot waveform analysis: where do we stand in 2017? Int J Lab Hematol. 2017;39(6):561–568. doi:10.1111/ijlh.12724
19. Wada H, Shiraki K, Matsumoto T, Shimpo H, Shimaoka M. Clot waveform analysis for hemostatic abnormalities. Ann Lab Med. 2023;43(6):531–538. doi:10.3343/alm.2023.43.6.531
20. Drissi E, Ben Lakhal F, Ghali O, et al. Clot waveform analysis in hemophilia carriers. Blood Coagul Fibrin. 2025;36(1):8–13. doi:10.1097/MBC.0000000000001331
21. Leenaerts D, Aernouts J, Van Der Veken P, Sim Y, Lambeir A, Hendriks D. Plasma carboxypeptidase U (CPU, CPB2, TAFIa) generation during in vitro clot lysis and its interplay between coagulation and fibrinolysis. Thromb Haemostasis. 2017;117(8):1498–1508. doi:10.1160/TH17-02-0097
22. Marongiu F, Ruberto MF, Marongiu S, Barcellona D. Clot waveform analysis: from hypercoagulability to hypocoagulability: a review. Arch Pathol Lab Med. 2024;148(12):1371–1375. doi:10.5858/arpa.2023-0453-RA
23. Maeda K, Wada H, Shinkai T, Tanemura A, Matsumoto T, Mizuno S. Evaluation of hemostatic abnormalities in patients who underwent major hepatobiliary pancreatic surgery using activated partial thromboplastin time-clot waveform analysis. Thromb Res. 2021;201:154–160. doi:10.1016/j.thromres.2021.03.030
24. Terras M, El Borgi W, Betbout W, et al. Clot waveform analysis in acute promyelocytic leukemia. Blood Coagul Fibrin. 2024;35(1):27–31. doi:10.1097/MBC.0000000000001265
 © 2026 The Author(s). This work is published and licensed by Dove Medical Press Limited. The
full terms of this license are available at https://www.dovepress.com/terms
and incorporate the Creative Commons Attribution
- Non Commercial (unported, 4.0) License.
By accessing the work you hereby accept the Terms. Non-commercial uses of the work are permitted
without any further permission from Dove Medical Press Limited, provided the work is properly
attributed. For permission for commercial use of this work, please see paragraphs 4.2 and 5 of our Terms.
© 2026 The Author(s). This work is published and licensed by Dove Medical Press Limited. The
full terms of this license are available at https://www.dovepress.com/terms
and incorporate the Creative Commons Attribution
- Non Commercial (unported, 4.0) License.
By accessing the work you hereby accept the Terms. Non-commercial uses of the work are permitted
without any further permission from Dove Medical Press Limited, provided the work is properly
attributed. For permission for commercial use of this work, please see paragraphs 4.2 and 5 of our Terms.