Back to Journals » Therapeutics and Clinical Risk Management » Volume 17
Neutrophil/Lymphocyte Ratio as an Inflammatory Predictor of Dry Eye Disease: A Case-Control Study
Authors Meng YF, Pu Q ![]() , Ma Q, Zhu W
, Ma Q, Zhu W ![]() , Li XY
, Li XY ![]()
Received 18 December 2020
Accepted for publication 5 March 2021
Published 23 March 2021 Volume 2021:17 Pages 259—266
DOI https://doi.org/10.2147/TCRM.S298156
Checked for plagiarism Yes
Review by Single anonymous peer review
Peer reviewer comments 2
Editor who approved publication: Professor De Yun Wang
Yi-Fang Meng,1,2,* Qi Pu,1,* Qian Ma,1 Wei Zhu,2 Xin-Yu Li1
1Department of Ophthalmology, Tongji Hospital, Tongji Medical College, Huazhong University of Science and Technology, Wuhan, Hubei, People’s Republic of China; 2Department of Ophthalmology, Changshu No. 2 People’s Hospital, Changshu, Jiangsu, People’s Republic of China
*These authors contributed equally to this work
Correspondence: Xin-Yu Li
Department of Ophthalmology, Tongji Hospital, Tongji Medical College, Huazhong University of Science and Technology, 1095 Jiefang Avenue, Wuhan, Hubei, 430030, People’s Republic of China
Tel/Fax +86-027-83663456
Email [email protected]
Wei Zhu
Department of Ophthalmology, Changshu No. 2 People’s Hospital, Changshu, Jiangsu, People’s Republic of China
Email [email protected]
Background: The neutrophil-to-lymphocyte ratio (NLR) and platelet-to-lymphocyte ratio (PLR) have been used as indicators of inflammation, however, their roles in dry eye disease (DED) patients require advanced study
Materials and Methods: A total of 104 DED cases and 97 healthy controls from January 2020 to May 2020 were enrolled in this study. The dry eye related clinical variables, including Schirmer I test, tear break-up time (TBUT), corneal fluorescein staining (CFS) and Ocular Surface Disease Index (OSDI), were detected in all the participants. Besides, the NLR and PLR pattern in DED cases were detected and their potential value as inflammatory predictors of DED were evaluated. In advanced analyses, the correlation between NLR and DED severity was examined.
Results: The NLR and PLR were 2.59 ± 1.25 and 117.48 ± 54.68 in the DED group, respectively, while they were 2.20 ± 1.24 and 115.48 ± 54.33 in the control group, respectively. The NLR was higher in the DED group (p = 0.027), however, PLR was not significantly different compared with the control group (p = 0.951). In advanced analyses, it was found that more severe TBUT, CFS, and OSDI scores were detected in the high NLR group (NLR ≥ 2.145, p = 0.003, 0.013, and 0.017, respectively) compared with the low NLR group (NLR < 2.145).
Conclusion: The NLR value, but not PLR, of DED patients was higher than that of healthy controls. The NLR could be used as an inflammatory predictor to estimate the severity of DED.
Keywords: dry eye disease, neutrophil-to-lymphocyte ratio, platelet-to-lymphocyte ratio, case-control study, risk factor
Background
Dry eye disease (DED), one of the most common chronic ocular surface diseases, has been reported to have affected a huge number of patients with a prevalence ranging from 5 to 50%.1 DED is regarded as a multi-factor disease and the most common pathological progresses include tear film instability, tear hyperosmolarity, ocular surface inflammation and neurosensory abnormalities.2 Although it is recognized that inflammation is regarded as a key factor in the development of DED as well as the cause of ocular symptoms and signs,3–5 the exact mechanism of inflammation in DED remains unclear. It has long been considered that ocular inflammatory markers could be related with the incidence of DED,6 however, the relatively smallamount of tear samples and high detection cost have limited their clinical application in DED cases.
Naturally, researchers have focused their attention on the research of the potential circulating biomarkers of DED. Several previous studies demonstrated that serum biomarkers, such as epidermal fatty-acid binding protein and vitamin D,7,8 were associated with the risk of DED. Because of the advantages of low-cost and easy operation, the diagnostic and prognostic values of NLR and PLR have been widely reported in various diseases, including diabetes, cardiovascular diseases, renal disorders, autoimmune diseases and cancers.9–16 In addition, the potential application of NLR and PLR in ocular diseases was explored, and NLR and/or PLR were reported to be a biomarker for diabetic retinopathy (DR),17 age-related macular degeneration (AMD),18 and retinal vein occlusion (RVO).19,20 One previous study reported that both NLR and PLR in DED cases were higher than in healthy controls, but their correlations with DED-related indexes were insufficient.21 The purpose of this case-control study was to detect NLR and PLR values in Chinese DED cases and to evaluate their potential predictive value in estimating the inflammatory status in DED cases.
Materials and Methods
A prospective case-control study design was used in this research. We hypothesized that higher NLR/PLR would be detected in the DED group compared with the control group. In this current study, DED cases and age/gender matched controls were included . Based on the results of a previous report,21 it was calculated that the minimum number of included participants of each group was 20. The study was carried out in accordance with the Declaration of Helsinki and approved by the Ethics Committee of Changshu No. 2 Hospital. Details of the study were explained to the participants and signed informed consents were obtained.
Participants
Medical information and OSDI questionnaire results were obtained from all the participants. A detailed examination was completed of ocular symptoms and signs, oral symptoms, histopathology, salivary gland involvement, and serum autoantibody. All the participants were strictly screened according to the following criteria.
Inclusion criteria of DED group: (1) Schirmer I test (without anesthesia) <5 mm/5 minutes; and/or (2) TBUT <10s; and/or (3) Positive corneal fluorescein staining; and (4) OSDI ≥13 points.
Inclusion criteria of control group: (1) Schirmer 1 test (without anesthesia) >10 mm/5 minutes; (2) TBUT >10s; (3) Corneal fluorescein staining is negative; (4) OSDI <13 points.
Exclusion criteria of both groups: (1) With a prescription history of tropical or systemic immunosuppressant and hormone medication in three months. (2) Those who underwent ocular surgery (cataract surgery, corneal surgery, conjunctiva surgery, etc.), lacrimal canal surgery and tear gland surgery in recent three months; (3) With a history of eye trauma, eyelid deformity, and corneal contact lens wearing within three months; (4) Those who suffered from glaucoma, DR, keratoconus (KC), RVO, thyroid-associated ophthalmopathy (TAO), AMD, inflammatory ocular diseases, and other ocular diseases related to NLR/PLR; (5) Those who suffered from diabetes, cardiovascular disease, acute/chronic infections, autoimmune diseases, hematological diseases and malignant tumors.
Finally, 104 DED cases and 97 healthy controls were included in this study.
Examinations and Measurements
Each patient underwent a basic ophthalmic examination including slit-lamp photograph, Schirmer I test, TBUT, and was required to complete the OSDI questionnaire. A folded Schirmer paper strip (5×35 mm) was placed at the outer third lower eyelid margin for 5 minutes and the wetting length of Schirmer paper was recorded as Schirmer scores.22 The participants completed the Schirmer I test without anesthesia. TBUT was detected by recording the interval of time between complete blink and the appearance of the first break in the tear film.22 CFS was tested by slit-lamp photograph under the cobalt blue filter, and the cornea was divided into 4 quadrants, each quadrant was scored separately: 0 (no staining), 1 (<30 points), 2 (>30 points but the staining is not fused), or 3 (clumps staining, filaments or ulcer), and the sum of the four quadrants would be used in data analyses. The OSDI was a 12-item questionnaire with a total score of 48 and this was transformed to 100 points for advanced analyses. Each answer was graded on a 5-point scale (0–4) based on the symptom frequency: (0) none of the time, (1) some of the time, (2) half of the time, (3) most of the time, and (4) all of the time.23
Peripheral venous blood samples were obtained from all the participants. A complete blood count (CBC) was performed with a blood cell counter (ABX Pentra DF120, Horiba, Japan) and the counts of white blood cells, neutrophils, platelets, and lymphocytes was recorded. Meanwhile, to exclude Sjögren’s syndrome cases, other laboratory indexes including C reactive protein (CRP), antinuclear antibody, anti-Ro (SSA) or anti-La (SSB) antibodies, and rheumatoid factor were also tested. The NLR/PLR was calculated by dividing the neutrophil/platelet counts by the lymphocyte counts.
Statistical Analyses
Statistical analyses were performed using Graphpad Prism 8.3 (GraphPad Software Inc.). Continuous data were presented as mean ± standard deviation (SD), and the difference between two groups were detected using non-paired t test. Categorical variables were presented as the number of cases and controls and tested by chi-square analyses. Receiver-operating characteristic (ROC) curve analyses were performed to evaluate the diagnostic value of NLR for DED and thus determine the cut-off value. The correlations between NLR and DED indicators were conducted with the Pearson method and the linear correlation was simulated with the linear regression method. P<0.05 was considered statistically significant.
Results
Demographic Data and DED Indicators
There were 104 DED cases (48 males and 56 females) and 97 healthy controls (46 males and 51 females) enrolled in this study between January 2020 and May 2020. The average age was 54.68 ± 14.49 years in the DED group and 52.05 ± 13.74 years in the control group and there was no significant difference in age or gender distributions between the two groups (p = 0.600 and p = 0.888, respectively). There were statistically significant differences in Schirmer I test, TBUT, CFS and OSDI scores between DED cases and controls (p <0.001). The demographic data and DED indicators are presented in Table 1.
 |
Table 1 Demographic Data and DED Indicators in DED and Control Group |
Laboratory Findings
The blood parameters are presented in Table 2. In the DED group, the neutrophil, lymphocyte, platelet counts were 4.43 ± 1.27, 1.95 ± 0.71, 202.92 ± 56.40, respectively and the NLR and PLR values were 2.59 ± 1.25 and 117.48 ± 54.68, respectively. When the control group was considered, it was found that the neutrophil, lymphocyte and platelet counts were 4.08 ± 1.30, 2.18 ± 1.03 and 210.12 ± 49.46, respectively. The average of NLR was 2.20 ± 1.24, and PLR was 115.48 ± 54.33 in control group. There were no significant differences in counts of neutrophils, lymphocytes, or platelets between the two groups (p = 0.057, 0.070, and 0.340, respectively), as well as PLR (p = 0.951). There was a significant difference in NLR value between these two groups (p = 0.027).
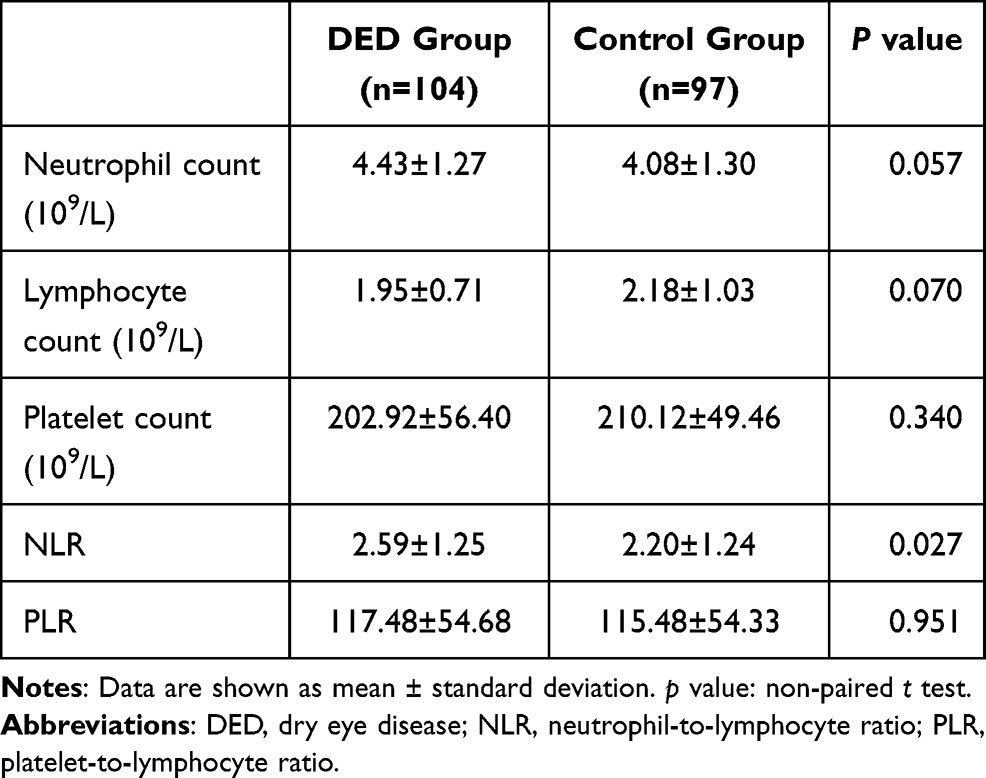 |
Table 2 Laboratory Findings in DED and Control Group |
Sensitivity and Specificity Analyses of NLR as an Inflammatory Predictor of DED
The ROC curve analyses demonstrated that NLR was an inflammatory biomarker of DED, and the result is shown in Figure 1. The cut-off value would be obtained when the NLR value provided highest sensitivity plus specificity value, thus NLR = 2.145 was accepted as the cut-off value. For the patients with DED, when NLR = 2.145, the sensitivity of NLR as a DED indicator was 62.89% (52.95–71.84%), and the specificity was 58.65% (49.05–67.65%). In the following studies, NLR = 2.145 was used to classify the high or low NLR group. However, PLR was not analyzed in this part because of a lack of significant difference between the DED cases and healthy controls.
 |
Figure 1 The diagnostic value of NLR and PLR for DED. (A) ROC curve for NLR with an AUC of 0.611 (95% CI, 0.533 - 0.6905, p = 0.006). When NLR = 2.145, sensitivity = 62.89% (52.95–71.84%) and specificity = 58.65% (49.05–67.65%). (B) ROC curve for PLR with an AUC of 0.508 (95% CI, 0.428– 0.589), p = 0.839). Abbreviations: DED, dry eye disease; NLR, neutrophil-to-lymphocyte ratio; PLR, platelet to lymphocyte ratio; AUC, area of under curve. |
Differences of Demographic and DED Indicators in Dry Eye Patients with High NLR and Low NLR
To further evaluate the DED indicators and demographic characteristic of DED patients in different level of NLR subgroups, the DED group was divided into high NLR group (NLR ≥2.145, n = 62) and low NLR group (NLR<2.145, n = 43). Compared with the control group, a significantly higher NLR was detected in the higher NLR group (p <0.001), however, no significant difference was detected in the low NLR group (p = 0.815). The distribution of age and gender of two high and low groups are shown in Table 3, and there were no significant differences (p = 0.148 and p = 0.165, respectively). The mean results of Schirmer I test, TBUT, OSDI questionnaire, and CFS of both subgroups are demonstrated in Table 3. The TBUT, OSDI points, and CFS scores of low NLR group were better than those of high NLR group, and the differences were statistically significant (p = 0.003, p = 0.013 and p = 0.017, respectively). However, there was no significant difference among the groups in terms of Schirmer I test.
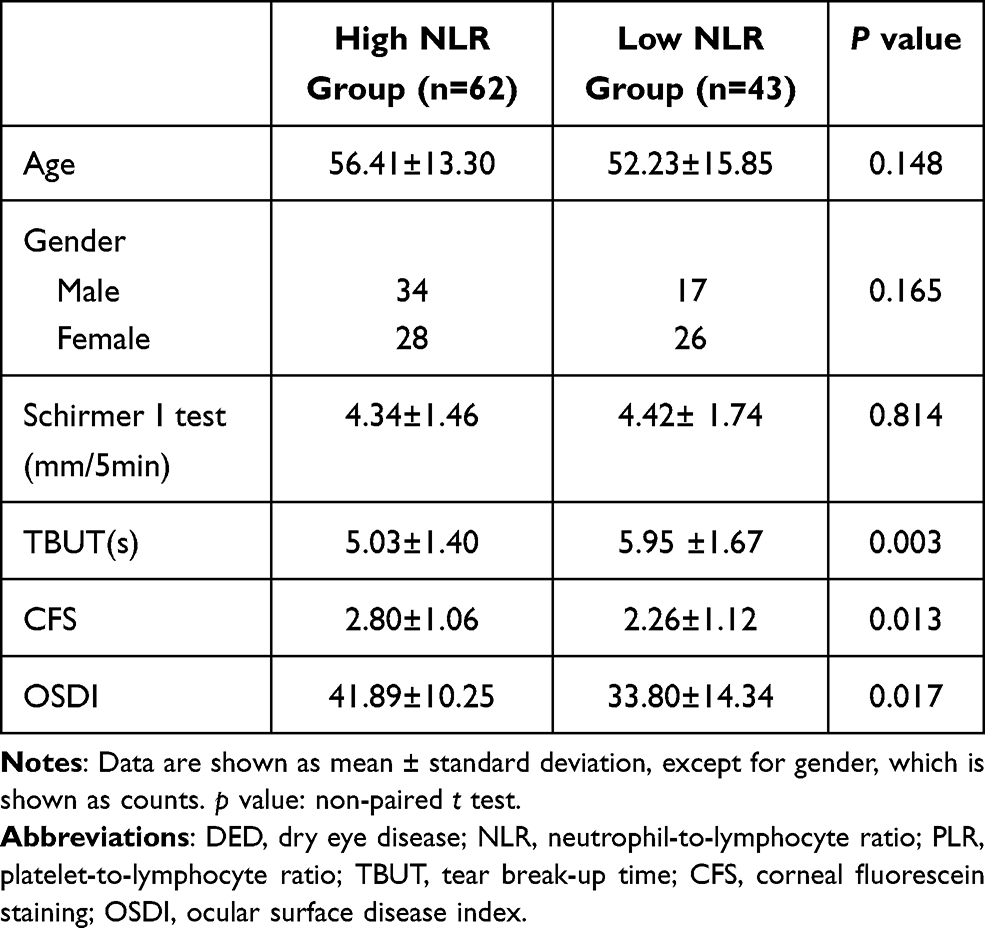 |
Table 3 The Demographic Data and Dry Eye Related Characteristics in DED Patients with High (≥2.145) or Low NLR (<2.145) |
Correlation Between NLR Value and DED Indicators of DED Cases
Correlation analyses was also performed to study the relationship between NLR value and DED indicators (Figure 2). It revealed a significant negative correlation between NLR and TBUT (p = 0.003). It was also found that there was a positive correlation between NLR and CFS (p = 0.017), as well as between NLR and OSDI (p <0.001). However, no significant correlation was found between Schirmer I test and NLR (p = 0.977).
 |
Figure 2 The association between NLR and dry eye related characteristics in dry eye disease patients. (A) Correlation of NLR with Schirmer I test (p = 0.977). (B) Correlation of NLR with TBUT (p = 0.003). (C) Correlation of NLR with CFS (p = 0.017). (D) Correlation of NLR with OSDI (p = 0.001). Abbreviations: DED, dry eye disease; TBUT, tear break-up time; CFS, corneal fluorescein staining; OSDI, ocular surface disease index; NLR, neutrophil-to-lymphocyte ratio. |
Discussion
DED is one of the most common ocular surface disorders and the burden of DED impacts the vision, life quality and work productivity considerably.1 As inflammation is a recognized pathophysiological mechanism in the development of DED, ocular inflammatory markers were proposed to be potential indicators of DED severity.2,24 Previous studies revealed that the levels of metalloproteinase (MMP)-9, fractalkine/CX3CL1, interleukin-1 receptor antagonist (IL-1Ra), IP-10/CXCL10, VEGF, IL-8, chemokines CCL3/MIP-1 alfa, CCL4/MIP-1 beta, CXCL9, -10, -11, and CXCR3 were all increased in DED cases.25–30 Therefore, the concentrations of inflammatory mediators in tear and conjunctival cell could be used to estimate the severity of DED and these inflammatory markers could be regarded as potential drug targets. Even though anti-inflammatory eye drops have been used in management of severe DED, ocular inflammatory markers were not used in the diagnosis or prognosis of DED. Local markers were suitable for the research design because these reflected the disease status directly. However, it was hard for clinical researchers to use tear samples in the DED management considering the relative smaller amount of tear samples and the difficulties in tear samples collection. In addition, there were huge difficulties in implementing immunoassays of inflammatory markers and it also limited the application of these assays.
Circulating samples, including plasma, serum and whole blood, have been widely used in biomarker development in various diseases. According to observational studies about the DED circulating samples, a low systemic level of omega fatty acids was a risk factor for DED31,32 and vitamin D played potential protective roles for DED.33,34 PLR and NLR, two new inflammatory indicators which derived from the major inflammatory cells, including neutrophils, platelets, and lymphocytes, showed extremely important clinical significance in recent studies. Both NLR and PLR have been widely used to determine the severity of inflammation in diabetes mellitus, cardiovascular disease, tumors, autoimmune diseases, and inflammatory diseases.9–16 Meanwhile, the relationships between ocular diseases and NLR/PLR were also explored. Researchers have found that some ocular diseases, such as DR, AMD, RVO, KC, optic neuritis, and glaucoma, are relevant to NLR and PLR.17–20,35–39 NLR was found to be higher in DR, AMD and KC cases compared with controls, and NLR values were related to the severity of diseases.17,18,35 In terms of PLR, Ozgonul et al. have proved the beneficial effects of the value of PLR in making the diagnosis and predicting the prognosis of patients with POAG.39
In the present study, we evaluated the NLR and PLR levels as biomarkers of inflammation and detected the relationship between their values and severity of DED. Our results demonstrated that the NLR value of the DED group was significantly higher than that of the healthy control group, while the difference in PLR value between the two groups was not significant. Consistent with the studies of Celik and Sekeryapan et al., we found that the level of NLR increased in DED patients, and the mean results were 2.6 ± 1.2 (Celik), 2.8 ± 1.4 (Sekeryapan et al.), and 2.59±1.25 (this study), respectively.21,40 It demonstrated that NLR value was relatively stable in DED patients, and could be a potential DED inflammatory indicator. However, we failed to detect a difference of PLR between DED subjects and healthy participants, which is inconsistent with the results of Celik’s research.21 The different conclusion on the relationship between PLR and DED risk might because of the ethnic and geographic differences as well as the relatively small amount of inclusion samples in both two studies. Besides, female DED patients accounted for 75% in Celik’s study, while they accounted for 53.8% in our study, thus gender distribution difference may be another explanation of the difference. It is necessary to conduct further studies with a larger sample size to research the judgment value of PLR of the DED cases. Different from Celik and Sekeryapan et al., to further explore the correlation between the level of NLR and DED indicators, we grouped the DED patients into low and high NLR groups with a cut-off of 2.145 and it was interesting that the NLR was higher only in the DED cases with high NLR, but not low NLR cases. In advanced analyses, we found that the results of TBUT, CFS, and OSDI were better in the low NLR group, and the difference was statistically significant (p = 0.003, 0.013, and 0.017, respectively). However, the difference of Schirmer I test outcome between two groups was not statistically significant (p = 0.814). In a word, high NLR level (NLR≥2.145) was related to severe DED cases. With the advantages of easy availability, stability, and low cost, NLR shows great potential as an inflammatory predictor of DED. Rather than simply providing us with another potential biomarker for DED, the results in this study highlighted the important role of neutrophils in the development of DED. A recent review demonstrated that the majority of cells in corneal lesions were derived primarily from neutrophils that induced inflammatory events that led to tissue damage.41 Neutrophil extracellular traps (NETs) formation, which was one of the pathological effect of neutrophils in DED, have attracted the researchers’ attention. Inhibition of citrullinated proteins, a key compound of NETs, provided another advanced therapy for DED.42 Meibomian glands dysfunction (MGD) was regarded to be concomitant with most DED cases, and the key role of neutrophil in the MGD incidence made us with increasingly interested in the role of neutrophils in DED incidence.43 DED might be related to systemic inflammation or the NLR value. Based on the increase of peripheral blood NLR in DED patients, to lower NLR by systemic drugs or other adjuvant treatments may improve the clinical symptoms of DED patients. This might be one of the mechanisms of applying anti-inflammatory drugs and polyunsaturated fatty acids to treat severe DED. Of course, this hypothesis needs verification by further clinical studies.
One of the limitations of our study was that when 2.145 was used as the cut-off value, the sensitivity (62.89%, 52.95%-71.84%) and specificity (58.65%, 49.05% - 67.65%) of NLR as a DED diagnostic indicator were not high enough. It should therefore be approached carefully as an inflammatory predictor for DED. Another limitation is that we did not observe dynamic changes of DED indicators and NLR levels of DED patients to find a suitable NLR cut-off value to predict DED prognosis.
In conclusion, the value of NLR was related to incidence of DED, and higher NLR indicates worse ocular symptoms. We provided the evidence of application of NLR as an inflammatory predictor for DED.
Acknowledgments
This work was supported in whole or in part by National Natural Science Foundation Project for Young Scientists of China (81700804), the Foundation for Young Medical Talents of Jiangsu Province (QNRC2016211) and Scientific Research Project of Jiangsu Health Commission (Z2019044).
Disclosure
The authors report no conflicts of interest in this work.
References
1. Stapleton F, Alves M, Bunya VY, et al. TFOS DEWS II epidemiology report. Ocul Surf. 2017;15(3):334–365.
2. Craig JP, Nichols KK, Akpek EK, et al. TFOS DEWS II definition and classification report. Ocul Surf. 2017;15(3):276–283. doi:10.1016/j.jtos.2017.05.008
3. Yamaguchi T. Inflammatory response in dry eye. Invest Ophthalmol Vis Sci. 2018;59(14):Des192–des199. doi:10.1167/iovs.17-23651
4. Baudouin C. A new approach for better comprehension of diseases of the ocular surface. J francais d’ophtalmologie. 2007;30(3):239–246. doi:10.1016/S0181-5512(07)89584-2
5. Rhee MK, Mah FS. Inflammation in dry eye disease: how do we break the cycle? Ophthalmology. 2017;124(11s):S14–s19. doi:10.1016/j.ophtha.2017.08.029
6. Wu X, Chen X, Ma Y, et al. Analysis of tear inflammatory molecules and clinical correlations in evaporative dry eye disease caused by meibomian gland dysfunction. Int Ophthalmol. 2020;40:3049–3058. doi:10.1007/s10792-020-01489-z
7. Shinzawa M, Dogru M, Den S, et al. Epidermal fatty acid-binding protein: a novel marker in the diagnosis of dry eye disease in sjogren syndrome. Int J Mol Sci. 2018;19(11):3463. doi:10.3390/ijms19113463
8. Meng YF, Lu J, Xing Q, Tao JJ, Xiao P. Lower serum Vitamin D level was associated with risk of dry eye syndrome. Med Sci Monit. 2017;23:2211–2216. doi:10.12659/MSM.901857
9. DiGangi C. Neutrophil-lymphocyte ratio: predicting cardiovascular and renal complications in patients with diabetes. J Am Assoc Nurse Pract. 2016;28(8):410–414. doi:10.1002/2327-6924.12366
10. Acet H, Ertaş F, Akıl MA, et al. Novel predictors of infarct-related artery patency for ST-segment elevation myocardial infarction: platelet-to-lymphocyte ratio, uric acid, and neutrophil-to-lymphocyte ratio. Anatolian J Cardiol. 2015;15(8):648–656. doi:10.5152/akd.2014.5592
11. Çiçek G, Açıkgoz SK, Bozbay M, et al. Neutrophil-lymphocyte ratio and platelet-lymphocyte ratio combination can predict prognosis in patients with ST-segment elevation myocardial infarction undergoing primary percutaneous coronary intervention. Angiology. 2015;66(5):441–447. doi:10.1177/0003319714535970
12. Yilmaz G, Sevinc C, Ustundag S, et al. The relationship between mean platelet volume and neutrophil/lymphocyte ratio with inflammation and proteinuria in chronic kidney disease. Saudi J Kidney Dis Transpl. 2017;28(1):90–94. doi:10.4103/1319-2442.198152
13. Wang RT, Zhang JR, Li Y, Liu T, Yu KJ. Neutrophil-Lymphocyte ratio is associated with arterial stiffness in diabetic retinopathy in type 2 diabetes. J Diabetes Complications. 2015;29(2):245–249. doi:10.1016/j.jdiacomp.2014.11.006
14. Hammad M, Shehata OZ, Abdel-Latif SM, El-Din AMM. Neutrophil/lymphocyte ratio and platelet/lymphocyte ratio in Behçet’s disease: which and when to use? Clin Rheumatol. 2018;37(10):2811–2817. doi:10.1007/s10067-018-4194-z
15. Çalışkan S, Sungur M, Kaba S, Özsoy E, Koca O, Öztürk M. Neutrophil-to-Lymphocyte ratio in renal cell carcinoma patients. Folia Med (Plovdiv). 2018;60(4):553–557. doi:10.2478/folmed-2018-0037
16. Sun JY, Mu N, Mu J, Zhang CG, Wang DM. Significance of Neutrophil/Lymphocyte ratio and Platelet/Lymphocyte ratio in patients with multiple myeloma. Zhongguo Shi Yan Xue Ye Xue Za Zhi. 2019;27(4):1185–1189. doi:10.19746/j.cnki.issn.1009-2137.2019.04.031
17. Ulu SM, Dogan M, Ahsen A, et al. Neutrophil-to-lymphocyte ratio as a quick and reliable predictive marker to diagnose the severity of diabetic retinopathy. Diabetes Technol Ther. 2013;15(11):942–947. doi:10.1089/dia.2013.0097
18. Ilhan N, Daglioglu MC, Ilhan O, et al. Assessment of Neutrophil/Lymphocyte ratio in patients with age-related macular degeneration. Ocul Immunol Inflamm. 2015;23(4):287–290. doi:10.3109/09273948.2014.921715
19. Zhu DD, Liu X. Neutrophil/Lymphocyte ratio and Platelet/Lymphocyte ratio in branch retinal vein occlusion. J Ophthalmol. 2019;2019:6043612. doi:10.1155/2019/6043612
20. Şahin M, Elbey B, Şahin A, Yüksel H, Türkcü FM, Çaça İ. Neutrophil-to-lymphocyte ratio and platelet-to-lymphocyte ratio in retinal vein occlusion. Clin Exp Optometry. 2020;103(4):490–494. doi:10.1111/cxo.13008
21. Celik T. Assessment of Neutrophil-to-Lymphocyte ratio and Platelet-to-Lymphocyte Ratio in patients with dry eye disease. Ocul Immunol Inflamm. 2017;26(8):1219–1222. doi:10.1080/09273948.2017.1340486
22. Wolffsohn JS, Arita R, Chalmers R, et al. TFOS DEWS II diagnostic methodology report. Ocul Surf. 2017;15(3):539–574.
23. Schiffman RM, Christianson MD, Jacobsen G, Hirsch JD, Reis BL. Reliability and validity of the ocular surface disease index. Arch Ophthalmol. 2000;118(5):615–621. doi:10.1001/archopht.118.5.615
24. Wei Y, Asbell PA. The core mechanism of dry eye disease is inflammation. Eye Contact Lens. 2014;40(4):248–256. doi:10.1097/ICL.0000000000000042
25. Chotikavanich S, de Paiva CS, Li DQ, et al. Production and activity of matrix metalloproteinase-9 on the ocular surface increase in dysfunctional tear syndrome. Invest Ophthalmol Vis Sci. 2009;50(7):3203–3209. doi:10.1167/iovs.08-2476
26. Acera A, Rocha G, Vecino E, Lema I, Durán JA. Inflammatory markers in the tears of patients with ocular surface disease. Ophthalmic Res. 2008;40(6):315–321. doi:10.1159/000150445
27. Enríquez-de-salamanca A, Castellanos E, Stern ME, et al. Tear cytokine and chemokine analysis and clinical correlations in evaporative-type dry eye disease. Mol Vis. 2010;16:862–873.
28. Huang J-F, Zhang Y, Rittenhouse KD, Pickering EH, McDowell MT. Evaluations of tear protein markers in dry eye disease: repeatability of measurement and correlation with disease. Invest Ophthalmol Vis Sci. 2012;53(8):4556–4564. doi:10.1167/iovs.11-9054
29. Malesiński R, Bakunowicz-łazarczyk A, Wysocka J. The role of chemokines CCL3/MIP-1 alfa and CCL4/MIP-1 beta in pathogenesis of dry eye syndrome. Klin Oczna. 2008;110(7–9):277–279.
30. Yoon KC, Park CS, You IC, et al. Expression of CXCL9, -10, -11, and CXCR3 in the tear film and ocular surface of patients with dry eye syndrome. Invest Ophthalmol Vis Sci. 2010;51(2):643–650. doi:10.1167/iovs.09-3425
31. Barabino S, Horwath-Winter J, Messmer EM, Rolando M, Aragona P, Kinoshita S. The role of systemic and topical fatty acids for dry eye treatment. Prog Retin Eye Res. 2017;61:23–34. doi:10.1016/j.preteyeres.2017.05.003
32. Downie LE, Ng SM, Lindsley KB, Akpek EK. Omega-3 and omega-6 polyunsaturated fatty acids for dry eye disease. Cochrane Database Syst Rev. 2019;12:CD011016.
33. Meng YF, Xin Q, Lu J, Xiao P, Li J. Association between single nucleotide polymorphisms in the Vitamin D receptor and incidence of dry eye disease in chinese han population. Med Sci Monit. 2019;25:4759–4765. doi:10.12659/MSM.915434
34. Liu J, Dong Y, Wang Y. Vitamin D deficiency is associated with dry eye syndrome: a systematic review and meta-analysis. Acta Ophthalmol. 2020;98:749–754. doi:10.1111/aos.14470
35. Karaca EE, Özmen MC, Ekici F, Yüksel E, Türkoğlu Z. Neutrophil-to-lymphocyte ratio may predict progression in patients with keratoconus. Cornea. 2014;33(11):1168–1173. doi:10.1097/ICO.0000000000000260
36. Tang B, Li S, Han J, Cao W, Sun X. Associations between blood cell profiles and primary open-angle glaucoma: a retrospective case-control study. Ophthalmic Res. 2020;1–10.
37. Zhang A, Ning L, Han J, et al. Neutrophil-To-Lymphocyte ratio as a potential biomarker of neovascular glaucoma. Ocular Immunol Inflammation. 2019;1–8. doi:10.1080/09273948.2019.1677916
38. Li S, Cao W, Han J, Tang B, Sun X. The diagnostic value of white blood cell, neutrophil, neutrophil-to-lymphocyte ratio, and lymphocyte-to-monocyte ratio in patients with primary angle closure glaucoma. Oncotarget. 2017;8(40):68984–68995. doi:10.18632/oncotarget.16571
39. Ozgonul C, Sertoglu E, Mumcuoglu T, Kucukevcilioglu M. Neutrophil-to-Lymphocyte Ratio and Platelet-to-Lymphocyte ratio as novel biomarkers of primary open-angle glaucoma. J Glaucoma. 2016;25(10):e815–e820. doi:10.1097/IJG.0000000000000392
40. Sekeryapan B, Uzun F, Buyuktarakci S, Bulut A, Oner V. Neutrophil-to-Lymphocyte ratio increases in patients with dry eye. Cornea. 2016;35(7):983–986. doi:10.1097/ICO.0000000000000872
41. Garbutcheon-Singh KB, Carnt N, Pattamatta U, Samarawickrama C, White A, Calder V. A review of the Cytokine IL-17 in ocular surface and corneal disease. Curr Eye Res. 2019;44(1):1–10. doi:10.1080/02713683.2018.1519834
42. Kwon J, Surenkhuu B, Raju I, et al. Pathological consequences of anti-citrullinated protein antibodies in tear fluid and therapeutic potential of pooled human immune globulin-eye drops in dry eye disease. Ocul Surf. 2020;18(1):80–97. doi:10.1016/j.jtos.2019.10.004
43. Reyes NJ, Yu C, Mathew R, et al. Neutrophils cause obstruction of eyelid sebaceous glands in inflammatory eye disease in mice. Sci Transl Med. 2018;10:451. doi:10.1126/scitranslmed.aas9164
 © 2021 The Author(s). This work is published and licensed by Dove Medical Press Limited. The
full terms of this license are available at https://www.dovepress.com/terms
and incorporate the Creative Commons Attribution
- Non Commercial (unported, 3.0) License.
By accessing the work you hereby accept the Terms. Non-commercial uses of the work are permitted
without any further permission from Dove Medical Press Limited, provided the work is properly
attributed. For permission for commercial use of this work, please see paragraphs 4.2 and 5 of our Terms.
© 2021 The Author(s). This work is published and licensed by Dove Medical Press Limited. The
full terms of this license are available at https://www.dovepress.com/terms
and incorporate the Creative Commons Attribution
- Non Commercial (unported, 3.0) License.
By accessing the work you hereby accept the Terms. Non-commercial uses of the work are permitted
without any further permission from Dove Medical Press Limited, provided the work is properly
attributed. For permission for commercial use of this work, please see paragraphs 4.2 and 5 of our Terms.