")
Back to Journals » Therapeutics and Clinical Risk Management » Volume 12
Neutrophil-to-lymphocyte and platelet-to-lymphocyte ratios: are they useful for predicting gestational diabetes mellitus during pregnancy?
Authors Sargın MA, Yassa M, Taymur BD, Celik A, Ergun E, Tug N
Received 14 January 2016
Accepted for publication 16 March 2016
Published 26 April 2016 Volume 2016:12 Pages 657—665
DOI https://doi.org/10.2147/TCRM.S104247
Checked for plagiarism Yes
Review by Single anonymous peer review
Peer reviewer comments 4
Editor who approved publication: Professor Garry Walsh
Mehmet Akif Sargın, Murat Yassa, Bilge Dogan Taymur, Ayhan Celik, Emrah Ergun, Niyazi Tug
Department of Obstetrics and Gynecology, Fatih Sultan Mehmet Research and Training Hospital, Istanbul, Turkey
Objective: We aimed to investigate whether the neutrophil-to-lymphocyte ratio (NLR) and platelet-to-lymphocyte ratio (PLR) could be utilized to screen for gestational diabetes mellitus (GDM).
Subjects and methods: NLR and PLR were assessed by retrospective analysis of 762 healthy and pregnant women with GDM. The patients were stratified into four groups, as follows: GDM (n=144), impaired glucose tolerance (n=76), only screen positive (n=238), and control (n=304).
Results: The leukocyte, neutrophil, and lymphocyte counts were significantly higher in the study groups compared with the control group (P=0.001; P<0.01). There were no statistically significant differences between the groups with respect to the NLR and PLR (P>0.05).
Conclusion: We do not recommend that blood NLR and PLR can be used to screen for GDM. However, increase in the leukocyte count is an important marker for GDM as it provides evidence of subclinical inflammation.
Keywords: inflammation, lymphocytes, neutrophils, platelets, pregnancy
Introduction
Gestational diabetes mellitus (GDM) is defined as a carbohydrate tolerance disorder that occurs for the first time during pregnancy or exists prior to pregnancy but has not been diagnosed previously. GDM is the most common metabolic disorder in pregnant women, and its incidence varies from 2% to 13%, depending on the country and the diagnostic criteria.1,2 A higher incidence of GDM was determined using the 75 g oral glucose tolerance test (OGTT), as recommended by the International Association of Diabetes and Pregnancy Study Groups in 2010.3 This test was also suggested in “The Hyperglycemia and Adverse Pregnancy Outcome” study.4 Moreover, the two-step approach is currently endorsed by the American College of Obstetricians and Gynecologists.5 The two-step approach includes 50 g oral glucose challenge test (GCT) for screening and a following 100 g 3-hour OGTT for the diagnosis of GDM.
GDM can recur at ratios of between 1/3 and 2/3 during succeeding pregnancies,6 and compared with normoglycemic pregnant women, patients who develop GDM have a 4.69-fold higher risk of developing diabetes mellitus (DM) during the 5-year period that follows the pregnancy and a 9.34-fold higher risk of developing DM after the 5-year period that follows the pregnancy.7 GDM is a major cause of perinatal (fetal macrosomia, shoulder dystocia, birth trauma, asphyxia, stillbirth, and polyhydramnios), neonatal (respiratory distress syndrome, hypoglycemia, hyperbilirubinemia, hypocalcemia, prematurity, and polycythemia), and maternal (preeclampsia, operative delivery, and urinary system infections) morbidity.8,9 Therefore, screening for GDM is important to prevent potential complications and to determine the risks both during and after pregnancy. The occurrence of insulin resistance and increases in the placental secretion of diabetogenic hormones, including progesterone, growth hormone, placental lactogen, and corticotropin-releasing hormone, during pregnancy are well known.10,11 GDM occurs as a consequence of insufficiencies in pancreatic function. Previous studies have shown that inflammation plays a role in the development of GDM and type 2 DM, and the association between GDM and type 2 DM and the interleukins (ILs), tumor necrosis factor-alpha (TNF-α), interferonγ, transforming growth factor-β, adiponectin, leptin, resistin, visfatin, and C-reactive protein (CRP) has been demonstrated in these studies.12–17 However, the costs and technical difficulties associated with the use of these inflammatory markers in daily clinical practice have limited their use. The clinical settings in low- and middle-income countries with poor resources face feasibility problems of applying typical screening procedures and diagnostic criteria. Hence, it is important to develop more practical and low-cost screening tests18 so that screening for GDM may be available and applicable in primary health care setting with newer practical tools.
The neutrophil-to-lymphocyte ratio (NLR) and the platelet-to-lymphocyte ratio (PLR) are inflammatory markers that can be easily, rapidly, and inexpensively determined. NLR and PLR have been used as markers of inflammation or metastasis in cancers19 and inflammatory bowel disease,20 as prognostic markers in ischemic heart disease,21 and as screening tests for complications associated with DM. They have also been investigated as markers of the occurrence of hyperemesis gravidarum22 and preeclampsia23 and to determine the preeclampsia grade.24 NLR alone has been investigated for its ability to predict GDM.25 Therefore, in this study we aimed to investigate whether NLR and/or PLR could be utilized to screen for GDM by comparing these ratios in pregnant women with normal blood glucose levels and in pregnant women with GDM and impaired glucose tolerance (IGT).
Subjects and methods
This prospectively designed retrospective study was conducted between January 2013 and November 2015 in the Gynecology and Obstetrics Clinic at the Fatih Sultan Mehmet Training and Research Hospital. Ethical approval was obtained and the study protocol was reviewed and approved by the Fatih Sultan Mehmet Training and Research Hospital, The Commission of the Scientific Researches. Due to this being a retrospective study, patient consent was not obtained. Pregnant women who had performed a 50 g oral GCT and those whose plasma blood glucose levels were ≥140 mg/dL in the first hour following 100 g 3-hour OGTTs were included in the study.
The women’s age, body mass index (BMI), gravidity, parity, number of abortions, number of ectopic pregnancies, and the gestational age at which the tests were performed were recorded. To determine whether a woman should be assigned to a group containing individuals at a high risk for GDM, she was questioned about whether she had been overweight before the pregnancy, whether she had experienced rapid weight gain, and whether she had an unfavorable obstetric history, including GDM, during previous pregnancies, unexplained stillbirths, fetal anomalies and fetal macrosomia, and about diseases experienced by any first-degree relatives who had elevated risks of DM and GDM, including metabolic syndrome, polycystic ovary syndrome, and the use of corticosteroids. The complete blood counts, serum biochemistry values, complete urinalysis results, fasting blood glucose levels, and the results from the 50 g oral GCT were recorded. The gestational age was calculated based on the date of the woman’s last menstruation or first trimester ultrasonography. The blood counts and the urinalyses were performed on the same day as the glucose tolerance test (GTT). Pregnant women who had blood glucose levels <140 mg/dL following the 50 g oral GCT were assigned to the normal glucose tolerance (NGT) or control group. Pregnant women with fasting blood glucose levels ≥126 mg/dL were considered to have overt diabetes. The screening tests were considered positive if the blood glucose levels were ≥140 mg/dL following the 50 g oral GCT. A 3-day standard diet that comprised a daily intake of at least 250 g carbohydrates was administered. Following a 12-hour fasting, blood samples were collected from the antecubital veins from 8 am to 10 am while the women were seated, and the venous blood glucose levels were measured during the first, second, and third hours following a 100 g OGTT. A diagnosis of GDM was established in accordance with the Carpenter and Coustan criteria, if two or more blood glucose values were higher than the defined cutoff values, namely, fasting blood glucose levels <95 mg/dL and blood glucose levels of <180 mg/dL, <155 mg/dL, and <140 mg/dL during the first, second, and third hours, respectively, and IGT was diagnosed based on a single high value. Pregnant women with normal 100 g OGTT results were assigned to the only screen positive (OSP) group. Pregnant women who had blood glucose levels ≥200 mg/dL 2 hours after loading were considered to have overt diabetes. The diabetes treatment administered to the patients who were diagnosed with GDM, namely diet or insulin, was recorded. Pregnant women who had urinary infections, abnormal serum biochemistry results, pregestational DM, complaints that could cause infections on examination, leukocytosis or leukopenia, which were defined as >15,000 cells/μL and <3,500 cells/μL, respectively, preeclampsia, or chronic hypertension, or who were morbidly obese or had liver, kidney, or collagen tissue diseases, or could not tolerate the 50 g GCT or 100 g OGTT were excluded from the study.
Statistical analyses
The Number Cruncher Statistical System (NCSS) 2007 software (NCSS, LLC Kaysville, UT, USA) was used for statistical analyses. In addition to presenting the descriptive statistics, namely the mean values, standard deviation values, ranges, frequencies, and ratios, the results from one-way analyses of variance that were used for the intergroup comparisons of the normally distributed variables are presented. Games–Howell and Tukey’s honest significant difference tests were used to determine the groups that caused the significant differences. Student’s t-test was used to assess the data according to the treatment administered. The Kruskal–Wallis test was used for the intergroup comparisons of the non-normally-distributed variables, and the Mann–Whitney U-test was used in the two-group comparisons and to determine the groups that caused the significant differences. Fisher’s exact and the Fisher–Freeman–Halton tests were used for qualitative comparisons of the data. Statistical significance was accepted at the 5% level (P<0.05). All confidence intervals are reported at the 95% level.
Results
This study involved 762 pregnant women who had reliable, complete, and accessible medical records. The women’s demographic characteristics and laboratory findings are shown in Table 1. The patients were stratified into four groups based on their GTT results, as follows: GDM (n=144), IGT (n=76), OSP (n=238), and control (n=304).
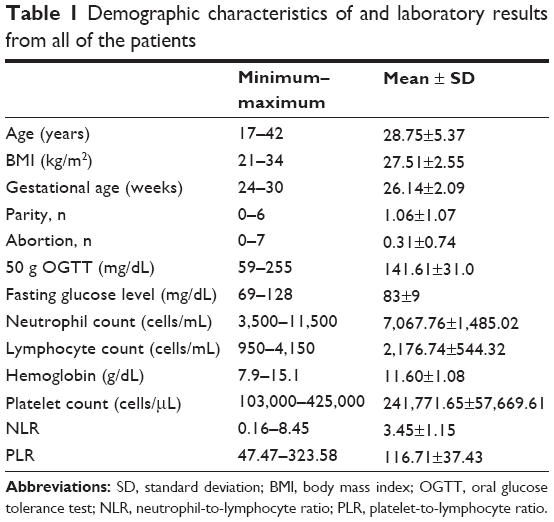 | Table 1 Demographic characteristics of and laboratory results from all of the patients |
There were statistically significant differences between the groups with respect to age, BMI, and the gestational age (P=0.001; P<0.01) (Table 2). Statistically significant differences were found with respect to age and BMI among the GDM, OSP, and control groups (P=0.001; P<0.01) (Table 3). The average age and BMI within the IGT group were significantly higher than those of the control group (P=0.001; P<0.01) (Table 3).
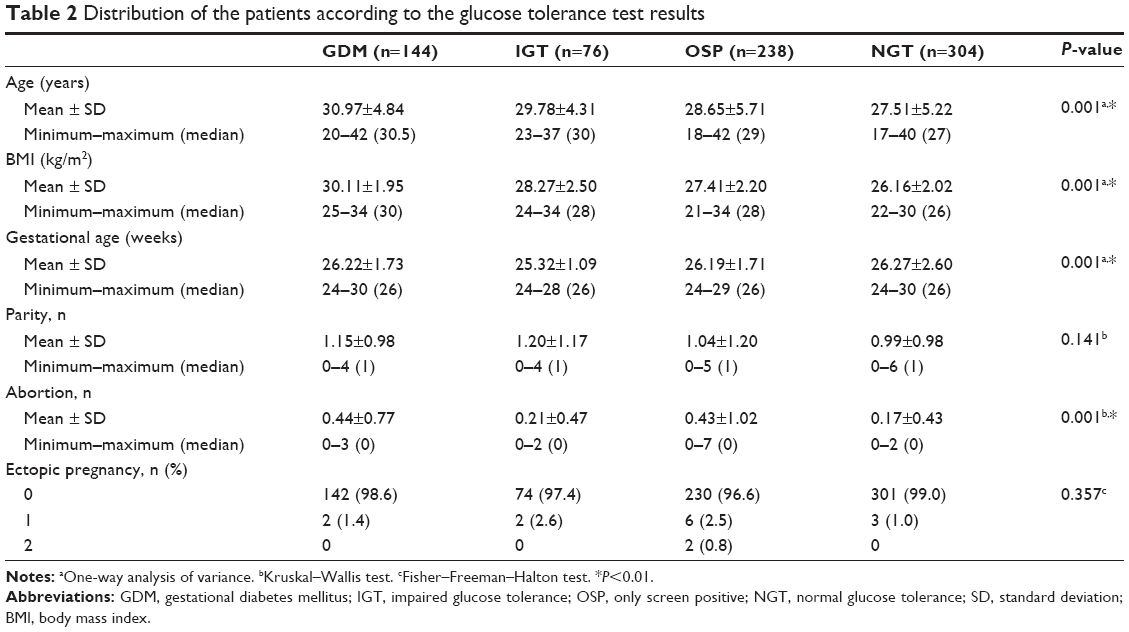 | Table 2 Distribution of the patients according to the glucose tolerance test results |
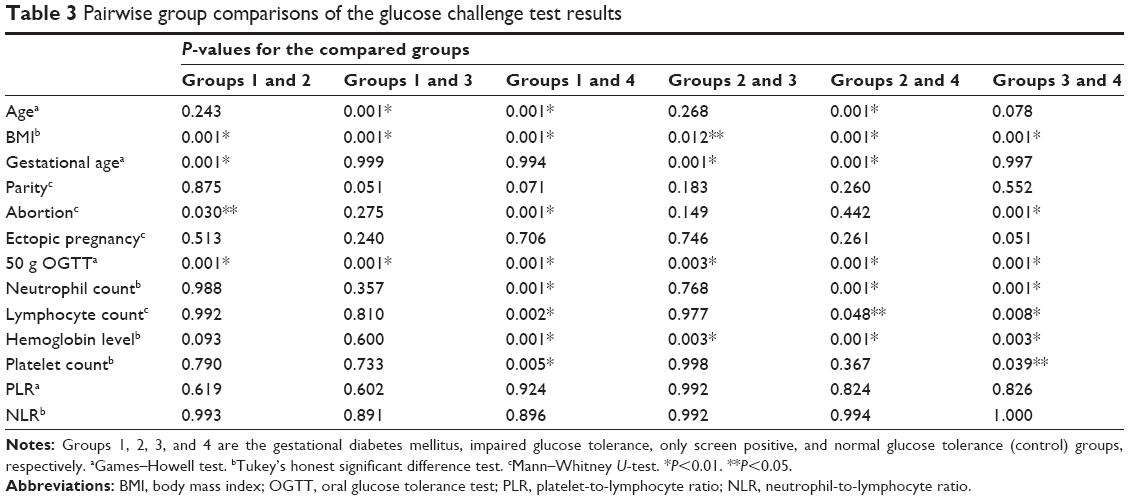 | Table 3 Pairwise group comparisons of the glucose challenge test results |
The paired comparisons determined that the gestational age of the GDM group was significantly higher than that of the IGT group (P<0.01) (Table 3). The gestational age of the IGT group was significantly lower than those of the OSP and control groups (P=0.001) (Table 3). No statistically significant differences were found among the other groups with respect to the gestational age (P>0.05). As we show in pairwise group comparisons, group 2 (IGT) causes a statistical difference with regard to gestational age. However, we think it has no clinical meaning in routine practice, as our primary targeted study group was group 1 (GDM patients).
The groups’ laboratory results are presented in Table 4. There were statistically significant differences among the groups in relation to the leukocyte, neutrophil, and lymphocyte counts (P=0.001; P<0.01). The paired comparisons determined that the leukocyte, neutrophil, and lymphocyte counts were significantly higher in the GDM, IGT, and OSP groups compared to the control group (P=0.001; P<0.01) (Table 3). There were no statistically significant differences among the GDM, IGT, and OSP groups in relation to the leukocyte, neutrophil, and lymphocyte counts (P>0.05).
 | Table 4 Laboratory measurements, NLR, and PLR of the patients with different glycemic tolerance status |
The platelet counts differed significantly among the groups (P=0.001; P<0.01) (Table 4). The paired comparisons showed that the platelet count was significantly higher in the GDM group compared with the control group (P=0.005; P<0.01) (Table 3). There were no statistically significant differences among the groups with respect to NLR and PLR (P>0.05) (Table 4).
The demographic characteristics of and the laboratory results from the patients with GDM who were stratified according to the treatment administered are shown in Table 5. Statistically significant differences were evident in relation to the 50 g OGTT results according to the treatment method used (P=0.001; P<0.01). The 50 g OGTT values were higher in the patients who had received insulin treatment compared with the patients who were managed through diet (Table 5). The neutrophil, lymphocyte, and platelet counts, the hemoglobin levels, and the NLR and PLR did not differ significantly between the GDM patients who received insulin and those who were managed through diet (P>0.05).
 | Table 5 Demographic characteristics of and laboratory results from the patients with gestational diabetes mellitus, stratified according to diet management or insulin treatment |
Discussion
The findings from this study show that the NLR and PLR are not suitable screening tools for GDM at gestational ages of between 24 weeks and 30 weeks. According to a literature search with the related keywords in relevant topics, this is the first study to compare both NLR and PLR in patients with GDM or IGT. In addition, this is the first study that shows no relation between NLR and PLR with GDM.
Previous study findings have demonstrated that leukocyte count is associated with GDM and type 2 DM. In a prospective study of 2,753 pregnancies, Wolf et al26 determined that compared with the normoglycemic pregnant women, the first trimester leukocyte count was significantly higher in the patients who developed GDM at 10.5±2.2×10³ cells/mL; they also determined linear correlations between the increases in the leukocyte counts and the abnormal GCT and OGTT results during the second and third trimesters. They asserted that their results confirmed the existence of inflammation as a component of the etiology of GDM. However, the neutrophil and lymphocyte counts were not determined separately in their study and, thus, the NLR and PLR were not calculated. In our study, the neutrophil (7,467±1,437 cells/mL) and the lymphocyte (2,274±599 cells/mL) counts were higher in the GDM, IGT, and OSP groups compared to the control group, but no statistically significant difference was found between the GDM and the control groups in relation to NLR.
The findings from a study of 42 patients with GDM and 68 normoglycemic pregnant women conducted by Yilmaz et al25 showed that NLR was significantly higher in the patients with GDM. The leukocytosis limit in their study was >12,000 cells/mL, and they excluded pregnant women whose leukocytosis exceeded this limit. They found that the average leukocyte count was 7,715±1,463 cells/mL in the GDM group. Yilmaz et al divided their patients into the GDM and non-GDM groups but did not include any subgroups. However, increases in leukocyte counts of up to 15,000 cells/mL during the second and third trimesters are considered normal hematological changes that are associated with pregnancy;27 therefore, the leukocytosis limit in our study was >15,000 cells/mL, and GDM, IGT, and OSP groups comprised part of the study. The leukocyte counts in the current study were 11,300±2,239 cells/mL in the GDM group and 10,618±2,150 cells/mL in the IGT group; hence, they were higher than those determined by Yilmaz et al. In contrast to their study, we analyzed both NLR and the PLR, but we could not determine significant differences among the groups. Moradi et al28 showed that an elevated leukocyte count, even within the normal range, is associated with chronic complications in type 2 diabetes, such as retinopathy and albuminuria. The findings from a study by Vozarova et al29 showed that a high leukocyte count is a predictive factor for the development of type 2 DM and a reduction in insulin sensitivity. A high leukocyte count is a marker of inflammation, and it is thought that cytokine-induced insulin resistance is a central mechanism that underlies the relationship between inflammation and GDM and DM. In our study, the leukocyte counts were significantly higher during the second and early third trimesters in the women with OSP, IGT, or GDM.
Previous studies have demonstrated the existence of chronic low-grade inflammation and corresponding insulin resistance in the etiology of GDM and type 2 DM.12–14 The report from the PROMISE cohort study has stated that all leukocyte subtypes increase proportionally with insulin resistance in patients with DM.30
In the ATTICA study, Pitsavos et al15 compared inflammatory markers, including CRP, IL-6, TNF-α, homocysteine, and serum amyloid A, in patients with type 2 DM (n=210) with those in healthy subjects (n=2,338). They found that the CRP, IL-6, and TNF-α levels were significantly higher in patients with type 2 DM than those in healthy subjects. A multivariate analysis showed positive correlations between blood glucose, insulin, and the CRP and IL-6 levels.
Ozyer et al31 investigated the leukocyte counts and the CRP and IL-6 levels in pregnant women with NGT or GDM who underwent GTTs, and they found that these inflammatory markers were not associated with GDM during the second or early third trimesters. Moreover, the findings from a study conducted by Ozuguz et al32 showed that the high-sensitive (hs) CRP and plasma lipid levels were significantly higher and that the carotid intima–media thickness was significantly greater in the GDM group than in the control group at the 1-year postpartum follow-up assessment. They defined GDM as a transient metabolic syndrome and a subclinical inflammatory condition that is associated with elevated hsCRP levels. Xia et al33 evaluated early carotid atherosclerosis in patients with histories of GDM and found that the levels of hsCRP and asymmetric dimethylarginine, which is an endogenous nitric oxide synthase inhibitor, were higher in patients with histories of GDM compared to the control group. Atègbo et al34 investigated the effects of adipokines and cytokines on GDM and macrosomia and found that the serum adiponectin concentration was low but the levels of leptin, TNF-α, and IL-6 were high in the patients with GDM compared to those in the control group. Furthermore, the adipokine, leptin, TNF-α, and IL-6 levels were low in macrosomic newborns, and they were inversely proportional to the insulin levels and BMI values. Adiponectin and TNF-α levels were measured from 8 weeks to 14 weeks of pregnancy in the Parity, Inflammation, and Diabetes Study,35 and the adiponectin level was found to be associated with the BMI and showed inversely proportional decreases according to the gestational age. The investigators stated that neither the adiponectin level nor the TNF-α level was associated with the GCT and that adiponectin was not a predictor of GDM during the first trimester. The cytokines discussed in these studies are not used to screen for GDM because of their high analytical costs, difficulties associated with their assessment in daily practice, their low specificity, and the lack of quantitative cutoff values.
These cytokines or inflammatory markers are produced by T-helper 1 cells (IL-2, IFN-γ, and TNF-α), T-helper 2 cells (IL-4, IL-5, IL-6, IL-10, and IL-13), and fat tissue. In this study, we compared the neutrophil and lymphocyte counts in different groups to assess the relationship between GDM and inflammation and to demonstrate changes in the lymphocyte counts as sources of the increased cytokine levels in the blood. We did not find significant differences among the groups; however, higher lymphocyte counts were observed in the GDM, IGT, and OSP groups compared to the control group. No significant changes occurred in the absolute lymphocyte count or in the T- and B-lymphocyte counts in healthy women who had normal pregnancies.36 The findings from the current study suggest that the lymphocytes are an important source of the increases in the cytokine levels that are associated with GDM, and this concurs with the aforementioned literature.
Adipose tissue is an endocrine organ that is important in metabolic homeostasis, and adipocytes are most commonly seen in this tissue together with stromal preadipocytes, fibroblasts, endothelial cells, and immune cells.16 Adipocyte differentiation, glucose and lipid metabolism, and satiety play important roles in immune regulation, cardiovascular function, and neuroendocrine physiology. An increase in the level of body fat elevates the inflammatory cytokine levels, particularly TNF-α and IL-6 levels. Many aforementioned publications describe inflammation, increases in cytokine levels, as well as DM and their associations with obesity. However, in our study, no statistically significant difference was found between the GDM and the control groups in relation to the NLR.
As an indicator of the amount of maternal adipose tissue, we observed that the BMI was significantly higher in the GDM and IGT groups. Christian and Porter compared the IL-6, IL-8, CRP, TNF-α, and IL-1β levels during each trimester and in the postpartum period in women who had normal BMIs, were overweight, or were obese, and they showed that only the CRP and IL-6 levels increased proportionally with the BMI.37 Stewart et al17 demonstrated that the CRP levels increased significantly during each trimester and that the IL-6 levels increased during the second and third trimesters in obese women. Friis et al38 measured the levels of several serum inflammatory mediators, including CRP, IL-6, monocyte-chemoattractant protein-1, IL1-Rα, TNF receptor II, and IL-10, and they observed that the levels of these mediators increased during early pregnancy until the mid-pregnancy period but there were no significant increases in the levels of these mediators toward the end of pregnancy. Based on their results, and contrary to other studies, Friis et al asserted that increases in the levels of fat tissue during pregnancy were not associated with changes in the inflammatory condition. Sen et al39 investigated the effect of prepartum obesity on the inflammatory marker levels, oxidative stress, and the micronutrient status in their prospective case–control study, and observed increased levels of inflammation and oxidative stress as well as lower levels of nutritional antioxidant defenses in patients who had been obese before they became pregnant.
NLR has been used to predict DM complications, and it has been shown that an increase in NLR is a predictive factor for hearing loss40 and the development of diabetic retinopathy,41 early diabetic nephropathy,42 and coronary artery disease43 in patients with DM. Patients with only type 2 DM were involved in these studies, and they substantially differed from the patients in our study. For example, the patient population in our study was much younger, and our study was conducted on women who were at the earliest stages of GDM. Furthermore, GDM is an incipient disease compared to DM, and a pregnant woman’s exposure to the metabolic effects of DM is much shorter compared to those who have type 2 DM. Moreover, there are differences between our study and other studies in terms of the physiological effects of pregnancy and the accompanying metabolic and systemic changes associated with DM. We think that these demographic and clinical features, including the pregnancy status, the duration of diabetes, and the accompanying comorbidities, may be the causes that underlie the differences between our results and those that are reported in the literature.
The current study has some limitations, which include its retrospective design and the absence of laboratory data relating to the insulin levels or insulin resistance. Furthermore, some of the data for the inflammatory cytokines described in the literature could not be analyzed.
Conclusion
On the basis of our study, we do not recommend blood NLR and PLR as markers to be used to screen for GDM. The increase in the leukocyte count is an important marker for GDM, as it provides evidence of subclinical inflammation. NLR and PLR may be used during the postpartum period as screening tests in the follow-up of patients with GDM to prevent the development of type 2 DM and its complications. Further prospective studies are needed to determine the threshold values and frequency of follow-up assessments of NLR and PLR.
Disclosure
The authors declare that they have participated sufficiently in the work and take responsibility for the appropriate portions of the content. The authors declare no conflicts of interest in this work.
References
Magon N, Seshiah V. Gestational diabetes mellitus: non-insulin management. Indian J Endocrinol Metab. 2011;15(4):284–293. | ||
Ryan EA. Diagnosing gestational diabetes. Diabetologia. 2011;54(3):480–486. | ||
Panel, IADPSG Consensus. International association of diabetes and pregnancy study groups recommendations on the diagnosis and classification of hyperglycemia in pregnancy. Diabetes Care. 2010;33(3):676–682. | ||
Catalan PM, McIntyre HD, Cruickshank JK, et al. The Hyperglycemia and Adverse Pregnancy Outcome Study Associations of GDM and obesity with pregnancy outcomes. Diabetes Care. 2012;35(4):780–786. | ||
ACOG. Practice bulletin clinical management guidelines for obstetrician-gynaecologists. No 137. Obstet Gynecol. 2013;122:406–416. | ||
Getahun D, Fassett MJ, Jacobsen SJ. Gestational diabetes: risk of recurrence in subsequent pregnancies. Am J Obstet Gynecol. 2010;203(5):467.e1–e6. | ||
Bellamy L, Casas JP, Hingorani AD, Williams D. Type 2 diabetes mellitus after gestational diabetes: a systematic review and meta-analysis. Lancet. 2009;373(9677):1773–1779. | ||
Salzer L, Yogev Y. Complications of gestational diabetes. In: Petry CJ, editor. Gestational Diabetes: Origins, Complications, and Treatment. Boca Raton: Taylor & Francis Group; 2014:97–107. | ||
Mazor-Dray E, Levy A, Schlaeffer F, Sheiner E. Maternal urinary tract infection: is it independently associated with adverse pregnancy outcome? J Matern Fetal Med. 2009;22(2):124–128. | ||
Aviram A, Yogev Y. Metabolic and hormonal changes in normal and diabetic pregnancy. In: Langer O, editor. The Diabetes in Pregnancy Dilemma: Leading Change with Proven Solutions. Shelton: People’s Medical Publishing House; 2015:56–57. | ||
Rajput R. Pregnancy and diabetes mellitus. In: Bajaj S, Rajput R, Jacob JJ, editors. Endocrine Disorders During Pregnancy. New Delhi: Jaypee Brothers Medical Publishers; 2013:14. | ||
Shoelson SE, Lee J, Goldfine AB. Inflammation and insulin resistance. J Clin Invest. 2006;116(7):1793–1801. | ||
Hotamisligil GS. Inflammation and metabolic disorders. Nature. 2006;444(7121):860–867. | ||
Bloomgarden ZT. Inflammation and insulin resistance. Diabetes Care. 2003;26(5):1619–1623. | ||
Pitsavos C, Tampourlou M, Panagiotakos DB, et al. Association between low-grade systemic inflammation and type 2 diabetes mellitus among men and women from the ATTICA study. Rev Diabet Stud. 2007;4(2):98–104. | ||
Trayhurnand P, Wood IS. Adipokines: inflammation and the pleiotropic role of white adipose tissue. Br J Nutr. 2004;92(03):347–355. | ||
Stewart FM, Freeman DJ, Ramsay JE, Greer IA, Caslake M, Ferrell WR. Longitudinal assessment of maternal endothelial function and markers of inflammation and placental function throughout pregnancy in lean and obese mothers. J Clin Endocrinol Metab. 2007;92(3):969–975. | ||
Gupta Y. Updated guidelines on screening for gestational diabetes. Int J Womens Health. 2015;7:539–550. | ||
Wang D, Yang JX, Cao DY, et al. Preoperative neutrophil–lymphocyte and platelet–lymphocyte ratios as independent predictors of cervical stromal involvement in surgically treated endometrioid adenocarcinoma. Onco Targets Ther. 2013;6:211–216. | ||
Celikbilek M, Dogan S, Ozbakir O, et al. Neutrophil–lymphocyte ratio as a predictor of disease severity in ulcerative colitis. J Clin Lab Anal. 2013;27(1):72–76. | ||
Aygün F, Efe D. Association of neutrophil/lymphocyte ratio with obstructive coronary artery disease and coronary artery calcium score detected by multislice computed tomography in type 2 diabetes mellitus patients. Patient Prefer Adherence. 2015;9:1023–1031. | ||
Caglayan EK, Engin-Ustun Y, Gocmen AY, et al. Is there any relationship between serum sirtuin-1 level and neutrophil–lymphocyte ratio in hyperemesis gravidarum? J Perinat Med. Epub 2015 Sep 1. | ||
Kurtoglu E, Kokcu A, Celik H, Tosun M, Malatyalioglu E. May ratio of neutrophil to lymphocyte be useful in predicting the risk of developing preeclampsia? A pilot study. J Matern Fetal Med. 2014;28(1):97–99. | ||
Yavuzcan A, Cağlar M, Ustün Y, et al. Mean platelet volume, neutrophil–lymphocyte ratio and platelet–lymphocyte ratio in severe preeclampsia. Ginekol Pol. 2014;85(3):197–203. | ||
Yilmaz H, Celik HT, Namuslu M, et al. Benefits of the neutrophil-to-lymphocyte ratio for the prediction of gestational diabetes mellitus in pregnant women. Exp Clin Endocrinol Diabetes. 2014;122(1):39–43. | ||
Wolf M, Sauk J, Shah A, et al. Inflammation and glucose intolerance: a prospective study of gestational diabetes mellitus. Diabetes Care. 2004;27(1):21–27. | ||
Kuvin SF, Brecher G. Differential neutrophil counts in pregnancy. N Engl J Med. 1962;266:877–878. | ||
Moradi S, Kerman SR, Rohani F, Salari F. Association between diabetes complications and leukocyte counts in Iranian patients. J Inflamm Res. 2012;5:7–11. | ||
Vozarova B, Weyer C, Lindsay RS, Pratley RE, Bogardus C, Tataranni PA. High white blood cell count is associated with a worsening of insulin sensitivity and predicts the development of type 2 diabetes. Diabetes. 2002;51(2):455–461. | ||
Lee CT, Harris SB, Retnakaran R, et al. White blood cell subtypes, insulin resistance and β-cell dysfunction in highrisk individuals–the PROMISE cohort. Clin Endocrinol. 2014;81(4):536–541. | ||
Ozyer S, Engin-Ustun Y, Uzunlar Ö, Katar C, Danisman N. Inflammation and glycemic tolerance status in pregnancy: the role of maternal adiposity. Gynecol Obstet Invest. 2014;78(1):53–58. | ||
Ozuguz U, Isik S, Berker D, et al. Gestational diabetes and subclinical inflammation: evaluation of first year postpartum outcomes. Diabetes Res Clin Pract. 2011;94(3):426–433. | ||
Xia W, Li D, Zhang C, Xu L, Xu W, Shao Y. Asymmetric dimethylarginine is associated with high-sensitivity C-reactive protein and early carotid atherosclerosis in women with previous gestational diabetes mellitus. Endocrine. 2015;48(2):528–532. | ||
Atègbo JM, Grissa O, Yessoufou A, et al. Modulation of adipokines and cytokines in gestational diabetes and macrosomia. J Clin Endocrinol Metab. 2006;91(10):4137–4143. | ||
Nicholson W, Wang NY, Baptiste-Roberts K, Chang YT, Powe NR. Association between adiponectin and tumor necrosis factor-alpha levels at eight to fourteen weeks gestation and maternal glucose tolerance: the Parity, Inflammation, and Diabetes Study. J Womens Health (Larchmt). 2013;22(3):259–266. | ||
Kuhnert M, Strohmeier R, Stegmuller M, Halberstadt E. Changes in lymphocyte subsets during normal pregnancy. Eur J Obstet Gynecol Reprod Biol. 1998;76(2):147–151. | ||
Christian LM, Porter K. Longitudinal changes in serum proinflammatory markers across pregnancy and postpartum: effects of maternal body mass index. Cytokine. 2014;70(2):134–140. | ||
Friis CM, Roland P, Marie C, et al. Adiposity-related inflammation: effects of pregnancy. Obesity. 2013;21(1):E124–E130. | ||
Sen S, Iyer C, Meydani SN. Obesity during pregnancy alters maternal oxidant balance and micronutrient status. J Perinatol. 2014;34(5):105–111. | ||
Ulu S, Bucak A, Ulu MS, et al. Neutrophil–lymphocyte ratio as a new predictive and prognostic factor at the hearing loss of diabetic patients. Eur Arch Otorhinolaryngol. 2014;271(10):2681–2686. | ||
Ulu SM, Dogan M, Ahsen A, et al. Neutrophil-to-lymphocyte ratio as a quick and reliable predictive marker to diagnose the severity of diabetic retinopathy. Diabetes Technol Ther. 2013;15(11):942–947. | ||
Huang W, Huang J, Liu Q, et al. Neutrophil–lymphocyte ratio is a reliable predictive marker for early-stage diabetic nephropathy. Clin Endocrinol. 2015;82(2):229–233. | ||
Verdoia M, Schaffer A, Barbieri L, et al. Impact of diabetes on neutrophil-to-lymphocyte ratio and its relationship to coronary artery disease. Diabetes Metab. 2015;41(4):304–311. |
 © 2016 The Author(s). This work is published and licensed by Dove Medical Press Limited. The full terms of this license are available at https://www.dovepress.com/terms.php and incorporate the Creative Commons Attribution - Non Commercial (unported, v3.0) License.
By accessing the work you hereby accept the Terms. Non-commercial uses of the work are permitted without any further permission from Dove Medical Press Limited, provided the work is properly attributed. For permission for commercial use of this work, please see paragraphs 4.2 and 5 of our Terms.
© 2016 The Author(s). This work is published and licensed by Dove Medical Press Limited. The full terms of this license are available at https://www.dovepress.com/terms.php and incorporate the Creative Commons Attribution - Non Commercial (unported, v3.0) License.
By accessing the work you hereby accept the Terms. Non-commercial uses of the work are permitted without any further permission from Dove Medical Press Limited, provided the work is properly attributed. For permission for commercial use of this work, please see paragraphs 4.2 and 5 of our Terms.