Back to Journals » Eye and Brain » Volume 14
Neuroplasticity of the Lateral Geniculate Nucleus in Response to Retinal Gene Therapy in a Group of Patients with RPE65 Mutations
Authors Ashtari M ![]() , Lipin M, Duong M, Ying GS
, Lipin M, Duong M, Ying GS ![]() , Yu Y
, Yu Y ![]() , Maguire A, Bennett J
, Maguire A, Bennett J
Received 8 June 2022
Accepted for publication 15 November 2022
Published 10 December 2022 Volume 2022:14 Pages 137—147
DOI https://doi.org/10.2147/EB.S377275
Checked for plagiarism Yes
Review by Single anonymous peer review
Peer reviewer comments 3
Editor who approved publication: Professor Margaret Wong-Riley
Manzar Ashtari,1– 3 Mikhail Lipin,1,2 Michelle Duong,4 Gui-Shuang Ying,5 Yinxi Yu,5 Albert Maguire,1,2 Jean Bennett1,2
1Department of Ophthalmology, University of Pennsylvania, Perelman School of Medicine, Philadelphia, PA, USA; 2Department of Ophthalmology, Center for Advanced Retinal & Ocular Therapeutics (CAROT) at the University of Pennsylvania, Perelman School of Medicine, Philadelphia, PA, USA; 3Department of Radiology, Perelman School of Medicine, University of Pennsylvania, Perelman School of Medicine, Philadelphia, PA, USA; 4Emergency Department, Mainline Health, Bryn Mawr, PA, USA; 5Department of Ophthalmology, Center for Preventative Ophthalmology and Biostatistics, University of Pennsylvania, Perelman School of Medicine, Philadelphia, PA, USA
Correspondence: Manzar Ashtari, University of Pennsylvania, Perelman School of Medicine, Room 201 Anatomy/Chemistry Building, Philadelphia, PA, 19102, USA, Tel +1 215– 746-8259, Email [email protected]
Introduction: Previous works on experience-dependent brain plasticity have been limited to the cortical structures, overlooking subcortical visual structures such as the lateral geniculate nucleus (LGN). Animal studies have shown substantial experience dependent plasticity and using fMRI, human studies have demonstrated similar properties in patients with cataract surgery. However, in neither animal nor human studies LGN has not been directly assessed, mainly due to its small size, tissue heterogeneity, low contrast/noise ratio, and low spatial resolution.
Methods: Utilizing a new algorithm that markedly improves the LGN visibility, LGN was evaluated in a group of low vision patients before and after retinal intervention to reinstate vision and normal sighted matched controls.
Results: Between and within groups comparisons showed that patients had significantly smaller left (p< 0.0001) and right (p < 0.00002) LGN volumes at baseline as compared to the one-year follow-up volumes. The same baseline and one year comparison in controls was not significant. Significant positive correlations were observed between the incremental volume increase after gene therapy of the left LGN and the incremental increase in the right (r = 0.71, p < 0.02) and left (r = 0.72, p = 0.018) visual fields. Incremental volume increase of the right LGN also showed a similar positive slope but did not reach significance.
Discussion: These results show that despite significantly less volume at baseline, retinal gene therapy promotes robust expansion and increase in LGN volume. Reinstating vision may have facilitated the establishment of new connections between the retina and the LGN and/or unmasking of the dormant connections. The exact trajectory of the structural changes taking place in LGN is unclear but our data shows that even after years of low vision, the LGN in RPE65 patients has the potential for plasticity and expansion to a nearly normal volume one year after gene therapy administration.
Keywords: brain plasticity, retinal gene therapy, lateral geniculate nucleus, image processing, brain morphometry
Introduction
One of the more common forms of Leber’s congenital amaurosis (LCA) is associated with the gene encoding retinal pigment epithelium-specific protein 65 kDa (RPE65) and is called LCA type 2 (LCA2).1,2 There is no cure for patients with LCA2 disease, caused by RPE65 mutations, but due to the disease's slow degenerative process, these patients are excellent candidates for gene therapy interventions. Due to the excellent safety and efficacy and encouraging successful data from the gene augmentation therapy in early phase trials, a Phase 3 clinical trial was initiated at The Children’s Hospital of Philadelphia (CHOP) and the University of Pennsylvania (Upenn) in October of 2012. The visual improvements and detailed clinical results on the Phase 3 clinical trial were reported by Russell and colleagues3 and recently by Maguire et al.4 Retinal gene therapy using Voretigene Neparvovec-rzyl (LuxturnaTM) was approved by the US Food and Drug Administration (FDA) as a treatment for the RPE65 retinal disorder on December 19, 2017.
In a complementary study, to evaluate the effectiveness of the retinal gene therapy through responses of the visual cortex, we performed a series of longitudinal neuroimaging studies. In the earlier phase trials, we showed functional responsiveness to visual input through unilateral ocular gene therapy5 and following subretinal injection to the fellow eyes.6,7 Additionally, in a group of patients who received unilateral gene therapy, we also showed that structural changes caused by lack of vision are reversible upon vision restoration.8
Much of the previous work on experience-dependent brain plasticity, including our own reports in RPE65 patients on brain plasticity and vision reversal, have been exclusively limited to the brain’s cortical structures overlooking the important subcortical visual relay center, the lateral geniculate nucleus (LGN). However, recent reports, largely in rodents,9–11 have demonstrated that LGN should be considered not just as a visual relay center but a key member of the visual system with substantial experience dependent plasticity. A recent study in monkeys provides insights into the nature of plastic changes occurring in LGN following induced early sensory deprivations.12 LGN is a small heterogenous structure deep within the brain located on the lateral surface of the thalamus responsible for the analysis and relay of the visual sensory information to the visual cortex.13 There is a plethora of reports on various diseases affecting the LGN’s structure and function such as dyslexia,14,15 patients with neuromyelitis optica spectrum disorders,16,17 glaucoma,18–21 albinism,22 and patients with hemianopia23 to name a few. At the same time, except for cataract surgery24–26 human studies on the effects of vision reversal or experience dependent responses of this structure are rather scarce.
In a group of late blind subjects with retinitis pigmentosa (RP) who received the Argus II Retinal Prosthesis to reverse their blindness, Castaldi and colleagues27 used fMRI to assess the effect of a retinal implant on the functional changes of the visual cortex and LGN. Authors reported weak or absent fMRI activations in the V1 and LGN before the retinal implant and with prolonged use of the Argus II device, fMRI responses to visual stimulation of the implanted eye were enhanced, demonstrating brain plasticity of the visual system to respond to the restored visual input even after years of deprivation.27 The more prolonged the exposure to the Argus II device (over 20 months), the stronger the response of the visual centers to the artificial visual inputs.27 Spontaneous recovery from optic neuritis (ON) in multiple sclerosis patients is another example to study the functional and structural aspects of vision reversal on the human visual system. Using fMRI for the affected and unaffected eyes, Korsholm et al28 studied 19 patients with acute onset of ON, 3 and 6 months after presentation, to assess the effects of visual recovery on the brains’ visual loci and the LGN. During the acute phase of ON, patients showed significantly reduced fMRI activations in the LGN from the stimulation of the affected eye as compared to the unaffected eye.28 Subsequent to recovery from ON, the differences in LGN activations between the affected and unaffected eyes diminished and after 180 days the differences were no longer significant.28 A similar change in the pattern of activation for the V1 and V2 of the primary visual cortex was reported as well.
Much of the above-mentioned work on assessing the effects of vision reversal and experience dependent changes on the morphology of LGN were carried out indirectly, utilizing fMRI. This may primarily be that even using higher field 3T MRI systems along with a high-resolution MRI (0.8 mm isotropic) imaging protocol have been insufficient for assessment of LGN morphometry. This in part is due to the small size, tissue heterogeneity, high partial volume artifacts, low contrast to noise ratio, and low spatial resolution to name a few. Recent work by Lipin et al29 has opened up the possibility of markedly improving the LGN visibility on previously acquired suboptimal MR images obtained from routine brain imaging protocols. Using this algorithm, the LGN volume can be assessed, retrospectively, with high reliability and validity.29 Here, the edge enhancing algorithm was used to evaluate the effects of retinal gene therapy on structural changes of the LGN in a group of RPE65 patients before and one year after bilateral retinal intervention. Comparison was also carried out with demographically matched sighted controls who underwent MR imaging at baseline and the one year follow up time point. While we have previously demonstrated that gene therapy treatment in RPE65 patients can promote robust functional and structural brain plasticity of the visual pathway,5,8 the plasticity of LGN in response to visual experience has never been reported in humans by direct volume assessment. In the present study, we hypothesize that like the previously reported work on vision reversal and cortical brain plasticity, a long-term exposure to visual experience, prompted by retinal gene therapy, also induces subcortical plasticity in LGN.
Materials and Methods
Gene Therapy Clinical Trials
The phase 3 clinical trial (NCT00999609) took place with participants greater than 3 years old with a confirmed genetic diagnosis of bi-allelic RPE65 mutations. A total of 31 patients between the ages of 4–44 years were recruited in the study.3,4 Subretinal injection was performed first in the worse seeing eye followed by injection of the second eye, 6–18 days later.3,4 All patients received the same dose of 1.5×10¹¹ vg in a total subretinal injection volume of 0.3 mL in both eyes.3,4 Results from the phase 3 clinical trial showed improvement in patients’ light sensitivity, visual fields, and navigational ability under dim light.3,4
Study Participants
Due to the age limitation (>8 yrs) and voluntary participation, a subset of 10 patients from the original 31 participants of the original clinical trial patients participated in the neuroimaging study.
A subset of 11/19 normal controls used to assess the efficacy and reliability of the LGN edge enhancement method (Lipin et a29) were demographically matched to the current study patient participants (see Table 1). However, only 8/11 matched controls returned for the one year follow up study. All matched controls were recruited with exclusion criteria of any current or past psychiatric diagnosis, history of alcohol or drug abuse, known neurological disorders, history of head injury, or current use of psychotropic medications. All study participants provided written informed consent (if 18 years or older) or written assent and parental permission (if younger than 18 years). This study was Health Insurance Portability and Accountability Act of 1996 compliant and approved by the internal review board at CHOP and UPenn and complied with the Declaration of Helsinki. As shown in Table 1, RPE65 patients and controls did not significantly differ in age, gender, ethnicity, and handedness (Table 1).
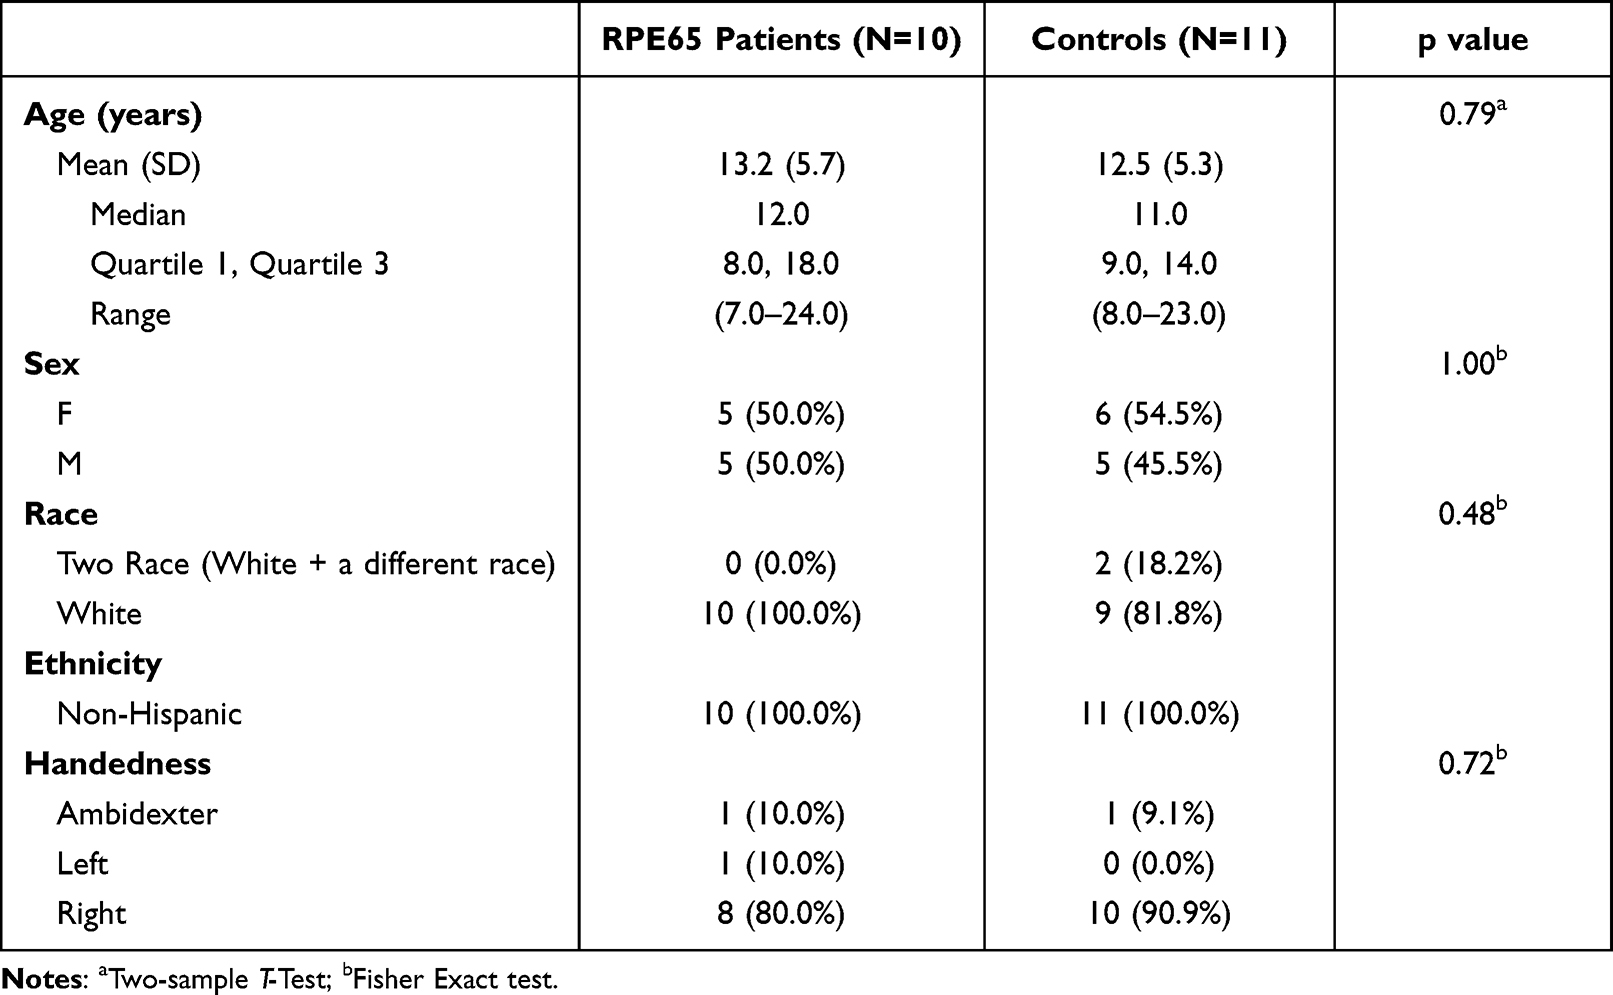 |
Table 1 Participants’ Demographic and Statistical Comparison |
Neuroimaging Protocol
Magnetic Resonance Imaging (MRI) scans were conducted at CHOP on a research dedicated Siemens Verio system (Siemens Campus Erlangen, Erlangen, Germany) equipped with a 32-channel head coil. All scans were carried out by a single operator and monitored to be free of artifacts at the time of acquisition. Subjects’ heads were secured in the head coil using foam padding to reduce head motion. All subjects underwent a T1 weighted 3D magnetization prepared rapid acquisition gradient echo (MPRAGE) for LGN morphological assessment. All RPE65 patients underwent MRI one year post retinal intervention but only 8/11 matched controls completed their one-year MRI visits.
3D T1 Weighted (MPRAGE): sequence parameters included, inversion preparation pulse with a repetition time (TR) = 2080 ms, echo time (TE) = 2.54 ms, echo spacing (ES) = 7.8, band width (BW) = 180 Hz/Px, matrix size = 320x320, field of view (FOV) = 256×256 mm2, number of slices = 192, slice thickness = 0.8 mm (isotropic 0.8mm voxel size), inversion time (IR) = 1200 ms with Flip Angle = 8°, number of excitation (NEX) = 1, integrated Parallel Acquisition Techniques (iPAT) factor = 2, and acquisition time (TA) = 7:04 minutes.
Image Processing
The LGN was visually identified on T1-weighted 3D-MPRAGE images in the sagittal and coronal projections using anatomical landmarks.28,30 To reduce postprocessing time for the edge enhancement algorithm, a region of interest with 22x22x22 voxels size that contained LGN in its entirety was extracted from the original 3D T1 weighted acquisition for all participants and all time points. The extracted ROI was transferred to the IgorPro software (WaveMetrics, Oregon, www.wavemetrics.com) to improve the LGN visibility using an inhouse custom made 3D-edge enhancement algorithm.29 The employed edge enhancement process was performed on a voxel-by-voxel basis over the entire LGN-containing ROI (extracted 22x22x22 cube) which consisted of 10,648 voxels. A representation of the ROI (red box) on the T1 weighted image containing the LGN in the coronal orientation is shown in column A of Figure 1. The zoomed extracted ROIs, shown in column B of Figure 1 clearly depict that LGN is barely visible and difficult to delineate on the original 3D T1 weighted images. Each voxel of this LGN-containing ROI then underwent the edge-enhancement procedure.29 An example of the edge-enhanced LGN-containing ROIs are presented in column C of Figure 1. The comparison between columns B and C are clearly showing the increased visibility of LGN and the efficacy of the edge enhancement algorithm. Column D represents the delineated LGN in one representative slice in the coronal orientation. The reliability and validity of the proposed algorithm in determining the LGN volume while enhancing its visibility and preserving its original shape have been reported elsewhere.29 A more comprehensive comparison of the raw and edge enhanced processed images of LGN for all RPE65 patients and representative sighted controls are presented in Figures S1 and S2 respectively.
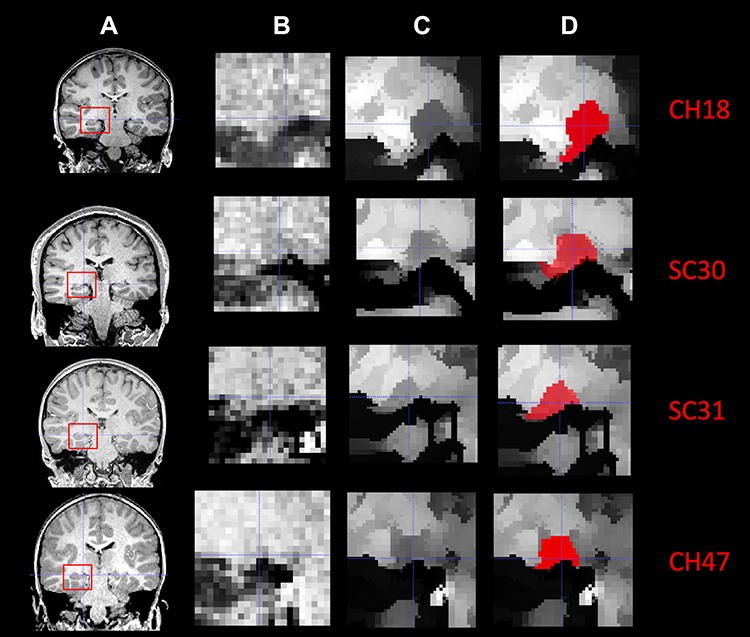 |
Figure 1 Stages of the LGN edge enhancement process in four example participants: Two participants were from the RPE65 patient group (CH18 and CH47) and two were from sighted control group (SC30 and SC31). (A) Utilizing each subjects’ 3D MPRAGE T1 weighted images and the ITK-SNAP software the LGN is identified (red box) and its center coordinate is recorded on both the left and right hemispheres. (B) The 3D whole brain images and the center coordinates were submitted to the c3d software (available also through the ITK-SNAP download) and a 22x22x22 voxel ROI was extracted containing LGN in its entirety. Note that the LGN is hardly visualized for all unenhanced images in all four example cases. (C) The edge enhanced LGN containing ROIs demonstrating improved visibility of the LGN as compared to the unenhanced images shown in column “B”. (D) Using the edge enhanced images shown in column “C” LGN can be clearly demarcated from the surrounding structures and can easily be manually outlined resulting to a more accurate morphometry. |
LGN Morphometry
The edge-enhancement algorithm29 was applied to the 3D images of a group of 10 RPE65 patients before and 1 year after retinal gene therapy and the images from the follow up exam of the eight controls who returned for their follow up exams. All images from patients’ baselines and their one year follow up and the follow up exams from the 8 controls were mixed and randomly assigned a number. The LGN volumes were then measured bilaterally by two independent raters (MA and ML) using the new randomly assigned numbers. Both raters were blind to the identity of subjects and the timing of the MRI scans. The baseline measurements for the 11 matched controls were extracted from the previously reported LGN volumes, used to assess the reliability of the LGN morphometry method29. The baseline measurements for the 11 matched controls were also measured by the two same raters (MA and ML)29 who measured the LGN volume for the current study. The LGN volumes were calculated using the volume/statistic option of the ITK-SNAP segmentation menu (http://www.itksnap.org).31 The average of the two raters were used as the final LGN volume measurements. Comparison of bilateral LGNs were performed between and within patients and sighted controls across time using a paired t-test.
Goldmann Visual Field Perimetry (GVF)
The Goldmann visual field (GVF) perimetry is a standard method used in ophthalmology and it provides a measure of the patient’s visual function throughout their field of vision.32 GVF performed for evaluation of disease status and patient follow up over time to determine progression of disease or efficacy of treatment status. All the RPE65 patients underwent GVF at baseline and on their one year follow up visits. Testing was performed using a 190-degree hemispheric bowl, 30 cm in radius. A target light with specified size and luminance (III4e) was projected on the inner surface of the bowl as a visual stimulus (Lighting Laboratory, Helsinki University of Technology). The entire field of view seen by a subject was mapped asking the subjects to fixate the eye straight ahead. Each eye was tested separately by patching the contralateral eye. The technician recorded the subject’s responses on a standard graphic display form representing visual space. Cumulative VF calculations were conducted across 24 meridians in each eye separately. The outcome measure was the sum of the degrees from central fixation to the point of the isopter intersection for each of the 24 meridians or sum total degrees. Visual field was analyzed for the sum total number of degrees that the subject was able to perceive across the entire visual field, measured directly from the standard graphic display form.
Statistical Analysis
Two-sample t-test was used to compare the age difference between patients and controls. The Fisher’s Exact test was used to compare the difference between patients and controls in frequency distribution for categorical measures such as sex, race and handedness. The inter-rater agreement of left and right LGN volumes at baseline and 1 year for both raters was assessed by calculating their mean difference, standard deviation (SD), 95% limits of agreement (calculated as mean difference ± 1.96*SD) supplemented with a Bland-Altman plot, in addition a paired t-test was used to test whether there is any difference between the two raters. Comparisons of bilateral LGN volumes were performed between patients and controls using the two-sample t-test. Comparisons of bilateral LGN volumes across time (eg, baseline and one year after gene therapy) within patients or controls were performed using paired t-test. To evaluate the impact of increase in LGN volumes on visual field function at one year after retinal gene therapy, Pearson correlation analyses were performed between the percent increase in LGN volume and the percent increase in GVF score. The GVF score was calculated as the total number of degrees that each patient was able to perceive across the entire visual field for the left and the right eyes separately. For these correlation analyses, we used the percent increases instead of absolute increases for LGN and GVF to account for their differences at baseline across subjects. All statistical analyses were performed using SAS version 9.4 (SAS Institute Inc., Cary, NC). Two-sided p<0.05 (without correction for multiple comparisons) was statistically significant.
Results
Inter-Rater Agreement
After the edge enhancement process, two raters arrived on a consensus on demarcating the LGN borders visible on all MRI slices within the extracted ROI. Each rater then independently manually delineated the LGN on both hemispheres for all participants, using the ITK-SNAP software. The LGN volumes were calculated using the volume/statistic option of the ITK-SNAP segmentation menu. The mean and standard deviation of the right and left LGN measurements for both raters are presented in Table 2. We assessed the inter-rater agreement by calculating their mean difference, standard deviation (SD), 95% limits of agreement (calculated as mean difference ± 1.96*SD) supplemented with Bland-Altman plot, we performed a paired t-test to assess whether there is any difference between two raters in the measurements of left and right LGN at baseline and 1 yr for the RPE65 patients. The inter-rater agreement between the same raters for the left and right LGN measurements of sighted controls were previously reported.29
 |
Table 2 Agreement Between Two Raters for the Measurements of the Left and Right LGN in a Group of RPE65 Patients at Baseline and 1YR After Retinal Gene Therapy |
The Bland-Altman plots shown in Figure S3 demonstrate the LGN volume differences between the two raters for the left and right LGN at baseline and 1 yr for all study participants. As shown in Figure S3–A the differences in the LGN volumes between the two raters for the left LGN volume at baseline were well within ±2 SD. The measurements for the right LGN volumes at baseline, shown in Figure S3–B, were also within ±2 SD except for one participant. As depicted in Figures S3–C and S3–D, LGN volume measurements at 1 yr were well within ±10 mm3 for both the left and right hemispheres.
LGN Volume Measurements
Results for the left and right LGN volume assessments at baseline and follow up after retinal gene therapy for the RPE65 patients and the baseline and a one year follow up for sighted controls are presented in Figure 2. As depicted in Figure 2, RPE65 patients presented with significantly reduced LGN volumes on the left (p<0.0001) and right (p<0.00002) at baseline as compared to their one year follow up LGN volumes. At the same time, there were no significant differences between the two time points in the LGN volume measurements of the left (p = 0.18) and right (p = 0.98) among sighted controls.
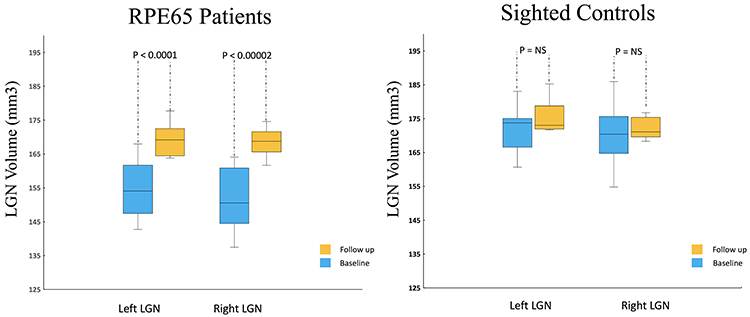 |
Figure 2 Box Whisker plots of the left and right LGNs for 10 RPE65 patients and 11 sighted controls (8/11 returned for one year follow up). Comparison of the center, spread of group and the median for the left and right LGN volumes shows a significant increase in LGN volume for the left (p<0.0001) and right (p<0.00002) among the RPE65 patients one year after their bilateral retinal gene therapy. Comparison of the left and right LGN volumes from baseline and one-year measurements in sighted controls showed no significant changes in the LGN volume over time. |
Correlations Between the LGN Morphometry and Goldmann Visual Field Perimetry
The results for the Pearson correlations are presented in Figure 3. Overall, there were positive correlations between the percent incremental changes in the LGN volumes and the incremental GVF changes over time (baseline to one year post intervention). As shown in Figures 3A and B respectively, there were significant positive correlations between the percent incremental changes of the left LGN volume with the percent incremental changes in the left (r = 0.71, p = 0.02) and the right (r = 0.72, p = 0.018) GVF measurements (from baseline to 1 yr post intervention). The Pearson correlations between the percent incremental changes in the LGN volume and the percent incremental changes in the left (r = 0.52, p = 0.12) and the right (r = 0.45, p = 0.19) GVF over time (baseline to 1YR), shown in Figures 3C and D showed a similar positive correlation slope but did not reach significance. Patients with negative correlations had smaller visual fields at follow-up.
 |
Figure 3 Correlations between the LGN volumes and patients’ Goldmann visual field measurements. To demonstrate the clinical significance of the increase in LGN volume, one year after retinal intervention, the percent incremental increase in the LGN volume (from baseline to 1YR post intervention) was correlated with the clinical visual test results of the RPE65 patients. As shown in (A and B) respectively, significant positive correlations were observed between the percent left LGN volume increase and the incremental increase in the left and right GVF measures (from baseline to 1 YR follow up). As shown in (C and D), the Pearson correlations between the percent incremental increase in the right LGN and the percent incremental increase of the left and right GVF were not significant. While the positive direction of the correlations between both the left and right LGNs and the left and right GVFs is encouraging, the strong laterality between the two correlations for changes in the left and right LGNs were not expected, as all the RPE65 patients received bilateral retinal interventions. |
Discussion
The primary findings of the current study are that RPE65 patients had significantly smaller left (p < 0.001) and right (p < 0.001) LGN volumes at baseline (before retinal intervention) as compared to sighted controls. The smaller LGN volume at baseline for RPE65 patients, as compared to sighted controls, is indicative of the profound top-down effects ocular diseases exert on the LGN structures. However, the routine 3D imaging used here and in normal clinical settings provides an overall estimate of volume change and does not reveal the degree of alterations to specific magno or parvo cell layers of the LGN. To evaluate, in vivo, whether the RPE65 mutation affects different layers of LGN preferentially one needs to follow the quantitative T1 MRI (qMRI) imaging protocol proposed by Muller-Axt et al.33 In this recent report, authors employed the qMRI method where several 3D MRI sequences with different contrasts are acquired and fit to a model to calculate the quantitative maps for T1 and proton density (PD). Because of variation in the amount of myelin and change in the T1 and PD values of the different LGN cells the layers were visualized distinctly. This is an elegant method with great potential but to arrive at the maps for T1 and PD the subject needs to be imaged 30 min per each hemisphere by a high field 7 Tesla MR system which amounts to at least 1 hour of scan time for each subject.33
In response to bilateral retinal gene therapy, one year after vision was restored in the same patients, as compared to their own baseline measures, RPE65 patients showed significant increases for the left (p < 0.001) and right (p < 0.001) LGN volumes. At the same time, comparison of the baseline to the one year follow up of the LGN volumes in sighted controls showed no significant differences for the left (p = 0.18) and right (p = 0.98) LGN volumes. These results show that despite significantly less volume detected at baseline, retinal gene therapy allows for a robust expansion and remodeling of the brain’s LGN structures. It is important to note that RPE65 patients are diagnosed in infancy and despite the data on the critical period that suggests poor or no recovery from visual impairment past this period, we observed significant improvements within the key structure of the visual system.
Previous animal studies employing the eyelid suture/un-suture model to induce or reverse blindness have shown that the structural damage to the LGN, geniculostriate connections and the primary visual cortex are largely reversible through the remarkable process of brain plasticity.34–36 For example, Dürsteler et al34 showed a partial regrowth of geniculate cells receiving projections from the deprived eye only a few days after reversing eyelid suture in kittens. In monkeys, recovery from reverse suturing was shown to cause fresh growth of geniculostriate connections to the primary visual cortex.35 Based on this study and two other concurrent works37,38 authors suggested that there is a close relationship between the extent of change in layer IV of the primary visual cortex and cell size in the lateral geniculate nucleus, and that much of the observed physiological changes from the deprivation experiments are closely related to anatomical changes in the LGN and distribution of connections from the LGN to V1.35 A more recent report39 confirmed these results in a longitudinal study that tracked visual responses and changes of dendritic spines in the ferret visual cortex following brief periods of unilateral eye closure (UEC). Remarkably, rapid, robust changes were reported within a few hours of eye opening after a week-long of UEC, and even 24 hours after eye opening dendritic spines increased, with a return to pre-UEC levels.39
Based on reports from the animal studies, we believe that the observed LGN volume increase could be partially due to the remodeling and increase in the dendritic tree within the LGN, prompted by the increase in retinal visual signals and long-term visual experience mediated by the retinal gene therapy intervention. Over time, perhaps these connections are strengthened through daily exposure to experience-dependent stimulation of neurons in both monocular (M and P layers) and binocular (K layer) LGN cell layers. The increase in the LGN volume at one year post intervention is also consistent with our previous fMRI report on the long-lasting effects of retinal gene therapy in RPE65 patients.7
Additionally, Pearson correlations (Figure 3) between the incremental changes in the left and right LGN volumes, before and one year after retinal gene therapy, and the incremental changes in the patients’ Golmann visual field measures for the same time period showed a positive trend with the changes in the left LGN reaching statistical significance (see Figures 3A and B), demonstrating the effect of LGN volume increase on the patients’ clinical response. While we observed the expected positive trend between the LGN volume and patients’ visual fields, there was also an unexpected strong laterality in the LGN volume change correlation results, with the changes in the left LGN volume reaching higher significance levels (Figures 3A and B) than the changes in the right LGN volume (Figures 3C and D). We expected a more symmetrical correlation for the LGN volume changes over time for both the left and right LGNs, as all the RPE65 participants received bilateral retinal intervention. Unfortunately, we have no explanation for this unforeseen result except that the lack of statistical significance for the changes in the right LGN volume could have been due to the small number of participants.
Although our results show that LGN in both hemispheres show increased volume and structural changes over time after gene therapy, the one year follow up LGN volumes for RPE65 patients vs sighted controls still showed a significantly smaller LGN volume on the left (p < 0.01) in RPE65 subjects and at a trend level on the right (p < 0.06) hemisphere. Whether the experience – dependent plasticity of the LGN – in fact continues over time and further normalizes the LGN volume in RPE65 patients is not clear and requires a much longer patient follow up. While this is speculative, it may be that treatment of the entire retina (not just the area exposed to the 0.3 mL volume3 or more than one subretinal injection of the Luxturna) would be required for the LGN to reach the size of a normal-sighted individual at one year or the LGN volume in patients would not at any point be comparable to the controls because part of the damage to the retina may be permanent and is irreversible even through retinal gene therapy. Current experimental evidence does not yet allow for the identification of the exact underlying mechanism. Future studies need to be designed to follow up patients and sighted controls beyond a one year follow up to help better understand the long-term LGN neuronal plasticity in response to sight restoration.
Conclusions
Experience dependent brain plasticity has been traditionally associated with cortical brain structural or functional changes and has not been related to the deep seated small gray matter nuclei such as LGN. Recent reports, largely in rodents9–11 have demonstrated that LGN has substantial experience dependent plasticity. By recording single cell tracing from the retinal ganglion cells to the individual cells in the mouse LGN, Rompani and collaborators9 showed modulating binocular responses from the k-layers not previously reported. In another study Jaepel and colleagues40 showed that following monocular deprivation (MD) the adult mouse LGN undergoes ocular dominance (OD) plasticity, a process that was previously exclusively associated to the visual cortex. Authors showed that only one week of MD induces a shift in OD plasticity that was caused by strengthening of the nondeprived eye and depression of the deprived eye.40 In a similar study, Sommeijer and colleagues41 also showed OD plasticity in LGN neurons after MD during critical period in juvenile mice. While these studies present clear evidence for the experience-dependent plasticity in LGN, a direct extrapolation from rodent to higher mammals needs to be established.11
In summary, our results show that the key thalamic nuclei responsible for direct communication between the retina and the visual cortex undergo structural plasticity in response to retinal gene therapy. Furthermore, the observed LGN volume increase was positively correlated with the clinical measures of the patients’ visual fields, particularly evident from the correlations of the left LGN with the left and right eye visual fields. The structural changes within the LGN suggest that the role of LGN is not limited to just relay the information to the visual cortex but is also involved in adjusting to the retinal visual signal modulations by undergoing a high degree of plasticity to adapt to the enhanced visual information. The exact trajectory of the structural changes taking place in LGN is unclear but our data shows that even after years of low vision, the LGN in RPE65 patients has the potential for plasticity and expansion and the increase in the LGN size is retained for at least one year after gene therapy administration.
Abbreviations
LGN, lateral geniculate nucleus; RPE, retinal pigment epithelium; CHOP, Children’s Hospital of Philadelphia; LCA, Leber’s congenital amaurosis; FDA, Food and Drug Administration; RP, retinitis pigmentosa; fMRI, functional MRI; ON, optic neuritis; MPRAGE, magnetization prepared rapid acquisition gradient echo; GVF, Goldmann visual field; SD, standard deviation; qMRI, quantitative T1 MRI; PD, proton density; MD, monocular deprivation; OD, ocular dominance; UEC, unilateral eye closure.
Data Sharing Statement
The data for this study is currently on the University of Pennsylvania secure share drive where the access is password protected and not publicly available. Those who are interested can directly contact the corresponding author to gain access to all the images acquired on patient and control subjects. The code for edge enhancement software was previously published and shared in a supplementary information by Lipin and collaborators.28
Author Contributions
All authors made a significant contribution to the work reported in areas such as study conception, design, execution, data acquisition, analysis and interpretation. Authors took part in some or in all these areas. In addition, they actively took part in drafting, revising or critically reviewing the article and gave their final approval of the final version for publication. Authors also consented to the submission of the work to the journal of choice.
Funding
This study was supported by R01EY025287-01A1 and Center for Advanced Retinal and Ocular Therapeutics (CAROT) at University of Pennsylvania Perelman School of Medicine and the F.M. Kirby Foundation.
Disclosure
The authors declare that the research was conducted in the absence of any commercial or financial relationships that could be construed as a potential conflict of interest. Albert Maguire reports grants from Spark Therapeutics during the conduct of the study. Jean Bennett reports that Spark Therapeutics licensed intellectual property from UPenn and she and Albert Maguire are co-authors of this IP, “Method of treating or retarding the development of blindness, US Patent Application No. 8,147,823, publication 20140377224, (April 3, 2012) licensed to UPenn, Cornell, U Florida. However, they waived any potential financial interest long before this patent was approved (and prior to the conduct of the study). The authors report no other potential conflicts of interest in relation to this work.
References
1. Jin M, Li S, Moghrabi WN, Sun H, Travis GH. Rpe65 is the retinoid isomerase in bovine retinal pigment epithelium. Cell. 2005;122(3):449–459. doi:10.1016/j.cell.2005.06.042
2. Moiseyev G, Chen Y, Takahashi Y, Wu BX, Ma JX. RPE65 is the isomerohydrolase in the retinoid visual cycle. Proc Natl Acad Sci U S A. 2005;102(35):12413–12418. doi:10.1073/pnas.0503460102
3. Russell S, Bennett J, Wellman JA, et al. Efficacy and safety of voretigene neparvovec (AAV2-hRPE65v2) in patients with RPE65-mediated inherited retinal dystrophy: a randomised, controlled, open-label, phase 3 trial. Lancet. 2017;390(10097):849–860. doi:10.1016/S0140-6736(17)31868-8
4. Maguire AM, Russell S, Chung DC, et al. Durability of voretigene neparvovec for biallelic RPE65-mediated inherited retinal disease: phase 3 results at 3 and 4 years. Ophthalmology. 2021;128(10):1460–1468. doi:10.1016/j.ophtha.2021.03.031
5. Ashtari M, Cyckowski LL, Monroe JF, et al. The human visual cortex responds to gene therapy–mediated recovery of retinal function. J Clin Invest. 2011;121(6):2160–2168. doi:10.1172/JCI57377
6. Bennett J, Ashtari M, Wellman J, et al. AAV2 gene therapy readministration in three adults with congenital blindness. Sci Transl Med. 2012;4(120):120ra15–120ra15. doi:10.1126/scitranslmed.3002865
7. Ashtari M, Nikonova ES, Marshall KA, et al. The role of the human visual cortex in assessment of the long-term durability of retinal gene therapy in follow-on RPE65 clinical trial patients. Ophthalmology. 2017;124(6):873–883. doi:10.1016/j.ophtha.2017.01.029
8. Ashtari M, Zhang H, Cook PA, et al. Plasticity of the human visual system after retinal gene therapy in patients with Leber’s congenital amaurosis. Sci Transl Med. 2015;7(296):296ra110–296ra110. doi:10.1126/scitranslmed.aaa8791
9. Rompani SB, Muellner FE, Wanner A, et al. Different modes of visual integration in the lateral geniculate nucleus revealed by single-cell-initiated transsynaptic tracing. Neuron. 2017;93(4):767–776. e6. doi:10.1016/j.neuron.2017.01.028
10. Litvina EY, Chen C. Functional convergence at the retinogeniculate synapse. Neuron. 2017;96(2):330–338. e5. doi:10.1016/j.neuron.2017.09.037
11. Rose T, Bonhoeffer T. Experience-dependent plasticity in the lateral geniculate nucleus. Curr Opin Neurobiol. 2018;53:22–28. doi:10.1016/j.conb.2018.04.016
12. Takahata T, Patel NB, Balaram P, Chino YM, Kaas JH. Long-term histological changes in the macaque primary visual cortex and the lateral geniculate nucleus after monocular deprivation produced by early restricted retinal lesions and diffuser induced form deprivation. J Comp Neurol. 2018;526(18):2955–2972. doi:10.1002/cne.24494
13. Kastner S, Schneider KA, Wunderlich K. Beyond a relay nucleus: neuroimaging views on the human LGN. Prog Brain Res. 2006;155:125–143.
14. Müller-Axt C, Anwander A, von Kriegstein K. Altered structural connectivity of the left visual thalamus in developmental dyslexia. Curr Biol. 2017;27(23):3692–3698. e4. doi:10.1016/j.cub.2017.10.034
15. Giraldo‐Chica M, Schneider KA. Hemispheric asymmetries in the orientation and location of the lateral geniculate nucleus in dyslexia. Dyslexia. 2018;24(2):197–203. doi:10.1002/dys.1580
16. Papadopoulou A, Gaetano L, Pfister A, et al. Damage of the lateral geniculate nucleus in MS: assessing the missing node of the visual pathway. Neurology. 2019;92(19):e2240–e2249. doi:10.1212/WNL.0000000000007450
17. Papadopoulou A, Oertel FC, Gaetano L, et al. Attack-related damage of thalamic nuclei in neuromyelitis optica spectrum disorders. J Neurol Neurosurg Psychiatry. 2019;90(10):1156–1164. doi:10.1136/jnnp-2018-320249
18. Lee JY, Jeong HJ, Lee JH, et al. An investigation of lateral geniculate nucleus volume in patients with primary open-angle glaucoma using 7 tesla magnetic resonance imaging. Invest Ophthalmol Vis Sci. 2014;55(6):3468–3476. doi:10.1167/iovs.14-13902
19. Schmidt MA, Knott M, Heidemann R, et al. Investigation of lateral geniculate nucleus volume and diffusion tensor imaging in patients with normal tension glaucoma using 7 tesla magnetic resonance imaging. PLoS One. 2018;13(6):e0198830. doi:10.1371/journal.pone.0198830
20. Wang J, Li T, Sabel BA, et al. Structural brain alterations in primary open angle glaucoma: a 3T MRI study. Sci Rep. 2016;6(1):1–9. doi:10.1038/s41598-016-0001-8
21. Zhang YQ, Li J, Xu L, et al. Anterior visual pathway assessment by magnetic resonance imaging in normal‐pressure glaucoma. Acta Ophthalmol. 2012;90(4):e295–e302. doi:10.1111/j.1755-3768.2011.02346.x
22. Grigorian A, McKetton L, Schneider KA. Measuring connectivity in the primary visual pathway in human albinism using diffusion tensor imaging and Tractography. JoVE. 2016;1(114):e53759.
23. Bridge H, Jindahra P, Barbur J, Plant GT. Imaging reveals optic tract degeneration in hemianopia. Invest Ophthalmol Vis Sci. 2011;52(1):382–388. doi:10.1167/iovs.10-5708
24. Lou AR, Madsen KH, Julian HO, et al. Postoperative increase in grey matter volume in visual cortex after unilateral cataract surgery. Acta Ophthalmol. 2013;91(1):58–65. doi:10.1111/j.1755-3768.2011.02304.x
25. Lin H, Zhang L, Lin D, et al. Visual restoration after cataract surgery promotes functional and structural brain recovery. EBioMedicine. 2018;30:52–61. doi:10.1016/j.ebiom.2018.03.002
26. Bansal P, Ram J, Sukhija J, Singh R, Gupta A. Retinal Nerve Fiber Layer and Macular Thickness Measurements in Children After Cataract Surgery Compared With Age-Matched Controls. Am J Ophthalmol. 2016;166:126–132. doi:10.1016/j.ajo.2016.03.041
27. Castaldi E, Cicchini GM, Cinelli L, Biagi L, Rizzo S, Morrone MC. Visual BOLD response in late blind subjects with Argus II retinal prosthesis. PLoS Biol. 2016;14(10):e1002569. doi:10.1371/journal.pbio.1002569
28. Korsholm K, Madsen KH, Frederiksen JL, Skimminge A, Lund TE. Recovery from optic neuritis: an ROI-based analysis of LGN and visual cortical areas. Brain. 2007;130(Pt 5):1244–1253. doi:10.1093/brain/awm045
29. Lipin M, Bennett J, Ying G-S, Yu Y, Ashtari M. Improving the Quantification of the Lateral Geniculate Nucleus in Magnetic Resonance Imaging Using a Novel 3D-Edge Enhancement Technique. Methods. Front Comput Neurosci. 2021;1:15. doi:10.3389/fncom.2021.708866
30. Aldusary N, Michels L, Traber GL, et al. Lateral geniculate nucleus volumetry at 3T and 7T: four different optimized magnetic-resonance-imaging sequences evaluated against a 7T reference acquisition. NeuroImage. 2019;186:399–409. doi:10.1016/j.neuroimage.2018.09.046
31. Yushkevich PA, Piven J, Hazlett HC, et al. User-guided 3D active contour segmentation of anatomical structures: significantly improved efficiency and reliability. Neuroimage. 2006;31(3):1116–1128. doi:10.1016/j.neuroimage.2006.01.015
32. Walsh T. Visual Fields: Examination and Interpretation. Vol. 3. Oxford University Press; 2010.
33. Müller-Axt C, Eichner C, Rusch H, et al. Mapping the human lateral geniculate nucleus and its cytoarchitectonic subdivisions using quantitative MRI. NeuroImage. 2021;244:118559. doi:10.1016/j.neuroimage.2021.118559
34. Dürsteler M, Garey L, Movshon JA. Reversal of the morphological effects of monocular deprivation in the kittens’s lateral geniculate nucleus. J Physiol. 1976;261(1):189–210. doi:10.1113/jphysiol.1976.sp011553
35. Swindale N, Vital Durand F, Blakemore C. Recovery from monocular deprivation in the monkey. III. Reversal of anatomical effects in the visual cortex. Proce Royal Soc London Series B Biol Sci. 1981;213(1193):435–450. doi:10.1098/rspb.1981.0074
36. Pizzorusso T, Medini P, Landi S, Baldini S, Berardi N, Maffei L. Structural and functional recovery from early monocular deprivation in adult rats. Proce National Acad Sci. 2006;103(22):8517–8522. doi:10.1073/pnas.0602657103
37. Blakemore C, Vital Durand F, Garey L. Recovery from monocular deprivation in the monkey. I. Reversal of physiological effects in the visual cortex. Proce Royal Soc London Series B Biol Sci. 1981;213(1193):399–423. doi:10.1098/rspb.1981.0072
38. Garey LJ, Vital-Durand F. Recovery from monocular deprivation in the monkey. II. Reversal of morphological effects in the lateral geniculate nucleus. Proc R Soc Lond B Biol Sci. 1981;213(1193):425–433. doi:10.1098/rspb.1981.0073
39. Yu H, Majewska AK, Sur M. Rapid experience-dependent plasticity of synapse function and structure in ferret visual cortex in vivo. Proce National Acad Sci. 2011;108(52):21235–21240. doi:10.1073/pnas.1108270109
40. Jaepel J, Hübener M, Bonhoeffer T, Rose T. Lateral geniculate neurons projecting to primary visual cortex show ocular dominance plasticity in adult mice. Nat Neurosci. 2017;20(12):1708–1714. doi:10.1038/s41593-017-0021-0
41. Sommeijer J-P, Ahmadlou M, Saiepour MH, et al. Thalamic inhibition regulates critical-period plasticity in visual cortex and thalamus. Nat Neurosci. 2017;20(12):1715–1721. doi:10.1038/s41593-017-0002-3
 © 2022 The Author(s). This work is published and licensed by Dove Medical Press Limited. The
full terms of this license are available at https://www.dovepress.com/terms
and incorporate the Creative Commons Attribution
- Non Commercial (unported, 3.0) License.
By accessing the work you hereby accept the Terms. Non-commercial uses of the work are permitted
without any further permission from Dove Medical Press Limited, provided the work is properly
attributed. For permission for commercial use of this work, please see paragraphs 4.2 and 5 of our Terms.
© 2022 The Author(s). This work is published and licensed by Dove Medical Press Limited. The
full terms of this license are available at https://www.dovepress.com/terms
and incorporate the Creative Commons Attribution
- Non Commercial (unported, 3.0) License.
By accessing the work you hereby accept the Terms. Non-commercial uses of the work are permitted
without any further permission from Dove Medical Press Limited, provided the work is properly
attributed. For permission for commercial use of this work, please see paragraphs 4.2 and 5 of our Terms.