")
Back to Journals » Clinical Ophthalmology » Volume 17
Neurofilament Light Chain in Aqueous Humor as a Marker of Neurodegeneration in Glaucoma
Authors Lin JB, Pitts KM , El Helwe H , Neeson C, Hall NE, Falah H, Schultz SA, Wang SL, Lo K, Song C, Margeta MA, Solá-Del Valle D
Received 18 April 2023
Accepted for publication 20 July 2023
Published 2 August 2023 Volume 2023:17 Pages 2209—2217
DOI https://doi.org/10.2147/OPTH.S417664
Checked for plagiarism Yes
Review by Single anonymous peer review
Peer reviewer comments 2
Editor who approved publication: Dr Scott Fraser
Jonathan B Lin,1 Kristen M Pitts,1 Hani El Helwe,1 Cameron Neeson,1 Nathan E Hall,1 Henisk Falah,1 Stephanie A Schultz,2 Silas L Wang,1 Kristine Lo,1 Christian Song,1 Milica A Margeta,1,* David Solá-Del Valle1,*
1Department of Ophthalmology, Harvard Medical School and Massachusetts Eye and Ear, Boston, MA, USA; 2Department of Neurology, Harvard Medical School and Massachusetts General Hospital, Boston, MA, USA
*These authors contributed equally to this work
Correspondence: David Solá-Del Valle; Milica A Margeta, Assistant Professor of Ophthalmology, Massachusetts Eye and Ear, Harvard Medical School, 243 Charles Street, Boston, MA, 02114, USA, Email [email protected]; [email protected]
Purpose: Neurofilament light chain (NfL) is a neuronal cytoskeletal protein that has been identified as a marker of neurodegeneration in diseases of the central nervous system. In this study, we investigated whether NfL in the aqueous humor (AH) can serve as a marker of neurodegeneration in glaucoma in a racially diverse North American population.
Design: Single-center, case–control study.
Participants: We enrolled patients with various types and stages of glaucoma undergoing planned ophthalmic surgery as part of their routine care and compared them with patients without glaucoma undergoing phacoemulsification for age-related cataract.
Methods: We collected AH from 39 glaucoma patients and 10 patients without glaucoma. AH NfL was quantified using the Single-Molecule Array (Simoa)® NF-light assay (Quanterix). Demographic information, such as age, body mass index, sex, and self-reported race, as well as clinical information, such as pre-operative intraocular pressure (IOP), maximum IOP, and number of pre-operative glaucoma medications, was obtained by reviewing the medical record.
Main Outcome Measures: Levels of AH NfL.
Results: In a model controlling for age and body mass index (BMI), NfL was significantly elevated in AH from glaucoma patients (mean: 429 pg/mL; standard deviation [SD]: 1136 pg/mL) compared to AH from patients without glaucoma (mean: 3.1 pg/mL; SD: 1.9 pg/mg): P = 0.002. Higher AH NfL was associated with higher maximum IOP (R = 0.44, P = 0.005), higher pre-operative IOP (R = 0.46, P = 0.003), and more pre-operative glaucoma medications (Rs = 0.61, P < 0.001). There was no association between AH NfL and Humphrey visual field mean deviation (R = − 0.20, P = 0.220), retinal nerve fiber layer thickness as measured with optical coherence tomography (R = 0.07, P = 0.694), or glaucoma stage (Rs = 0.015, P = 0.935).
Conclusion: Our findings suggest that AH NfL may have clinical utility as a marker of glaucomatous neurodegeneration.
Keywords: neurofilament light chain, glaucoma, neurodegeneration, biomarker
Introduction
Glaucoma is a neurodegenerative disease characterized by progressive loss of retinal ganglion cells (RGCs). It is a leading cause of irreversible blindness worldwide. Medical and surgical management of glaucoma currently center around controlling intraocular pressure (IOP), the only known modifiable risk factor.1,2 Clinicians often use visual field testing and optical coherence tomography (OCT) to monitor RGC health and to guide treatment decisions. Nonetheless, these are surrogate endpoints that have limitations: visual field testing can be unreliable, especially in older patients, since it requires patient cooperation, and OCT results can be confounded by acquisition artifacts and can be challenging to interpret depending on the patient’s underlying anatomy.3,4 These endpoints are also less useful in very early disease, as they can be equivocal until there is significant RGC damage. Thus, there is a clinical need for novel markers of neurodegeneration in glaucoma that may provide more easily interpretable and reliable characterization of RGC health. Ongoing approaches for monitoring RGC health include Detection of Apoptosing Retinal Cells (DARC) technology,5 as well as measuring the photopic negative response (PhNR) with visual electrophysiology,6 though these have not yet achieved widespread utilization in clinical settings.
Neurofilament light chain (NfL) is a component of the neuronal cytoskeleton, and its levels are elevated in cerebrospinal fluid and serum of patients with a variety of neurodegenerative diseases, including Alzheimer’s disease, traumatic brain injury, multiple sclerosis, and Parkinson’s disease.7–11 It is hypothesized that neurons release NfL when they are injured, and NfL subsequently accumulates in biofluids such as blood and can be quantified with traditional biochemical assays. Of note, serum NfL is elevated in older patients and people with higher BMI, even in those without neurodegenerative disease.12,13 Importantly, NfL has previously been shown to be expressed in RGCs based on immunohistochemical studies in animal models and humans.14,15 In animal models of ocular hypertension and glaucoma, NfL expression was found to be decreased in the retina and the optic nerve in tandem with RGC loss, suggesting that NfL may be a molecular marker of RGC integrity.16,17 We hypothesized that as RGCs die in glaucoma, NfL is released from damaged RGCs and accumulates in the vitreous and AH, subsequently leading to a measurable elevation of AH NfL in glaucoma patients.
Past studies have suggested that NfL may be used clinically to monitor the extent of ongoing neurodegeneration in a variety of neurodegenerative diseases of the brain and the spinal cord and to guide treatment decisions and treatment response.18 In Alzheimer’s disease, the rate of change in serum NfL has been shown to be associated with disease progression in patients at early, pre-symptomatic stages of disease.7 In patients with traumatic brain injury related to acute concussion, serum and cerebrospinal NfL have been shown to be positively associated with extent of injury and to decline years after initial injury.10 In patients with multiple sclerosis (MS), elevated NfL is associated with higher MS lesion load and higher risk of future relapses; of interest, treatment leads to quantifiable reductions in NfL levels, suggesting stabilization of neurodegeneration.11 Finally, serum NfL is elevated in patients with Parkinson’s disease compared with controls, increases longitudinally over the course of disease, and is positively associated with clinical progression.9 Taken together, these results suggest that, in the central nervous system, NfL may offer a quantifiable and dynamic readout of disease evolution and treatment response in a variety of neurodegenerative diseases with diverse underlying pathobiology.
Here, we tested whether NfL is elevated in the AH of patients with glaucoma. If successful, we speculate that AH NfL may have clinical utility for guiding treatment decisions and as a biologically relevant endpoint in future clinical trials.
Materials and Methods
This single-center, case-control study was approved by the Mass General Brigham Institutional Review Board and adhered to the tenets of the Declaration of Helsinki. All patients provided written informed consent. To determine the appropriate sample size to identify a significant difference in AH NfL levels in patients with glaucoma compared with healthy controls, we performed an a priori power analysis using the pwr package in R.19 Estimating an effect size of f2 = 0.20 and the need to control for two covariates (age and BMI), we calculated a sample size of N = 51 to achieve 80% power at a two-tailed alpha of 0.05. To account for the possible need to exclude up to 10% of the patients, we recruited 58 participants from Mass Eye and Ear. Cases included 46 patients with any type of glaucoma treated by one glaucoma specialist (D.S.) who were determined to be candidates for glaucoma surgery as part of their usual care. Controls included 12 patients with age-related cataract and no known diagnosis of glaucoma, glaucoma suspect, or ocular hypertension, who were determined to be candidates for phacoemulsification with intraocular lens implantation and were treated by one of three comprehensive ophthalmologists (S.L.W., K.L., and C.S.). Eyes were excluded if they had active ocular inflammation or optic nerve degeneration from non-glaucomatous causes. We included only one eye from each participant; the fellow eye was not eligible for inclusion.
AH was obtained from cases and controls in the operating room at the start of planned ophthalmic surgery. Briefly, a blunt cannula on a syringe was inserted into the initial peripheral paracentesis and used to remove 25–150 µL of AH. The planned ophthalmic surgery was then performed. AH was immediately placed on dry ice and stored at −80°C until analysis per standard protocol for storing specimens in biobank and biorepository settings.20
NfL levels were measured using the commercially available single-molecule array (Simoa®) NF-light Advantage kit according to manufacturer’s instructions with an automated Simoa® HD-X Analyzer (Quanterix, Billerica, MA). Simoa® is a digital immunoassay that permits ultrasensitive protein detection and has been used to measure NfL and numerous other proteins in various biofluids, including plasma and cerebrospinal fluid.21 AH NfL was measured by an individual masked to clinical information. AH samples were diluted (4× to 25×) and assayed in singlicate. The lower limit of quantification of NfL in diluted AH was 0.174 pg/mL, and the upper limit of quantification (ULOQ) was 473 pg/mL. After adjusting for dilution, we calculated a detection range from 0.696 pg/mL (ie, 0.174 × 4) to 11,825 pg/mL (473 × 25). Of the 58 samples analyzed, 1 sample from a patient with glaucoma was below the limit of detection, and 8 samples (6 from patients with glaucoma and 2 from controls) were below the lower limit of quantification. These samples were omitted from subsequent quantitative analysis, yielding a final N = 49 for analysis (39 cases and 10 controls). Total protein concentration in AH was measured using the bicinchoninic acid assay.
Demographic and clinical information, including age, sex, BMI, self-reported race, laterality, surgery type, glaucoma type, pre-operative IOP, maximum IOP, Humphrey visual field mean deviation (obtained with 24–2 Swedish Interactive Threshold Algorithm [SITA]-Standard test pattern; Humphrey Visual Field HFA 750i, Carl Zeiss Meditec, Dublin, CA), and retinal nerve fiber layer (RNFL) thickness measured with the CirrusTM HD-OCT 500 (Carl Zeiss Meditec, Dublin, CA), was obtained by retrospective chart review by investigators masked to NfL levels (K.M.P., C.N.). Glaucoma stage was assigned based on the American Academy of Ophthalmology (AAO) Preferred Practice Pattern guidelines.19 IOP was measured as a part of routine care with Goldmann applanation tonometry.
We performed statistical analysis and data visualization using R version 4.0.3 and RStudio version 1.3.1093. To compare means between two groups, we used the Wilcoxon rank sum test; to determine relationships between categorical variables, we used Fisher's exact test; to determine associations between continuous, normally distributed variables, we calculated Pearson correlation coefficients; to determine associations between continuous and ordinal variables (e.g., number of pre-operative glaucoma medications and glaucoma stage), we calculated Spearman correlation coefficients. We used non-parametric statistical tests when applicable due to small sample sizes and possible violations of the assumption of normality. To characterize the relationship between AH NfL levels and glaucoma, we created general linear models and generalized linear models, including age, BMI, and/or pre-operative IOP, as covariates when indicated. For these analyses, AH NfL levels were log2-transformed to achieve normality. To confirm the robustness of our findings despite differences in group size, we simulated analysis with equally sized groups of N = 10. For each simulated iteration, we randomly selected 10 of the 39 cases and re-ran the main analysis comparing log2-transformed AH NfL between glaucoma patients and controls (N=10/group), adjusting for the covariates of age and BMI; P values were extracted from 1000 simulations. For all statistical analyses, we considered P < 0.05 to be statistically significant.
Results
Table 1 shows the demographic and clinical characteristics of the participants. There were no significant differences between patients with glaucoma and controls in terms of age, sex, BMI, self-reported race, or laterality. The 39 patients with glaucoma underwent diverse surgical interventions: 15 (38%) had phacoemulsification combined with minimally invasive glaucoma surgery (MIGS), 9 (23%) had incisional glaucoma surgery, and 12 (31%) underwent phacoemulsification combined with incisional glaucoma surgery. The patients with glaucoma also had diverse types of glaucoma: 17 (44%) had primary open-angle glaucoma, 5 (13%) had normal-tension glaucoma, 10 (26%) had mixed-mechanism glaucoma, 3 (7.7%) had pseudoexfoliation glaucoma, 2 (5.1%) had chronic angle-closure glaucoma, 1 (2.6%) had uveitic glaucoma, and 1 (2.6%) had pigmentary glaucoma. Of the patients with glaucoma, 16 (41%) were classified as mild stage, 12 (31%) as moderate stage, and 11 (28%) as severe stage.
 |
Table 1 Demographic and Clinical Information of Participants |
In a model controlling for age and BMI, log2-transformed absolute NfL levels were significantly elevated in AH from patients with glaucoma (mean: 429 pg/mL; standard deviation [SD]: 1136 pg/mL) compared with AH from controls (mean: 3.1 pg/mL; SD: 1.9 pg/mg; P = 0.002; Figure 1A). To determine whether elevated NfL in patients with glaucoma could be explained by non-specific elevation of protein in AH secondary to medication use or other factors, we also calculated “normalized” AH NfL levels by dividing absolute NfL levels by total protein concentration in the AH. There was a strong correlation between absolute AH NfL levels and normalized AH NfL levels (R = 0.99, P < 0.001; Figure 1B). Log2-transformed AH NfL levels remained significantly elevated in patients with glaucoma compared with controls after normalization (P = 0.002; Figure 1C). Sensitivity analysis confirmed that these results were robust despite differences in sample size: of 1000 simulated iterations comparing 10 randomly selected cases with 10 controls, statistical significance (P < 0.05) was achieved in 96.3% of iterations with a minimum p value of 6.10 × 10⁻⁷, a maximum p value of 0.21, and a mean p value 0.01.
 |
Figure 1 Neurofilament light chain (NfL) is elevated in aqueous humor (AH) of patients with glaucoma. (A) Log2-transformed absolute NfL levels (pg/mL) are significantly elevated in AH from patients with glaucoma versus from controls. (B) There is a very strong correlation between absolute NfL levels in AH and NfL levels normalized by dividing by total protein. (C) Log2-transformed absolute NfL levels (pg/mL) remain significantly elevated in AH from patients with glaucoma versus from controls after normalization. Individual circles depict individual participants (A–C). |
To estimate the magnitude of association between AH NfL and glaucoma, we calculated odds ratio. In a model controlling for the effects of age and BMI, each 2-fold increase in AH NfL was found to be associated with 10.1-fold increased odds of having glaucoma (95% confidence interval [CI]: 2.7 to 102, P = 0.009). This association remained highly significant when controlling for pre-operative IOP in addition to age and BMI: in this model, each 2-fold increase in AH NfL was associated with 25.9-fold increased odds of having glaucoma (95% CI: 3.4 to 1497, P = 0.034).
We also sought to determine whether, among glaucoma patients, elevated AH NfL was associated with any clinical characteristics. AH NfL showed weak-to-moderate positive associations with maximum IOP (R = 0.44, P = 0.005; Figure 2A) and pre-operative IOP (R = 0.46, P = 0.003; Figure 2B). In contrast, there was no association between AH NfL and Humphrey Visual Field mean deviation (R = −0.20, P = 0.220; Figure 2C) or OCT RNFL thickness (R = 0.07, P = 0.694; Figure 2D). There was a moderate positive association between AH NfL and number of pre-operative glaucoma medications (Rs = 0.61, P < 0.001; Figure 3A) but no association between AH NfL and glaucoma stage (Rs 0.015, P = 0.935; Figure 3B).
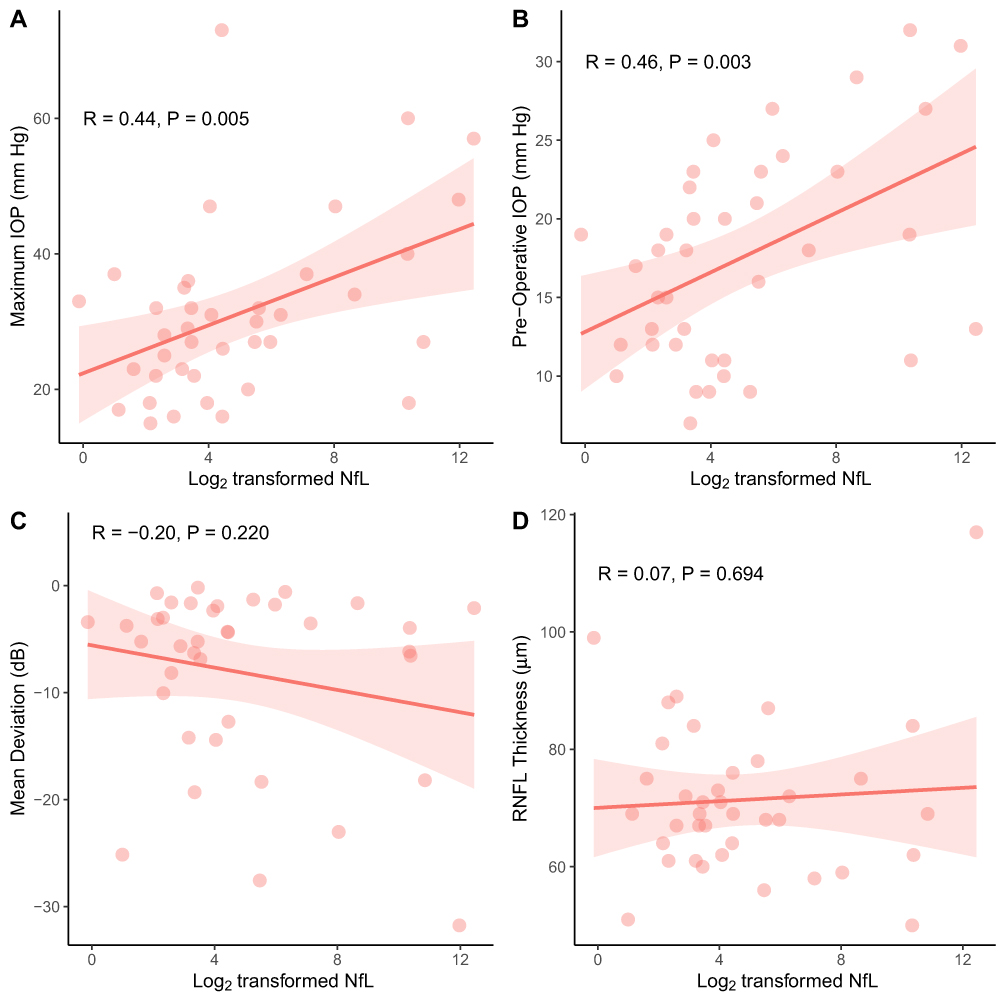 |
Figure 2 There are weak-to-moderate positive associations between levels of neurofilament light chain (NfL) in aqueous humor (AH) and maximum intraocular pressure (IOP) and pre-operative IOP (A and B). There are no significant associations between levels of AH NfL and mean deviation on Humphrey visual field testing or retinal nerve fiber layer (RNFL) thickness as measured by optical coherence tomography (C and D). Individual circles depict individual participants; the red shading depicts 95% confidence interval bands (A–D). |
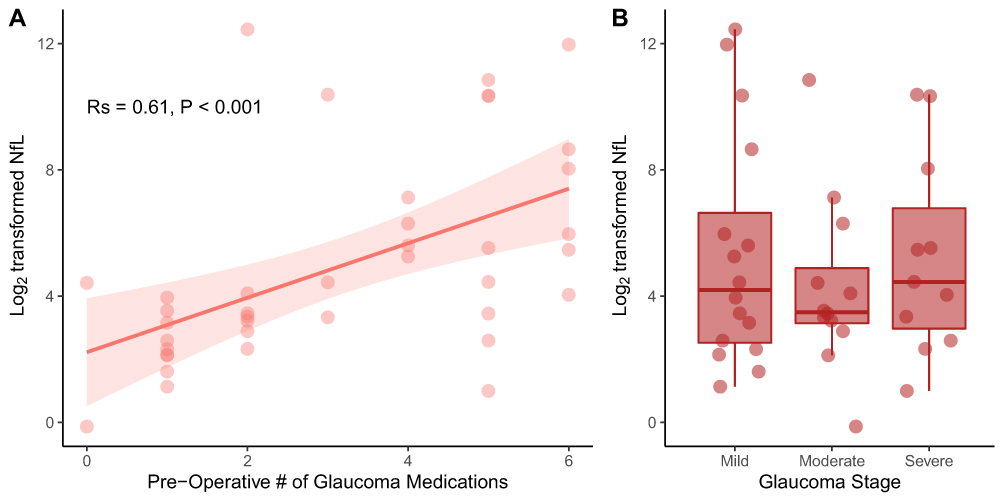 |
Figure 3 There was a moderate positive association between pre-operative number of glaucoma medications and levels of neurofilament light chain (NfL) in aqueous humor (A). There was no association between levels of AH NfL and glaucoma stage (based on the American Academy of Ophthalmology (AAO) Preferred Practice Pattern guidelines) (B). Individual circles depict individual participants (A and B); the red shading depicts a 95% confidence interval band (A). Rs: Spearman correlation coefficient. |
Discussion
In this study, we found that NfL is elevated in AH from patients with glaucoma compared to patients without glaucoma undergoing phacoemulsification for age-related cataract. This difference remained statistically significant after controlling for age and BMI, factors that have been shown previously to influence NfL levels in other biofluids,12,13 as well as after controlling for total protein in AH, suggesting that our findings are not explained by non-specific elevation of protein levels in patients with glaucoma. In our statistical models, each 2-fold increase in AH NfL was found to be associated with 10.1-fold increased odds of having glaucoma, which become even larger in magnitude (i.e., 25.9-fold) when controlling for pre-operative IOP, a known risk factor of glaucoma. NfL is a cytoskeletal protein that is highly expressed in neurons and is thought to accumulate in biofluids following neuronal injury and death. Our findings suggest that, like in neurodegenerative diseases of the brain and the spinal cord, glaucomatous neurodegeneration also leads to NfL release and accumulation in AH, allowing for a quantifiable readout of RGC status.
Our findings are consistent with a prior pilot study, which identified significant elevations of NfL in blood from patients with early and advanced glaucoma compared with healthy participants (N = 15/group).22 Although this difference was not statistically significant after controlling for age, the trend toward higher serum NfL in patients with glaucoma supports the notion that NfL may be a marker of glaucomatous neurodegeneration. We speculate that this prior study examining serum may have been underpowered to detect a smaller, but still clinically significant, difference due to its relatively small sample size. Our findings are also similar to a recent study in a patient population in Austria,23 which found a significant elevation in AH NfL in patients with glaucoma compared with controls undergoing routine cataract extraction. The reproducibility of these findings across diverse patient populations from unique geographic locations highlights the generalizability of our findings and supports their potential clinical utility. One strength of our study is that the elevation in AH NfL from patients with glaucoma remained statistically significant after controlling for age and BMI, two factors that have been found to affect levels of NfL in other biofluids.
In our study, we also found statistically significant associations between AH NfL and maximum IOP, pre-operative IOP, and number of pre-operative glaucoma medications. These are clinical factors that tend to be increased in poorly controlled disease. We speculate that AH NfL may be more elevated when there is ongoing RGC damage due to inadequate disease control and unacceptably high IOP. In contrast, AH NfL was not associated with glaucoma severity in terms of clinical stage, Humphrey visual field mean deviation, and OCT RNFL thickness. These null findings suggest that elevated AH NfL may be more closely associated with ongoing RGC damage leading to active AH NfL accumulation rather than past structural and functional glaucomatous damage, which may currently be inactive given improved disease control. Longitudinal studies would be required to test this hypothesis.
We propose that, if future larger studies validate NfL as a biomarker of neurodegeneration in glaucoma, it may be possible to use NfL to guide clinical decision making. For example, a patient with elevated NfL despite seemingly stable visual fields and OCT measurements may have more ongoing RGC neurodegeneration and thus need closer monitoring and/or treatment intensification compared to a patient with low NfL levels. Furthermore, patients with high NfL levels may be fast progressors or have more severe ongoing RGC neurodegeneration and, thus, may be excellent candidates for clinical trials for future neuroprotective therapies for glaucoma. Similar to prior proposals of using combined endpoints or enrolling patients with more reliable visual field testing indices to increase statistical power and to reduce required sample sizes in clinical trials,24,25 enrolling patients with elevated NfL may allow for shortened clinical trial duration and/or reduced cost.
Our study had several limitations. Although we enrolled a sufficient number of participants based on our power analysis, our sample size did not permit us to control for all possible covariates that may influence NfL levels in AH and may not be completely representative of the North American patient population since it was performed at a single site. Our model controlled for age and BMI, which have been shown previously to influence NfL levels.12,13 However, it remains possible that there are other demographic or clinical characteristics that may affect AH NfL levels. Our study enrolled participants with multiple types of glaucoma and those undergoing different ophthalmic surgeries, which may have affected the measured AH NfL levels. Nonetheless, our diverse enrollment also reflects the heterogeneity of clinical presentations of glaucoma patients in real life and supports the generalizability of our findings to clinical practice.
Finally, one significant limitation in applying our finding widely is the difficulty of obtaining AH in patients not undergoing ophthalmic surgery. Future larger studies should examine whether NfL levels are also significantly elevated in serum of glaucoma patients and how well serum NfL correlates with AH NfL, as blood samples can be more easily collected in clinic on a routine basis. Though prior studies have examined the possibility that serum NfL may be elevated in patients with glaucoma,22,23 both relied on relatively small sample sizes (i.e., <60 per group). Therefore, it remains possible that a significant difference exists but was not detected in these underpowered studies.
Conclusions
Taken together, this study provides evidence that AH NfL may be a viable marker of glaucomatous neurodegeneration in a racially diverse North American patient population. If validated by future studies, our study may serve as a foundation for future studies investigating a potential role for AH NfL in clinical trial design and in clinical practice.
Data Sharing Statement
De-identified data are available upon reasonable request to corresponding authors.
Acknowledgments
The authors thank Dr. David Friedman (Massachusetts Eye and Ear, Boston, MA) for helpful discussions.
Author Contributions
All authors made a significant contribution to the work reported, whether that is in the conception, study design, execution, acquisition of data, analysis and interpretation, or in all these areas; took part in drafting, revising or critically reviewing the article; gave final approval of the version to be published; have agreed on the journal to which the article has been submitted; and agree to be accountable for all aspects of the work.
Disclosure
D.S.D. received financial support from Allergan, an AbbVie company, for giving lectures related to the XEN Gel Stent in 2021, a device that is unrelated to this study. D.S.D. was also supported by donations from Joseph and Cathey Leitch; Chad and Anne Gifford; Stephen Traynor; the Robert M. Sinskey Foundation; the Ruettgers Family Charitable Foundation; and the B.L. Manger Foundation. N.E.H. was an employee of Massachusetts Eye and Ear at the time the study was conducted and is now an employee of Janssen Research & Development. M.A.M. was supported by NIH/NEI K12 EY016335, NIH/NEI K08 EY030160, an American Glaucoma Society Young Clinician Scientist Award, a Research to Prevent Blindness Career Development Award, the Robert M. Sinskey Foundation; the Ruettgers Family Charitable Foundation; and the B.L. Manger Foundation. J.B.L. was supported by the VitreoRetinal Surgery Foundation and the Gragoudas-Folkman Award. The funders were not involved in the manuscript writing, editing, approval, or decision to publish. The authors report no other conflicts of interest in this work.
References
1. Gordon MO, Beiser JA, Brandt JD, et al. The Ocular Hypertension Treatment Study: baseline factors that predict the onset of primary open-angle glaucoma. Arch Ophthalmol. 2002;120(6):714–720. doi:10.1001/archopht.120.6.714
2. Miglior S, Zeyen T, Pfeiffer N, et al. Results of the European Glaucoma Prevention Study. Ophthalmology. 2005;112(3):366–375. doi:10.1016/j.ophtha.2004.11.030
3. Raman P, Khy Ching Y, Sivagurunathan PD, Ramli N, Mohd Khalid KH. The Association Between Visual Field Reliability Indices and Cognitive Impairment in Glaucoma Patients. J Glaucoma. 2019;28(8):685–690. doi:10.1097/IJG.0000000000001269
4. La Bruna S, Rai A, Mao G, et al. The OCT RNFL Probability Map and Artifacts Resembling Glaucomatous Damage. Transl Vis Sci Technol. 2022;11(3):18. doi:10.1167/tvst.11.3.18
5. Cordeiro MF, Hill D, Patel R, Corazza P, Maddison J, Younis S. Detecting retinal cell stress and apoptosis with DARC: progression from lab to clinic. Prog Retin Eye Res. 2022;86:100976. doi:10.1016/j.preteyeres.2021.100976
6. Prencipe M, Perossini T, Brancoli G, Perossini M. The photopic negative response (PhNR): measurement approaches and utility in glaucoma. Int Ophthalmol. 2020;40(12):3565–3576. doi:10.1007/s10792-020-01515-0
7. Preische O, Schultz SA, Apel A, et al. Serum neurofilament dynamics predicts neurodegeneration and clinical progression in presymptomatic Alzheimer’s disease. Nat Med. 2019;25(2):277–283. doi:10.1038/s41591-018-0304-3
8. Bacioglu M, Maia LF, Preische O, et al. Neurofilament Light Chain in Blood and CSF as Marker of Disease Progression in Mouse Models and in Neurodegenerative Diseases. Neuron. 2016;91(1):56–66. doi:10.1016/j.neuron.2016.05.018
9. Mollenhauer B, Dakna M, Kruse N, et al. Validation of Serum Neurofilament Light Chain as a Biomarker of Parkinson’s Disease Progression. Mov Disord. 2020;35(11):1999–2008. doi:10.1002/mds.28206
10. Shahim P, Politis A, van der Merwe A, et al. Neurofilament light as a biomarker in traumatic brain injury. Neurology. 2020;95(6):e610–e622. doi:10.1212/WNL.0000000000009983
11. Kuhle J, Kropshofer H, Haering DA, et al. Blood neurofilament light chain as a biomarker of MS disease activity and treatment response. Neurology. 2019;92(10):e1007–e1015. doi:10.1212/WNL.0000000000007032
12. Manouchehrinia A, Piehl F, Hillert J, et al. Confounding effect of blood volume and body mass index on blood neurofilament light chain levels. Ann Clin Transl Neurol. 2020;7(1):139–143. doi:10.1002/acn3.50972
13. Vågberg M, Norgren N, Dring A, et al. Levels and Age Dependency of Neurofilament Light and Glial Fibrillary Acidic Protein in Healthy Individuals and Their Relation to the Brain Parenchymal Fraction. PLoS One. 2015;10(8):e0135886. doi:10.1371/journal.pone.0135886
14. Chidlow G, Casson R, Sobrado-Calvo P, Vidal-Sanz M, Osborne NN. Measurement of retinal injury in the rat after optic nerve transection: an RT-PCR study. Mol Vis. 2005;11:387–396.
15. Ruiz-Ederra J, García M, Hicks D, Vecino E. Comparative study of the three neurofilament subunits within pig and human retinal ganglion cells. Mol Vis. 2004;10:83–92.
16. Roh M, Zhang Y, Murakami Y, et al. Etanercept, a widely used inhibitor of tumor necrosis factor-α (TNF-α), prevents retinal ganglion cell loss in a rat model of glaucoma. PLoS One. 2012;7(7):e40065. doi:10.1371/journal.pone.0040065
17. Taniguchi T, Shimazawa M, Hara H. Alterations in neurofilament light in optic nerve in rat kainate and monkey ocular hypertension models. Brain Res. 2004;1013(2):241–248. doi:10.1016/j.brainres.2004.04.023
18. Yuan A, Nixon RA. Neurofilament Proteins as Biomarkers to Monitor Neurological Diseases and the Efficacy of Therapies. Front Neurosci. 2021;15:689938. doi:10.3389/fnins.2021.689938
19. Champely S Pwr: basic Functions for Power Analysis; 2020. Available from: https://CRAN.R-project.org/package=pwr.
20. Shabihkhani M, Lucey GM, Wei B, et al. The procurement, storage, and quality assurance of frozen blood and tissue biospecimens in pathology, biorepository, and biobank settings. Clin Biochem. 2014;47(4–5):258–266. doi:10.1016/j.clinbiochem.2014.01.002
21. Rissin DM, Kan CW, Campbell TG, et al. Single-molecule enzyme-linked immunosorbent assay detects serum proteins at subfemtomolar concentrations. Nat Biotechnol. 2010;28(6):595–599. doi:10.1038/nbt.1641
22. Comacchio F, Mariotto S, Neri E, et al. Neurofilament light chain: a novel biomarker in patients with glaucoma. Invest Ophthalmol Vis Sci. 2020;61(7):246.
23. Woltsche N, Valentin K, Hoeflechner L, et al. Neurofilament light chain: a new marker for neuronal decay in the anterior chamber fluid of patients with glaucoma. Br J Ophthalmol. 2022. doi:10.1136/bjo-2021-320828
24. Wu Z, Medeiros FA. Sample Size Requirements of Glaucoma Clinical Trials When Using Combined Optical Coherence Tomography and Visual Field Endpoints. Sci Rep. 2019;9(1):18886. doi:10.1038/s41598-019-55345-x
25. Montesano G, Quigley HA, Crabb DP. Improving the Power of Glaucoma Neuroprotection Trials Using Existing Visual Field Data. Am J Ophthalmol. 2021;229:127–136. doi:10.1016/j.ajo.2021.04.008
 © 2023 The Author(s). This work is published and licensed by Dove Medical Press Limited. The full terms of this license are available at https://www.dovepress.com/terms.php and incorporate the Creative Commons Attribution - Non Commercial (unported, v3.0) License.
By accessing the work you hereby accept the Terms. Non-commercial uses of the work are permitted without any further permission from Dove Medical Press Limited, provided the work is properly attributed. For permission for commercial use of this work, please see paragraphs 4.2 and 5 of our Terms.
© 2023 The Author(s). This work is published and licensed by Dove Medical Press Limited. The full terms of this license are available at https://www.dovepress.com/terms.php and incorporate the Creative Commons Attribution - Non Commercial (unported, v3.0) License.
By accessing the work you hereby accept the Terms. Non-commercial uses of the work are permitted without any further permission from Dove Medical Press Limited, provided the work is properly attributed. For permission for commercial use of this work, please see paragraphs 4.2 and 5 of our Terms.