Back to Journals » Neuropsychiatric Disease and Treatment » Volume 14
Neurofilament light chain as a biological marker for multiple sclerosis: a meta-analysis study
Received 7 May 2018
Accepted for publication 10 July 2018
Published 3 September 2018 Volume 2018:14 Pages 2241—2254
DOI https://doi.org/10.2147/NDT.S173280
Checked for plagiarism Yes
Review by Single anonymous peer review
Peer reviewer comments 3
Editor who approved publication: Professor Wai Kwong Tang
Laisheng Cai, Jingwei Huang
Department of Neurology, The First Affiliated Hospital of Nanchang University, Jiangxi, People’s Republic of China
Purpose: There is a need for biomarkers in multiple sclerosis (MS) to make an early diagnosis and monitor its progression. This study was designed to evaluate the value of neurofilament light (NFL) chain levels as cerebrospinal fluid (CSF) or blood biomarker in patients with MS by using a quantitative meta-analysis.
Methods: The PubMed, Embase, and Web of Science databases were systematically searched for relevant studies. Articles in English that evaluated the utility of NFL in CSF and blood in the diagnosis of MS were included. Data were extracted by two independent researchers. Mean (± SD) NFL concentration for MS patients and control subjects were extracted. Review Manager version 5.3 software with a continuous-variable random-effects model was used to summarize the diagnostic indexes from eligible studies. The Newcastle–Ottawa Scale was used for assessing the quality and risk of bias of included studies. In addition, subgroup analysis and meta-regression were performed to assess potential heterogeneity sources.
Results: The meta-analysis included 13 articles containing results from 15 studies. A total of 10 studies measured NFL levels in CSF and five studies measured NFL levels in blood. Data were available on 795 participants in CSF and 1,856 participants in blood. Moreover, CSF NFL in MS patients was higher than that in healthy control groups (pooled standard mean difference [Std.MD]=0.88, 95% CI [0.50, 1.26], P<0.00001) and serum NFL in MS patients was higher than that in control subjects (pooled Std.MD=0.47, 95% CI [0.24, 0.71], P<0.0001).
Conclusion: NFL chain has significantly increased in MS patients, which substantially strengthens the clinical evidence of the NFL in MS. The NFL may be used as a prognostic biomarker to monitor disease progression, disease activity, and treatment efficacy in the future.
Keywords: multiple sclerosis, neurofilament light chain, meta-analysis
Introduction
Multiple sclerosis (MS) is a disease of the central nervous system (CNS) usually characterized by relapsing episodes of neurological dysfunction, often followed some years later by progressive and irreversible decline. It is one of the common causes of acquired neurological disability in young people in Northern Europe and the USA.1 Once thought of as the model for inflammatory CNS disorder, evidence now suggests that the pathophysiology is complex and possibly occurs via multiple mechanisms, including axonal damage and neurodegeneration.2 The extent of axonal damage and neurodegeneration reflects as a main determinant of patients’ physical disability.3,4 The complexity of the disease is derived by the inadequacy of current treatments and the progressive phase of the disease, during which patients gradually become more disabled, for which there is no effective therapy.1
Axonal loss and neurodegeneration are main elements of MS pathology, so an objective biomarker to detect and quantify them should be of great value. Neurofilaments (NFs) belong to the intermediate filament family of proteins and are the major components of the cytoskeleton of neurons.5 NF can be divided according to the observed molecular weight into neurofilament light (NFL) chain (68 kDa), neurofilament intermediate (NFM) chain (160 kDa), and neurofilament heavy (NFH) chain (205 kDa).6 Due to damage to axons of the CNS or peripheral nervous system, NFs would then occur in the cerebrospinal fluid (CSF) and the blood stream, where NF can be detected.7,8 Evidence for increased CSF NF levels in MS mainly exists for NFH and NFL, whereas NFM has not been extensively studied so far.9 Several test systems exist to determine NFH and NFL and a commercially available enzyme-linked immunosorbent assay (ELISA) to detect NFL is advantageous in discriminating patients with MS from healthy controls.10
The aim of this article is to investigate whether NFL levels in blood and CSF could be a credible marker for MS, either in differentiating patients from healthy controls or as biomarkers monitoring disease progression or predicting prognosis.11
Methods
This meta-analysis was performed according to the guidelines that are recommended by the PRISMA statement (Preferred Reporting Items for Systematic reviews and Meta-Analysis).12
Search strategy
Two researchers performed a systematic review of peer-reviewed English language articles from the databases of PubMed, Embase, and Web of Science with no year limitation from articles published up to October 1, 2017. The database search keywords were Neurofilament AND Multiple Sclerosis. We used Medical Subject Heading (MeSH) terms to retrieve literature in PubMed, and Emtree terms were used in Embase. Original clinical studies that reported data on NFL concentrations in patients with MS and control subjects were included. We also searched the reference lists of included studies. The literature search, title/abstract screening, the final decision on eligibility after full-text review, and data extraction were independently performed by two investigators.
Inclusion and exclusion criteria
The following inclusion criteria were adopted: 1) performed in adult patients who were >18 years of age; 2) the original article not in reviews, posters, or abstracts; 3) containing retrospective or prospective case–control studies; 4) including a group of patients who fulfilled the revised McDonald criteria from 201013 for MS; 5) detection of the CSF and blood NFL levels in MS patients and healthy control groups. Furthermore, exclusion criteria were listed as follows: 1) studies concerning juveniles (aged <18 years) and pregnant women; 2) animals or cell line studies, commentaries, meta-analysis, case reports or series, reviews, meetings, and editorials or manuscripts unrelated to the research topic; 3) used nonquantitative methods such as Western blot; 4) unsuitable data that the mean levels and SD of NFL cannot be appropriate; 5) the MS subjects with other neurological diseases such as brain infarction, amyotrophic lateral sclerosis, or cerebral hemorrhage; 6) studies without control groups or no healthy individuals; 7) had overlapped sample, or the sample size is less than five or the NF analyzed was assessed in fewer than three studies. We used the EndNote to remove duplicate data. Titles and abstracts were screened for eligible studies and full-text reviewed for potentially qualified studies subsequently. If multiple studies were derived from the same hospital or research center, authors were contacted for excluding overlapped samples.
Data extraction and quality assessment
Two of us (LC and JH) extracted the data. Data on sample size, mean, and SD of NFL chain concentration were extracted as primary outcomes. Data for potential analysis of gender, age, disease duration, sampling source, and type of sample (CSF or serum) were also extracted. If data were presented in a format from which means and SDs were not extractable or only presented graphically, then these measures were requested from the corresponding author of the publication and where a response was not received, we measured the data from the graphs by using digital ruler software (Engauge Digitizer). If the standard error of mean (SEM) was only reported, SD was estimated using the following formula: SD=SEM×Sqrt (sample size). The Newcastle–Ottawa scale (NOS) criteria,14 which included the selection (0–4 scores), comparability (0–2 scores), and exposure (0–3 scores) categories (0 denoted noncompliance with any criteria, nine denoted fulfillment of all criteria), were used to evaluate the quality of the included original articles. Studies were of low-quality methodology in accordance with NOS score being lower than 6 scores.15
Statistical analysis
Heterogeneity was quantified with I2 statistics.16 Standard mean difference (Std.MD) and 95% CI from individual studies were calculated by weighted fixed-effect model when the heterogeneity tests were P≥0.05. Accordingly, the random-effect model was used when the heterogeneity test was P<0.05.15 The data of CSF and blood NFL levels in MS patients compared with that in control subjects were extracted and pooled for separate meta-analysis. Sensitivity analysis and subgroup analysis were done to explore potential heterogeneity sources. Publication bias was assessed by funnel plots. Additionally, heterogeneity, pooled Std.MD, subgroup analysis, and funnel plots were calculated by Review Manager version 5.3 (Copenhagen: The Nordic Cochrane Centre, The Cochrane Collaboration, 2014).15 Also, separate regression of age, gender, sample size, and disease duration on Std.MD of the CSF and blood NFL levels in MS patients were calculated by the method-of-moments technique. Meta-regression was performed by STATA software (version 12.0, StataCorp, College Station, TX, USA).
Results
Search results and characteristics of the included studies
The initial search identified 177 records from PubMed, 389 records from Embase, and 754 records from the Web of Science, and two records from other sources. Nine hundred studies were identified totally, after removing duplicate papers. Scanning of titles and abstracts resulted in identification of 93 articles for full-text scrutiny. Eighty studies were excluded because they lacked necessary data (n=22),5,17–37 lacked control subjects (n=11),38–48 were disease control groups (n=18),49–66 were meeting abstracts (n=27),67–93 and reported NFH chain data in less than three studies (n=2).94,95 Two papers were included in two different studies.96,97 Therefore, a total of 13 articles including results from 15 studies with 1,665 MS patients and 986 healthy volunteers were included in this meta-analysis (Figure 1).
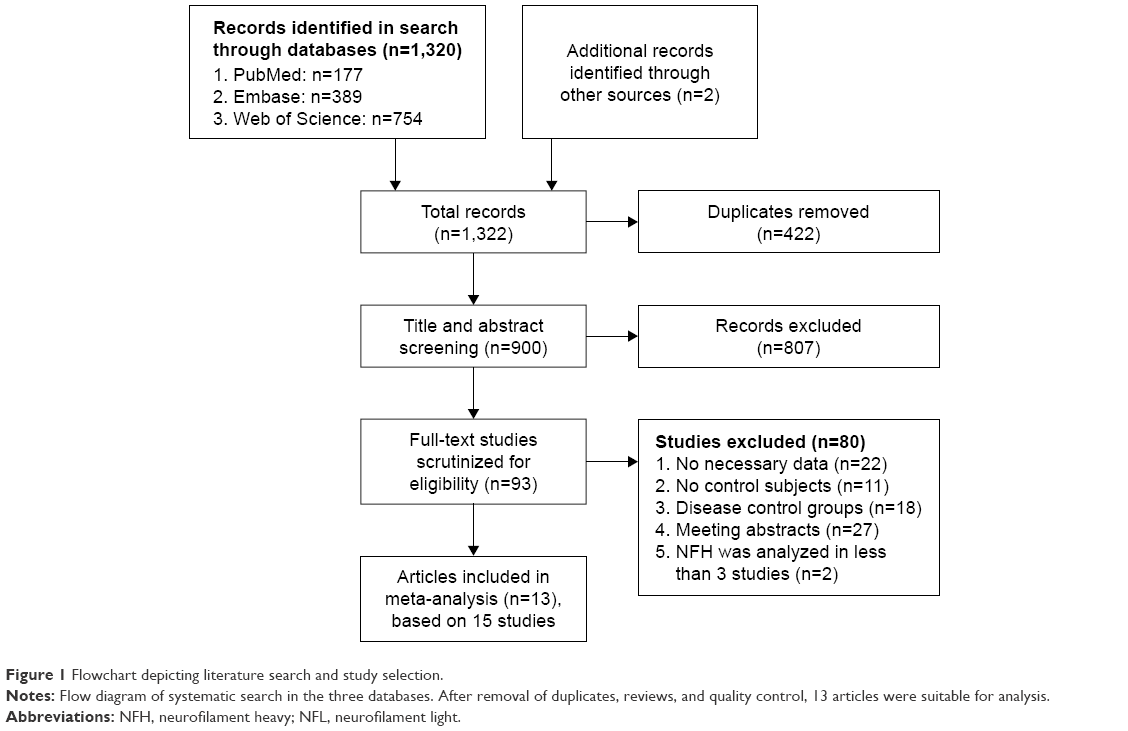 | Figure 1 Flowchart depicting literature search and study selection. |
The general characteristics of studies and participants included in the present meta-analysis and meta-regression are shown in Table 1. Thirteen groups were pooled, which comprises of 2,651 participants, including 795 participants in CSF and 1,856 participants in blood. The mean age of MS patients ranged from 31 to 44 years, whereas that of healthy volunteers ranged from 28 to 44.3 years. Furthermore, the mean disease duration of MS patients ranged from 0.31 to 8.4 years. Electrochemiluminescence (ECL)-based assay and ELISA were used to detect CSF and serum NFL level in all included studies. In accordance with NOS criteria,14 more scores were given to the selection category when compared with other studies. The factors that were selected to evaluate the comparability were age and gender. In the studies by Haghighi et al,98 Norgren et al,99 and Rosengren et al,100 gender difference was not mentioned. Moreover, age difference was also not mentioned in the study by Norgren et al.99 Therefore, zero was given to the comparability category of that study (Table S1).99 In the current study, the year of studies included ranged from 1996 to 2017.
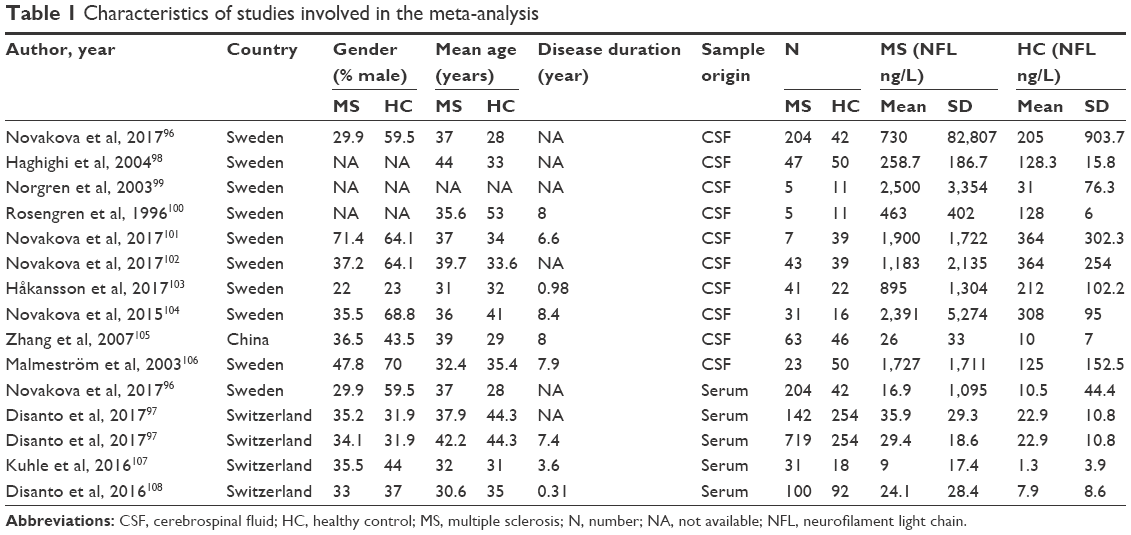 | Table 1 Characteristics of studies involved in the meta-analysis |
NFL levels in CSF
The NFL meta-analysis between MS patients and healthy controls’ involvement in CSF was based on 10 studies,96,98–106 containing 469 MS patients and 326 healthy individuals. Random-effects meta-analysis demonstrated that patients with MS had significantly higher CSF NFL levels compared with control subjects (pooled Std.MD=0.88, 95% CI [0.50, 1.26], P<0.00001) (Figure 2). All papers used ELISA to detect CSF NFL level.
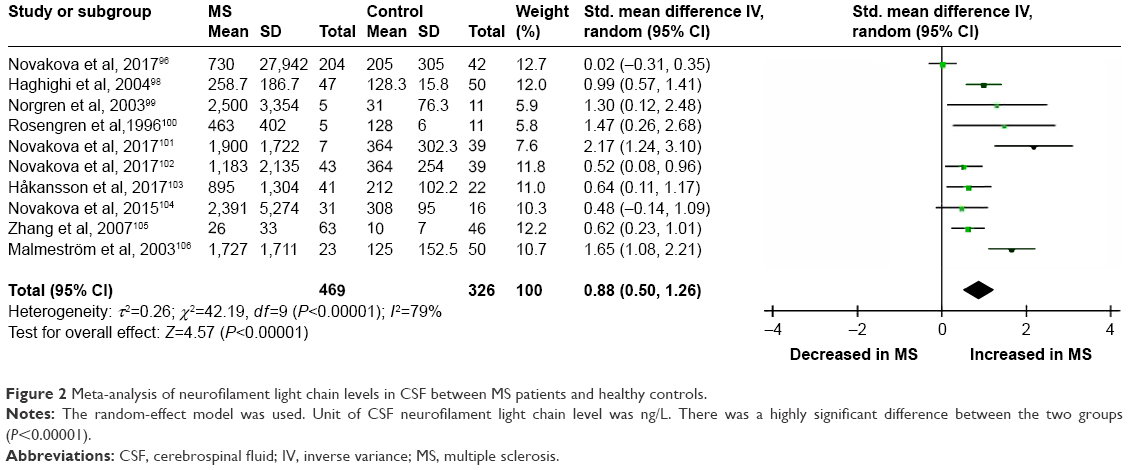 | Figure 2 Meta-analysis of neurofilament light chain levels in CSF between MS patients and healthy controls. |
NFL levels in blood
In blood, the NFL meta-analysis between MS patients and healthy controls’ involvement was based on four studies,96,97,107,108 containing 660 healthy volunteers and 1,196 MS patients. Random-effects meta-analysis demonstrated that patients with MS had significantly higher CSF NFL levels compared with control subjects (pooled Std.MD=0.47, 95% CI [0.24, 0.71], P<0.0001) (Figure 3). The original papers used ECL-based immune assay except for one that used ELISA.96
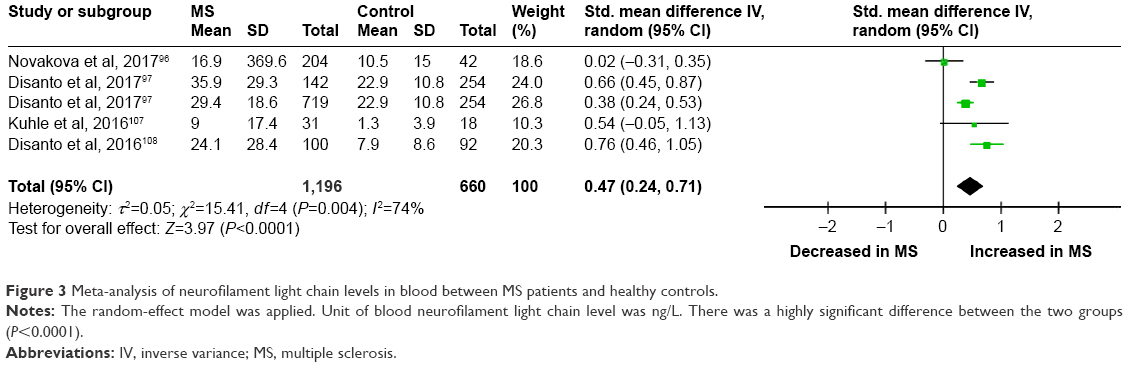 | Figure 3 Meta-analysis of neurofilament light chain levels in blood between MS patients and healthy controls. |
Investigation of heterogeneity
This meta-analysis existed significantly heterogeneity in CSF (I2=79%, P<0.00001) and blood (I2=74%, P=0.004). Next, we attempted to explore the heterogeneity source among studies in the meta-analysis. These potential moderators include age, gender, sample size, disease duration, publication year, and publication bias. So, we carried out sensitivity analysis, subgroup, meta-regression analysis, and publication bias.
Sensitivity analysis
Sensitivity analysis demonstrated that no individual study significantly influenced the statistically significant differences in CSF and blood between MS patients and control subjects. Therefore, no individual study accounted for the significant heterogeneity (Table S2).
Subgroup
To study the causes of heterogeneity, we next performed subgroup analysis based on age-matched design, NFL concentration, and publication year in CSF (Table S3). The impact of heterogeneity was slightly increased (I2=84%, P<0.00001), and the statistical significance was stable for age-matched studies. But for non-age-matched studies, no significant heterogeneity was found (I2=27%, P=0.25), and the significance of the association between elevated NFL levels and MS was retained (Figure 4). The impact of heterogeneity was slightly decreased for the cutoff <1,000 ng/L of NFL concentration (I2=75%, P=0.003), and there was no change in heterogeneity for the cutoff >1,000 ng/L of NFL concentration (I2=79%, P=0.0009). Furthermore, the significance of the association between elevated NFL levels and MS was retained (Figure 5). Finally, for the publication year before 2010, the impact of heterogeneity was reduced to 21% (I2=58%, P=0.05) and the statistical significance was stable, but the impact of heterogeneity was slightly increased (I2=80%, P=0.0005) and the statistical significance was also retained for the publication year after 2010 (Figure 6).
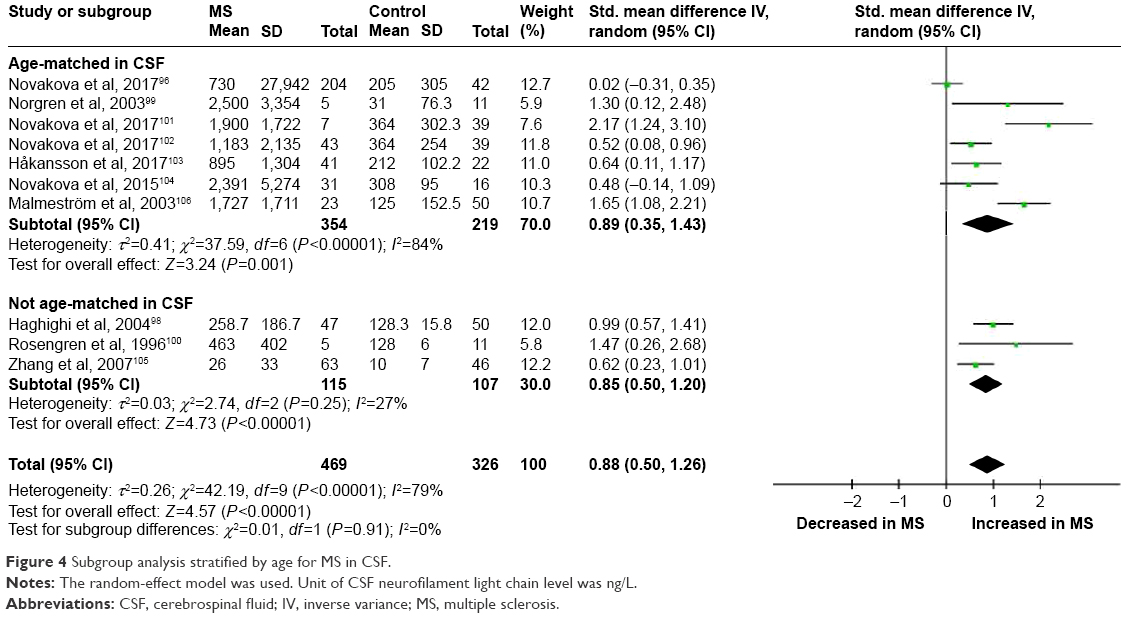 | Figure 4 Subgroup analysis stratified by age for MS in CSF. |
 | Figure 5 Subgroup analysis stratified by neurofilament light chain concentration for MS in CSF. |
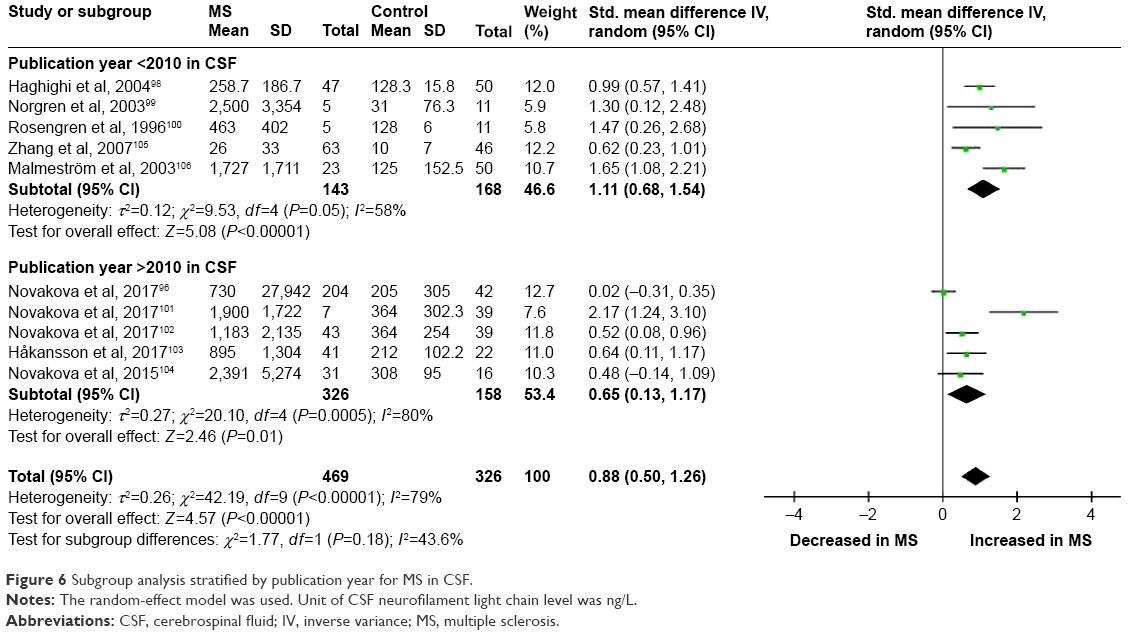 | Figure 6 Subgroup analysis stratified by publication year for MS in CSF. |
In addition, we carried out subgroup analysis based on sample size of MS in blood (Table S3). The heterogeneity disappeared when studies with sample size of MS patients <200 (I2=0%, P=0.78) and >200 (I2=74%, P=0.004) were pooled in turn. Even more, the significance of the association between elevated NFL levels and MS was stable for the sample <200 but not for the sample >200 (Figure 7).
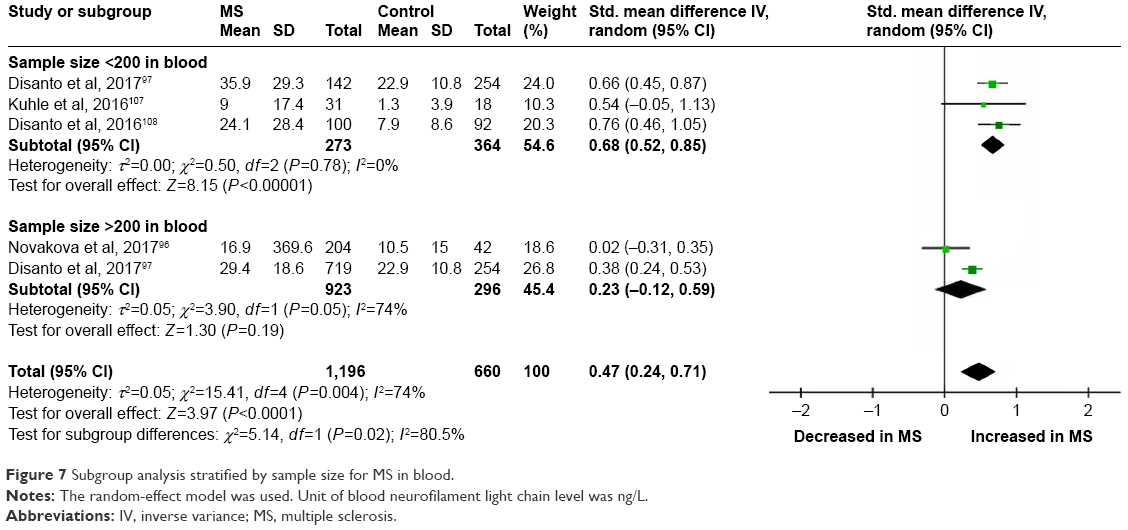 | Figure 7 Subgroup analysis stratified by sample size for MS in blood. |
Meta-regression
Because the number of studies was limited to NFL in blood are limited, the meta-regression analysis was performed for the NFL in CSF. In the meta-regression model, age, gender, sample size, and disease duration in MS patients were pooled. More importantly, Std.MD of CSF NFL was correlated with the sample size of MS patients (P=0.022) and the gender of MS patients (P=0.020). In contrast, there was no significant correlation between Std.MD of CSF NFL and age (P=0.709) and disease duration (P=0.698) in MS patients (Figure 8A–D). Meta-regression analysis suggested that the sample size and gender had moderate effects on the outcome of CSF NFL meta-analysis.
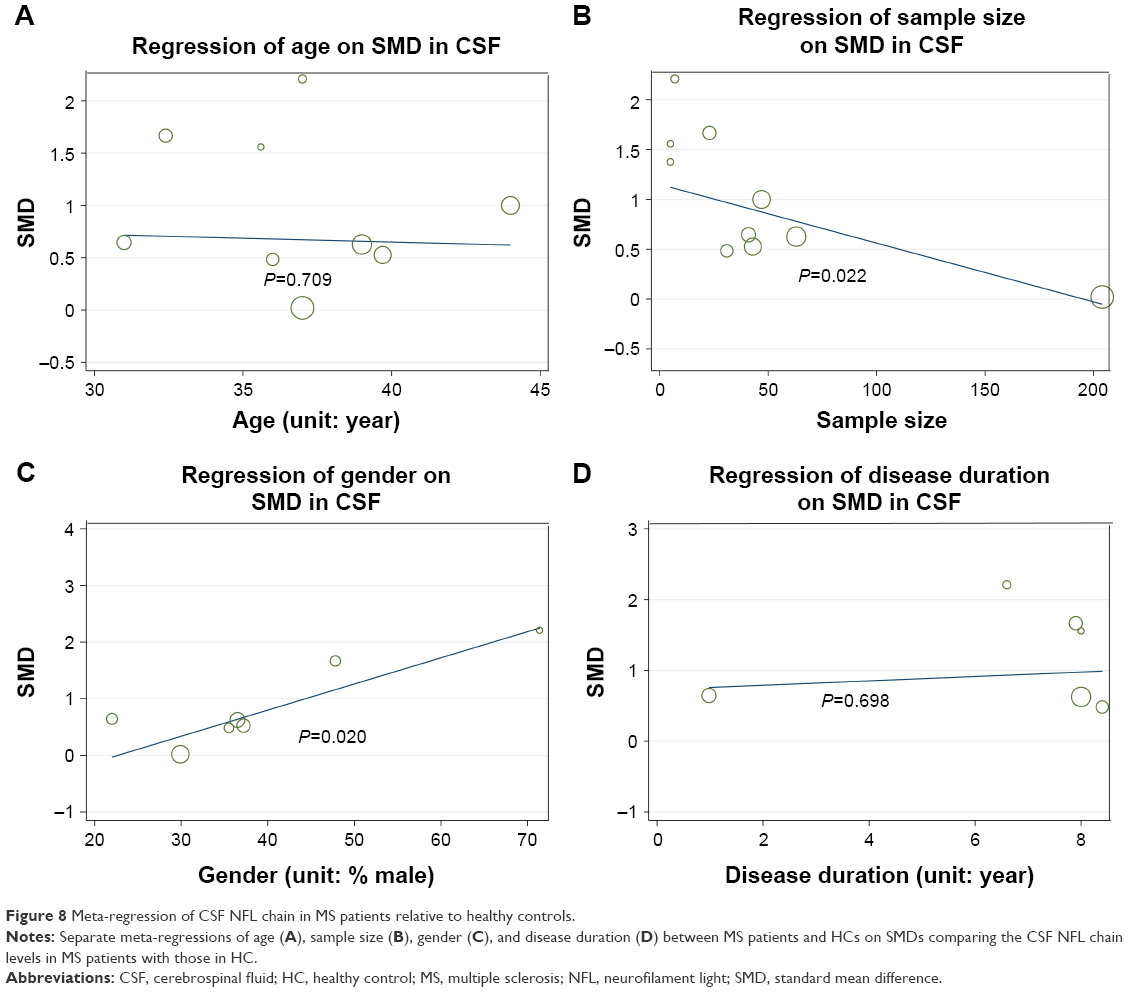 | Figure 8 Meta-regression of CSF NFL chain in MS patients relative to healthy controls. |
Publication bias
In this article, publication bias was evaluated by visual inspection of funnel plot. Results from the funnel plot suggested that there was a low risk for publication bias in CSF (Figure 9A) and blood (Figure 9B).
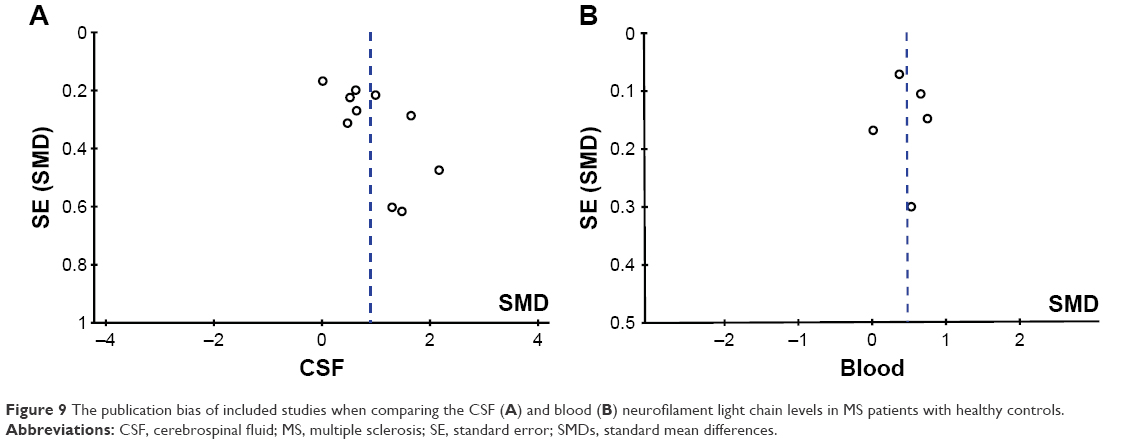 | Figure 9 The publication bias of included studies when comparing the CSF (A) and blood (B) neurofilament light chain levels in MS patients with healthy controls. |
Discussion
To our knowledge, this is the first study to provide a comprehensive meta-analysis of the NFL chain as neuronal markers in MS. The meta-analysis included 13 case–control studies assessing 1,665 MS patients and 986 healthy control subjects and found evidence of significant elevations of NFL levels in MS patients compared with controls. Sensitivity analyses suggested that the significant associations between NFL levels and MS were not influenced by an individual study, suggesting that the overall results were stable. Although inconsistent results have been reported for NFL between studies in the article, our meta-analysis provides evidence of neurodegeneration in MS, strengthening the clinical evidence that patients with MS have axonal injury.
Accumulating evidence shows that axonal damage and neurodegeneration emerge already in early phases of MS.109 Axonal degeneration is thought to be the pathologic basis of disease progression in MS,32 and this damage appears to associate with the degree of clinical disability.110 The cause of axonal loss in MS is still poorly known, probably there are both inflammation induced and neurodegenerative causes,106 but it is likely that a destructive process directed against specific components of the axonal cytoskeleton may contribute to the accumulation of disability.111
NFL chain protein is a major part of the cytoskeletal protein of myelinated axons, and increased levels of NFL in MS patients indicate continuous axonal damage.30,106 The high intraneuronal levels of NFs are of great significance both for diagnosis and for therapeutic effect in clinical medicine.99 Based on our previous data, NFL levels are elevated during all stages of MS, particularly in relapsing-remitting MS106 and in progressive MS,96 whereas levels of NFL decrease toward normality during intervention with disease-modifying therapies,40,112–116 suggesting that NFL related to different pathological processes involved in MS reflects disease activity, disease progression, and treatment efficacy.101
The heterogeneity for the NFL in our present meta-analysis varied from zero to high. For the NFL significantly associated with MS, high levels of heterogeneity were found both in CSF and in blood studies. Therefore, subgroup analysis and meta-regression were used to explore the possible confounders that explained the high-level between-study heterogeneity. The subgroup analysis suggested that age designed (age-matched vs not age-matched), NFL concentration (cutoff <1,000 ng/L vs cutoff >1,000 ng/L), and publication year (before 2010 vs after 2010) partially explained the heterogeneity in CSF. First, there was low heterogeneity within the included studies except for age-matched studies, which indicated that age accounted for one of the heterogeneity sources (Figure 4). Second, subgroup analysis stratified by NFL concentration suggested that the heterogeneity was not significantly changed (Figure 5). Furthermore, there was reduced heterogeneity in studies for the publication year of MS patients before 2010 (Figure 6). Meanwhile, subgroup analysis was used to evaluate the influence of sample size (<200 vs >200) of MS patients in blood on heterogeneity. No heterogeneity appeared in studies with sample size of MS patients <200 (Figure 7). Thus, when comparing NFL levels in MS patients with controls, age designed and publication year in CSF, and sample size of MS patients in blood, it was recognized that they were heterogeneity sources.
In addition, when MS patients were compared with healthy volunteers, as shown by meta-regression, the result was significantly associated with the sample size (Figure 8B) and gender (Figure 8C) of MS patients in CSF. However, other potential confounders including age (Figure 8A) and disease duration (Figure 8D) of MS patients did not have to moderate influences on the outcome of the meta-analysis. Therefore, meta-regression analysis revealed that sample size and gender of MS patients in CSF are confounding factors for the outcome of the meta-analysis.
Following are several limitations in this meta-analysis: first, the meta-analysis of NFL levels in patients with MS compared with controls provided us pooled results from case–control (cross-sectional) studies. Furthermore, a great amount of studies included were from Western countries, while only one study was from China and there is no relevant report about other Asian populations or African populations. Undisputedly, selective bias was unavoidable. Second, we only included 13 studies, some of which had a relatively small sample size. However, the limited number of included studies was so few that the value of funnel plots was limited. Even more, the number of studies made it difficult to make further analysis. Third, although we attempted to collect all the necessary data from the authors of studies there were still missing data, as some authors failed to respond to our queries. So we utilized a series of formulas to deduce and calculate the mean and SD from the published sample size, median, range, or interquartile range. These formulas were widely acknowledged and used in other meta-analysis.117,118 Fourth, on the basis of NOS criteria, the differences between two factors, involving gender ratio and mean age, had reduced the comparability between MS patients and controls in a majority of included studies.14 These limits highlight the need for continued investigations into the NFL levels in MS.
Conclusion
The findings of this meta-analysis have shown that there is elevated nervous system and peripheral blood concentrations of NFL in patients with MS. Therefore, NFL chain in CSF and blood sample can be used to discriminate the MS patients from healthy people. Furthermore, several studies suggest that the NFL in MS patients could predict disease activity and would decrease after treatment. There is promising evidence that NFL levels could be used as a useful prognostic biomarker to monitor disease progression, disease activity, and treatment efficacy in the future.
Author contributions
All authors contributed to data analysis, drafting and revising the article, gave final approval of the version to be published, and agree to be accountable for all aspects of the work.
Disclosure
The authors report no conflicts of interest in this work.
References
Gray E, Wilkins A. Neurofilament changes in multiple sclerosis. Vol. 3. In: Nixon RA, Yuan A, editors. Cytoskeleton of the Nervous System. New York: Springer; 2011:347–377. | ||
Compston A. Making progress on the natural history of multiple sclerosis. Brain. 2006;129(Pt 3):561–563. | ||
Bjartmar C, Kidd G, Mörk S, Rudick R, Trapp BD. Neurological disability correlates with spinal cord axonal loss and reduced N-acetyl aspartate in chronic multiple sclerosis patients. Ann Neurol. 2000;48(6):893–901. | ||
van Waesberghe JH, Kamphorst W, de Groot CJ, et al. Axonal loss in multiple sclerosis lesions: magnetic resonance imaging insights into substrates of disability. Ann Neurol. 1999;46(5):747–754. | ||
Khalil M, Salzer J. CSF neurofilament light: A universal risk biomarker in multiple sclerosis? Neurology. 2016;87(11):1068–1069. | ||
Dong DL, Xu ZS, Chevrier MR, Cotter RJ, Cleveland DW, Hart GW. Glycosylation of mammalian neurofilaments. Localization of multiple O-linked N-acetylglucosamine moieties on neurofilament polypeptides L and M. J Biol Chem. 1993;268(22):16679–16687. | ||
Gnanapavan S, Grant D, Morant S, et al. Biomarker report from the phase II lamotrigine trial in secondary progressive MS – neurofilament as a surrogate of disease progression. PLoS One. 2013;8(8):e70019. | ||
Petzold A. Neurofilament phosphoforms: surrogate markers for axonal injury, degeneration and loss. J Neurol Sci. 2005;233(1–2):183–198. | ||
Teunissen CE, Khalil M. Neurofilaments as biomarkers in multiple sclerosis. Mult Scler. 2012;18(5):552–556. | ||
Kuhle J, Plattner K, Bestwick JP, et al. A comparative study of CSF neurofilament light and heavy chain protein in MS. Mult Scler. 2013;19(12):1597–1603. | ||
Xu Z, Henderson RD, David M, Mccombe PA. Neurofilaments as biomarkers for amyotrophic lateral sclerosis: a systematic review and meta-analysis. PLoS One. 2016;11(10):e0164625. | ||
Moher D, Liberati A, Tetzlaff J, Altman DG; PRISMA Group. Preferred reporting items for systematic reviews and meta-analyses: the PRISMA statement. Int J Surg. 2010;8(5):336–341. | ||
Polman CH, Reingold SC, Banwell B, et al. Diagnostic criteria for multiple sclerosis: 2010 revisions to the McDonald criteria. Ann Neurol. 2011;69(2):292–302. | ||
Stang A. Critical evaluation of the Newcastle-Ottawa scale for the assessment of the quality of nonrandomized studies in meta-analyses. Eur J Epidemiol. 2010;25(9):603–605. | ||
Hu X, Yang Y, Gong D. Cerebrospinal fluid levels of neurofilament light chain in multiple system atrophy relative to Parkinson’s disease: a meta-analysis. Neurol Sci. 2017;38(3):407–414. | ||
Qin XY, Cao C, Cawley NX, et al. Decreased peripheral brain-derived neurotrophic factor levels in Alzheimer’s disease: a meta-analysis study (N=7277). Mol Psychiatry. 2017;22(2):312–320. | ||
Altintas A, Tumani H, Yazici S, Lehmensiek V. CSF biomarkers in tumefactive multiple sclerosis and other disease subtypes. Neurology. 2014;82(10):P4–129. | ||
Alvarez E, Piccio L, Tutlam N. Myelin basic protein and neurofilament as biomarkers of treatment response in a Phase II add-on trial of rituximab for relapsing multiple sclerosis. J Neuroimmunol. 2012;253(1–2):15. | ||
Arrambide G, Espejo C, Eixarch H. Neurofilament light subunit and evolution of clinically isolated syndrome (CIS) to multiple sclerosis. Mult Scler. 2013;19(11):132–133. | ||
Arrambide G, Espejo C, Tintore M. The only certain measure of the effectiveness of multiple sclerosis therapy is cerebrospinal neurofilament level-NO. Mult Scler. 2015;21(10):1240–1242. | ||
Evertsson B, Löfstrom V, Manouchehrinia A, Hillert J, Karrenbauer V. Novel CSF biomarkers NFL and CXCL 13, relationship with other CSF parameters and disease variables in MS. Neurology. 2017;88(16):P1–385. | ||
Fitzner B, Hecker M, Zettl UK. Molecular biomarkers in cerebrospinal fluid of multiple sclerosis patients. Autoimmun Rev. 2015;14(10):903–913. | ||
Gajofatto A, Calabrese M, Benedetti MD, Monaco S. Clinical, MRI, and CSF markers of disability progression in multiple sclerosis. Dis Markers. 2013;35(6):687–699. | ||
Gomez F, Oehninger C. Cerebrospinal fluid light neurofilaments as a therapeutic marker of response in modifying therapies disease in multiple sclerosis. J Neuroimmunol. 2014;275(1–2):19–20. | ||
Gresle MM, Butzkueven H, Shaw G. Neurofilament proteins as body fluid biomarkers of neurodegeneration in multiple sclerosis. Mult Scler Int. 2011;2011:1–7. | ||
Harris V, Tuddenham J, Sadiq S. Biomarkers of multiple sclerosis: current findings. Degener Neurol Neuromuscul Dis. 2017;7:19–29. | ||
Housley WJ, Pitt D, Hafler DA. Biomarkers in multiple sclerosis. Clin Immunol. 2015;161(1):51–58. | ||
Hutchinson M. The only certain measure of the effectiveness of multiple sclerosis therapy is cerebrospinal neurofilament level: Commentary. Mult Scler. 2015;21(10):1242–1243. | ||
Khalil M, Enzinger C, Langkammer C, et al. CSF neurofilament and N-acetylaspartate related brain changes in clinically isolated syndrome. Mult Scler. 2013;19(4):436–442. | ||
Lycke JN, Karlsson JE, Andersen O, Rosengren LE. Neurofilament protein in cerebrospinal fluid: a potential marker of activity in multiple sclerosis. J Neurol Neurosurg Psychiatry. 1998;64(3):402–404. | ||
Salzer J. The only certain measure of the effectiveness of multiple sclerosis therapy is cerebrospinal neurofilament level – YES. Mult Scler. 2015;21(10):1239–1240. | ||
Semra YK, Seidi OA, Sharief MK. Heightened intrathecal release of axonal cytoskeletal proteins in multiple sclerosis is associated with progressive disease and clinical disability. J Neuroimmunol. 2002;122(1–2):132–139. | ||
Soelberg Sorensen P, Sellebjerg F. Neurofilament in CSF-A biomarker of disease activity and long-term prognosis in multiple sclerosis. Mult Scler. 2016;22(9):1112–1113. | ||
Tortorella C, Iaffaldano P, Direnzo V, et al. Cerebrospinal fluid neurofilament light chain (NFL) but not N-acetyl aspartate (NAA) predicts the evolution to multiple sclerosis (MS) of clinically isolated syndrome suggestive of MS (CIS). Neurology. 2011;76(9):A332–A333. | ||
Gray E, Rice C, Nightingale H, et al. Accumulation of cortical hyperphosphorylated neurofilaments as a marker of neurodegeneration in multiple sclerosis. Mult Scler. 2013;19(2):153–161. | ||
Bodini B, Calabresi PA. From neurofilament research to multiple sclerosis clinical practice: Where do we stand? Neurology. 2017;88(9):816–817. | ||
Schmierer K, Tozer DJ, Petzold A. Axonal damage in the making: neurofilament phosphorylation and magnetization transfer in multiple sclerosis non-lesional white matter. Neurology. 2011;76(9):A358–A358. | ||
Eikelenboom MJ, Petzold A, Lazeron RH, et al. Multiple sclerosis: Neurofilament light chain antibodies are correlated to cerebral atrophy. Neurology. 2003;60(2):219–223. | ||
Kaymakamzade B, Tuncer Kurne A, Tumani H, Lehmensiek V, Sayat G, Karabudak R. Evaluation of neurofilament heavy chain levels in progressive multiple sclerosis patients: Preliminary results. Eur J Neurol. 2014;21:697. | ||
Kuhle J, Disanto G, Lorscheider J, et al. Fingolimod and CSF neurofilament light chain levels in relapsing-remitting multiple sclerosis. Neurology. 2015;84(16):1639–1643. | ||
Kuhle J, Nourbakhsh B, Grant D, et al. Serum neurofilament is associated with progression of brain atrophy and disability in early MS. Neurology. 2017;88(9):826–831. | ||
Mañé-Martínez MA, Olsson B, Bau L, et al. Glial and neuronal markers in cerebrospinal fluid in different types of multiple sclerosis. J Neuroimmunol. 2016;299:112–117. | ||
Modvig S, Degn M, Roed H, et al. Cerebrospinal fluid levels of chitinase 3-like 1 and neurofilament light chain predict multiple sclerosis development and disability after optic neuritis. Mult Scler. 2015;21(14):1761–1770. | ||
Petzold A. The prognostic value of CSF neurofilaments in multiple sclerosis at 15-year follow-up. J Neurol Neurosurg Psychiatry. 2015;86(12):1388–1390. | ||
Petzold A, Tozer DJ, Schmierer K. Axonal damage in the making: neurofilament phosphorylation, proton mobility and magnetisation transfer in multiple sclerosis normal appearing white matter. Exp Neurol. 2011;232(2):234–239. | ||
Salzer J, Svenningsson A, Sundström P. Neurofilament light as a prognostic marker in multiple sclerosis. Mult Scler. 2010;16(3):287–292. | ||
Kuhle J, Plavina T, Barro C, et al. Serum and CSF neurofilament light levels predict long-term outcomes in multiple sclerosis patients. Neurology. 2017;88(16):S50-005. | ||
Kuhle J, Malmeström C, Axelsson M, et al. Neurofilament light and heavy subunits compared as therapeutic biomarkers in multiple sclerosis. Acta Neurol Scand. 2013;128(6):e33–e36. | ||
Arrambide G, Espejo C, Eixarch H, et al. Neurofilament light chain level is a weak risk factor for the development of MS. Neurology. 2016;87(11):1076–1084. | ||
Burman J, Zetterberg H, Fransson M, Loskog AS, Raininko R, Fagius J. Assessing tissue damage in multiple sclerosis: a biomarker approach. Acta Neurol Scand. 2014;130(2):81–89. | ||
Fialová L, Bartos A, Svarcová J, Zimova D, Kotoucova J, Malbohan I. Serum and cerebrospinal fluid light neurofilaments and antibodies against them in clinically isolated syndrome and multiple sclerosis. J Neuroimmunol. 2013;262(1–2):113–120. | ||
Martínez MA, Olsson B, Bau L, et al. Glial and neuronal markers in cerebrospinal fluid predict progression in multiple sclerosis. Mult Scler. 2015;21(5):550–561. | ||
Petzold A, Eikelenboom MJ, Keir G, et al. Axonal damage accumulates in the progressive phase of multiple sclerosis: three year follow up study. J Neurol Neurosurg Psychiatry. 2005;76(2):206–211. | ||
Piehl F, Kockum I, Khademi M, et al. Plasma neurofilament light chain levels in patients with MS switching from injectable therapies to fingolimod. Mult Scler. 2018;24(8):1046–1054. | ||
Tortorella C, Direnzo V, Ruggieri M. Cerebrospinal fluid neurofilament light levels mark grey matter volume in clinically isolated syndrome suggestive of multiple sclerosis. Mult Scler. 2017;24(8):1039–1045. | ||
Trentini A, Comabella M, Tintoré M, et al. N-acetylaspartate and neurofilaments as biomarkers of axonal damage in patients with progressive forms of multiple sclerosis. J Neurol. 2014;261(12):2338–2343. | ||
Bartos A, Labaj J, Kotoucova J, Zimova D, Bucilova V, Dolezil D. Detection of elevated concentrations of light neurofilament subunits in CSF of patients with multiple sclerosis. Mult Scler. 2010;16(10):S346. | ||
Villar L, Picón C, Costa-Frossard L, et al. CSF immunological biomarkers associated with neurodegeneration in multiple sclerosis. Mult Scler. 2013;19(11):538–539. | ||
Miyazawa I, Fujihara K, Nakashima I, Petzold A, Sato S, Itoyama Y. High CSF-neurofilament heavy chain levels in neuromyelitis optica: distinction from multiple sclerosis. Mult Scler. 2006;12:S226–S226. | ||
Madeddu R, Farace C, Tolu P, et al. Cytoskeletal proteins in the cerebrospinal fluid as biomarker of multiple sclerosis. Neurol Sci. 2013;34(2):181–186. | ||
Norgren N, Sundström P, Svenningsson A, Rosengren L, Stigbrand T, Gunnarsson M. Neurofilament and glial fibrillary acidic protein in multiple sclerosis. Neurology. 2004;63(9):1586–1590. | ||
Villar LM, Picón C, Costa-Frossard L, et al. Cerebrospinal fluid immunological biomarkers associated with axonal damage in multiple sclerosis. Eur J Neurol. 2015;22(8):1169–1175. | ||
Teunissen CE, Iacobaeus E, Khademi M, et al. Combination of CSF N-acetylaspartate and neurofilaments in multiple sclerosis. Neurology. 2009;72(15):1322–1329. | ||
Kuhle J, Leppert D, Petzold A, et al. Neurofilament heavy chain in CSF correlates with relapses and disability in multiple sclerosis. Neurology. 2011;76(14):1206–1213. | ||
Brettschneider J, Petzold A, Junker A, Tumani H. Axonal damage markers in the cerebrospinal fluid of patients with clinically isolated syndrome improve predicting conversion to definite multiple sclerosis. Mult Scler. 2006;12(2):143–148. | ||
Iwanowski P, Losy J. Neurofilament light, anti-ganglioside M3 antibody and interleukin 18 in relapsing-remitting and primary progressive multiple sclerosis. Mult Scler J. 2016;22:879–879. | ||
Kuhle J, Stites T, Chen Y, et al. CSF neurofilament light chain levels are markedly reduced by fingolimod in relapsing multiple sclerosis. Mult Scler J. 2013;19(11):559–560. | ||
Novakova L, Zetterberg H, Axelsson M, et al. Neurofilament light in serum for monitoring multiple sclerosis: A new quantitative tool for measuring disease activity and therapeutic response. Eur J Neurol. 2017;24:577. | ||
Tortorella C, Romano R, Direnzo V, et al. CSF neurofilament as a potential surrogate marker of early and subclinical cognitive impairment in clinically isolated syndromes suggestive of multiple sclerosis. Mult Scler J. 2013;19(11):295–296. | ||
Barro C, Derfuss T, Nägelin Y, et al. High sensitivity serum neurofilament-light chain measurements correlate with disease activity and disability in multiple sclerosis and are reduced after immunomodulatory treatment intervention. Mult Scler. 2016;22:843–844. | ||
Piehl F, Kockum I, Khademi M, et al. High sensitivity measurement of neurofilament-light levels in plasma demonstrates a significant reduction in multiple sclerosis patients starting fingolimod. Mult Scler J. 2016;22:672. | ||
Annunziata P, Cioni C, de Santi L, et al. Heavy neurofilament phosphoforms in relapsing-remitting multiple sclerosis: correlation with MRI measures and clinical disability. J Neurol. 2006;253:26. | ||
Arrambide G, Espejo C, Eixarch H, et al. Neurofilament light and fetuin-A in clinically isolated syndrome patients as predictors for conversion to multiple sclerosis. Mult Scler. 2010;16(10):S25–S26. | ||
Brandt AU, Paul F, Freing A, Oberwahrenbrock T, Petzold A. Serum neurofilament in patients with relapsing-remitting multiple sclerosis. Mult Scler J. 2011;17:S269–S270. | ||
Cechova L, Bartos A, Ricny J, et al. Increased neurofilament concentrations in cerebrospinal fluid in multiple sclerosis. Eur J Neurol. 2010;17:229. | ||
Disanto G, Barro C, Giardiello A, Gobbi C, Zecca C, Kuhle J. Serum neurofilament light chain levels in MS: A promising biomarker of clinical and subclinical disease severity. Mult Scler. 2016;22:845. | ||
Gnanapavan S, Giovannoni G, Minagar A, Jaffe S. Interferon beta-1a treatment in patients with relapsing-remitting multiple sclerosis elevates immunomodulatory marker soluble HLA-I but has no effect on the axonal marker, neurofilament, or disability. Mult Scler. 2010;16(10):S141–S142. | ||
Gresle M, Shaw G, Liu Y, et al. Validation of phosphorylated neurofilament-H as a serum biomarker of neurodegeneration in multiple sclerosis patients. Mult Scler. 2010;16(10):S346. | ||
Khalil M, Enzinger C, Langkammer C, et al. CSF neurofilaments and N-acetylaspartate in relation to MRI-metrics at 3T in clinically isolated syndromes suggestive of multiple sclerosis. Mult Scler. 2011;17(10):S266–S267. | ||
Koel-Simmelink MJ, Elk EJ, Norgren N, Dijkstra C, Teunissen C. Development of a multiplex assay for simultaneous measurement of neurofilament subunits in cerebrospinal fluid of patients with multiple sclerosis. Mult Scler. 2008;14:S277. | ||
Kuhle J, Barro C, Brachat AH, et al. Blood neurofilament light chain levels are elevated in multiple sclerosis and correlate with disease activity. Mult Scler J. 2016;22:828. | ||
Kuhle J, Barro C, Kappos L, et al. Fingolimod significantly lowers neurofilament light chain blood levels in relapsing-remitting multiple sclerosis patients as compared with interferon beta-1a or placebo. Eur J Neurol. 2017;24:61. | ||
Kuhle J, Leppert D, Petzold A, et al. Neurofilament heavy chain in CSF correlates with relapse activity and clinical disability in multiple sclerosis. Mult Scler. 2010;16(10):S343. | ||
Kuhle J, Petzold A, Regeniter A, Mehling M, Lindberg R, Kappos L. Highly sensitive electrochemiluminescence-based immunoassay to determine the neurofilament heavy chain as a marker of axonal damage in multiple sclerosis. Mult Scler. 2009;15(9):S201–S202. | ||
Lim ET, Sellebjerg F, Altmann D, et al. Cerebrospinal fluid neurofilament heavy chain levels in acute optic neuritis and multiple sclerosis patients treated with oral high-dose methylprednisolone. Neurology. 2004;62(7):A382. | ||
Lim ET, Sellebjerg F, Sorensen TL, et al. Cerebrospinal fluid neurofilament heavy chain levels in acute optic neuritis and multiple sclerosis patients treated with oral high-dose methylpredinolone. J Neurol Neurosurg Psychiatry. 2004;75(8):1215. | ||
Novakova L, Axelsson M, Khademi M, et al. Relationships between CSF biomarkers of inflammation and degeneration in RRMS are also found in healthy controls. Mult Scler. 2015;23(11):353–354. | ||
Petzold A, Maggiore C, Plant G. Serum neurofilament levels suggest axonal damage is more extensive in neuromyelitis optica than in neuromyelitis optica or multiple sclerosis optic neuritis. Mult Scler. 2008;14:S285. | ||
Tortorella C, Iaffaldano P, Direnzo V, et al. Role of cerebrospinal fluid neurofilament light chain and N-Acetyl Aspartate in predicting the evolution to multiple sclerosis of clinically isolated syndrome suggestive of multiple sclerosis. Mult Scler. 2010;16(10):S193. | ||
Tortorella C, Romano R, Ruggieri M, et al. Cognitive impairment is related to cerebrospinal fluid neurofilament levels in clinically isolated syndrome suggestive of multiple sclerosis. A Functional MRI Study (P04.104). Neurology. 2012;78(Meeting Abstracts 1):P04.104. | ||
van der Star B, Wouter G, Kristel A, Tesev D, Ruth H, van der Valk P. Neurofilament light as a target for autoimmunity in multiple sclerosis. J Neuroimmunol. 2010;228(1–2):195. | ||
Vorobyeva A, Fominykh V, Zakharova M, Gulyaeva N. Biochemical markers of neurodegeneration in multiple sclerosis. Mult Scler. 2013;19(11):369. | ||
Bhan A, Jacobsen C, Myhr KM, Nyland H, Lode K, Farbu E. Neurofilament light chain and disease progression in MS. Mult Scler. 2016;22:272. | ||
Fialová L, Bartos A, Švarcová J, Zimova D, Kotoucova J. Serum and cerebrospinal fluid heavy neurofilaments and antibodies against them in early multiple sclerosis. J Neuroimmunol. 2013;259(1–2):81–87. | ||
Petzold A, Brassat D, Mas P, et al. Treatment response in relation to inflammatory and axonal surrogate marker in multiple sclerosis. Mult Scler. 2004;10(3):281–283. | ||
Novakova L, Zetterberg H, Sundström P, et al. Monitoring disease activity in multiple sclerosis using serum neurofilament light protein. Neurology. 2017;89(22):2230–2237. | ||
Disanto G, Barro C, Benkert P, et al. Serum neurofilament light: A biomarker of neuronal damage in multiple sclerosis. Ann Neurol. 2017;81(6):857–870. | ||
Haghighi S, Andersen O, Odén A, Rosengren L. Cerebrospinal fluid markers in MS patients and their healthy siblings. Acta Neurol Scand. 2004;109(2):97–99. | ||
Norgren N, Rosengren L, Stigbrand T. Elevated neurofilament levels in neurological diseases. Brain Res. 2003;987(1):25–31. | ||
Rosengren LE, Karlsson JE, Karlsson JO, Persson LI, Wikkelsø C. Patients with amyotrophic lateral sclerosis and other neurodegenerative diseases have increased levels of neurofilament protein in CSF. J Neurochem. 1996;67(5):2013–2018. | ||
Novakova L, Axelsson M, Khademi M, et al. Cerebrospinal fluid biomarkers as a measure of disease activity and treatment efficacy in relapsing-remitting multiple sclerosis. J Neurochem. 2017;141(2):296–304. | ||
Novakova L, Axelsson M, Khademi M, et al. Cerebrospinal fluid biomarkers of inflammation and degeneration as measures of fingolimod efficacy in multiple sclerosis. Mult Scler J. 2017;23(1):62–71. | ||
Håkansson I, Tisell A, Cassel P, et al. Neurofilament light chain in cerebrospinal fluid and prediction of disease activity in clinically isolated syndrome and relapsing-remitting multiple sclerosis. Eur J Neurol. 2017;24(5):703–712. | ||
Novakova L, Axelsson M, Malmeström C, et al. Reduced cerebrospinal fluid concentrations of oxysterols in response to natalizumab treatment of relapsing remitting multiple sclerosis. J Neurol Sci. 2015;358(1–2):201–206. | ||
Zhang Y, Li X, Qiao J. Neurofilament protein light in multiple sclerosis. Zhonghua Yi Xue Za Zhi. 2007;87(39):2745–2749. | ||
Malmeström C, Haghighi S, Rosengren L, Andersen O, Lycke J. Neurofilament light protein and glial fibrillary acidic protein as biological markers in MS. Neurology. 2003;61(12):1720–1725. | ||
Kuhle J, Barro C, Disanto G, et al. Serum neurofilament light chain in early relapsing remitting MS is increased and correlates with CSF levels and with MRI measures of disease severity. Mult Scler. 2016;22(12):1550–1559. | ||
Disanto G, Adiutori R, Dobson R, et al. Serum neurofilament light chain levels are increased in patients with a clinically isolated syndrome. J Neurol Neurosurg Psychiatry. 2016;87(2):126–129. | ||
Kuhlmann T, Lingfeld G, Bitsch A, Schuchardt J, Brück W. Acute axonal damage in multiple sclerosis is most extensive in early disease stages and decreases over time. Brain. 2002;125(Pt 10):2202–2212. | ||
Trapp BD, Bo L, Mörk S, Chang A. Pathogenesis of tissue injury in MS lesions. J Neuroimmunol. 1999;98(1):49–56. | ||
Silber E, Sharief MK. Axonal degeneration in the pathogenesis of multiple sclerosis. J Neurol Sci. 1999;170(1):11–18. | ||
Axelsson M, Malmeström C, Gunnarsson M, et al. Immunosuppressive therapy reduces axonal damage in progressive multiple sclerosis. Mult Scler. 2014;20(1):43–50. | ||
Olsson B, Malmeström C, Basun H, et al. Extreme stability of chitotriosidase in cerebrospinal fluid makes it a suitable marker for microglial activation in clinical trials. J Alzheimers Dis. 2012;32(2):273–276. | ||
Gunnarsson M, Malmeström C, Axelsson M, et al. Axonal damage in relapsing multiple sclerosis is markedly reduced by natalizumab. Ann Neurol. 2011;69(1):83–89. | ||
Conductier G, Blondeau N, Guyon A, Nahon JL, Rovère C. The role of monocyte chemoattractant protein MCP1/CCL2 in neuroinflammatory diseases. J Neuroimmunol. 2010;224(1–2):93–100. | ||
Comabella M, Fernández M, Martin R, et al. Cerebrospinal fluid chitinase 3-like 1 levels are associated with conversion to multiple sclerosis. Brain. 2010;133(Pt 4):1082–1093. | ||
Rysz-Górzynska M, Gluba-Brzózka A, Sahebkar A, et al. Efficacy of statin therapy in pulmonary arterial hypertension: a systematic review and meta-analysis. Sci Rep. 2016;6:30060. | ||
Su Z, Zhu L, Wu J, Zhao R, Ji HL, Hl J. Systematic review and meta-analysis of nasal potential difference in hypoxia-induced lung injury. Sci Rep. 2016;6:30780. |
Supplementary materials
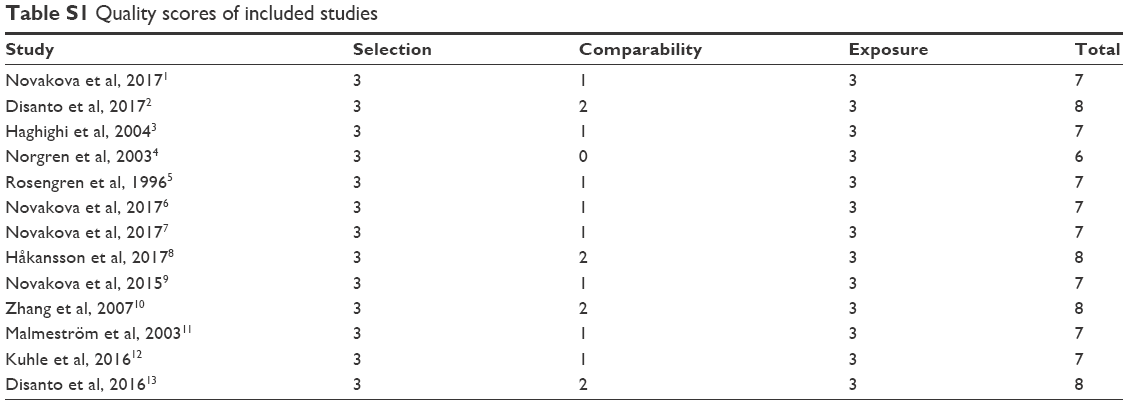 | Table S1 Quality scores of included studies |
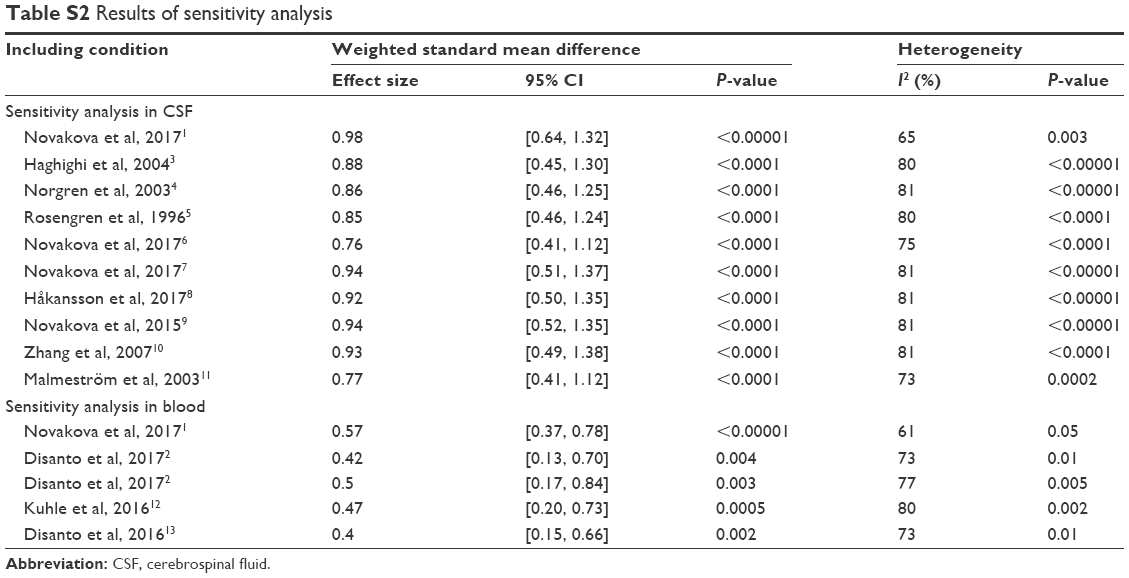 | Table S2 Results of sensitivity analysis |
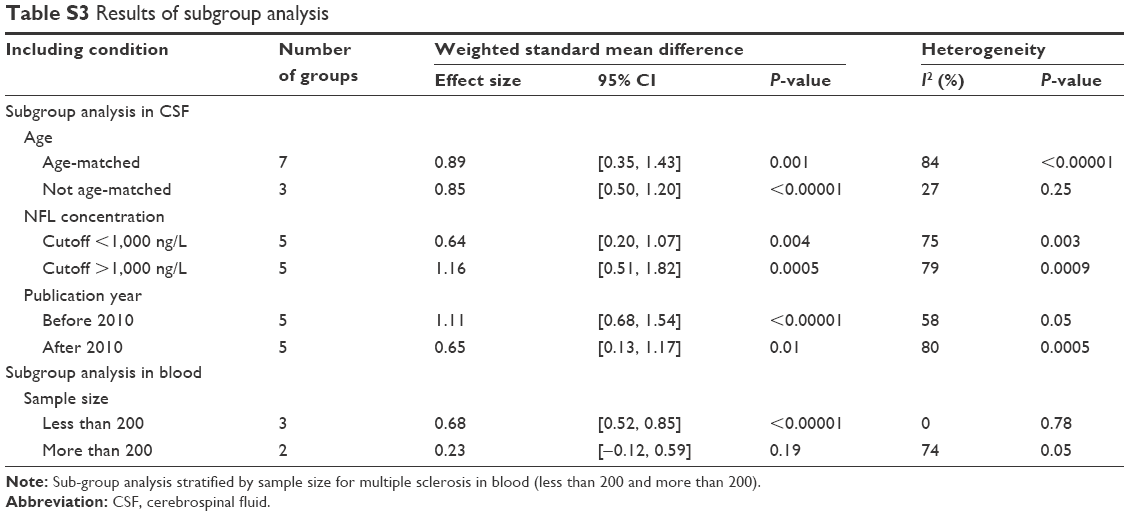 | Table S3 Results of subgroup analysis |
References
Novakova L, Zetterberg H, Sundström P, et al. Monitoring disease activity in multiple sclerosis using serum neurofilament light protein. Neurology. 2017;89(22):2230–2237. | ||
Disanto G, Barro C, Benkert P, et al. Serum neurofilament light: A biomarker of neuronal damage in multiple sclerosis. Ann Neurol. 2017;81(6):857–870. | ||
Haghighi S, Andersen O, Odén A, Rosengren L. Cerebrospinal fluid markers in MS patients and their healthy siblings. Acta Neurol Scand. 2004;109(2):97–99. | ||
Norgren N, Rosengren L, Stigbrand T. Elevated neurofilament levels in neurological diseases. Brain Res. 2003;987(1):25–31. | ||
Rosengren LE, Karlsson JE, Karlsson JO, Persson LI, Wikkelsø C. Patients with amyotrophic lateral sclerosis and other neurodegenerative diseases have increased levels of neurofilament protein in CSF. J Neurochem. 1996;67(5):2013–2018. | ||
Novakova L, Axelsson M, Khademi M, et al. Cerebrospinal fluid biomarkers as a measure of disease activity and treatment efficacy in relapsing-remitting multiple sclerosis. J Neurochem. 2017;141(2):296–304. | ||
Novakova L, Axelsson M, Khademi M, et al. Cerebrospinal fluid biomarkers of inflammation and degeneration as measures of fingolimod efficacy in multiple sclerosis. Mult Scler J. 2017;23(1):62–71. | ||
Håkansson I, Tisell A, Cassel P, et al. Neurofilament light chain in cerebrospinal fluid and prediction of disease activity in clinically isolated syndrome and relapsing-remitting multiple sclerosis. Eur J Neurol. 2017;24(5):703–712. | ||
Novakova L, Axelsson M, Malmeström C, et al. Reduced cerebrospinal fluid concentrations of oxysterols in response to natalizumab treatment of relapsing remitting multiple sclerosis. J Neurol Sci. 2015;358(1–2):201–206. | ||
Zhang Y, Li X, Qiao J. Neurofilament protein light in multiple sclerosis. Zhonghua Yi Xue Za Zhi. 2007;87(39):2745–2749. | ||
Malmeström C, Haghighi S, Rosengren L, Andersen O, Lycke J. Neurofilament light protein and glial fibrillary acidic protein as biological markers in MS. Neurology. 2003;61(12):1720–1725. | ||
Kuhle J, Barro C, Disanto G, et al. Serum neurofilament light chain in early relapsing remitting MS is increased and correlates with CSF levels and with MRI measures of disease severity. Mult Scler. 2016;22(12):1550–1559. | ||
Disanto G, Adiutori R, Dobson R, et al. Serum neurofilament light chain levels are increased in patients with a clinically isolated syndrome. J Neurol Neurosurg Psychiatry. 2016;87(2):126–129. |
 © 2018 The Author(s). This work is published and licensed by Dove Medical Press Limited. The
full terms of this license are available at https://www.dovepress.com/terms
and incorporate the Creative Commons Attribution
- Non Commercial (unported, 3.0) License.
By accessing the work you hereby accept the Terms. Non-commercial uses of the work are permitted
without any further permission from Dove Medical Press Limited, provided the work is properly
attributed. For permission for commercial use of this work, please see paragraphs 4.2 and 5 of our Terms.
© 2018 The Author(s). This work is published and licensed by Dove Medical Press Limited. The
full terms of this license are available at https://www.dovepress.com/terms
and incorporate the Creative Commons Attribution
- Non Commercial (unported, 3.0) License.
By accessing the work you hereby accept the Terms. Non-commercial uses of the work are permitted
without any further permission from Dove Medical Press Limited, provided the work is properly
attributed. For permission for commercial use of this work, please see paragraphs 4.2 and 5 of our Terms.