Back to Journals » OncoTargets and Therapy » Volume 9
Network analysis reveals potential markers for pediatric adrenocortical carcinoma
Authors Kulshrestha A, Suman S, Ranjan R
Received 14 March 2016
Accepted for publication 10 June 2016
Published 26 July 2016 Volume 2016:9 Pages 4569—4581
DOI https://doi.org/10.2147/OTT.S108485
Checked for plagiarism Yes
Review by Single anonymous peer review
Peer reviewer comments 3
Editor who approved publication: Dr William C. Cho
Anurag Kulshrestha,1 Shikha Suman,2 Rakesh Ranjan1
1Bioinformatics Division, National Bureau of Animal Genetic Resources, Karnal, 2Division of Applied Sciences, Indian Institute of Information Technology, Allahabad, India
Abstract: Pediatric adrenocortical carcinoma (ACC) is a rare malignancy with a poor outcome. Molecular mechanisms of pediatric ACC oncogenesis and advancement are not well understood. Accurate and timely diagnosis of the disease requires identification of new markers for pediatric ACC. Differentially expressed genes (DEGs) were identified from the gene expression profile of pediatric ACC and obtained from Gene Expression Omnibus. Gene Ontology functional and pathway enrichment analysis was implemented to recognize the functions of DEGs. A protein–protein interaction (PPI) and gene–gene functional interaction (GGI) network of DEGs was constructed. Hub gene detection and enrichment analysis of functional modules were performed. Furthermore, a gene regulatory network incorporating DEGs–microRNAs–transcription factors was constructed and analyzed. A total of 431 DEGs including 228 upregulated and 203 downregulated DEGs were screened. These genes were largely involved in cell cycle, steroid biosynthesis, and p53 signaling pathways. Upregulated genes, CDK1, CCNB1, CDC20, and BUB1B, were identified as the common hubs of PPI and GGI networks. All the four common hub genes were also part of modules of the PPI network. Moreover, all the four genes were also present in the largest module of GGI network. A gene regulatory network consisting of 82 microRNAs and 100 transcription factors was also constructed. CDK1, CCNB1, CDC20, and BUB1B may serve as potential biomarker of pediatric ACC and as potential targets for therapeutic approach, although experimental studies are required to authenticate our findings.
Keywords: gene expression profiling, protein–protein interaction network, network module, gene–gene functional interaction network
Introduction
Adrenocortical tumor (ACT) is an aberrant and highly aggressive malignancy originating from the adrenal cortex. It is accountable for ~0.2% of all childhood cancers. The majority of pediatric ACTs are functional as compared to adult ACTs, which are mostly nonfunctional.1 Girls are more frequently affected with pediatric adrenocortical carcinoma (ACC) than boys.2 Increased production of androgens, aldosterone, corticosteroids, and estrogen with ~80% showing virilization are the symptoms associated with pediatric ACC.3 Like most pediatric embryonal tumors, a good result demands early detection and complete surgical resection.4 Traditional chemotherapeutic agents have shown little value in treating children with ACC. Long-term problems associated with mitotane plus EDP (etoposide, doxorubicin, and cisplatin) treatment are a troublesome issue for children with ACC. Moreover, leukemogenesis may develop on treatment with topoisomerase inhibitors such as etoposide and doxorubicin.3 Surgery and exhaustive chemotherapy have shown poor outcomes in children with locally advanced or metastasis disease.4
Pediatric ACC is commonly reported in families with Li–Fraumeni syndrome, which are generally related with TP53 tumor-suppressor germ line mutations5 or inherent genetic and/or epigenetic changes affecting chromosome 11p15 (Beckwith–Wiedemann syndrome).6 Although the elements advancing to occasional pediatric ACCs are not established, their similarity to cases with an inherent susceptibility indicates a common method of tumorigenesis. Size of the tumor and verification of the tumor after surgery form the basis of staging of pediatric ACC.7 Early-stage tumor tissue can be accessed through the distinguishable clinical symptoms of ACC such as Cushing syndrome and virilization. Embryonal tumors share the epidemiological and molecular characteristics with ACC.4
Molecular studies differentiating pediatric ACC from age-matched normal adrenals have been established from gene expression profiling. Rarity of this tumor has been a problem in identifying the potential markers. Increased levels of insulin-like growth factor 2 (IGF-2) are found in 90% of pediatric ACC due to genetic or epigenetic changes in chromosome 11p15.8 KCNQ1 (potassium channel, voltage gated KQT-like subfamily Q, member 1) and CDKN1C (cyclin-dependent kinase inhibitor 1C) are among the most strongly downregulated genes in pediatric ACC. Genes associated with mitogen-activated kinase and growth factor receptor pathways are impaired in pediatric ACC, indicating their plausible utility as therapeutic targets. HSD3B2, a steroidogenic enzyme, and its transcriptional regulators NR4A1 (nuclear receptor subfamily 4, group A, member 1) and NR4A2 (nuclear receptor subfamily 4, group A, member 2) are downregulated in pediatric ACC.2 Another highly downregulated gene in pediatric ACC is NOV (nephroblastoma overexpressed), which encodes a multimodular protein that has proapoptotic function on adrenocortical cancer cells.9 MicroRNA (miRNA) expression profiling of pediatric ACC revealed downregulation of miR-99a and miR-100, which in turn downregulates the expression of insulin-like growth factor 1 receptor (IGF-1R), mechanistic target of rapamycin (mTOR), and regulatory associated protein of MTOR, complex 1 (RPTOR) in adrenocortical cell lines.10
A listing of differentially expressed genes (DEGs) is provided through gene expression analysis. Protein–protein interactions (PPIs) utilize known relationships among the protein molecules. Analyzing the PPI network recounts the importance of these interactions in relation to signal transduction and biochemistry. In a particular biological context, all proteins interact with other proteins to perform particular functions.11 Substantial amount of attention has been given to coherent analysis of microarray gene expression data with PPI networks in recent years.12,13 Potential biomarker identification, elucidation of protein function and protein interaction, functional module identification, and drug target identification are some of the applications of analyzing PPI networks.14,15
This study focuses on analyzing the gene expression profile of children with ACC, based on the understanding of interaction networks utilizing a system biology approach. To obtain more knowledge from gene expression profiles, analysis should transcend identification of the affected genes leading to the proteins underlying the inflated biological phenotypes.
Materials and methods
A bioinformatics approach with myriad of computational tools, software, and databases was utilized for shedding light on the underlying mechanisms of pediatric ACC. The entire workflow representing the procedure employed for the study is shown in Figure 1.
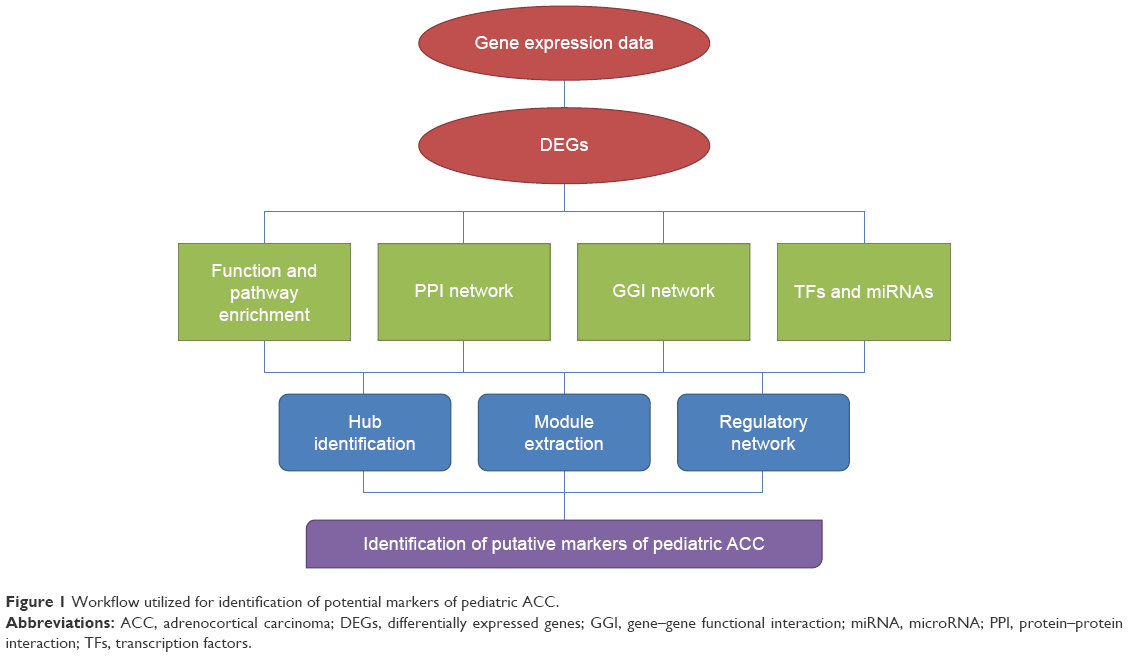 | Figure 1 Workflow utilized for identification of potential markers of pediatric ACC. |
Raw biological data
The raw DNA microarray data were obtained from Gene Expression Omnibus (http://www.ncbi.nlm.nih.gov/geo) for healthy children and children suffering from ACC. The chip dataset GSE7541516 included samples from healthy children, children with adenomas, and children with ACC. Eighteen ACC and seven normal adrenal samples were extracted from the dataset. Studying the gene expression enables to identify potential biomarkers for early detection of ACC. Gene expression profiling was performed using Affymetrix Human Genome U133A chips. (Affymetrix, Inc., Santa Clara, CA, USA)
Data preprocessing and normalization
DNA microarray analysis begins with preprocessing and normalization of raw biological data. This process removes noise from the biological data and ensures its integrity. Background correction of probe data, normalization, and summarization were executed by robust multi-array average analysis algorithm17 in affy package of R.18 Raw intensity and normalized intensity box plot were also generated for the analysis.
Elucidation of DEGs
Normalization of data was followed by analysis of differential expression by Linear Models for MicroArray data package of R.19 Delineating parameters such as adjusted P-value, false discovery rate (FDR), and fold change were utilized for filtering of DEGs between healthy and diseased states. To reduce error from multiple hypothesis testing,20 Benjamini–Hochberg method21 was employed to obtain adjusted P-values. Genes were further screened on account of adjusted P-value <0.05 and fold change >2.
Functional enrichment of DEGs
Discerning the implication of DEGs in ACC, biological attributes of DEGs such as biological processes, molecular functions, and cellular components were extracted from Gene Ontology (GO)22 enrichment analysis. Database for Annotation, Visualization, and Integrated Discovery,23 WEB-based Gene SeT AnaLysis Toolkit (WebGestalt),24 and Funrich tools25 were surveyed for GO and pathway enrichment of DEGs. Hypergeometric test was utilized to assess the functional enrichment against predefined functional categories through large genomic, proteomic, and genetic datasets with P-value <0.05 and gene count >2.
PPI network construction
The recent version of STRING v1026 database was employed for construction of PPI network of proteins encoded by DEGs. STRING is a database of known and predicted PPIs. The interactions include direct (physical) and indirect (functional) associations. The interactions are procured from genomic context, high-throughput experiments, coexpression, and previous knowledge. Three PPI networks were constructed by mapping upregulated DEGs, downregulated DEGs, and total DEGs, respectively, to STRING database with confidence score >0.4. PPI networks were visualized and analyzed in Cytoscape27 software, which furnishes diverse plugins for multiple analyses. Cytoscape represents PPI networks as graphs with nodes illustrating proteins and edges depicting associated interactions. Hub protein nodes of the PPI network with connectivity degree >10 were identified.
Network topology analysis
Network Analyzer28 was employed to analyze the topological parameters of networks. Architecture of complex networks was examined with topological parameters such as clustering coefficient, centralization, density, and network diameter. Undirected edges were considered for all the networks. The number of directly connected neighbors of a node in a network was termed as degree of a node. Node degree distribution P(k) is termed as the number of nodes with a degree k for k=0, 1, 2, …. Power law of distribution of node degrees, one of the most crucial network topological characteristics, was analyzed. A line can be fitted on the node degree distribution data to visualize the pattern of their dependencies. Network Analyzer uses the least squares method and only the points with positive coordinate values are considered for fit. R-squared value (R2), also known as the coefficient of determination, gives the proportion of variability in the dataset. When R2 value is close to 1, the fit is considered to be good. Also, other network parameters were analyzed.
Module identification and enrichment analysis
Module identification is imperative as two interacting proteins have a higher probability of sharing the same function than two proteins not interacting. Molecular Complex Detection (MCODE)29 was used to find local dense subnetworks or modular clusters through vertex weighing by local neighborhood density and outward traversal from a locally dense protein node to isolate dense regions in PPI network. Module identification criteria included degree cutoff of 2, node score cutoff of 0.2, k-core of 2, and maximum depth of 100. Significant modules were identified with MCODE score ≥4 and nodes ≥6. Biological significance of these predicted modules was inferred by BiNGO30 plugin of Cytoscape. GO enrichment was performed with P-value <0.05 based upon hypergeometric test and corrected by Benjamini and Hochberg FDR. GO Slim is utilized by BiNGO for functional annotation.
Construction of gene–gene functional interaction network
Gene–gene interaction network incorporating up- and downregulated DEGs was constructed for identifying the functional interactions between DEGs. DEGs’ list was furnished to GeneMANIA31 that incorporates large functional association data such as coexpression data, colocalization data, physical interactions, shared protein domains, pathway, and genetic interactions. Twenty additional genes were added to the interaction network based on GO term (biological process)-based weighting and Homo sapiens as the species to identify genes that may have been missed during the screening process. Hub genes were identified with connectivity degree >10. MCODE was employed for identification of modules in the gene–gene functional interaction (GGI) network. BiNGO and Gene Set Enrichment Analysis32 were utilized to identify the GO terms and pathways associated with modules with FDR q-value below 0.05.
Construction of transcription factor–miRNA regulatory network
Genes must interact with and respond to an organism’s environment, as they independently cannot control the organism by themselves. Transcription factors (TFs) and miRNA regulate the gene expression at transcriptional and posttranscriptional levels. Information pertinent to TFs, miRNAs, and their respective target genes may help to better understand the intrinsic processes of pediatric ACC. Molecular Signatures Database v5.1 (MSigDB)32 was explored for the identification of TFs and miRNAs associated with DEGs with FDR q-value below 0.05. MSigDB incorporates annotated gene sets derived from a large variety of resources. A gene regulatory network incorporating DEGs, TFs, and miRNAs was constructed in Cytoscape.
Results
The comprehensive study focused on identifying and analyzing the genes, proteins, and probable patterns that are expressed in children with ACC, as compared to normal children. The ACC dataset was exposed to preprocessing and normalization in order to remove noise by robust multiaverage analysis algorithm (Figure 2).
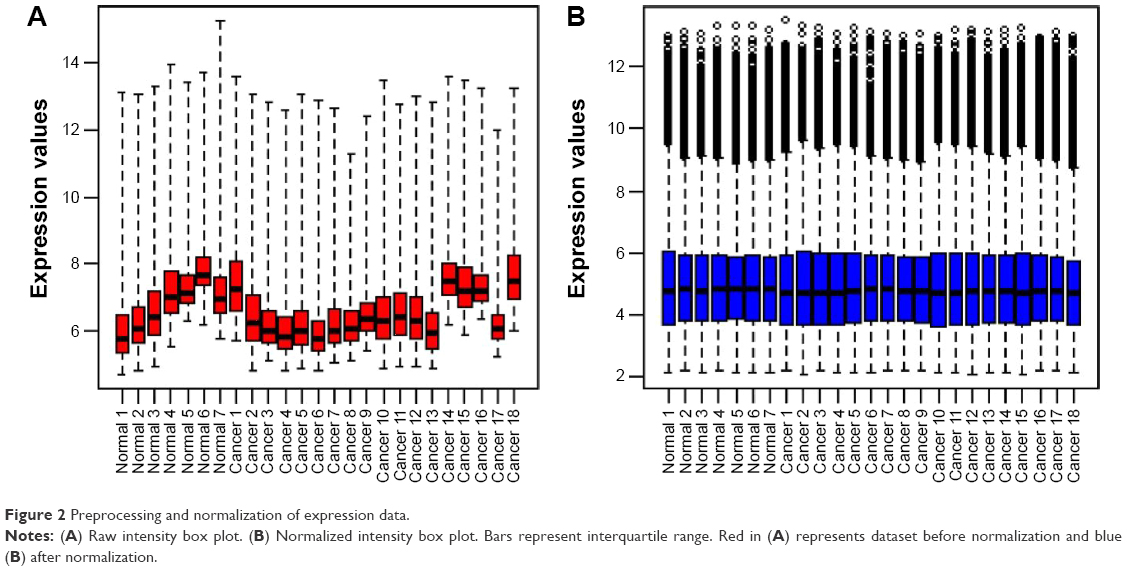 | Figure 2 Preprocessing and normalization of expression data. |
Identification of DEGs
The normalized data were subjected to analysis to reveal genes with altered expression profiles between healthy and diseased datasets. A total of 431 DEGs were obtained through a threshold of adjusted P-value <0.05 and a fold change >2. Among the total DEGs, 228 were upregulated and 203 were downregulated genes.
Functional enrichment of DEGs
Biological significance of DEGs was established by enriching the GO functions such as biological processes, cellular components, and molecular functions. Among the total DEGs, both upregulated and downregulated DEGs were largely involved in metabolic process and protein binding. Most of the upregulated DEGs were present on the nucleus, while the downregulated DEGs existed on the membrane (Figure 3).
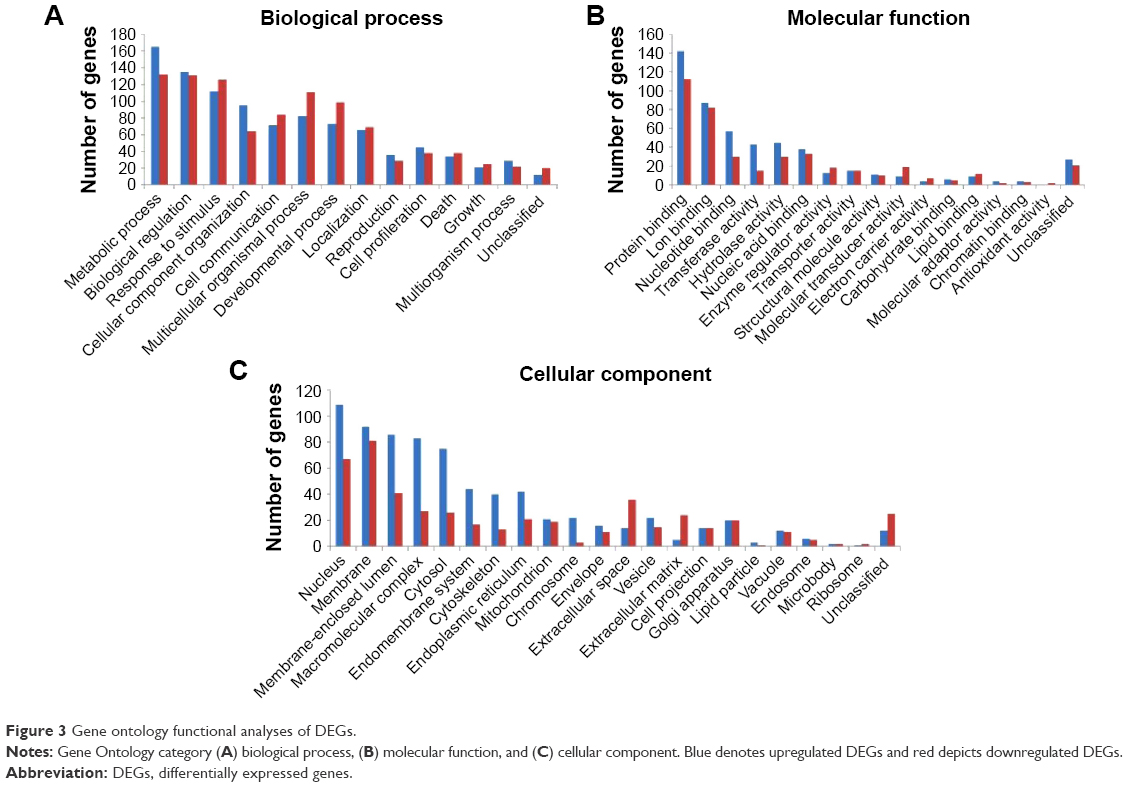 | Figure 3 Gene ontology functional analyses of DEGs. |
Kyoto Encyclopedia of Genes and Genomes (KEGG) pathway enrichment analysis revealed that the upregulated DEGs were mostly enriched in cell cycle, steroid biosynthesis, and p53 signaling pathway, while the downregulated DEGs were mainly involved in complement and coagulation cascades (Table 1). Funrich enrichment analysis of the biological pathways associated with DEGs is shown in Figure 4.
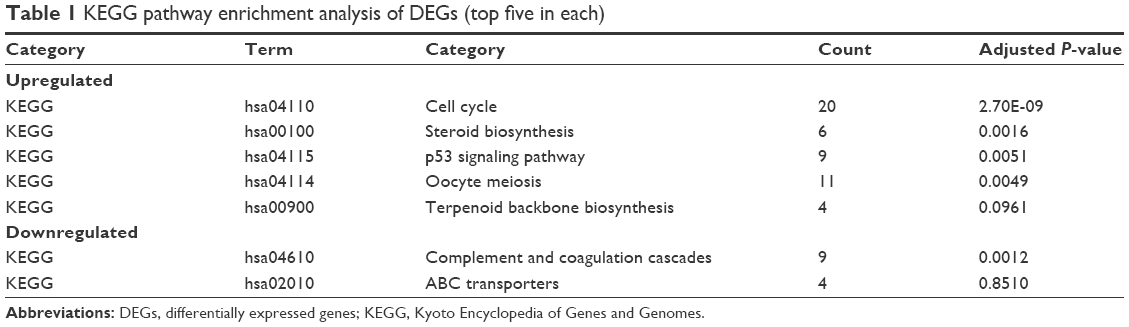 | Table 1 KEGG pathway enrichment analysis of DEGs (top five in each) |
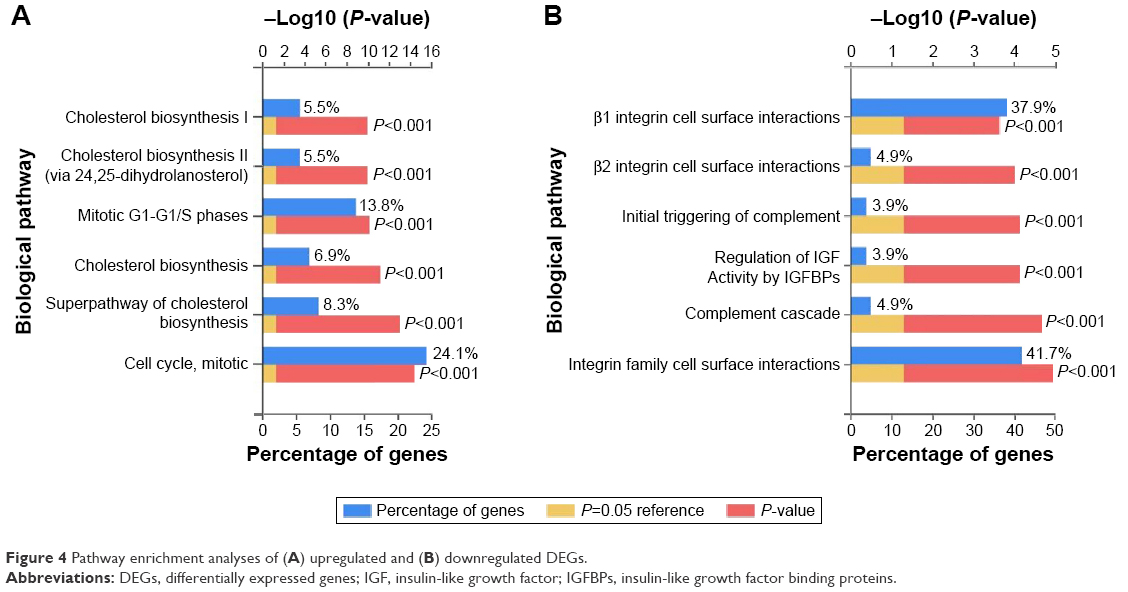 | Figure 4 Pathway enrichment analyses of (A) upregulated and (B) downregulated DEGs. |
PPI network construction
STRING furnishes original reliable protein data for consequent analysis. Upregulated, downregulated, and total DEGs were mapped to generate three PPI networks. A PPI network was formed with upregulated DEGs containing 194 nodes and 1,122 edges, as these DEGs had literature related to interacting proteins. Moreover, a PPI network was formed with 130 nodes and 262 edges with the available literature. The total DEG PPI network was formed with 366 nodes and 1,858 edges (Figure 5A).
 | Figure 5 PPI network of pediatric ACC along with the modules. |
Hub genes of the total DEGs PPI network were identified as glyceraldehyde-3-phosphate dehydrogenase (GAPDH), cyclin-dependent kinase 1 (CDK1), topoisomerase (DNA) II alpha (TOP2A), cyclin B1 (CCNB1), and ATP citrate lyase (ACLY). Top 20 hub genes of the overall PPI network are shown in Table 2.
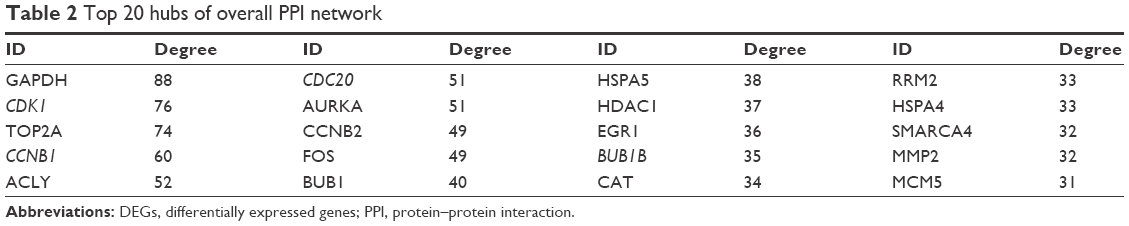 | Table 2 Top 20 hubs of overall PPI network |
Network topological analysis
PPI networks or biological networks are notably different from random networks on the basis of differentiable topological characteristics. The most important indicator is the power law of node degree distribution. The power law of degree distribution was followed with an R2=0.749, 0.859, and 0.836 for upregulated, downregulated, and total DEGs, respectively. This implies that all the PPI subnetworks were scale-free, a major attribute of complex biological networks.33 Various parameters of the PPI networks such as clustering coefficient, network centralization, and network density are shown in Table 3.
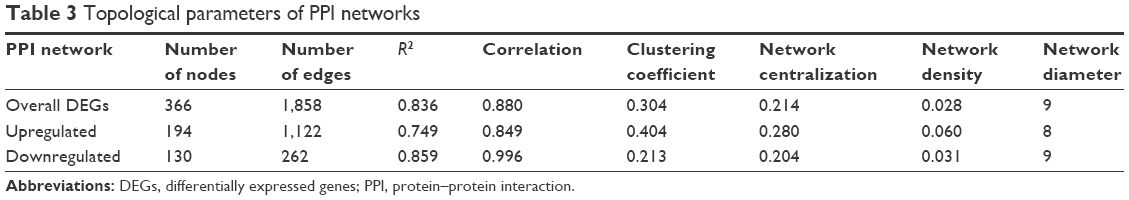 | Table 3 Topological parameters of PPI networks |
Module identification and enrichment analysis
The overall PPI network of the DEGs was surveyed for identification of functional modules in the network. Five modules were identified in the PPI network with MCODE score ≥4 and nodes ≥6: module P-A with MCODE score of 8.625 (nodes =17), module P-B with MCODE score of 6.857 (nodes =22), module P-C with MCODE score of 5.727 (nodes =23) (Figure 5B), module P-D with MCODE score of 5.2 (nodes =16) (Figure 5C), and module P-E with MCODE score of 5 (nodes =19). Hub genes, namely, CDK1, CCNB1, and cell division cycle 20 (CDC20), were present in module P-D, and BUB1 mitotic checkpoint serine/threonine kinase B (BUB1B) was present in module P-C. Modules P-C and P-D were scrutinized further for function and pathway enrichment analysis.
GO functional enrichment of the modules revealed that module P-C was enriched in sterol and steroid metabolic process and that module P-D was enriched in cell cycle process and cell cycle phase (Table 4). Also, KEGG pathway enrichment analysis revealed that genes in module P-C were enriched in cell cycle and p53 signaling pathway and that genes in module P-D were significantly enriched in aminoacyl-tRNA biosynthesis and cell cycle pathways (Table 5).
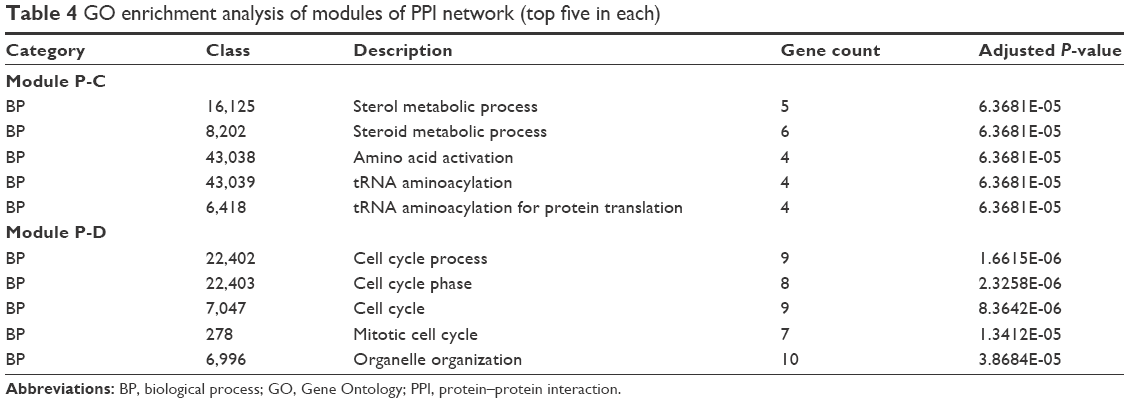 | Table 4 GO enrichment analysis of modules of PPI network (top five in each) |
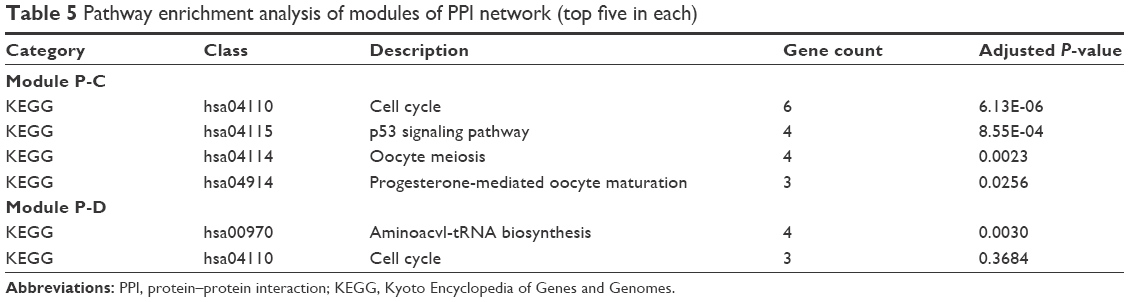 | Table 5 Pathway enrichment analysis of modules of PPI network (top five in each) |
GGI network
A GGI network of the overall DEGs was constructed to infer the biological meaning of the recognized DEGs at the gene level. The gene interaction network was composed of 449 nodes and 14,848 edges (Figure 6A). Approximately 64.66% genes show physical interactions, and 17.38% of genes show coexpression in the GGI network.
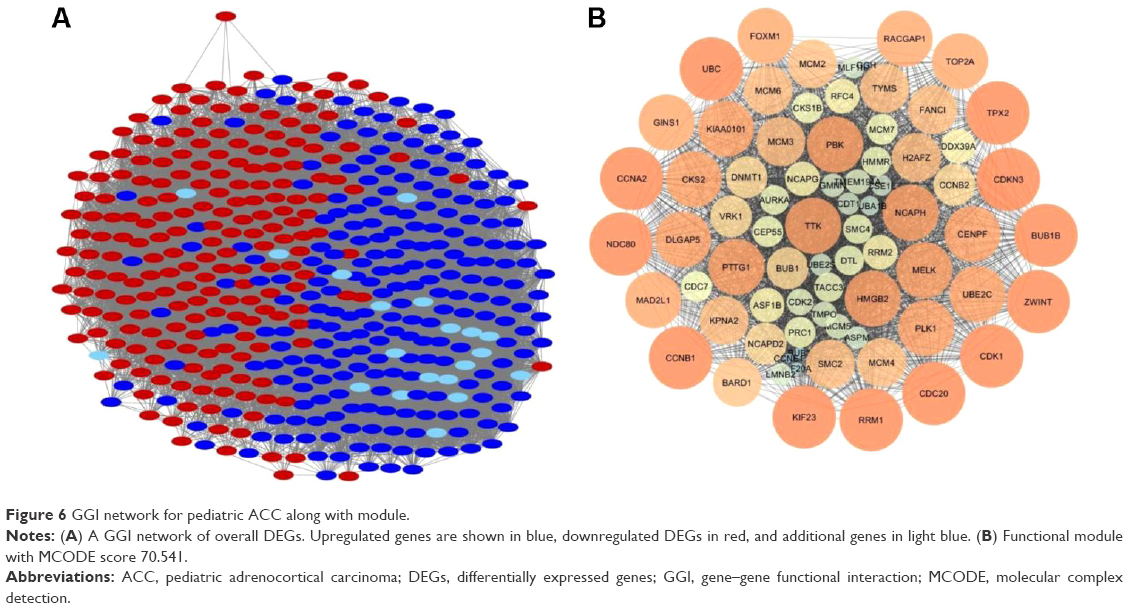 | Figure 6 GGI network for pediatric ACC along with module. |
The hub genes of the GGI network were identified as ubiquitin C (UBC), interleukin enhancer binding factor 2 (ILF2), karyopherin subunit alpha 2, CCNB1, and CDC28 protein kinase regulatory subunit 2 (CKS2). The top 20 hubs of GGI network are shown in Table 6.
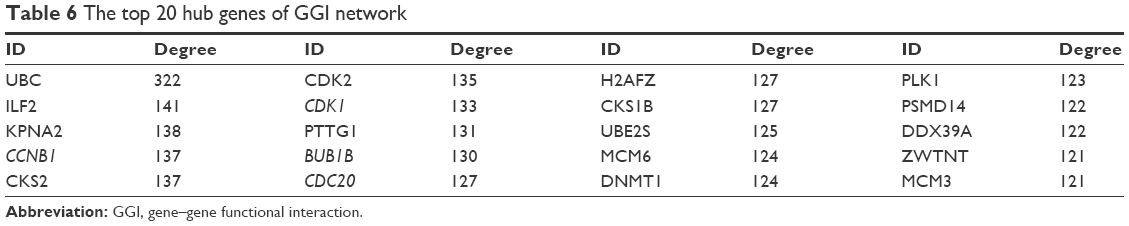 | Table 6 The top 20 hub genes of GGI network |
Ten modules were identified in the GGI network with MCODE score ≥4 and nodes ≥6. They were as follows: module G-A (MCODE score – 70.541) with 75 nodes (Figure 6B), module G-B (MCODE score – 18.698) with 64 nodes, module G-C (MCODE score – 12.963) with 28 nodes, module G-D (MCODE score – 7.333) with 28 nodes, module G-E (MCODE score – 5.647) with 35 nodes, module G-F (MCODE score – 5.556) with ten nodes, module G-G (MCODE score – 5.286) with 29 nodes, module G-H (MCODE score – 5.2) with eleven nodes, module G-I (MCODE score – 4.839) with 32 nodes, and module G-J (MCODE score – 4.833) with 13 nodes. Hub genes, namely, CDK1, CCNB1, CDC20, and BUB1B, were also present in the largest module G-A of the GGI network. Genes in module G-A were further scrutinized for enrichment analysis.
Genes in module G-A were found to be significantly enriched in cell cycle and cell cycle phase. Moreover, KEGG pathway enrichment revealed that genes in module G-A were enriched in cell cycle and oocyte meiosis pathways (Table 7).
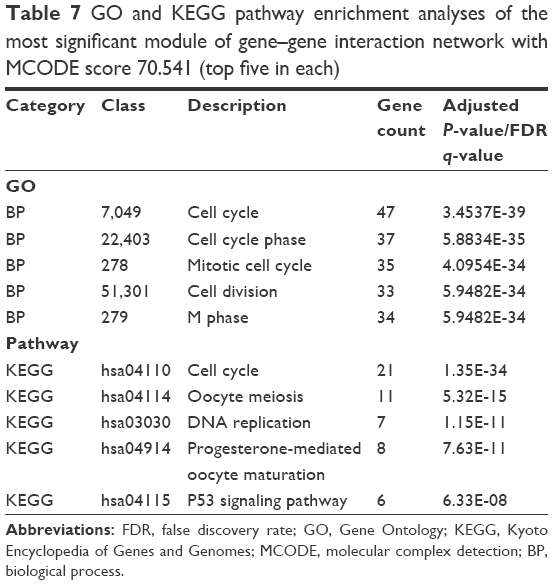 | Table 7 GO and KEGG pathway enrichment analyses of the most significant module of gene–gene interaction network with MCODE score 70.541 (top five in each) |
Gene regulatory network
Identification of DEGs was preceded by recognizing TFs and miRNA associated with DEGs to better understand the process of gene regulation.
Eighty-two miRNAs such as TGGTGCT, MIR-29A, MIR-29B, MIR-29C, GTACTGT, MIR-101, GTGCCTT, and MIR-506 were found to be associated with DEGs. One hundred TFs such as GGGCGGR_V$SP1_Q6 and TGGAAA_V$NFAT_Q4_01 were mapped to DEGs with FDR q-value below 0.05. Top ten TFs and miRNAs associated with DEGs are shown in Tables 8 and 9, respectively.
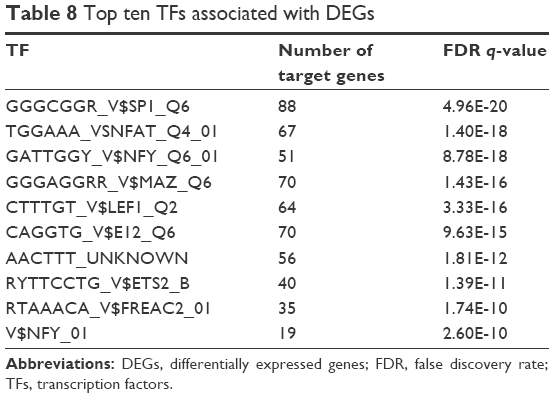 | Table 8 Top ten TFs associated with DEGs |
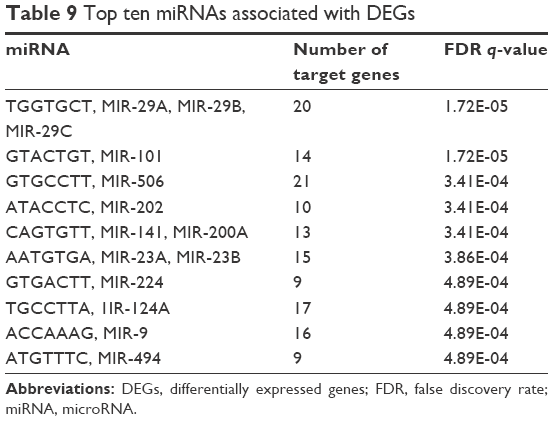 | Table 9 Top ten miRNAs associated with DEGs |
The DEGs–miRNAs–TFs regulatory network consisted of 520 nodes and 2,782 edges (Figure 7). Sp1 TF (SP1) was identified as the hub of the network with a node degree of 88.
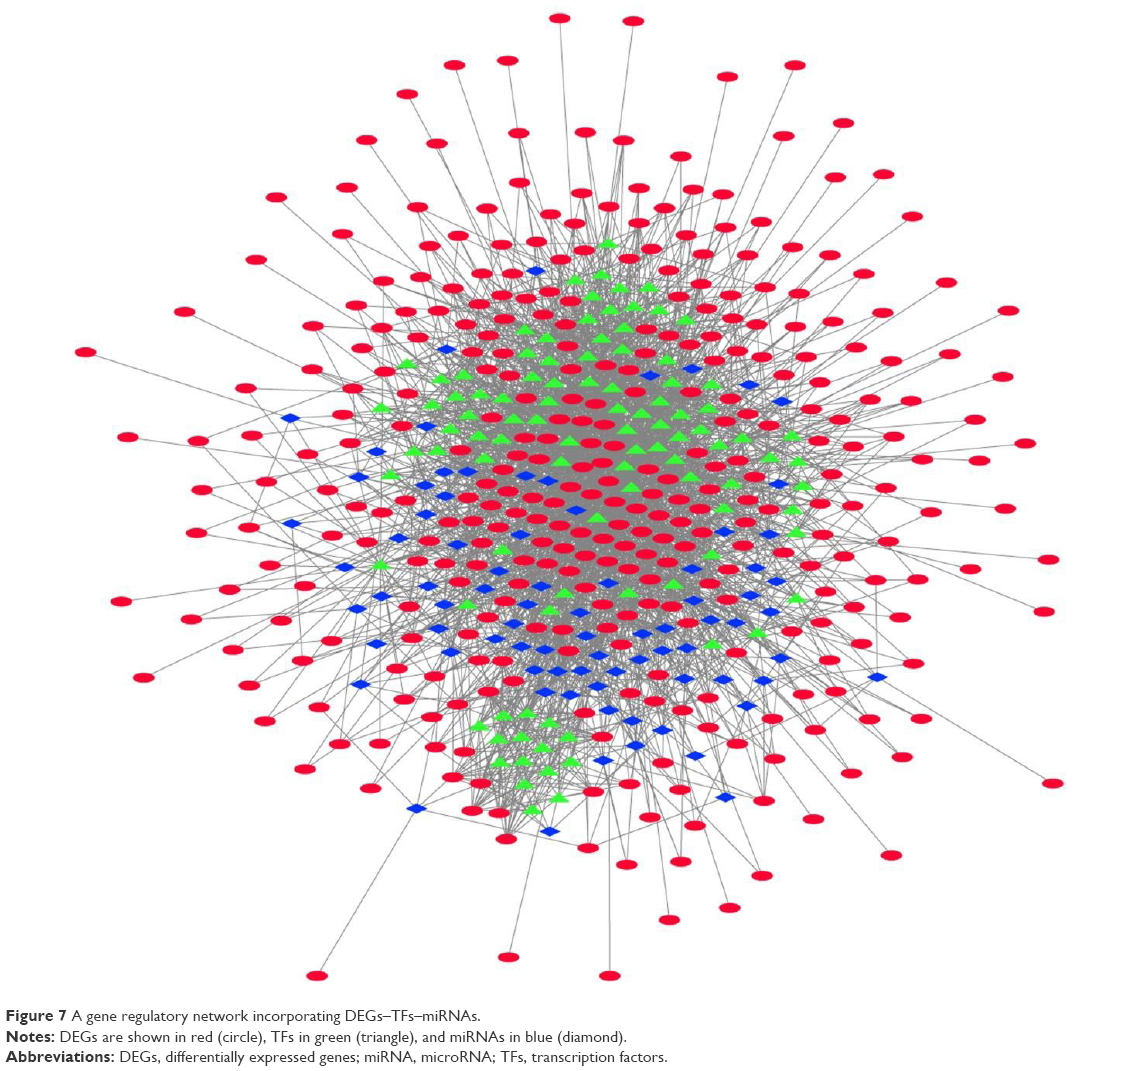 | Figure 7 A gene regulatory network incorporating DEGs–TFs–miRNAs. |
Discussion
PPIs and protein expression are responsible for the pathological changes induced by the development of carcinoma. Multiple resources such as alterations in gene expression, PPI network, gene functional interaction network, hubs, and module identification were employed to identify potential diagnostic markers that can distinguish children with ACC.
A total of 431 DEGs including 228 upregulated and 203 downregulated DEGs were identified by microarray data analysis. Pathway enrichment analysis demonstrated that cell cycle, terpenoid backbone biosynthesis, and oocyte meiosis were overrepresented amid upregulated genes. IGF-2 was the most highly expressed gene in pediatric ACC, as compared to normal adrenal. Among the upregulated DEGs, CDK1, CCNB1, CDC20, and BUB1B were the common hubs among PPI and GGI networks. More centralized genes in the network are suggested to be key drivers of proper cellular function, in comparison to peripheral genes.34 Moreover, all these four genes were incorporated in the functional modules of the interaction networks.
CDK1, also known as CDC2, is a representative of serine/threonine protein kinase family. CDK1 is a catalytic subunit of M-phase promoting factor, a well-conserved protein kinase complex crucial for G1/S and G2/M phase transitions of cell cycle in eukaryotes. CDK1 has previously been reported to be upregulated in ACC samples by Glover et al. Moreover, in vivo inhibition of CDK1 by targeted miR-7 delivery has been proposed as a therapeutic approach for ACC.35 CDC2 was found to be dysregulated in cell cycle pathway through meta-analysis of gene expression and comprehensive genomic hybridization profiling data of ACC.36
CCNB1 encodes for a regulatory protein that is involved in mitosis. Pinto et al reported that pediatric ACC based on TP53 and somatic ATRX mutations had shown high expression of genes associated with chromosome instability and deregulation of cell cycle control, such as CCNB1.4 Soon et al reported that CCNB1 expression was found to be appreciably higher in ACC as compared to adrenocortical adenoma. Also, the combination of IGF-2 and either MAD2L1, CCNB1, or Ki-67 is highly sensitive and specific for ACC.37
CDC20 acts as regulatory protein involved in cell cycle progression, apoptosis, and ciliary disassembly. CDC20 has been proposed to exhibit oncogenic function, demonstrating its utility as a potential therapeutic target for combating human cancers.38 CDC20 has previously been reported to be upregulated in transcriptome analysis of adrenocortical cancer.39
BUB1B is an essential spindle assembly checkpoint protein that forms mitotic check point complex, which on activation controls premature chromosome segregation.40 Mitotic inhibitor drugs such as taxanes, which disrupt the process of cell division, have proved to be potent anticancer drugs. Combined expression of BUB1B–PINK1 has been proposed to be slightly related with disease-free survival in the pediatric group.41
A gene regulatory network incorporating DEGs–miRNAs–TFs was also constructed to better understand the process of gene regulation. Upon analysis, SP1 was found to be hub of the gene regulatory network. SP1 is a versatile sequence-specific DNA-binding protein involved in the expression of different genes.42 It is overexpressed in various human cancers and is involved in angiogenesis, cell growth, and resistance to apoptosis.43–45
The study has some limitations as the data utilized in the study consisted of 18 ACC and seven control samples, which were restricted in quantity and downloaded from the Gene Expression Omnibus database, not generated by us.
Conclusion
Four novel genes, CDK1, CCNB1, CDC20, and BUB1B, associated with pediatric ACC were identified by bioinformatics approaches. These DEGs were present in the hubs and modules of PPI and GGI networks, suggesting their potential utility as potential biomarker for pediatric ACC. These genes may also provide prospective targets for pediatric ACC therapy, although further experimental studies are essential to confirm the role of these genes and their potential to be developed as molecular targets for pediatric ACC.
Acknowledgment
Computing facilities at the National Bureau of Animal Genetic Resources, Karnal, India are gratefully acknowledged.
Disclosure
The authors report no conflicts of interest in this work.
References
Gulack BC, Rialon KL, Englum BR, et al. Factors associated with survival in pediatric adrenocortical carcinoma: an analysis of the National Cancer Data Base (NCDB). J Pediatr Surg. 2016;51(1):172–177. | ||
Lalli E, Figueiredo BC. Pediatric adrenocortical tumors: what they can tell us on adrenal development and comparison with adult adrenal tumors. Front Endocrinol. 2015;6:23. | ||
Pinto EM, Morton C, Rodriguez-Galindo C, et al. Establishment and characterization of the first pediatric adrenocortical carcinoma xenograft model identifies as a potential chemotherapeutic agent. Clin Cancer Res. 2013;19(7):1740–1747. | ||
Pinto EM, Chen X, Easton J, et al. Genomic landscape of paediatric adrenocortical tumors. Nat Commun. 2015;6:6302. | ||
Wasserman JD, Zambetti GP, Malkin D. Towards an understanding of the role of p53 in adrenocortical carcinogenesis. Mol Cell Endocrinol. 2012;351(1):101–110. | ||
Weksberg R, Shuman C, Beckwith JB. Beckwith-Wiedemann syndrome. Eur J Hum Genet. 2010;18(1):8–14. | ||
Ribeiro RC, Pinto EM, Zambetti GP, Rodriguez-Galindo C. The International Pediatric Adrenocortical Tumor Registry initiative: contributions to clinical, biological and treatment advances in pediatric adrenocortical tumors. Mol Cell Endocrinol. 2012;351(1):37–43. | ||
Ribeiro RC, Pinto EM, Zambetti GP. Familial predisposition to adrenocortical tumors: clinical and biological features and management strategies. Best Pract Res Clin Endocrinol Metabol. 2010;24(3):477–490. | ||
Doghman M, Arhatte M, Thibout H, et al. Nephroblastoma overexpressed/cysteine-rich protein 61/connective tissue growth factor/nephroblastoma overexpressed gene-3 (NOV/CCN3), a selective adrenocortical cell proapoptotic factor, is down-regulated in childhood adrenocortical tumors. J Clin Endocrinol Metab. 2007;92(8):3253–3260. | ||
Doghman M, El Wakil A, Cardinaud B, et al. Regulation of insulin-like growth factor – mammalian target of rapamycin signaling by microRNA in childhood adrenocortical tumors. Cancer Res. 2010;70(11):4666–4675. | ||
Wu J, Vallenius T, Ovaska K, Westermarck J, Mäkelä TP, Hautaniemi S. Integrated network analysis platform for protein-protein interactions. Nat Methods. 2009;6(1):75–77. | ||
Li M, Wu X, Wang J, Pan Y. Towards the identification of protein complexes and functional modules by integrating PPI network and gene expression data. BMC Bioinformatics. 2012;13:109. | ||
Bapat SA, Krishnan A, Ghanate AD, Kusumbe AP, Kalra RS. Gene expression: protein interaction systems network modelling identifies transformation-associated molecules and pathways in ovarian cancer. Cancer Res. 2010;70(12):4809–4819. | ||
Sharan R, Ulitsky I, Shamir R. Network-based prediction of protein function. Mol Syst Biol. 2007;3:88. | ||
Li Y, Li J. Disease gene identification by random walk on multigraphs merging heterogeneous genomic and phenotype data. BMC Genomics. 2012;13 (Suppl 7):S27. | ||
West AN, Neale GA, Pounds S, et al. Gene expression profiling of childhood adrenocortical tumors. Cancer Res. 2007;67(2):600–608. | ||
Irizarry RA, Hobbs B, Collin F, et al. Exploration, normalization, and summaries of high density oligonucleotide array probe level data. Biostatistics. 2003;4(2):249–264. | ||
Gautier L, Cope L, Bolstad BM, Irizarry RA. Affy – analysis of Affymetrix GeneChip data at the probe level. Bioinformatics. 2004;20(3):307–315. | ||
Smyth GK. Limma: linear models for microarray data. In: Gentleman V, Carey S, Dudoit R, Irizary W, Huber, W, editors. Bioinformatics and Computational Biology Solutions Using R and Bioconductor. New York: Springer; 2005:397–420. | ||
Bender R, Lange S. Adjusting for multiple testing – when and how? J Clin Epidemiol. 2001;54(4):343–349. | ||
Benjamini Y, Hochberg Y. Controlling the false discovery rate: a practical and powerful approach to multiple testing. J Roy Stat Soc B (Methodological). 1995;57(1):289–300. | ||
Ashburner M, Ball CA, Blake JA, et al. Gene Ontology: tool for the unification of biology. Nat Genet. 2000;25(1):25–29. | ||
Huang da W, Sherman BT, Lempicki RA. Systematic and integrative analysis of large gene lists using DAVID Bioinformatics Resources. Nat Protoc. 2009;4(1):44–57. | ||
Wang J, Duncan D, Shi Z, Zhang B. Web-based gene set analysis toolkit (WebGestalt): Update 2013. Nucleic Acids Res. 2013;41(Web Server issue):W77–W83. | ||
Pathan M, Keerthikumar S, Ang CS, et al. Funrich: An open access standalone functional enrichment and interaction network analysis tool. Proteomics. 2015;15(15):2597–2601. | ||
Szklarczyk D, Franceschini A, Wyder S, et al. STRING v10: protein-protein interaction networks, integrated over the tree of life. Nucleic Acids Res. 2015;43(Database issue):D447–D452. | ||
Shannon P, Markiel A, Ozier O, et al. Cytoscape: a software environment for integrated models of biomolecular interaction networks. Genome Res. 2003;13(11):2498–2504. | ||
Assenov Y, Ramírez F, Schelhorn SE, Lengauer T, Albrecht M. Computing topological parameters of biological networks. Bioinformatics. 2008;24(2):282–284. | ||
Bader GD, Hogue CW. An automated method for finding molecular complexes in large protein interaction networks. BMC Bioinformatics. 2003;4:2. | ||
Maere S, Heymans K, Kuiper M. BiNGO: a Cytoscape plugin to assess overrepresentation of Gene Ontology categories in biological networks. Bioinformatics. 2005;21(16):3448–3449. | ||
Warde-Farley D, Donaldson SL, Comes O, et al. The GeneMANIA prediction server: biological network integration for gene prioritization and predicting gene function. Nucleic Acids Res. 2010;38(Web Server issue):W214–W220. | ||
Subramanian A, Tamayo P, Mootha VK, et al. Gene set enrichment analysis: a knowledge-based approach for interpreting genome-wide expression profiles. Proc Natl Acad Sci U S A. 2005;102(43):15545–15550. | ||
Wu B, Li C, Du Z, et al. Network based analyses of gene expression profile of LCN2 overexpression in esophageal squamous cell carcinoma. Sci Rep. 2014;4:5403. | ||
Horvath S, Zhang B, Carlson M, et al. Analysis of oncogenic signaling networks in glioblastoma identifies ASPM as a molecular target. Proc Natl Acad Sci U S A. 2006;103(46):17402–17407. | ||
Glover AR, Zhao JT, Gill AJ, et al. microRNA-7 as a tumor suppressor and novel therapeutic for adrenocortical carcinoma. Oncotarget. 2015;6(34):36675–36688. | ||
Szabó PM, Tamási V, Molnár V, et al. Meta-analysis of adrenocortical tumour genomics data: novel pathogenic pathways revealed. Oncogene. 2010;29(21):3163–3172. | ||
Soon PS, Gill AJ, Benn DE, et al. Microarray gene expression and immunohistochemistry analyses of adrenocortical tumors identify IGF2 and Ki-67 as useful in differentiating carcinomas from adenomas. Endocr Relat Cancer. 2009;16(2):573–583. | ||
Wang L, Zhang J, Wan L, Zhou X, Wang Z, Wei W. Targeting Cdc20 as a novel cancer therapeutic strategy. Pharmacol Ther. 2015;151:141–151. | ||
Ragazzon B, Assié G, Bertherat J. Transcriptome analysis of adrenocortical cancers: from molecular classification to the identification of new treatments. Endocr Relat Cancer. 2011;18(2):R15–R27. | ||
Wan X, Yeung C, Kim SY, et al. Identification of FoxM1/Bub1b signaling pathway as a required component for growth and survival of rhabdomyosarcoma. Cancer Res. 2012;72(22):5889–5899. | ||
Fragoso MC, Almeida MQ, Mazzuco TL, et al. Combined expression of BUB1B, DLGAP5, and PINK1 as predictors of poor outcome in adrenocortical tumors: validation in a Brazilian cohort of adult and pediatric patients. Eur J Endocrinol. 2012;166(1):61–67. | ||
Suske G. The Sp-family of transcription factors. Gene. 1999;238(2):291–300. | ||
Lou Z, O’Reilly S, Liang H, Maher VM, Sleight SD, McCormick JJ. Down-regulation of overexpressed sp1 protein in human fibrosarcoma cell lines inhibits tumor formation. Cancer Res. 2005;65(3):1007–1017. | ||
Wang L, Guan X, Gong W, et al. Altered expression of transcription factor Sp1 critically impacts the angiogenic phenotype of human gastric cancer. Clin Exp Metastasis. 2005;22(3):205–213. | ||
Kanai M, Wei D, Li Q, et al. Loss of Krüppel-like factor 4 expression contributes to Sp1 overexpression and human gastric cancer development and progression. Clin Cancer Res. 2006;12(21):6395–6402. |
 © 2016 The Author(s). This work is published and licensed by Dove Medical Press Limited. The
full terms of this license are available at https://www.dovepress.com/terms
and incorporate the Creative Commons Attribution
- Non Commercial (unported, 3.0) License.
By accessing the work you hereby accept the Terms. Non-commercial uses of the work are permitted
without any further permission from Dove Medical Press Limited, provided the work is properly
attributed. For permission for commercial use of this work, please see paragraphs 4.2 and 5 of our Terms.
© 2016 The Author(s). This work is published and licensed by Dove Medical Press Limited. The
full terms of this license are available at https://www.dovepress.com/terms
and incorporate the Creative Commons Attribution
- Non Commercial (unported, 3.0) License.
By accessing the work you hereby accept the Terms. Non-commercial uses of the work are permitted
without any further permission from Dove Medical Press Limited, provided the work is properly
attributed. For permission for commercial use of this work, please see paragraphs 4.2 and 5 of our Terms.