Back to Journals » International Journal of Nanomedicine » Volume 15
Nanotechnology-Based Cisplatin Intracellular Delivery to Enhance Chemo-Sensitivity of Ovarian Cancer
Authors Bortot B, Mongiat M ![]() , Valencic E
, Valencic E ![]() , Dal Monego S, Licastro D, Crosera M
, Dal Monego S, Licastro D, Crosera M ![]() , Adami G, Rampazzo E
, Adami G, Rampazzo E ![]() , Ricci G
, Ricci G ![]() , Romano F, Severini GM
, Romano F, Severini GM ![]() , Biffi S
, Biffi S ![]()
Received 23 January 2020
Accepted for publication 28 May 2020
Published 7 July 2020 Volume 2020:15 Pages 4793—4810
DOI https://doi.org/10.2147/IJN.S247114
Checked for plagiarism Yes
Review by Single anonymous peer review
Peer reviewer comments 2
Editor who approved publication: Prof. Dr. Anderson Oliveira Lobo
Barbara Bortot, 1 Maurizio Mongiat, 2 Erica Valencic, 3 Simeone Dal Monego, 4 Danilo Licastro, 4 Matteo Crosera, 5 Gianpiero Adami, 5 Enrico Rampazzo, 6 Giuseppe Ricci, 7, 8 Federico Romano, 7 Giovanni Maria Severini, 1 Stefania Biffi 7
1Department of Medical Genetics, Institute for Maternal and Child Health, IRCCS Burlo Garofolo, Trieste, Italy; 2Department of Research and Diagnosis, Division of Molecular Oncology, Centro Di Riferimento Oncologico Di Aviano (CRO) IRCCS, Aviano, Italy; 3Department of Pediatrics, Institute for Maternal and Child Health, IRCCS Burlo Garofolo, Trieste, Italy; 4ARGO Open Lab Platform for Genome Sequencing, AREA Science Park, Trieste, Italy; 5Department of Chemical and Pharmaceutical Sciences, University of Trieste, Trieste, Italy; 6Department of Chemistry “G. Ciamician”, University of Bologna, Bologna, Italy; 7Department of Obstetrics and Gynecology, Institute for Maternal and Child Health, IRCCS Burlo Garofolo, Trieste, Italy; 8Department of Medicine, Surgery and Health Sciences, University of Trieste, Trieste, Italy
Correspondence: Stefania Biffi Email [email protected]
Background: Platinum resistance is a major challenge in the management of ovarian cancer. Even low levels of acquired resistance at the cellular level lead to impaired response to cisplatin. In ovarian cancer intraperitoneal therapy, nanoparticle formulation can improve the cisplatin’s pharmacokinetics and safety profile.
Purpose: This work aimed to investigate the chemo-sensitivity of ovarian cancer SKOV3 cells upon short-term (72h) single treatment of cisplatin and cisplatin-loaded biodegradable nanoparticles (Cis-NP). The aim was then to determine the therapeutic properties of Cis-NP in vivo using a SKOV3-luc cells’ xenograft model in mice.
Methods: Cell cytotoxicity was assessed after the exposure of the cell culture to cisplatin or Cis-NP. The effect of treatments on EMT and CSC-like phenotype was studied by analyzing a panel of markers by flow cytometry. Intracellular platinum concentration was determined by inductively coupled plasma mass spectrometry (ICS-MS), and gene expression was evaluated by RNAseq analysis. The efficacy of intraperitoneal chemotherapy was evaluated in a SKOV3-luc cells’ xenograft model in mice, through a combination of bioluminescence imaging, histological, and immunohistochemical analyses.
Results: We observed in vitro that short-term treatment of cisplatin has a critical role in determining the potential induction of chemoresistance, and a nanotechnology-based drug delivery system can modulate it. The RNAseq analysis underlines a protective effect of nanoparticle system according to their ability to down-regulate several genes involved in chemoresistance, cell proliferation, and apoptosis. The highest intracellular platinum concentration obtained with Cis-NP treatment significantly improved the efficacy. Consistent with in vitro results, we found that Cis-NP treatment in vivo can significantly reduce tumor burden and aggressiveness compared to the free drug.
Conclusion: Nanoparticle-mediated cisplatin delivery may serve as an intracellular depot impacting the cisplatin pharmacodynamic performance at cellular levels. These features may contribute to improving the drawbacks of conventional intraperitoneal therapy, and therefore will require further investigations in vivo.
Keywords: cisplatin resistance, ovarian cancer, SKOV3, nanoparticle, epithelial-mesenchymal transition, Ca125, apoptosis
Introduction
Epithelial Ovarian Cancer (EOC) is the deadliest gynecologic malignancy.1 The reason for the high death rate is the diagnosis at an advanced stage with the widely metastatic peritoneal disease.1 Despite the recent introduction into clinical practice of new treatments such as anti-angiogenetics, PARP inhibitors, and immunotherapy,2 that are changing the prognosis, the primary treatment is based on various combinations of optimum surgical debulking with chemotherapy.3,4
The unmet clinical need in EOC management stems from the fact that chemotherapy fails to eradicate all the cancer cells disseminated in the peritoneal cavity. Thus, when some residual microscopic tumors remain present post-treatment, these will ultimately lead to the progression of the chemotherapy-resistant disease with poor prognosis.5 Increasing evidence suggests that a complete surgical cytoreduction with the removal of all the macroscopic detectable tumor tissue is the most important independent risk factor predicting survival, and the probability of achieving a cancer-free state could be optimized through a combination of maximal surgical effort and intraperitoneal (IP) chemotherapy.6,7 Interestingly, a recent perspective article indicates that by taking this approach, we could cure up to 50% of women with advanced-stage ovarian cancer.7
The peritoneal cancer index (PCI) can quantify the extent of the disease burden in the peritoneal cavity for patient selection and, even though clinicians are still evaluating some limitations, it may be of prognostic significance in predicting patient survival and response to chemotherapy in analogy to the colorectal and gastric cancer.8,9 However, current preoperative imaging modalities underestimate the peritoneal tumor load, and surgeons depend on visual inspection and palpation for the intraoperative assessment of PCI. As such, novel imaging modalities are under development for enhancing surgical vision for the detection of microscopic tumor tissues and enabling differentiation between benign and tumor lesions during surgery.10
The rationale behind the use of intraperitoneal chemotherapy is to intensify the dose of chemotherapy delivered to the tumor to achieve expected therapeutic efficacy.11 However, despite the evidence from meta-analysis focuses on randomized controlled trials, the IP route of administration is still not widely used in the clinic because of its significantly higher toxicity compared to intravenous (IV) cisplatin-based chemotherapy.12 The risk of peritoneal recurrence due to the limited treatment options requires improvement in the current application of intra-peritoneal chemotherapeutics. In this context, there is evidence that formulating chemotherapeutics into nanoparticle drug delivery systems modifies their pharmacokinetics, often improves their efficacy, and could potentially be a new treatment option to improve oncologic outcomes.13,14 A rapid increase in the number of trials exploiting nanotechnology-based therapeutics suggests that this emerging field is poised to make a remarkable contribution to EOC management strategies.3
The identification of the molecular mechanisms underlying intrinsic and acquired chemoresistance is mandatory to achieve progress in the therapeutic management of advanced ovarian carcinoma.15 Platinum compounds have a central role as the first-line treatment option in combination with a taxane, such as paclitaxel or docetaxel. Resistance to platinum-based chemotherapies is common in the recurrence of high-grade ovarian cancer.16 Studies on the mechanism of platinum resistance in cancer cells have revealed two broad patterns: i) a failure of a sufficient amount of platinum to generate platinum–DNA adducts; ii) defects in the apoptotic response of cells to platinum adducts. The former includes decreased uptake into cells, increased efflux of platinum, and DNA-damage recognition, and repair, whereas the latter can occur as a consequence of anti-apoptotic pathways enhancement after platinum treatment.17 Significantly, increasing evidence suggests that residual cancer cells that become resistant to chemotherapy, often undergo epithelial-to-mesenchymal transition (EMT).18,19 EMT is a biologic process that leads to the loosening of intercellular junctions and enables a polarized epithelial cell to assume a mesenchymal cell phenotype. Consequently, EMT is intimately correlated with metastatic cancer potential as tumor cells undergoing EMT can overcome cell-cell contact inhibition of migration.20 This process is also believed to be correlated with a cancer stem cell (CSC)-like phenotype, and the emergence of CSCs seems to occur in part as a result of EMT.21,22 The increase of the concepts concerning tumorigenesis highlighted the tumor-initiating potential of CSCs that plays critical roles also in the development of the recurrence that follows the chemotherapy. As such, a number of potential mechanistic explanations for chemoresistance have been identified in CSCs.23
In this work, we develop cisplatin-loaded biodegradable nanoparticles (NPs) for the treating of EOC. The nanoparticles were produced from biocompatible and biodegradable materials, with renowned erodibility properties in a physiological environment.24,25 Moreover, polyethylene glycol (PEG) in the nanoparticle’s formulation was included to prevent protein aggregation in the presence of serum. We hypothesize that nanoparticle encapsulated cisplatin serves as an intracellular depot increasing cisplatin efficiency, consistent with a sustained release profile, and we investigated its effects on cell phenotype and gene expression.
Materials and Methods
Cell Cultures
The human ovarian cancer SKOV3 cell line was purchased from ATCC (American Type Culture Collection, Manassas, Virginia United States). SKOV3 culture cells were maintained in RPMI (Thermo Fischer Scientific, Waltham, Massachusetts, USA) supplemented with 10% fetal bovine serum (Euroclone, Milan, Italy) and 1% penicillin/streptomycin antibiotics (Euroclone, Milan, Italy) at 37°C in a humidified incubator with 5% CO2. In order to achieve stable expression of the luciferase gene, SKOV3 cells were transfected with pcDNA3.1-luciferase vector using Lipofectamine 2000 Transfection Reagent, following the manufacturer’s instructions (Thermo Fischer Scientific, Waltham, Massachusetts, USA). We selected the SKOV3 positive clones (SKOV3-luc) in medium containing G418 neomycin (Euroclone, Milan, Italy). To evaluate the luciferase expression, we placed the serial dilutions of SKOV3-luc (500, 1000, 2500, 5000 cell/well) in 96 well plate (Sarstedt, Nümbrecht, Germany) and determined the luciferase activity with ONE-GloTMLuciferase Assay System kit (Promega Madison, WI) using Glomax MultiDetection System instrument (Promega Madison, WI). All images of cell cultures were acquired using CCD camera (DFC420, Leica, Wetzlar, Germany) with light microscopy (DMIL, Leica, Germany) at 20x magnification.
Synthesis and Characterization of Nanoparticles
Chemicals used for NPs preparation were reagent grade or better. The NPs based on low molecular weight glucosamine/L-lactide (GluN-LLA) and poly-L-lactide/PEG (PLA-b-PEG) biodegradable copolymers were fabricated under the class 100 clean-room conditions. We used a proprietary electrohydrodynamic technology (Bio-Target LLC, USA), which we had previously utilized to produce the NPs for imaging and therapy.26,27 The method to produce these nanoparticles was extensively described in the patent US20080187487A1. Briefly, the method includes supplying an organic solution (chloroform) containing the polymers of the shell to an external wall of a hollowed tube, while generating a core fluid flow containing cisplatin to an inner tube. Nanoparticles were formed at the apex of the hollow tube, which was subject to an electric potential to form a two-fluid electrified jet. For all NP formulations, organic solutions containing all the necessary components were processed using this technology resulting in a dry collection of the specified nanoparticles. We harvested the collected material and placed it in a sterilized vial, and determined the particle size and morphology of NP systems by transmission electronic microscopy (TEM) analysis from different TEM images. To perform the TEM analysis, we employed a Philips CM 100 transmission electron microscope operating at 80 kV. Briefly, a small amount of freeze-dried nanoparticles (≈ 0.2 mg) was suspended in PBS 1X (pH 7.4 1.5 mL, Sigma Aldrich, Missouri, USA) by vortex stirring and then by treatment with an ultrasound bath at room temperature for 15–20 minutes. A small volume of this suspension (4 µL) was placed on the grid, and after around 1 minute, the water excess was removed from one side of the grid by capillarity with a fragment of filtering paper. The grid was dried under vacuum before TEM measurements. Samples were deposited on commercial 3.05 mm copper grids (400 mesh) covered by a Formvar support film. TEM picture processing was performed by Image J software.
The NP hydrodynamic diameter distributions, were determined through Dynamic Light Scattering (DLS) measurements with a Malvern Nano ZS instrument equipped with a 633 nm laser diode (Malvern Panalytical Ltd, Malvern UK). The same instrument was used for the determination of Z-Potential values, using a folded capillary cell. For DLS measurement, a small amount of freeze-dried nanoparticles (≈ 0.5 mg) was suspended in PBS 1X (pH 7.4, 1.5 mL, Sigma Aldrich, Missouri, USA) by vortex stirring and then by treatment with an ultrasound bath at room temperature for 15–20 min. The suspension was filtered with a 0.22 µm RC filter (Corning, New York, USA) and housed in a disposable PMMA cuvette of 1 cm optical path length using PBS 1X as solvent (both purchased by Sigma Aldrich, Missouri, USA). The width of DLS hydrodynamic diameter distribution is indicated by PDI (Polydispersion Index). In the case of a mono-modal distribution (Gaussian) calculated through collected analysis, PDI = (σ/Zavg),2 where σ is the width of the distribution, and Z-avg is the average diameter of the particle’s population respectively. For Z-Potential measurements, the suspension was introduced in a plastic folded capillary cell after ultrasound treatment and analyzed under the monomodal setting. Z-Potential values were calculated as an average of 8 different measurements.
Analytical Measurements of Intracellular Platinum Content
After 72h of treatment with free cisplatin and cisplatin-loaded PLGA nanoparticles at concentrations of 1030 µM, approximately 3x10⁵ cells/well in 6 well plates (Sarstedt, Nümbrecht, Germany) of SKOV3-luc cells were harvested, washed twice with DPBS (Euroclone, Milan Italy) and centrifuged at 1500×g for 10 minutes. To mineralize SKOV3-luc cells, we suspended collected pellets by adding 500 µL of aqua regia (HCl:HNO3 = 3:1) namely Nitric acid 69% w/w and hydrochloric acid 37% (VWR International S.r.l., Milan, Italy) and 100 µL of H2O2 (Hydrogen Peroxide 30%, Sigma-Aldrich, Missouri, USA). Subsequently, SKOV3-luc cells were sonicated for 15 minutes and diluted to 25 mL adding MilliQ water (Millipore purification pack system, Millipore, Massachusetts, USA).
ICP-MS Nexion 350X with an ESI autosampler (Perkin Elmer, Waltham, Massachusetts, MA, USA) was used to determine the total platinum concentration in cell lysates derived from the mineralization of SKOV3-luc cells. We used a five-point standard curve obtained by the dilution of platinum standard solution for ICP-MS analysis (1000 ppm, Sigma Aldrich, Missouri, USA) for ICP-MS measurements (0.01–10 μg/L, ion mass: 195 a.m.u.). We assessed the matrix effects utilizing laboratory-fortified samples and laboratory-fortified blanks prepared at the platinum concentration of 1µg/L and analyzed before and after the sample solutions. The platinum recovery was always >95%. The limit of detection was 0.001μg/L, and the precision of the measurements as repeatability (relative standard deviation (RSD) %) for the analysis was <3%.
Cytotoxicity and Apoptosis Assays
5x10³ cells/well of SKOV3-luc were seeded into 96 well plates (Sarstedt, Nümbrecht, Germany) and treated by adding in the culture medium free cisplatin (1mg/mL cisplatin solution for injectable preparations, Accord Healthcare, Italy) and cisplatin-loaded PLGA nanoparticles at concentrations ranging from 4.7 µM to 112.2 µM for 24h, 48h, and 72h. We tested the toxicity of free cisplatin and cisplatin-loaded PLGA nanoparticles in SKOV3-luc cells using the ONE-GloTMLuciferase Assay System kit (Promega Madison, USA). We measured the In vitro luciferase activity employing the Glomax MultiDetection System instrument (Promega Madison, WI, USA) and the relative luminescence unit (RLU) provided by Glomax MultiDetection System instrument that corresponds to living cell number.
Apo-ONE® Homogeneous Caspase-3/7 Assay kit (Promega Madison, WI) was employed to determine apoptosis in treated SKOV3-luc. The relative fluorescence unit (RFU), was measured after 30 minutes by the Glomax MultiDetection System instrument (Promega Madison, WI) following the manufacturer’s instructions. RFU was proportional to the caspase-3/7 cleavage activity. All data collected are reported as the mean and standard deviation of three independent experiments.
Cytofluorimetric Analysis
Bioluminescent SKOV3-luc were seeded at a density of 3x10⁵ cells per well in Nunc™ Multidishes with UpCell™ Surface 6-well plates (Thermo Fischer Scientific, Waltham, Massachusetts, USA) that allow to harvest cells, without using trypsin reagent, and to preserve cell junction structures. Briefly, after 24 hours, the SKOV3-luc cells were treated with free cisplatin and cisplatin-loaded NP at concentrations of 10 µM and 30 µM. At 72 hours after the treatment, the SKOV3-luc cells were left at room temperature (20–25°C) for 15–40 minutes to allow detachment from the plate; they were harvested, washed twice with DPBS (Euroclone, Milan, Italy) and pelleted at 1500×g for 10 minutes.
We incubated the SKOV3-luc cells with the following antibodies: PE-conjugated anti-N cadherin (8C11, ABCAM, Cambridge UK), APC-conjugated anti-E cadherin (67A4, ABCAM, Cambridge UK), PE-conjugated mouse IgG monoclonal anti-FRα (FAB5646P, R&D System, Minnesota USA), PE-conjugated mouse IgG1 EpCAM (CD326, Miltenyi Biotec GmbH, Bergisch Gladbach, Germany), PE-conjugated CD44 human IgG1 (REA690, Miltenyi Biotec GmbH, Bergisch Gladbach, Germany) and PE-conjugated CA125 (Anti-MUC16, ABCAM, Cambridge, UK). These antibodies were diluted in PBS buffer with 2% BSA (w/v) (Sigma Aldrich, Missouri, USA) as recommended by the manufacturer.
We performed the immunofluorescence analysis using MACSQuant (R) Analyzer 10 (Miltenyi Biotec GmbH, Bergisch Gladbach, Germany), and analyzed the fluorescence data by the FlowLogic program (Miltenyi Biotec GmbH, Bergisch Gladbach, Germany).
RNAseq Transcriptome Analysis
Quality of extracted RNA was checked by gel electrophoresis (ribosomal 1828S), spectrophotometric analysis (260/280>1.8), and Agilent bioanalyzer (RNA integrity number, RIN⊚8). A cDNA library of polyA-containing mRNA molecules was prepared (TruSeq, Illumina) and sequenced on the Illumina Platform (Novaseq 6000 21-plex S1 flow cell 2x100 bp reads, about 98 M reads/sample). The raw data discussed in this publication have been deposited in NCBI’s Sequence Read Archive (SRA) (PMID: 21062823) and are accessible through SRA accession: BioProject ID PRJNA595718. Raw data were subjected to quality control (FastQC) and mapped against the human genome using STAR software version 2.7.0 with standard parameters. We performed differential gene expression analysis employing the Bioconductor packages DESeq2 version 1.22.1 and Rsubread version 1.32.1 (PMID: 30783653; PMID: 25516281) in the framework of R software version 3.5.1. The package is based on the negative binomial distribution (NB) to model the gene reads counts and shrinkage estimator to estimate the per-gene NB dispersion parameters. We used, in particular, rounded gene counts as input and estimated the per-gene NB dispersion parameter through the function DESeq for DESEQ2. The estimated p-values for each gene were adjusted using the Benjamini-Hochberg method. Genes with adjusted P<0.05 and absolute Logarithmic base 2 fold change > 1 were selected as input for Pathways analysis.
We uploaded into the IPA software (Qiagen) the list of the significant differentially expressed gene identifiers and the corresponding expression values. The “core analysis” function included in the software was used to interpret the differentially expressed data, which included biological processes, canonical pathways, and gene networks. Each gene identifier was mapped to its corresponding gene object in the Ingenuity Pathway Knowledge Base (IPKB).
Animal Studies
Pathogen-free female athymic nude-Foxn1nu mice (4- to 6-weeks old) were purchased from Envigo RMS Srl (Udine, Italy). Mice were housed in a controlled environment and maintained with ad libitum food and water. All animal procedures were used to minimize animal pain and suffering. All the experimental procedures were carried out in accordance with the national and international laws on the use of experimental animals (L.D. 26/2014, Directives 2010/63/EU). The protocols for mice experimentation were approved by the Institutional Animal Care and Use Committee of the Cluster in Biomedicine (CBM) of the Area Science Park of Trieste and by the Italian Ministry of Health (authorization number 340/2017-PR 03/05/2017).
Mice were inoculated with 1 × 10⁶ SKOV3-luc tumor cells intraperitoneally (i.p.) and tumor engraftment was confirmed 7 days later using the IVIS Lumina Series III In Vivo Imaging System (PerkinElmer, Massachusetts, USA). On day 8 mice were treated with either an i.p. injection of saline, or 4 mg/Kg of cisplatin, and cisplatin-nanoparticle (4 mg/Kg of cisplatin), respectively. To assess tumor response to the treatment, bioluminescence levels were measured weekly using the Living Image software (PerkinElmer, Massachusetts, USA). Mice were anaesthetized with Ketamine/Xylazine (80mg/Kg and 8 mg/kg, respectively), injected i.p. with 150 mg/kg VivoGloTM luciferin (Promega, Madison, Wisconsin, USA) and imaged. Regions of interest (ROIs) were drawn around the bioluminescent signals in the abdominal area of the mice, and measurements were automatically generated as integrated flux of photons (photons/s) by the Living Image software. Bioluminescence intensity was quantitated and normalized, and the mean photon counts per second for each mouse are reported for the given days.
Histology and Immunohistochemical Staining
Tissues (spleen, pancreas, omentum, liver, kidneys, intestine, tumor nodules) were collected and processed using Automated Vacuum Tissue Processor Floor (Histo-Line Laboratories, Milan, Italy) and included in paraffin using trimodular-embedding center (TEC2900 instrument, Histo-Line Laboratories, Milan, Italy). Serial tissue sections of 2–3 μm thickness were cut using a rotary microtome (Zeiss, Oberkochen, Germany) and mounted on glass slides (HistoBond®, Lauda-Königshofen, Germany). Hematoxylin and eosin (H&E) staining of tissue sections was performed using an automated stainer instrument (Compass Stainer – Hologic, Marlborough, Massachusetts, United States) with Mayer’s Hematoxylin and 1% Eosin reagents (Leica Biosystem Buffalo Grove, IL, United States) following manufacturer’s instructions.
Immunohistochemical staining of paraffin-embedded tissue sections was performed using BOND-III Automated IHC Immunostainer (Leica Biosystem, Buffalo Grove, IL, United States). Selected primary antibodies were: Ki67 (Ki67: Clone MM1 cod.PA0118) as a marker for cell proliferation, MCK (Multi-Cytokeratin: clone AE1/AE3 cod. PA0909) and E-Cadherin (clone 36B5 cod. PA0387) as markers for epithelial cells, Vimentin (clone V9 cod. PA0640) to identify cellular mesenchymal phenotype, p53 (clone DO-7 cod. PA0057) to assess the high expression of p53 mutant protein and Bcl-2 (clone bcl-2/100/D5 cod. PA0117) as apoptosis-related protein. Secondary antibodies were conjugated to horseradish peroxidase (HRP), and HRP was detected with DAB Enhancer. All antibodies and reagents were purchased by Leica (Leica Biosystem, Buffalo Grove, IL, United States) and diluted according to manufacturer’s instructions. Cells positive for Ki67 were manually counted in three randomly selected fields per tumor containing an average of 150 cells (n=3 mice for each experimental group). All images were acquired by using an inverted microscope with a CCD camera and the objective lens at 20x magnification (Axioplan2, with Axiocam MRc, ZEISS Oberkochen Germany).
Statistical Analysis
We carried out the statistical analysis using an unpaired Welch Two Sample t-test implemented in the PAST statistic software28 and considered a p-value of less than 0.05, significant.
Results
Cell Cultures
The SKOV3 cell line represents a cellular model of cisplatin resistance derived by ascites of 64 years old patient with ovarian adenocarcinoma.29 The in vitro SKOV3-luc cells readily adhered to create a cell monolayer with epithelial-like morphology, and stably expressed the luciferase gene with a linear relationship (R2=0,95) between the luminescence signal and cell number following the addition of the luciferin substrate.
Nanoparticle Characterization
Table 1 shows the results of the physicochemical characterization and Figure 1 reports a schematic diagram of the electrohydrodynamic technology, along with TEM analysis. Cis-NP contained an amount of cisplatin corresponding to 16.7% w/w. TEM analysis showed a core diameter of 40±15 nm for Cis-NP and 20±13 nm for blank nanoparticles (NP). The hydrodynamic diameter obtained by the dynamic light scattering was 70±30 nm for Cis-NP and 140±9 nm for NP with a polydispersity index of 0.49 and 0.33, respectively (see Figure S1). The Zeta-potential for Cis-NP (−9.3 ± 2.4) mV and NP (−9.1 ± 0.8) mV were measured in PBS 1X, pH 7.4, 20°C with a Malvern Nano ZS instrument using a monomodal setting. Lyophilized Cis-NP and NP were suspended in phosphate buffer saline pH 7.4 and diluted in cell medium to give a concentration of 10 µM and 30 µM of loaded cisplatin.
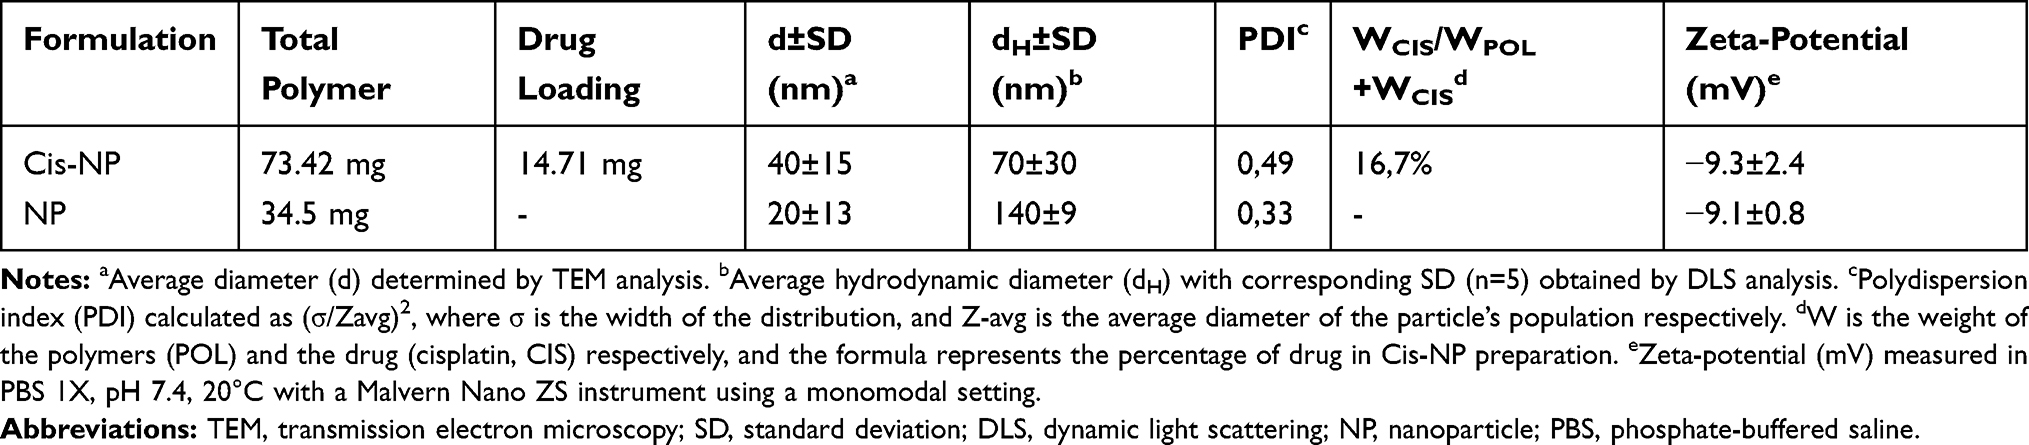 |
Table 1 Physico‑chemical Characterization of Nanoparticles |
 |
Figure 1 Nanoparticle production and characterization. Notes: (A) Schematic diagram of the electrohydrodynamic technology. (B) Transmission electron microscope images (80 kV) of cisplatin-loaded nanoparticle. |
Cytotoxicity and Cell Uptake Studies
The primary aim of this study was to explore the potential of cisplatin-loaded NP as a pharmacological approach aiming to improve the chemo-sensitivity associated with intracellular cisplatin concentration. To this end, in the first set of experiments, we evaluated the cytotoxicity and cell uptake after their exposure to cisplatin formulations. SKOV3-luc cells were expounded to different concentrations of cisplatin and cisplatin-loaded NP, and viability was evaluated by luciferin assay up to 72 hours of exposure time. As shown in Figure 2A after the 24 hours of exposure, the viability analysis displayed the highest cytotoxic activity in the cells treated with free cisplatin, while after 72 hours, the highest activity resulted associated with cisplatin-loaded NP and tended to increase over time. The drug has to be released in a time-dependent manner from the NP before exerting its effects on the cells, therefore as the time goes on, the rate of drug release increases, and the concentration also becomes greater, inhibiting the cell growth in a time-dependent manner.
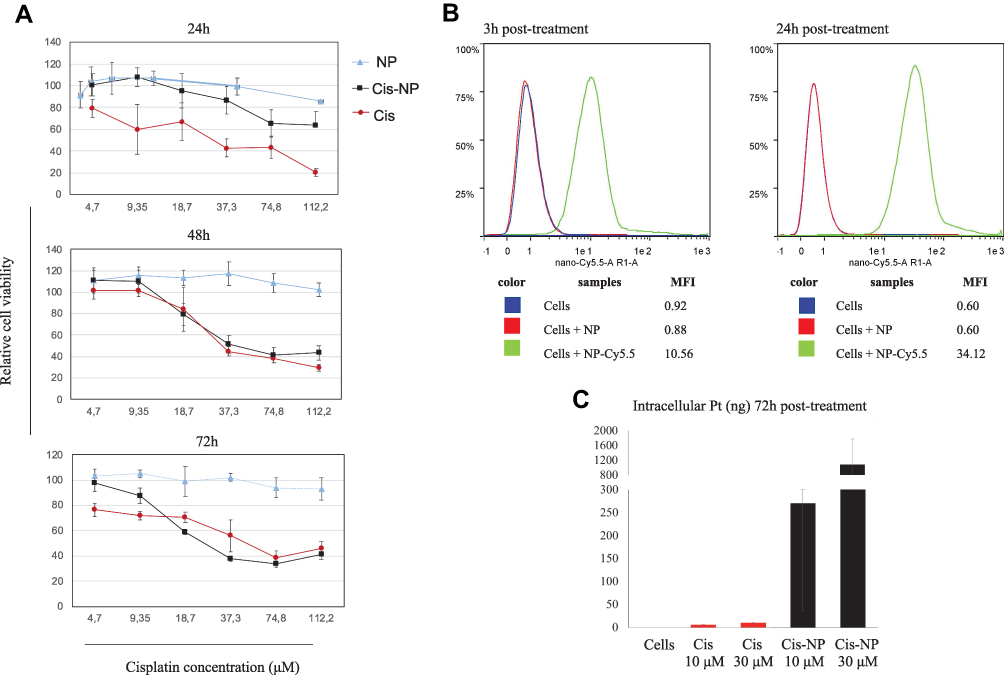 |
Figure 2 Cytotoxicity and cell uptake studies. Notes: (A) Cellular viability of SKOV3-luc cells incubated with cisplatin (Cis) and cisplatin-loaded NP (Cis-NP) at different concentrations for 24, 48, and 72 h. Data are shown as mean ± SD of 3 individual experiments. (B) Cy5.5-conjugated NP (red fluorescence) and SKOV3-luc cells were incubated for 3- and 24- hours at 37°C. NPs’ binding was evaluated by flow cytometric analysis. (C) The difference in intracellular accumulation of cisplatin in SKOV3-luc cells after being exposed to Cis and Cis-NP at different concentrations (10 μM and 30 μM) for 72 hours. ICP-MS method was used to detect intracellular Pt. Data are shown as mean ± SD of 3 individual experiments. Abbreviations: NP, nanoparticle; SD, standard deviation; ICP-MS, inductively coupled plasma mass spectrometry; Pt, platinum. |
The flow cytometric analysis of the SKOV3-luc cells, performed at different times (3 and 24 hours) after Cy5.5-conjugated NP treatment, showed a significant and persistent signal that was significantly detectable at 3 hours after the treatment and increased over the time (Figure 2B, Figure S2). Moreover, to determine the ability of NP to transport cisplatin into cells, and to provide a measure of how much an extracellular applied cisplatin concentration is available in the cell interior, we performed uptake analysis after the treatment at two concentrations (10 μM and 30 μM) for 72 hours, by quantifying Platinum (Pt) in the cell samples using ICP-MS method for Pt detection. As shown in Figure 2C, Pt was undetectable in the control cells, become detectable in the cell samples treated with free cisplatin and dramatically increased after the exposure of cisplatin-loaded NP. Consistently with the evidence that total Pt content in cells is an indicator of the balance between the cellular uptake and efflux of cisplatin, after free cisplatin treatments we observed that Pt content was only slightly higher after its exposure to 30 μM compared to 10 μM, while cisplatin-loaded NP displayed a marked concentration-dependent accumulation.
Change of Phenotype and EMT in vitro: Flow Cytometry Studies
We employed flow cytometry to delineate phenotypic changes of the SKOV3-luc cells, which are defined as intermediate mesenchymal (IM) cells according to their E-cadherin/N-cadherin ratio30 and to analyzed a panel of markers after the exposure at two different concentrations of cisplatin (Figure 3). We analyzed the epithelial-associated markers E-cadherin and EpCAM, the mesenchymal-associated marker N-cadherin, the CSC-associated markers CD44 and CD117, and Ca125, which is the only tumor marker recommended for clinical use in the diagnosis and management of ovarian cancer. These studies revealed some interesting observations: i) the SKOV3-luc cells enriched their mesenchymal phenotype in an EMT-like manner after the exposure at a lower cisplatin concentration (10 μM). Indeed, we observed a decrease of Ca125 expression concomitantly with the upregulation of mesenchymal marker N-cadherin.31 Of note, at the higher cisplatin concentration, we could observe a slight up-regulation of Ca125 associated with a slight downregulation of N-cadherin. We could read this pattern as the opposite as the one observed at the lower concentration. However, whether Ca125 directly regulates the expression of N-cadherin remains to be determined;31 ii) Along with the upregulation of mesenchymal marker N-cadherin, we noted a slight increase in the expression of E-cadherin. Interestingly, the functional consequences of the co-expression of E-cadherin and N-cadherin in ovarian cancer cells has been previously related to cell plasticity and cell aggressiveness.30 Besides, we detected that: iii) the cisplatin exposure induced significant upregulation in the expression of CD44 at both concentrations, whereas did not affect the CD117 expression; iv) The upregulation of the CSC-marker CD44 after the exposure at a higher concentration (30 μM) was particularly marked with the free drug compared to the cisplatin-loaded NP; v) Treatment with cisplatin (both free cisplatin and cisplatin-loaded NP) resulted in enhanced expression of EpCAM as previously reported.32 Of interest, EpCAM-positive cancer cells are clinically involved in resistance to platinum-based chemotherapy.32
 |
Figure 3 Change of phenotype and EMT: flow cytometry studies. Notes: Protein expression analysis by flow cytometry for the epithelial-associated markers E-cadherin and EpCAM, the mesenchymal-associated marker N-cadherin, the CSC-associated markers CD44 and CD117, and Ca125 in SKOV3-luc cancer cells. (A) SKOV3-luc cells treated with 10 μM cisplatin (Cis) and 10 μM cisplatin-loaded NP (Cis-NP), compared to untreated cells (control), after 72 h of exposure. (B) SKOV3-luc cells treated with 30 μM cisplatin (Cis) and 30 μM cisplatin-loaded NP (Cis-NP), compared to untreated cells (control), after 72 h of exposure. Data are presented as relative fluorescence intensity (n=3). Abbreviations: EMT, epithelial-mesenchymal transition; EpCAM, epithelial cell adhesion molecule; CSC, cancer stem cell; CD, cluster of differentiation; NP, nanoparticle; Ca125, cancer antigen 125. |
Overall, we observed that the exposure to a lower concentration of cisplatin (10 μM, Figure 3A) increased the EMT- and CSC phenotype of the SKOV3-luc cells, whereas a higher concentration of cisplatin (30 μM, Figure 3A) prevented the EMT from occurring but increased the stemness to a greater extent. The results are consistent with previous findings that showed that short-term single exposure of chemotherapy (cisplatin, paclitaxel, or both in combination) treatment induce in surviving ovarian cancer cells a CSC-like profile which is independent of the type of chemotherapy and the associated cytotoxicity.33 The specific CSC-like phenotype might differ depending on the cisplatin concentration in the course of chemotherapy treatment, and increases of cisplatin concentration can generate an increase in “stemness”.18
Morphological Changes of the SKOV3-Luc Induced by Treatment with Cisplatin and Cisplatin-Loaded NP
We observed an essential difference in the morphology of the SKOV3-luc cells, treated for 72 h with cisplatin and cisplatin-loaded NP at different concentrations (10 μM and 30 μM), (Figure 4). It was shown that cell morphology in samples treated with free cisplatin differs significantly from those treated with cisplatin-loaded NP. We found changes including irregular shape, shrinkage, rounding, and detachment in cisplatin-treated samples. The comparison revealed that cisplatin-loaded NP treated samples showed a reduced cell detachment from the bottom of the flasks, and a remarkable change in the cell shape with a loss of intracellular connections.
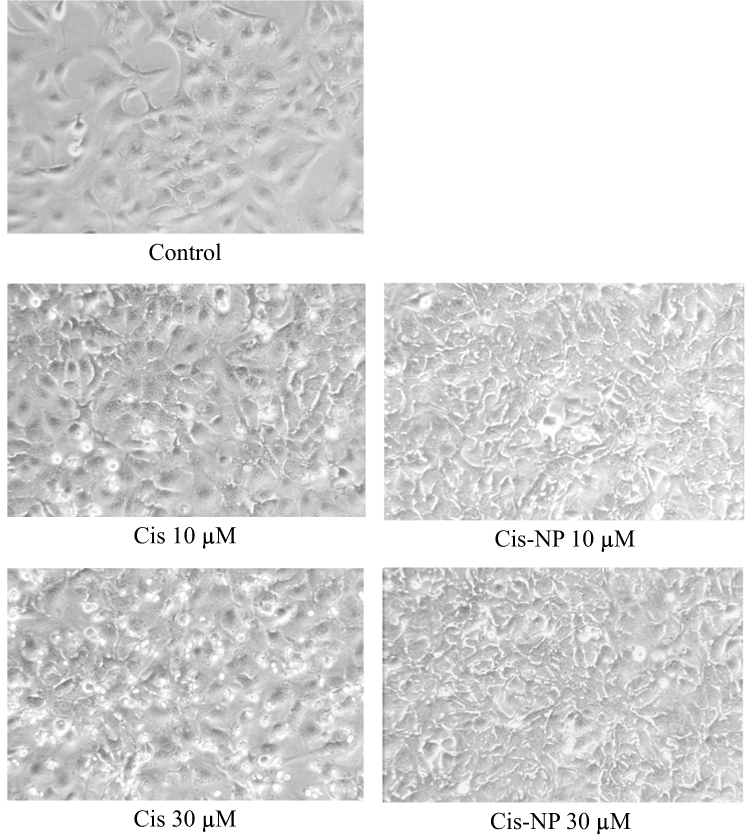 |
Figure 4 Images of cells in culture. Notes: SKOV3-luc cells were treated for 72 h with cisplatin (Cis) and cisplatin-loaded NP (Cis-NP) at different concentrations (10 μM and 30 μM). Cell morphology was captured using the light microscope under 20X magnification. Images shown are representative of three independent experiments. Abbreviation: NP, nanoparticle. |
Effects on the Caspase 3/7 Activity in the SKOV3-Luc Cells Induced by Treatment with Cisplatin and Cisplatin-Loaded NP
We investigated whether blank NP, cisplatin, or cisplatin-loaded NP could affect apoptosis using a caspase 3/7 activity assay (Figure 5). We measured enzymatic activities of caspase 3/7 after 24 and 72 hours of treatment of the SKOV3-luc cells with medium and blank NP as control, cisplatin and cisplatin-loaded NP at different concentrations (10 μM and 30 μM). The enzymatic analysis after 24 hours displayed a slight but significant increase of the caspase 3/7 activity in the cells treated with cisplatin-loaded NP at the higher concentration (30 μM). After 72 hours, the caspase 3/7 activity induced by free cisplatin and cisplatin-loaded NP were comparable at the lower concentration (10 μM), while at the higher concentration (30 μM) cisplatin-loaded NP exhibited significantly higher caspase 3/7 activity than free cisplatin. Interestingly, blank nanoparticle at the higher concentration induced a slight but significant increased in caspase 3/7 activity.
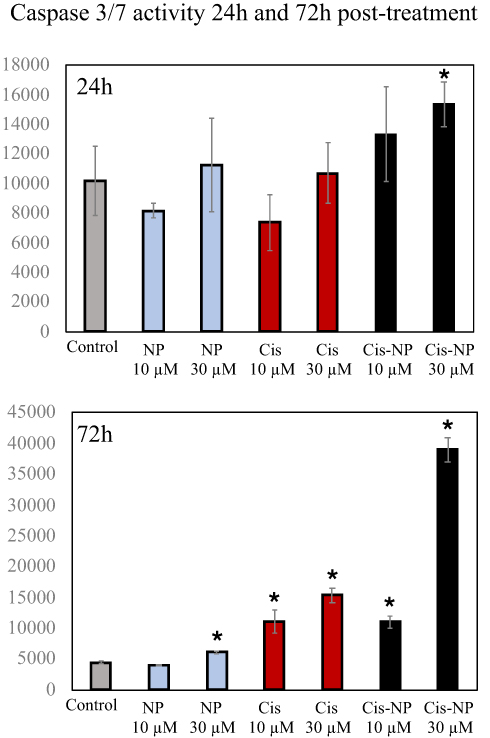 |
Figure 5 Effects on caspase 3/7 activity in SKOV3-luc cells induced by treatment with cisplatin and cisplatin-loaded NP. Notes: Enzymatic activities of caspase 3/7 after 24- and 72-hours treatment of SKOV3-luc cells with medium and blank nanoparticles (NP) as control, cisplatin (Cis), and cisplatin-loaded NP (Cis-NP) at different concentrations (10 μM and 30 μM). The caspase activity is expressed as the relative fluorescence unit (RFU), measured after 30 minutes by the Glomax MultiDetection System instrument (Promega Madison, WI). *P < 0.05. |
RNAseq Transcriptome Analysis
We decided to investigated the whole genome transcriptomes landscape of the SKOV3-luc cell lines treated with cisplatin and cisplatin-loaded NP (Figure S3 and S4). The RNAseq experiments identified 624 Down-regulated and 312 Up-regulated genes in the SKOV3-luc cells after cisplatin 10 μM treatment. Rising the cisplatin concentration to 30 μM leads to an increase in the number of differentially expressed genes (DEGs), including 77% of the cisplatin 10 μM treated down-regulated genes and 85% of the up-regulated ones (Table S1). Bio Functions analysis of differentially expressed genes, identified after the cisplatin treatments, highlights the downregulation of genes involved in the cell survival (Z-score −3.9), adhesions (Z-score −3.5–3.2), cell viability (Z-score −3.7) and synthesis of DNA (Z-score −3.0). At the same time, the cisplatin treatments seem to cluster the upregulation of genes well known in benign tumors, aplasia or hypoplasia, chromosomal aberration, and chromosomal instability. The RNAseq analyses of 10 μM cisplatin-loaded NP identified only 448 differentially expressed genes, and almost all of them, with a small transcriptional effect (Log Fold change < 1), interestingly comparison of Bio Functions analysis with or without NP at 10 μM cisplatin shows opposite behavior for: organismal death (10 μM cisplatin Z-score 2.5 while 10 μM cisplatin NP Z-score −7); apoptosis (10 μM cisplatin Z-score 0.494 while 10 μM cisplatin NP Z-score −2.934); cell survival death (10 μM cisplatin Z-score −3.9 while 10 μM cisplatin NP Z-score 3.6); and cell viability death (10 μM cisplatin Z-score −3.7 while 10 μM cisplatin NP Z-score 3.8) (Figure 6). Analyses of 30 μM cisplatin-loaded NP shows a much stronger transcriptional effect with 92 differentially expressed genes (40 down-regulated and 52 up-regulated) with an absolute LFC >1. Despite 70 out of 92 differentially expressed genes are in common with 30 μM free cisplatin-treated DEGs, none of them cluster in any of the selected Bio Functions and pathways.
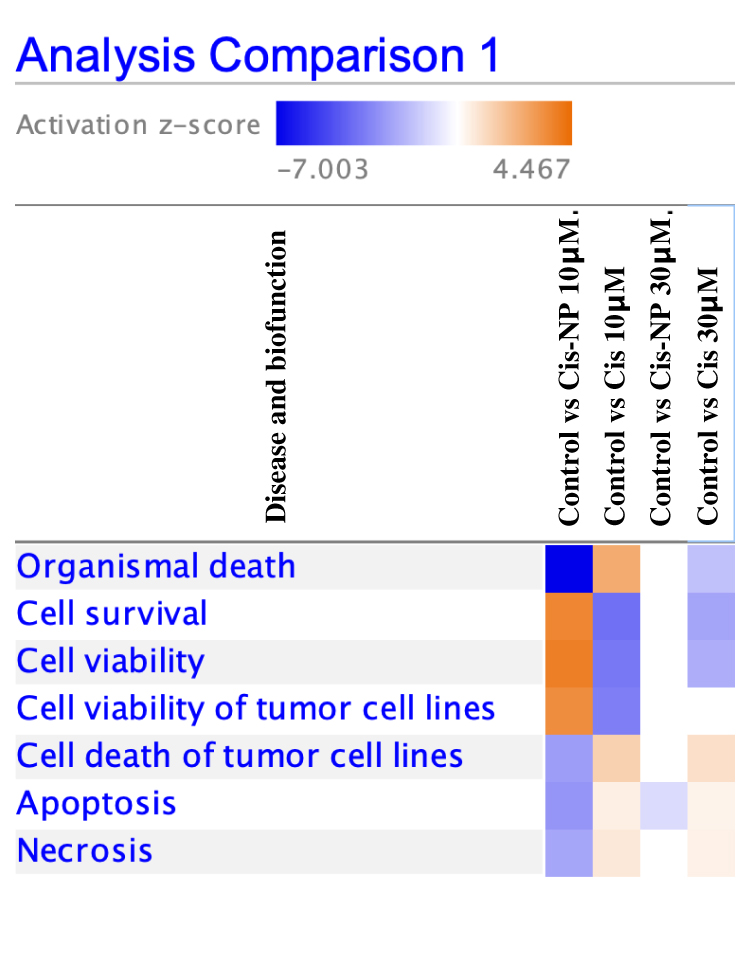 |
Figure 6 RNAseq analyses. Notes: Comparison of Bio Functions analysis with or without NP at 10 μM cisplatin shows opposite behavior for: organismal death, cell survival, cell viability of tumor cell lines, cell death of tumor cell lines, apoptosis, and necrosis. Analyses of 30 μM cisplatin-loaded NP shows a significant transcriptional effect for apoptosis. Abbreviation: NP, nanoparticle. |
Animal Studies
Since Cis-NP inhibited the proliferation of SKOV3-luc cells and demonstrated pro-apoptotic function in vitro, we next tried to determine its therapeutic properties in vivo using a SKOV3-luc cells’ xenograft model in mice. The summary of the experimental design is reported in Figure 7A. The mice were divided into three groups of six/seven mice each and intraperitoneally injected once a week for 4 weeks with saline (control group saline only, n=6), cisplatin (4 mg/Kg, n=6), and Cis-NP (4 mg/Kg, n=7), one week after the intraperitoneal inoculation of SKOV3-luc cells (1x10⁶) and after the confirmation of tumor engraftment by bioluminescence imaging. Figure 7B shows the results of the in vivo bioluminescence imaging analysis of the SKOV3 cells’ xenografts. Mice were monitored for two weeks after treatments to appreciate the effect on the growth pattern further. Our in vivo study showed that, two weeks after the discontinuation of treatment, Cis-NP led to tumor regression in 5 of 7 mice (71%), and free cisplatin led to tumor regression in 3 of 6 mice (50%). Whereas a tendency toward a tumor decrease was observed during the first three treatments in both Cis-NP and free cisplatin groups compared to controls, tumors grew and spread in the peritoneal cavity of most of the mice after the administration of the last treatment. Interestingly, the early increase in tumor masses in response to Cis-NP rapidly reverted over time in 4 of 7 mice, ultimately resulting in the inhibition of tumor growth. That is, tumor growth occurred in a biphasic fashion with rapid growth during the week after the last treatment, and regression in the following week. This kind of biphasic tumor growth did not occur in the control group and was observed only in one mouse in the cisplatin experimental group.
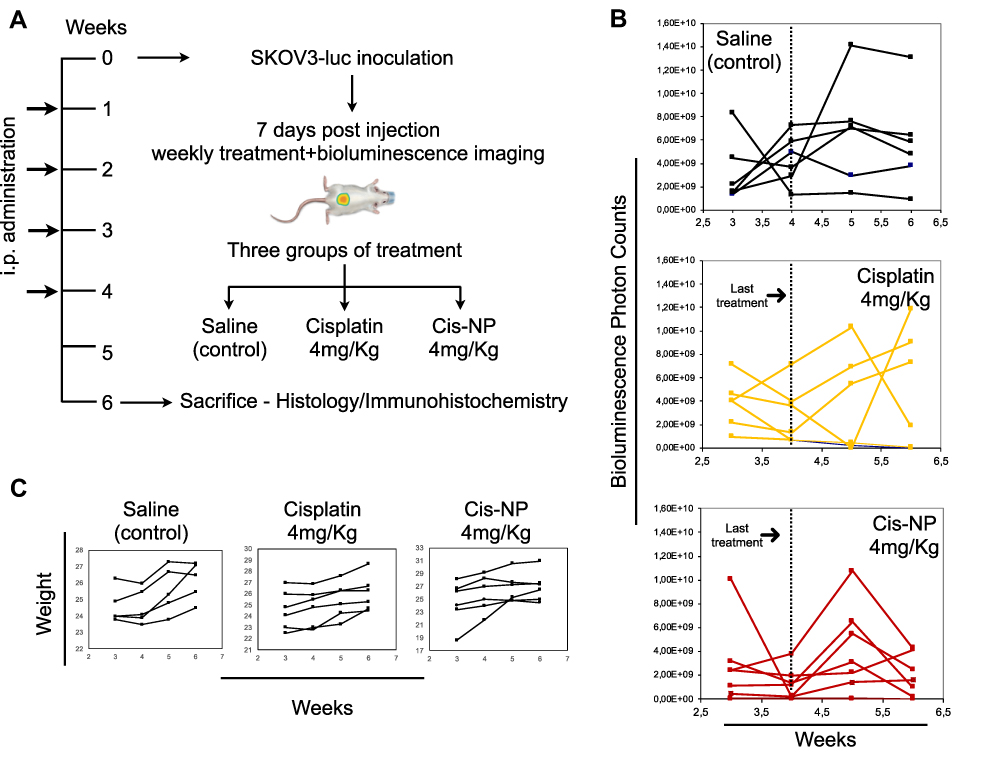 |
Figure 7 Tumor growth of SKOV3-luc xenografts in response to intraperitoneal chemotherapy. Notes: (A) Summary of the experimental design. One week after intraperitoneal inoculation of SKOV3-luc cells (1x10⁶), mice were divided into three groups of six or seven mice each and intraperitoneally injected once a week for 4 weeks with vehicle control group (saline only, n=6), cisplatin (4 mg/kg, n=6), and cisplatin-loaded nanoparticle (Cis-NP, 4 mg/kg, n=7). The progress of the disease was monitored for two weeks after treatment. (B) Bioluminescence was assessed weekly by means of the in vivo imaging analysis (IVIS) system. Each curve represents a single mouse, treated as indicated. Imaging results from week 3 to week 6 are reported. (C) Body weight follow-up. Each curve represents a mouse that is treated as indicated. Data from week 3 to week 6 are reported. Body weight loss was not observed in any of the treated mice. |
Bodyweight loss and behavior change during the entire study was not observed in any of the treated mice (Figure 7C).
Immunohistochemistry of Tumor Masses from SKOV3-Luc Cells’ Xenografts
Combined macroscopic and histological analyses of tumor spreading indicated a marked predilection for the adipose-rich omentum as the site of engraftment; nodules were seen in peritoneum and intestine (see Figure S5). A large body of evidence has demonstrated that milky spots in the omentum (Figure 8A) are critical to ovarian cancer cell initial colonization of the peritoneal cavity in both ovarian cancer models and clinical disease.34 Therefore, we investigated the effectiveness of conventional cisplatin chemotherapy (free cisplatin) and nanoparticle-based therapy at these metastatic sites by analyzing a panel of markers. Figure 8B shows examination of one representative tissue section from Cis-NP group by both standard histology (H&E) and IHC visualizing ovarian cancer cells colonization of milky spot-containing adipose. Figure 8C shows representative images of immunohistochemical staining for Ki67, E-cadherin, vimentin, Blc-2, and p53 of one representative tumor section from each group of the study. Immunohistochemical staining showed that the Ki67 expression difference in the tumor tissues between control and treated mice was 13% after administration of Cis-NP (p-value=0036) and 2% after treatment with cisplatin but with no statistical significance (p=0807) (Figure 8C). Data in the graph are expressed as the mean of positive cells x 100 (cells ± SD) (Figure 8D). Ki67 is a key marker associated with the aggressiveness of cancer cells and poor prognosis.35 The weak intensity of the E-cadherin staining in tumor tissue of the control group indicated low expression of this cell-adhesion molecule consistent with the data provided by the cytofluorimetric analysis on in vitro cell culture. Of note, the E-cadherin staining in the tumor tissue of the cisplatin group is evident in the cell membrane and the cytoplasm of several positive tumor cells (Figure 8C, arrow). This staining pattern of the E-cadherin marker was not evidenced in the tumor tissue of the Cis-NP group. The vimentin staining pattern in all the analyzed group confirmed the high expression of this protein in the cytoplasm of positive cells. The distribution of Bcl-2 positive cells was irregular, with patchy, nested, or foci-like shape in the control group. Positive expressions of Bcl-2 in the cisplatin group were more evident than that in Cis-NP group, where we could not see a foci-like shape. Similar to what observed in the E-cadherin staining, we observed a pattern of several Bcl-2 positive cells in the cisplatin group that was not evidenced in the Cis-NP group (Figure 8C, arrow). The tumor tissue of the control group showed positive immunostaining relative to the mutated p53 protein characterized by diffuse intensity staining and strongly labeled nuclei. After treatment with cisplatin and Cis-NP, the p53 staining pattern of tumor tissue showed a decrease of labeling intensity accompanied by weakly labeled nuclei. p53 is a prognostic marker in ovarian cancer and mutated protein with loss-of-function due to missense mutations affects the cycle cell regulation and the suppression of cancer cell proliferation.36
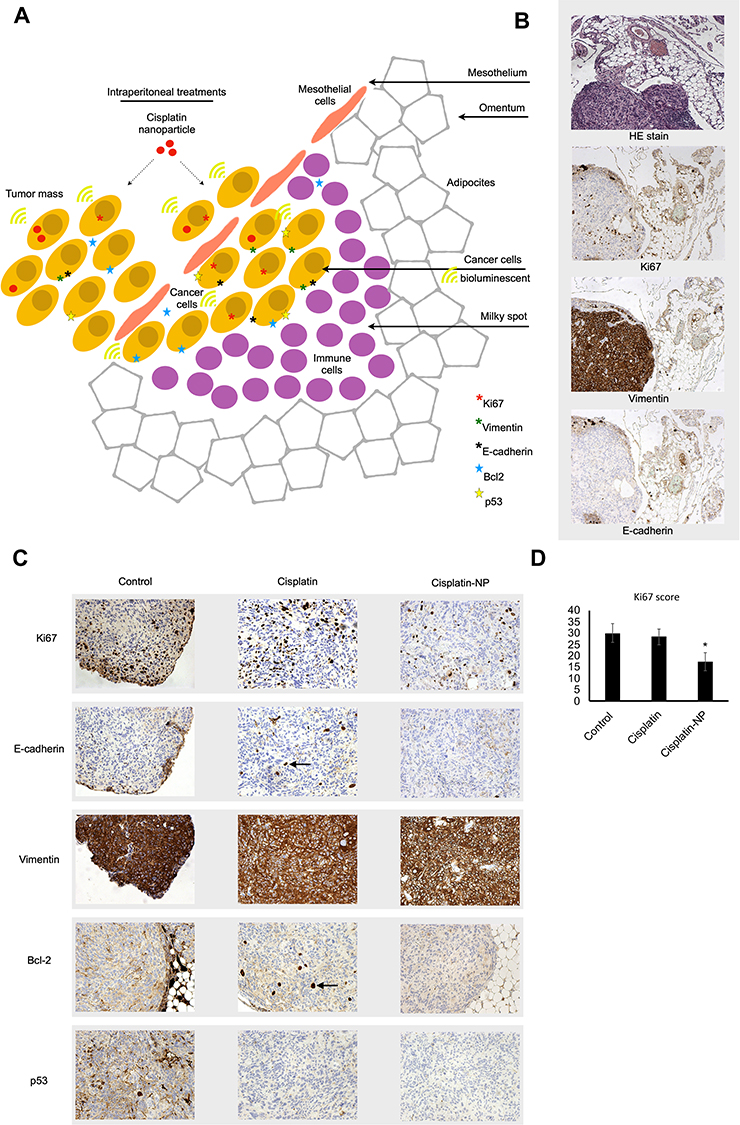 |
Figure 8 Immunohistochemistry (IHC) of tumor masses from SKOV3-luc cells’ xenografts. Notes: (A) Schematic representation of a milky spot in the omentum as a docking station of tumor cells following intraperitoneal injection of SKOV3 cells. The omentum is a thin visceral adipose tissue covered by a layer of mesothelial cells and includes lymphoid aggregates, called milky spots, located just beneath the mesothelial layer. Milky spots contribute to peritoneal immunity and collect metastasizing tumor cells. (B) Images of standard histology (H&E) and IHC staining of an omentum-associated tumor section from a representative animal treated with cisplatin-loaded NP (Cis-NP). Tissues were collected two weeks after treatment. (C) IHC of tumor masses. Tissues were analyzed by IHC for the expression of Ki67, E-cadherin, vimentin, Bcl-2, and p53. Images were captured using 20x magnification. One representative section for each group is shown. Several cells show intense staining for E-cadherin and Bcl-2 in the cisplatin experimental group (arrows). Cisplatin and Cis-NP groups show reduced p53 staining compared to animals treated with saline. Molecular markers suggest that the proliferation index is decreased in cisplatin-nanoparticles treated mice. (D) Ki67positive cells were manually counted by two independent observers in three randomly selected microscopy fields of the tumor section at x200 magnification for each mouse (n=3 for each experimental group), containing an average of 100 cells. Data in the graph are expressed as the mean of positive cells x100 (total positive cells ± SD). *p<0,05. The Ki67 protein (also known as MKI67) is a cellular marker for proliferation. Abbreviations: H&E, hematoxylin and eosin; IHC, immunohistochemistry; NP, nanoparticle; Bcl-2, B-cell lymphoma 2; p53, tumor protein p53; SD, standard deviation. |
Discussion
Although recent studies have shown that the synergistic effect of combining surgical cytoreduction and intraperitoneal platinum‑based chemotherapy could improve the survival rate for patients,7 the severe adverse drug reactions and platinum resistance hindered its application in ovarian cancer therapy. The dose-response curve for cisplatin appears to be an important determinant of survival in patients with ovarian carcinoma, and intraperitoneal administration of cisplatin results in a peritoneal exposure to cisplatin which is 12-to 15-fold higher than in plasma. However, the challenges in intraperitoneal chemotherapy of peritoneal tumors are the low residence time of small molecular weight drugs in the peritoneal cavity, local and systemic toxicity, limited drug penetration into large tumors, and drug resistance.
Even low levels of acquired resistance at the cellular level lead to impaired response to cisplatin.37 Quite a lot of efforts have been put into the study of anti-platinum resistance strategies to reverse platinum resistance in ovarian cancer patients and improve their prognosis.38 Promising drug targets have been identified that could be the key to invert the drug resistance in patients and should be explored further.38 Some of the targets associated with platinum resistance, however, may also play an essential role in a variety of physiological functions, thus exposing patients to potential side effects and toxicities. Therefore, aside from the need to develop a deep understanding of chemoresistance mechanisms, emphasis should be concentrated on the strategies to prevent it at the earliest effective time point.
In this context, we have devised a nanoparticle drug delivery approach that could potentially maximize the therapeutic efficacy and minimize side effects of intraperitoneal platinum‑based chemotherapy. Microparticle or nanoparticle formulations have been used to improve drug’s pharmacokinetics and safety profile, including longer intraperitoneal retention time.39 In this work, we first investigated the chemo-sensitivity of an ovarian cancer cell model to cisplatin upon encapsulation in polymeric nanoparticles, correlating the short-time cellular exposure to the potential induction of chemoresistance. We followed an exposure time that mimics the one encountered during the intraperitoneal administration. In particular, previous results showed drug retention in the ascites fluid for up to 72 hours upon administration of liposomes and microparticles.40 The SKOV3 cell line, used as the experimental model, was derived from the ascitic fluid, and it has been successfully used in prior work to generate consistent tumor growth in nude mice when implanted either subcutaneously or intraperitoneally, thus allowing further in vivo validation studies.41 The significant findings are the following:
- Our cisplatin-nanoparticle system can serve as an intracellular depot, thus improving the chemo-sensitivity associated with intracellular cisplatin concentration.
- The short-term treatment of cisplatin (72h) has a critical role in determining the potential induction of chemoresistance, and our nanotechnology-based drug delivery system can modulate it. Indeed, at a cisplatin concentration of 10 μM, we observed a change in the phenotype with a decrease of Ca125 expression concomitantly with the upregulation of the mesenchymal marker N-cadherin, and a slight increase in the expression of E-cadherin, a combination that has been previously related to cell plasticity and cell aggressiveness.30,42 As previously reported, the “hybrid cadherin” phenotype, in which the cells are positive for both E-cadherin and N-cadherin, is more aggressive than a complete mesenchymal phenotype. While the cytofluorimetric analysis did not reveal any notable difference in the phenotype between free cisplatin and cisplatin-nanoparticle, the RNAseq analysis underlines a protective effect of the nanoparticle system according to their ability to down-regulate several genes involved in chemoresistance, cell proliferation, and apoptosis. In particular, cisplatin exposure was associated with the downregulation of ANKRD1, CYP2C18, and CXCL8. ANKRD1 has been reported to have a significant role in the regulation of the apoptosis in human ovarian cancer cells and is a potential molecular target to improve the sensitivity of ovarian cancer to chemotherapy.43 The CYP2C18 is involved in the mechanisms of chemoresistance to anticancer drugs, and its overexpression in tumors could reduce the effect of chemotherapy because of the deactivation of antineoplastic drugs.44 The CXCL8 plays a crucial role in the metastatic spreading of the ovarian cancer cells in the intraperitoneal cavity.45
- Our findings of RNAseq analysis, along with the caspase 3/7 activity assay, provide evidence in favor of the ability of cisplatin-loaded NP to induce apoptosis. As it is increasingly recognized that the deregulation of the pro- and anti-apoptotic key pathways are essential players in the onset and maintenance of chemoresistance, we consider interesting the ability of the NP loaded with cisplatin to induce apoptosis. Vakifahmetoglu et al compared the susceptibility of the ovarian carcinoma cell lines Caov-4 and SKOV3 to the treatment with cisplatin, demonstrating that cisplatin-treated SKOV3 cells develop the mitotic catastrophe without the involvement of the caspase activation.46 In our experimental setting, apoptosis is activated through the treatment with the cisplatin encapsulated NP, which can be rationalized by considering platinum intracellular bioavailability as the critical factor in activating the apoptotic pathways.
Subsequently, we tried to determine the therapeutic properties of Cis-NP in vivo using a SKOV3-luc cells’ xenograft model in mice. In vivo bioluminescence imaging used in this work allowed us to monitor the change of tumor burden non-invasively. Consistent with in vitro results, we have established that the Cis-NP can enhance the efficacy of cisplatin in a SKOV3-luc cells’ mouse ovarian cancer model. Through a combination of bioluminescence imaging, histological, and immunohistochemical analyses, we found that Cis-NP treatment can significantly reduce tumor burden and aggressiveness compared with the free drug. Among the panel of molecular markers tested, Ki67 suggested that the proliferation index is decreased in Cis-NP treated mice, whereas the expression pattern of Bcl-2 anti-apoptotic protein suggested a protective effect of the nanoparticle system compared to free cisplatin. Previous reports have shown that the anti-apoptotic protein Bcl-2 is overexpressed in ovarian cancer, and contributes to drug resistance disease.47,48 As the literature reports Bcl-2 as a potential novel marker of cisplatin resistance, the ability of Cis-NP treatment to prevent Bcl-2 overexpression is interesting and will require further investigations. Consistent with in vitro results, we noted an increase in the number of E-cadherin positive cells in cisplatin-treated mice compared to Cis-NP. Interestingly, the functional consequences of the co-expression of E-cadherin and mesenchymal markers in ovarian cancer cells have been previously related to cell plasticity and cell aggressiveness.
Moreover, our current findings underline that the time/schedule of histological and immunohistochemistry analyses has a critical role in determining the potential effects of Cis-NP. Indeed, in our experimental model, we found the protective effect of Cis-NP during the second week after the last treatment. Of course, the sample size of this study is relatively small, that is the limitation that future research needs to address. In further studies, the sample size should be increased, and further molecular analysis on tissues should be performed for obtaining more robust outcomes. For instance, immune cell migration was not considered, and the effect of neutrophils and macrophages migration to the omentum is likely to play a role in how the nanoparticle affects tumor development. There is a significant amount of literature devoted to the role of immune cells in nanomedicine.49–51 However, including this complex mechanism is beyond the scope of this work.
Conclusions
In ovarian cancer intraperitoneal therapy, nanoparticle formulation can improve the cisplatin’s pharmacokinetics and safety profile, including longer intraperitoneal retention time. Besides, the intracellular drug exposure is of paramount importance for the pharmacodynamics of cisplatin, which acts on intracellular targets. Here, we investigated in vitro and in vivo the potential of cisplatin-loaded nanoparticle as a pharmacological approach aiming to improve the chemo-sensitivity associated with intracellular cisplatin concentration. In vitro, considering the short intraperitoneal drug retention time, we assessed the effects following short-time exposure (72 hours) of ovarian cancer cells to our cisplatin-nanoparticle system compared to the free drug. Overall, cisplatin-nanoparticle serve as an intracellular depot, leading to the down-regulation of several genes involved in chemoresistance, cell proliferation, apoptosis, and induction of apoptosis. In vivo, through a combination of bioluminescence imaging, histological, and immunohistochemical analyses, we found that Cis-NP treatment can significantly reduce tumor burden and aggressiveness compared with the free drug. Conclusively, the nanoparticle encapsulation changes the cisplatin bioavailability properties to impact its pharmacodynamic performance at cellular levels, with the potential to affect also the systemic efficiency. These features may contribute to improving the drawbacks of conventional intraperitoneal therapy, and therefore will require further investigations in vivo.
Acknowledgments
We thank Dr Martina Bradaschia for the English revision of the manuscript.
Disclosure
The authors report no conflicts of interest in this work.
References
1. Jayson GC, Kohn EC, Kitchener HC, Ledermann JA. Ovarian cancer. Lancet. 2014;384(9951):1376–1388. doi:10.1016/S0140-6736(13)62146-7
2. Cortez AJ, Tudrej P, Kujawa KA, Lisowska KM. Advances in ovarian cancer therapy. Cancer Chemother Pharmacol. 2018;81(1):17–38. doi:10.1007/s00280-017-3501-8
3. Di Lorenzo G, Ricci G, Severini GM, Romano F, Biffi S. Imaging and therapy of ovarian cancer: clinical application of nanoparticles and future perspectives. Theranostics. 2018;8(16):4279–4294. doi:10.7150/thno.26345
4. Castro-Mesta JF, González-Guerrero JF, Barrios-Sánchez P, Villarreal-Cavazos G. Bases and foundations of the treatment of peritoneal carcinomatosis: review article. Medicina Universitaria. 2016;18(71):98–104. doi:10.1016/j.rmu.2016.06.001
5. Agarwal R, Kaye SB. Ovarian cancer: strategies for overcoming resistance to chemotherapy. Nat Rev Cancer. 2003;3(7):502–516. doi:10.1038/nrc1123
6. Tewari D, Java JJ, Salani R, et al. Long-term survival advantage and prognostic factors associated with intraperitoneal chemotherapy treatment in advanced ovarian cancer: a gynecologic oncology group study. J Clin Oncol. 2015;33(13):1460–1466. doi:10.1200/JCO.2014.55.9898
7. Narod S. Can advanced-stage ovarian cancer be cured? Nat Rev Clin Oncol. 2016;13(4):255–261. doi:10.1038/nrclinonc.2015.224
8. Shin W, Park S-Y, Lim MC. Peritoneal cancer index in ovarian cancer. J Gynecol Oncol. 2018;30:1. doi:10.3802/jgo.2019.30.e6
9. Elzarkaa AA, Shaalan W, Elemam D, et al. Peritoneal cancer index as a predictor of survival in advanced stage serous epithelial ovarian cancer: a prospective study. J Gynecol Oncol. 2018;29:4. doi:10.3802/jgo.2018.29.e47
10. Harlaar NJ, Koller M, de Jongh SJ, et al. Molecular fluorescence-guided surgery of peritoneal carcinomatosis of colorectal origin: a single-centre feasibility study. Lancet Gastroenterol Hepatol. 2016;1(4):283–290. doi:10.1016/S2468-1253(16)30082-6
11. Helderman RFCPA, Löke DR, Kok HP, et al. Variation in clinical application of hyperthermic intraperitoneal chemotherapy: a review. Cancers. 2019;11:1. doi:10.3390/cancers11010078
12. Teefey P, Bou Zgheib N, Apte SM, et al. Factors associated with improved toxicity and tolerability of intraperitoneal chemotherapy in advanced-stage epithelial ovarian cancers. Am J Obstet Gynecol. 2013;208(6):
13. Deng Y, Yang F, Cocco E, et al. Improved i.p. drug delivery with bioadhesive nanoparticles. Proc Natl Acad Sci USA. 2016;113(41):11453–11458. doi:10.1073/pnas.1523141113
14. Bajaj G, Yeo Y. Drug delivery systems for intraperitoneal therapy. Pharm Res. 2010;27(5):735–738. doi:10.1007/s11095-009-0031-z
15. Cornelison R, Llaneza DC, Landen CN. Emerging therapeutics to overcome chemoresistance in epithelial ovarian cancer: a mini-review. Int J Mol Sci. 2017;18:10. doi:10.3390/ijms18102171
16. Binju M, Padilla MA, Singomat T, et al. Mechanisms underlying acquired platinum resistance in high grade serous ovarian cancer - a mini review. Biochim Biophys Acta Gen Subj. 2019;1863(2):371–378. doi:10.1016/j.bbagen.2018.11.005
17. Kelland L. The resurgence of platinum-based cancer chemotherapy. Nat Rev Cancer. 2007;7(8):573–584. doi:10.1038/nrc2167
18. Latifi A, Abubaker K, Castrechini N, et al. Cisplatin treatment of primary and metastatic epithelial ovarian carcinomas generates residual cells with mesenchymal stem cell-like profile. J Cell Biochem. 2011;112(10):2850–2864. doi:10.1002/jcb.23199
19. Baribeau S, Chaudhry P, Parent S, Asselin É. Resveratrol inhibits cisplatin-induced epithelial-to-mesenchymal transition in ovarian cancer cell lines. PLoS One. 2014;9(1):e86987. doi:10.1371/journal.pone.0086987
20. Kalluri R, Weinberg RA. The basics of epithelial-mesenchymal transition. J Clin Invest. 2009;119(6):1420–1428. doi:10.1172/JCI39104
21. Kim MR, Choi H-K, Cho KB, Kim HS, Kang KW. Involvement of Pin1 induction in epithelial-mesenchymal transition of tamoxifen-resistant breast cancer cells. Cancer Sci. 2009;100(10):1834–1841. doi:10.1111/j.1349-7006.2009.01260.x
22. Singh A, Settleman J. EMT, cancer stem cells and drug resistance: an emerging axis of evil in the war on cancer. Oncogene. 2010;29(34):4741–4751. doi:10.1038/onc.2010.215
23. Abdullah LN, Chow EK-H. Mechanisms of chemoresistance in cancer stem cells. Clin Transl Med. 2013;2(1):3. doi:10.1186/2001-1326-2-3
24. Matsumoto J, Nakada Y, Sakurai K, Nakamura T, Takahashi Y. Preparation of nanoparticles consisted of poly(L-lactide)-poly(ethylene glycol)-poly(L-lactide) and their evaluation in vitro. Int J Pharm. 1999;185(1):93–101. doi:10.1016/S0378-5173(99)00153-2
25. Ragusa J, Gonzalez D, Li S, Noriega S, Skotak M, Larsen G. Glucosamine/L-lactide copolymers as potential carriers for the development of a sustained rifampicin release system using Mycobacterium smegmatis as a tuberculosis model. Heliyon. 2019;5(4):e01539. doi:10.1016/j.heliyon.2019.e01539
26. Capolla S, Garrovo C, Zorzet S, et al. Targeted tumor imaging of anti-CD20-polymeric nanoparticles developed for the diagnosis of B-cell malignancies. Int J Nanomedicine. 2015;10:4099–4109. doi:10.2147/IJN.S78995
27. Mezzaroba N, Zorzet S, Secco E, et al. New potential therapeutic approach for the treatment of B-Cell malignancies using chlorambucil/hydroxychloroquine-loaded anti-CD20 nanoparticles. PLoS One. 2013;8(9):e74216. doi:10.1371/journal.pone.0074216
28. Hammer O, Harper DAT, Ryan PD. PAST: paleontological statistics software package for education and data analysis. Palaeontologia Electronica. 2001;4(1):9.
29. Fogh J, Fogh JM, Orfeo T. One hundred and twenty-seven cultured human tumor cell lines producing tumors in nude mice. J Natl Cancer Inst. 1977;59(1):221–226. doi:10.1093/jnci/59.1.221
30. Rosso M, Majem B, Devis L, et al. E-cadherin: A determinant molecule associated with ovarian cancer progression, dissemination and aggressiveness. PLoS One. 2017;12(9):e0184439. doi:10.1371/journal.pone.0184439
31. Comamala M, Pinard M, Thériault C, et al. Downregulation of cell surface CA125/MUC16 induces epithelial-to-mesenchymal transition and restores EGFR signalling in NIH:OVCAR3 ovarian carcinoma cells. Br J Cancer. 2011;104(6):989–999. doi:10.1038/bjc.2011.34
32. Tayama S, Motohara T, Narantuya D, et al. The impact of EpCAM expression on response to chemotherapy and clinical outcomes in patients with epithelial ovarian cancer. Oncotarget. 2017;8(27):44312–44325. doi:10.18632/oncotarget.17871
33. Abubaker K, Latifi A, Luwor R, et al. Short-term single treatment of chemotherapy results in the enrichment of ovarian cancer stem cell-like cells leading to an increased tumor burden. Mol Cancer. 2013;12:24. doi:10.1186/1476-4598-12-24
34. Meza-Perez S, Randall TD. Immunological Functions of the Omentum. Trends Immunol. 2017;38(7):526–536. doi:10.1016/j.it.2017.03.002
35. Rahmanzadeh R, Rai P, Celli JP, et al. Ki-67 as a molecular target for therapy in an in vitro three-dimensional model for ovarian cancer. Cancer Res. 2010;70(22):9234–9242. doi:10.1158/0008-5472.CAN-10-1190
36. de Graeff P, Hall J, Crijns APG, et al. Factors influencing p53 expression in ovarian cancer as a biomarker of clinical outcome in multicentre studies. Br J Cancer. 2006;95(5):627–633. doi:10.1038/sj.bjc.6603300
37. Howell SB, Kirmani S, McClay EF, Kim S, Braly P, Plaxe S. Intraperitoneal cisplatin-based chemotherapy for ovarian carcinoma. Semin Oncol. 1991;18(1 Suppl 3):5–10.
38. Shahzad MMK, Lopez-Berestein G, Sood AK. Novel strategies for reversing platinum resistance. Drug Resist Updat. 2009;12(6):148–152. doi:10.1016/j.drup.2009.09.001
39. Gao N, Bozeman EN, Qian W, et al. Tumor penetrating theranostic nanoparticles for enhancement of targeted and image-guided drug delivery into peritoneal tumors following intraperitoneal delivery. Theranostics. 2017;7(6):1689–1704. doi:10.7150/thno.18125
40. Ceelen WP, Levine E. Intraperitoneal Cancer Therapy: Principles and Practice. CRC Press; 2015.
41. Hernandez L, Kim MK, Lyle LT, et al. Characterization of ovarian cancer cell lines as in vivo models for preclinical studies. Gynecol Oncol. 2016;142(2):332–340. doi:10.1016/j.ygyno.2016.05.028
42. Loret N, Denys H, Tummers P, Berx G. The role of epithelial-to-mesenchymal plasticity in ovarian cancer progression and therapy resistance. Cancers. 2019;11:6. doi:10.3390/cancers11060838
43. Scurr LL, Guminski AD, Chiew Y-E, et al. Ankyrin repeat domain 1, ANKRD1, a novel determinant of cisplatin sensitivity expressed in ovarian cancer. Clin Cancer Res. 2008;14(21):6924–6932. doi:10.1158/1078-0432.CCR-07-5189
44. Cizkova K, Konieczna A, Erdosova B, Lichnovska R, Ehrmann J. Peroxisome proliferator-activated receptors in regulation of cytochromes P450: new way to overcome multidrug resistance? Biomed Res Int.
45. Ha H, Debnath B, Neamati N. Role of the CXCL8-CXCR1/2 axis in cancer and inflammatory diseases. Theranostics. 2017;7(6):1543–1588. doi:10.7150/thno.15625
46. Roninson IB, Broude EV, Chang BD. If not apoptosis, then what? Treatment-induced senescence and mitotic catastrophe in tumor cells. Drug Resist Updat. 2001;4(5):303–313. doi:10.1054/drup.2001.0213
47. Anderson NS, Turner L, Livingston S, Chen R, Nicosia SV, Kruk PA. Bcl-2 expression is altered with ovarian tumor progression: an immunohistochemical evaluation. J Ovarian Res. 2009;2:16. doi:10.1186/1757-2215-2-16
48. Dai Y, Jin S, Li X, Wang D. The involvement of Bcl-2 family proteins in AKT-regulated cell survival in cisplatin resistant epithelial ovarian cancer. Oncotarget. 2017;8(1):1354–1368. doi:10.18632/oncotarget.13817
49. Korangath P, Barnett JD, Sharma A, et al. Nanoparticle interactions with immune cells dominate tumor retention and induce T cell-mediated tumor suppression in models of breast cancer. Sci Adv. 2020;6(13):eaay1601. doi:10.1126/sciadv.aay1601
50. Grabbe S, Landfester K, Schuppan D, Barz M, Zentel R. Nanoparticles and the immune system: challenges and opportunities. Nanomedicine. 2016;11(20):2621–2624. doi:10.2217/nnm-2016-0281
51. Engin AB, Nikitovic D, Neagu M, et al. Mechanistic understanding of nanoparticles’ interactions with extracellular matrix: the cell and immune system. Part Fibre Toxicol. 2017;14(1):22. doi:10.1186/s12989-017-0199-z
 © 2020 The Author(s). This work is published and licensed by Dove Medical Press Limited. The
full terms of this license are available at https://www.dovepress.com/terms
and incorporate the Creative Commons Attribution
- Non Commercial (unported, 3.0) License.
By accessing the work you hereby accept the Terms. Non-commercial uses of the work are permitted
without any further permission from Dove Medical Press Limited, provided the work is properly
attributed. For permission for commercial use of this work, please see paragraphs 4.2 and 5 of our Terms.
© 2020 The Author(s). This work is published and licensed by Dove Medical Press Limited. The
full terms of this license are available at https://www.dovepress.com/terms
and incorporate the Creative Commons Attribution
- Non Commercial (unported, 3.0) License.
By accessing the work you hereby accept the Terms. Non-commercial uses of the work are permitted
without any further permission from Dove Medical Press Limited, provided the work is properly
attributed. For permission for commercial use of this work, please see paragraphs 4.2 and 5 of our Terms.