Back to Journals » International Journal of Nanomedicine » Volume 15
Nanomechanics and Histopathology as Diagnostic Tools to Characterize Freshly Removed Human Brain Tumors
Authors Cieśluk M ![]() , Pogoda K
, Pogoda K ![]() , Deptuła P
, Deptuła P ![]() , Werel P
, Werel P ![]() , Kułakowska A, Kochanowicz J, Mariak Z, Łysoń T, Reszeć J, Bucki R
, Kułakowska A, Kochanowicz J, Mariak Z, Łysoń T, Reszeć J, Bucki R ![]()
Received 30 June 2020
Accepted for publication 18 August 2020
Published 6 October 2020 Volume 2020:15 Pages 7509—7521
DOI https://doi.org/10.2147/IJN.S270147
Checked for plagiarism Yes
Review by Single anonymous peer review
Peer reviewer comments 2
Editor who approved publication: Dr Thomas Webster
Mateusz Cieśluk,1 Katarzyna Pogoda,2 Piotr Deptuła,1 Paulina Werel,3 Alina Kułakowska,3 Jan Kochanowicz,3 Zenon Mariak,4 Tomasz Łysoń,4 Joanna Reszeć,5 Robert Bucki1
1Department of Medical Microbiology and Nanobiomedical Engineering, Medical University of Bialystok, Bialystok PL-15222, Poland; 2Institute of Nuclear Physics, Polish Academy of Sciences, Krakow PL-31342, Poland; 3Department of Neurology, Medical University of Bialystok, Bialystok PL-15276, Poland; 4Department of Neurosurgery, Medical University of Bialystok, Bialystok PL-15276, Poland; 5Department of Pathology, Medical University of Bialystok, Bialystok PL-15269, Poland
Correspondence: Robert Bucki
Department of Medical Microbiology and Nanobiomedical Engineering, Medical University of Bialystok, Mickiewicza 2C, Bialystok 15-222, Poland
Tel +48 85 784 5483
Email [email protected]
Background: The tissue-mechanics environment plays a crucial role in human brain physiological development and the pathogenesis of different diseases, especially cancer. Assessment of alterations in brain mechanical properties during cancer progression might provide important information about possible tissue abnormalities with clinical relevance.
Methods: With atomic force microscopy (AFM), the stiffness of freshly removed human brain tumor tissue was determined on various regions of the sample and compared to the stiffness of healthy human brain tissue that was removed during neurosurgery to gain access to tumor mass. An advantage of indentation measurement using AFM is the small volume of tissue required and high resolution at the single-cell level.
Results: Our results showed great heterogeneity of stiffness within metastatic cancer or primary high-grade gliomas compared to healthy tissue. That effect was not clearly visible in lower-grade tumors like meningioma.
Conclusion: Collected data indicate that AFM might serve as a diagnostic tool in the assessment of human brain tissue stiffness in the process of recognizing tumors.
Keywords: AFM, brain tumors, human tissue rheology, mechanomarkers, glioblastoma
Introduction
Quantification of tissue mechanics and its changes during disease development offer an opportunity to gain further characterization of tissue abnormalities with clinical relevance. An increasing number of studies have indicated that changes in tissue mechanics, eg, tissue stiffness, are usually accompanied by histopathological alterations, such as collagen accumulation and/or vascularization of the tissue extracellular matrix (ECM).1–3 On the other hand, it has also been observed that in the early stages of disease development, including cancer growth, changes in cell/tissue stiffness might precede detectable histological changes.4,5 Measurable outcomes that describe alterations in tissue mechanics might serve as novel mechanomarkers that can be used for diagnostic purposes.6–9 Stiffness alterations have been observed during liver fibrosis development, where an increase in liver stiffness was observed before the appearance of classical fibrosis markers.10 Changes in tissue stiffness have also been employed in the development of new diagnostic methods for breast cancer and its malignancy.11 Brain tissue softening has been recorded in neurodegenerative diseases, such as Alzheimer’s and multiple sclerosis,12,13 and higher arterial stiffness correlates with a higher risk of cardiovascular disease.14 Additionally, changes in brain tissue stiffness have been proposed as an acidosis marker.15 As a tumor grows, displacement of the surrounding tissue occurs.16,17 Based on this finding, the effect of solid stresses and tissue stiffness on brain tumor growth, invasion, metastatic potential, and treatment have also been intensively studied.16,18,19 Indeed, increased compressional stresses could reduce blood flow by squeezing blood vessels, thereby modifying tumor progression and lowering the efficacy of chemo- and nanotherapies.16–18 Interestingly, solid stresses caused by screw implantation in mouse models have shown that the stress exerted caused a decrease in local vascular perfusion in the brain, as well as neurological dysfunction and even neuronal death.17
To date, most research related to human tissue stiffness, viscosity, intracranial pressure, and other mechanical properties has been based on magnetic resonance elastography (MRE) and tissue rheology performed using rheometry.6,20–22 MRE is noninvasive and thus does not require biopsy or surgery to collect tissue for measurement. However, technical issues do arise, such as MRE-frequency dependence, which causes different mechanical responses of the tissue.23 Also, both rheological and MRE measurements provide only average bulk mechanical properties from the entire volume of cells and ECM in the sample. To attain nanoscale and single-cell resolution, atomic force microscopy (AFM) must be used, and has been reported previously7,24–26 for different tissue types. Reports have clearly indicated that AFM might be successfully used in research on brain tumor tissue to understand the mechanopathology of this deadly disease.27–31 Nevertheless, to date mostly frozen or fixed human brain samples have been used. Considering that mechanical properties of tissue might be altered due to sample processing prior to AFM measurements,32,33 it is crucial to use freshly collected tissue with properties as close as possible to their physiological state.
AFM is suitable for identifying stiffness variations within tissue samples, and its high resolution at the nanoscale level allows examination of cellular and extracellular components of the tissue that can be compared with histopathological staining, fluorescence imaging, or even Raman spectroscopy analysis.28–31,34 AFM has been used to display the mechanical heterogeneity of the rat brain, as well as to demonstratemechanical differences in white and gray matter of the rat cerebellum.35,36
Obtaining fresh samples of human brain tissue is difficult, especially for healthy untransformed tissue. Therefore, most research is carried out on animals or human brain tumors where normal mouse or rat brain was used as a control. However, in some situations it might be necessary to remove healthy brain tissue to gain access to the tumor mass, and such tissue can be analyzed. Here we present stiffness measurements of not only several types of human brain tumors but also healthy human brain tissue, allowing for a unique opportunity to describe and compare the mechanical properties of healthy and malignant human tissue.
Methods
Tissue Samples
Fourteen brain tissue samples were collected from eleven patients and divided into seven groups (Table 1). Healthy tissue samples as determined by histological evaluation were collected from five patients (one white matter and four gray matter samples) during surgery as a part of the surgical manipulations required to remove the malignant tissue and marked as group I. Within group I, three patients had been diagnosed with meningioma. Two patients had meningothelial meningioma World Health Organization (WHO) G1 and were classified as group II. One patient was diagnosed with fibrous meningioma WHO G1 marked as group III. Group IV consisted of one patient with hemangiopericytoma WHO G2. Group V comprised one patient with metastatic adenocarcinoma originating from lung cancer. Glioblastoma WHO G4 was marked as group VI and collected from three patients. Margin tissue adjacent to glioblastoma was marked as group VII.
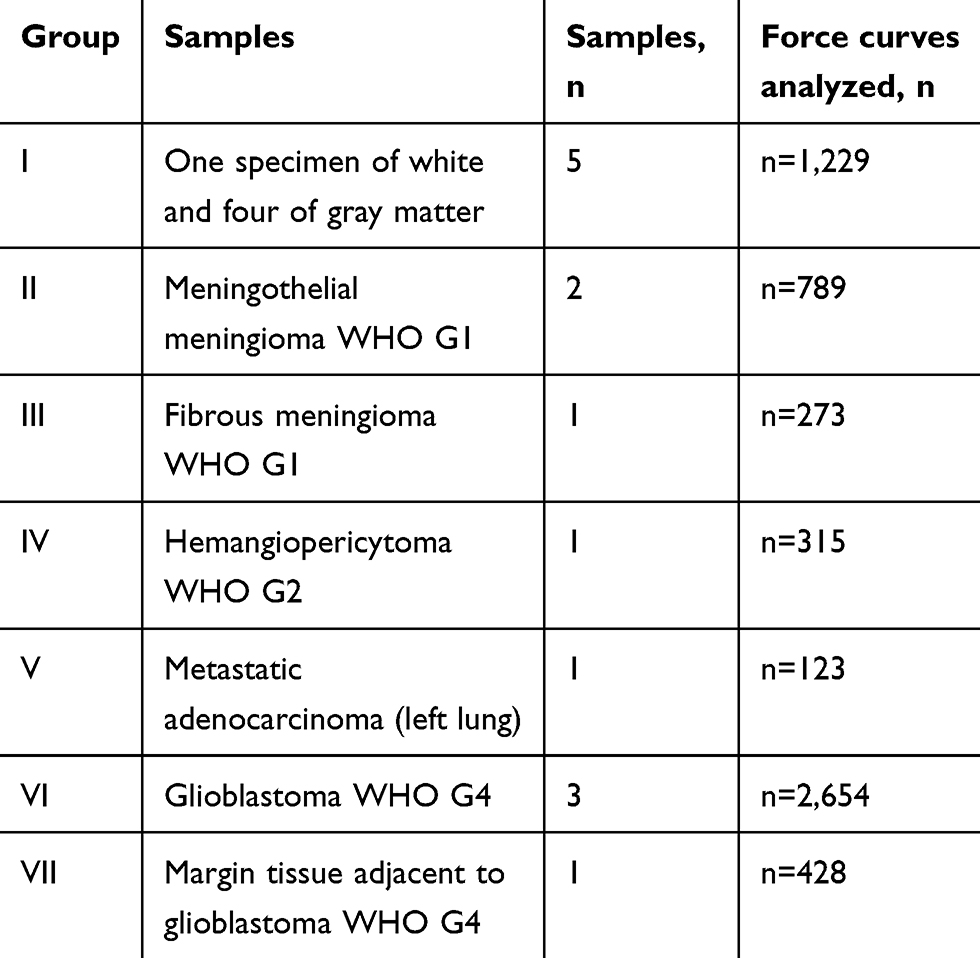 |
Table 1 Histological and nanomechanical characterization of tissue samples |
Additionally, one patient from group VI also had marginal tissue removed, marked as group VII (adjacent to glioblastoma). However, it is important to note that tumors classified as grade IV are generally characterized by a lack of margin tissue, and in this case an untransformed region that was similar to the margin was analyzed. All patients were under the care of the Department of Neurosurgery and the Department of Interventional Neurology, Medical University of Bialystok. Tissue acquired during surgery was immediately placed into tubes filled with MACS tissue storage solution and transported on ice (~4°C) for an average of 15 minutes before AFM measurements were carried out. Patients were required to complete the patient-information and informed-consent forms to participate in the research. Samples were collected only from material that otherwise would have been subject to biohazard waste disposal. The procedure was performed by the surgery team from the Department of Neurosurgery under the supervision of Professor Zenon Mariak. The study was performed according to a protocol approved by the Bioethics Committee of Medical University of Bialystok (R-I-002/136/2019) and complied with the Declaration of Helsinki.
Tissue Sample Preparation
From each material, a thick (~3–5 mm) 5×5 mm piece was cut with a razor blade under liquid conditions and glued onto a 35 mm petri dish using a cyanoacrylate bonding agent. After gluing (~2 minutes), the sample was submerged in fresh DMEM + 10% FBS and AFM measurements carried out at room temperature within 3 hours. After mechanical testing, tissue samples were gently detached and fixed in 10% buffered formalin. Fixed samples were then stained as described in the following.
Atomic Force Microscopy Measurements
AFM measurements were carried out with a Bruker/JPK Instruments system (NanoWizard 4 Bioscience AFM). To overcome the possibility of high sample roughness, an additional piezoelectric actuator (CellHesion module) with a z-axis range of 100 µm was used. Stiffness measurements of the tissue samples were performed with AFM working in force spectroscopy mode. PT.PS (Novascan) cantilevers with glued polystyrene beads Ø=4.5 µm and nominal spring constant of k=0.6 N/m were used. A scan area of 10×10 µm corresponding to 8×8 points per map and up to 15 maps spread around the sample were taken. Consequently, up to 960 force-distance curves for each sample were recorded.
AFM Data Collection and Analysis
During AFM mechanical measurement, the sample was indented with a colloidal tip glued at the end of the cantilever (Figure 1A). The raw data present the deflection of the cantilever versus the distance moved on the z-axis toward the sample’s surface. Force (F) can be acquired through conversion of the cantilever deflection and the equation  , where k is the spring constant of the cantilever recorded during calibration. Young’s (elastic) modulus of the sample can be calculated from force–distance curves using the Hertz model that describes the relation between applied force and resulting indentation depth:
 |
Figure 1 (A) Schematic representation of the experimental setup for AFM tissue measurements. (B) Force vs displacement curve registered when force is applied to reference (glass surface) or investigated (tissue) sample. (C) Real (top view) image of the AFM cantilever placed over the tissue sample from the camera (objective 10×). |
where F is force, E the Young’s modulus of the sample, µ the Poisson’s ratio of the sample (assumed to be equal to 0.5 for an incompressible material), R the radius of the colloidal probe, and δ the indentation depth. Whole analysis was carried out using JPK data processing software. Young’s modulus was calculated by analysis of all force curves recorded for a single sample (at 1 and 2 µm indentation depth for each curve) and averaged to determine the mean Young’s modulus or collected in distributions with subsequent probability density–function fitting, in order to determine center of mass (xc) values.
Histopathological Analysis
Histopathological mapping of tissue was performed after AFM measurements. Tissue was marked with tissue marking dye to ensure analysis of the same area without interfering with diagnostic interpretation.37 Subsequently, samples were fixed in 10% buffered formalin and then proceeded to paraffin blocks. First, slides of approximately 4 µm were cut and stained with H&E. Each slide was evaluated under light microscopy (Olympus CX45) by one pathologist.
Statistical Analysis
Statistical significance was determined using two-tailed Student’s t-tests for overall values and Kolmogorov–Smirnov test for distributions. Statistical analyses were performed using OriginPro 9.65 (OriginLab, Northampton, MA, USA). P<0.05 was considered statistically significant. Results are expressed as the average from all force curves for each group. Overall average values of Young’s modulus are presented as mean ± SD for all force curves. Histograms were fitted with log-normal functions to observe changes in distributions. Distribution values are presented as xc ± SE, where xc represents center of mass.
Results
For each specimen, mechanical testing consisted of obtaining hundreds of force–distance curves (extension and retraction) with constant 1 nN force. Measurements were taken at different locations on the tissue. Figure 2 presents distributions of Young’s modulus for healthy brain tissue versus each group of pathologically altered tissue. Healthy brain tissue stiffness was determined to be 61.2±0.4 Pa (five subjects). Young’s moduli for meningothelial and fibrous meningioma were 52.7±0.6 Pa (two subjects) and 69.8±1.7 Pa (one subject), respectively (Figure 2A and 2B). Additionally, in meningothelial meningioma the log-normal distribution center (xc) shifted to lower values of Young’s modulus compared to healthy tissue. A different relationship was observed for hemangiopericytoma (Figure 2C), where Young’s modulus was 95.0±3.1 Pa (one subject) and log-normal distribution center shifted to higher Young’s modulus values compared to healthy tissue. Figure 2D presents the distribution for healthy tissue versus metastatic adenocarcinoma that originated from lungs. xc shifted to higher Young’s modulus values compared to healthy tissue: 242.2±1.1 Pa (one subject). Young’s modulus distributions for healthy tissue and adenocarcinoma overlapped only at 100–200 Pa. Additionally, adenocarcinoma could not be fitted with a log-normal distribution, so a Gaussian fit was applied. It is important to note that only secondary tumors originating from outside the CNS exhibited different distribution shapes than other types of tissue. Glioblastoma tissue demonstrated higher inhomogeneity of mechanical properties than healthy tissue (Figure 2E). Kolmogorov–Smirnov tests revealed a significant difference (p≤0.001) between glioblastoma and healthy tissue distributions, with xc for glioblastoma tissue almost threefold higher: 168.8±32.8 Pa (three subjects). These data correlate with previous research findings that showed mechanical inhomogeneity and higher stiffness for glioblastoma compared to healthy tissue.27
 |
Figure 2 Distribution of Young’s modulus for healthy (red) versus diseased (gray) tissue. (A) Meningothelial meningioma; (B) fibrous meningioma; (C) hemangiopericytoma; (D) metastatic adenocarcinoma; (E) glioblastoma tissue measured with atomic force microscopy. The Kolmogorov–Smirnov test, which determines if two samples (distributions) are significantly different from each other (red vs gray distribution), was used to confirm statistical differences between healthy and diseased tissue. ***p≤0.001. |
To compare AFM stiffness data two methods can be used. First, comparing average values of Young’s modulus provides a representative value for the entire data set. Second, comparing distributions of Young’s modulus values measured at multiple locations on the sample, fitted with appropriate probability density functions gives deeper information about sample heterogeneity. In our research, we were able to acquire uninvolved adjacent brain tissue from patients with glioblastoma. The center of mass of the Young’s modulus distribution for healthy and adjacent tissue corresponded to 61.2±0.4 Pa and 43.5±0.1 Pa, respectively (Figure 3A). The overall average Young’s modulus from all measured locations was 66.4±39.2 Pa for healthy tissue (five subjects) and 47.2±21.9 Pa for adjacent tissue (one subject, Figure 3B). Results obtained from three glioblastoma tissue samples demonstrated very high sample heterogeneity and increased stiffness compared to their healthy counterparts and adjacent tissue (Figure 3), with glioblastoma being almost three- to fourfold stiffer than healthy or adjacent tissue.
 |
Figure 3 (A) Distribution and (B) average values of Young’s modulus for healthy brain tissue (red) and margin adjacent to glioblastoma (blue), and glioblastoma tissue (gray) measured with atomic force microscopy. Kolmogorov–Smirnov test and unpaired Student’s t-test were used to confirm statistical differences between samples. ***p≤0.001. |
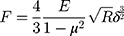
Figure 4 displays the differences between adjacent tissue and glioblastoma from one patient, instead of all the glioblastomas measured, as in Figure 3. This single case example shows not only that the average Young’s modulus for glioblastoma was higher than for adjacent tissue but also that Young’s modulus distribution of glioblastoma tissue was characterized by two local maxima (Figure 4A). As such, log-normal fitting could not be applied and Gaussian multiple fit peaks were employed. The first peak xc was 110.5±0.8 Pa and the second 361.1±2.7 Pa, while the center of mass for adjacent tissue distribution was 43.5±0.1 Pa. Stiffness of glioblastoma compared to adjacent tissue was statistically different on the Kolmogorov–Smirnov test (p≤0.001). Even though the overall average Young’s modulus for glioblastoma was 269.8±133.9 Pa and was over fivefold higher than adjacent tissue (47.2±21.9 Pa, Figure 4B), only by presenting local Young’s modulus distributions for every force curve collected can the coexistence of two regions with different mechanical properties be observed.
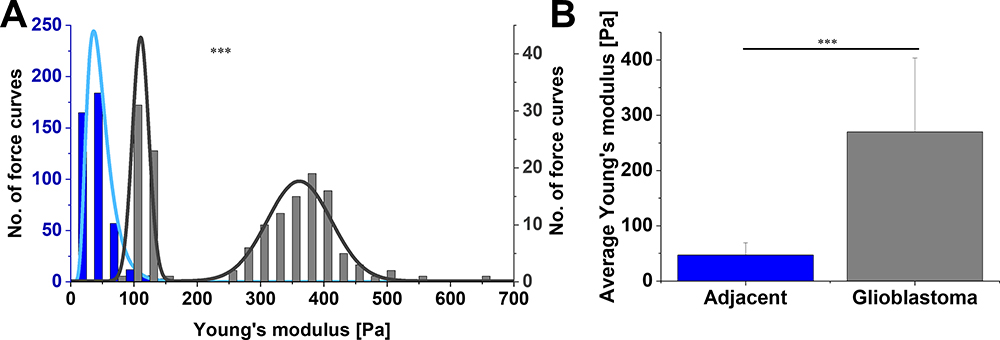 |
Figure 4 (A) Distribution and (B) average values of Young’s modulus for margin adjacent to glioblastoma and glioblastoma tissue acquired from the same patient and calculated at 2 µm indentation depth. In A, the left axis (blue) is referring to adjacent tissue and the right axis (gray) to glioblastoma. Kolmogorov–Smirnov test and unpaired Student’s t-test were used to confirm statistical differences between two sets of data. ***p≤0.001. |
Comparison of the elastic properties of material at different indentation depths can reveal if the sample stiffens or softens when compressive force increases. Figure 5 presents the differences between Young’s modulus of all studied tissue calculated at two different indentation depths — 1 µm and 2 µm — corresponding to superficial and deeper probing of the tissue. Figure 5A shows group I (healthy tissue) stiffness distributions and log-normal fitting: xc=56.0±0.3 Pa for 1 µm and 61.1±0.4 for 2 µm indentation, meaning that a small degree of compression stiffening occurred for these tissue samples. In AFM studies, compression stiffening is not easily observed due to the small scale of the deformation, which is limited by the diameter of AFM probe. With larger scale instrumentation, such as a rheometer or indentation devices, compression stiffening is more obvious,21 but lacks local AFM sensitivity and depicts the response from the whole volume of the sample. Two-level compression of meningothelial meningioma (group II) resulted in a Young’s modulus of 50.0±0.2 Pa for 1 µm and 52.7±0.5 Pa for 2 µm with no compression stiffening (Figure 5B). Fibrous meningioma (group III) exhibited a shift to higher Young’s modulus values with, xc of 62.7±1.3 Pa and 69.0±1.6 Pa for 1 and 2 µm, respectively (Figure 5C). Young’s modulus for hemangiopericytoma WHO G2 (group IV) was 90.5±2.5 for 1 µm and 95.0±3.1 for 2 µm indentation, demonstrating small compression stiffening (Figure 5D). Metastatic adenocarcinoma (group V) resulted in compression softening, unlike other tissue (Figure 5E), with the difference between 1 and 2 µm compression 256.7±5.7 Pa and 242.2±1.1 Pa, respectively. However, unlike other types of neoplasms, log-normal fitting could not be employed, and instead, Gaussian fit was applied.
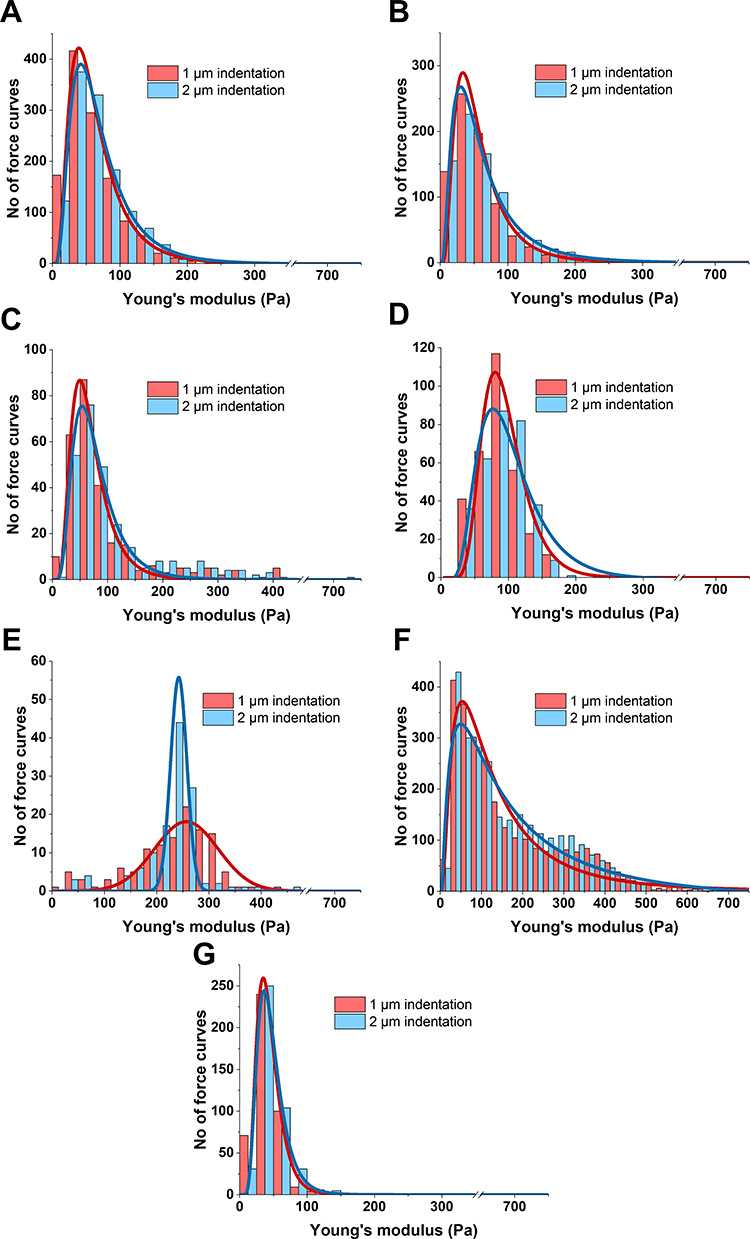 |
Figure 5 Distribution changes in Young’s modulus for (A and G) healthy and (B–F) neoplasm brain tissue calculated at different indentation depths (1 and 2 µm). (A) Healthy tissue (white and gray matter); (B) meningothelial meningioma WHO G1; (C) fibrous meningioma WHO G1; (D) hemangiopericytoma WHO G2; (E) metastatic adenocarcinoma; (F) glioblastoma WHO G4; (G) margin tissue adjacent to glioblastoma. |
A great difference in xc for 1 µm (115.2±7.3 Pa) and 2 µm (168.8±32.8 Pa) indentation depths was observed for glioblastoma tissue (group VI, Figure 5F), and thus the largest degree of compression stiffening was observed for this type of tumor (p≤0.01). A similar trend was observed using a cylindrical probe with a 100 µm radius in previous research,21 but other types of brain tumors were not tested for softening or stiffening with increasing compressive force. Adjacent tissue in Figure 5G also showed little compression stiffening, but the effect was smaller than for healthy tissue, and xc values were 41.1±0.2 Pa and 43.5±0.1 Pa for 1 µm and 2 µm indentations, respectively.
The Kolmogorov–Smirnov test was used to compare distributions of Young’s modulus, calculated at the two indentation depths — 1 µm and 2 µm — for the same sample (the same data set) and xc values of these distributions were compared to show if the sample softened (xc1µm > xc2µm), stiffened (xc1µm < xc2µm), or did not change (xc1µm ≈ xc2µm) with increasing compressive force. All groups of tissue showed different levels of compression stiffening, except for group II (meningothelial meningioma) and V (metastatic adenocarcinoma), the latter of which demonstrated compression softening. The greatest shift to higher Young’s modulus with increasing compressive force was observed for glioblastoma. A short summary of the observed changes is presented in Table 2.
 |
Table 2 Characterization of Young’s modulus changes with increasing compressive force (indentation depth) for all tissue types |
After the AFM mechanical testing of fresh tissue, each tissue sample was marked with tissue marking dye before formalin fixation, so that the pathologist could focus on the same area of tissue being measured. Signs of expansive and infiltrative growth of each tumor, especially glioblastoma, were observed in fixed samples after standard H&E staining. Representative images are shown in Figure 6. Further analysis of adjacent tissue showed infiltration of neoplastic cells into healthy white matter (black arrow, Figure 6C). In meningothelial meningioma, we also observed infiltration of inflammatory cells (red arrow, Figure 6D). Metastatic adenocarcinoma was observed and marked with a blue arrow. Glioblastoma tissue had typical morphology with palisading necrosis (brown arrow) and pathological blood vessels (green arrow) with microthrombi and anaplasia (Figure 6H). Importantly, for each tissue AFM measurement was performed first, then blind measurement of freshly resected intact tissue and histopathological analysis of the mechanically tested tissue fragment revealed the type of malignancy afterward.
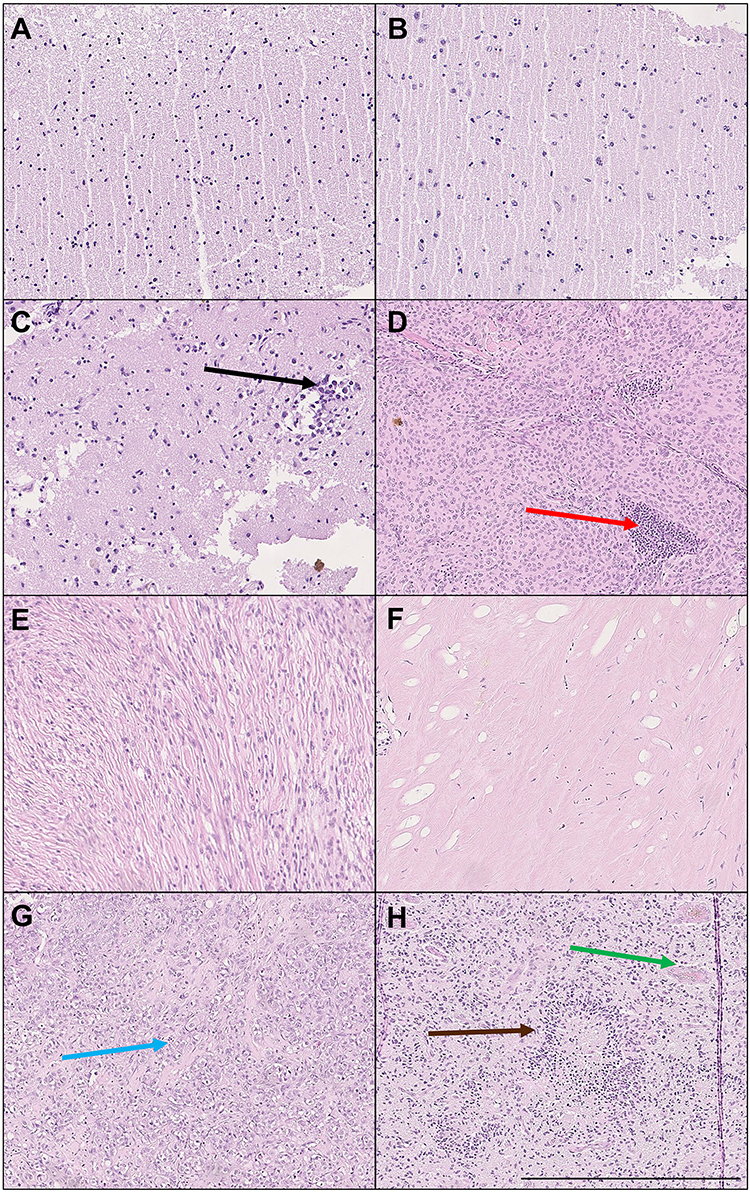 |
Figure 6 Histopathological analysis of healthy brain tissue and CNS neoplasms. H&E staining of (A) white matter, (B) gray matter, (C) margin tissue adjacent to glioblastoma WHO G4, (D) meningothelial meningioma WHO G1 with prominent inflammatory cell infiltrate, (E) fibrous meningioma WHO G1, (F) hemangiopericytoma with prominent hyalinization WHO G2, (G) metastatic adenocarcinoma (lung), and (H) glioblastoma with typical morphology: palisading necrosis and pathological blood vessels with microthrombi and anaplasia WHO G4. Arrows: black — multiple neoplastic cells infiltrating the adjacent white matter of CNS, red — infiltration of inflammatory cells, blue — metastatic adenocarcinoma cells, brown — palisading necrosis, green — proliferation of pathological blood vessels. Results of one representative analysis shown. Bar 500 µm. |
Discussion
Cancers are generally classified according to the extent to which the cancer has developed with respect to growth and metastasis. The World Health Organization created a classification system for tumors of the CNS that scores them based on predicted clinical behavior and morphology, with grades I–IV.38 Current classification of human CNS neoplasms in general, does not consider tumor mechanics and is strictly based on morphology and molecular evaluation (such as isocitrate dehydrogenase mutations). However, there is a growing body of evidence showing that tumor stiffness may affect growth and metastatic potential, and more importantly changes in tissue stiffness may occur before histological manifestation of the occurrence.18,19,39,40 Furthermore, CNS tumors are diverse, with more than 100 histologically different types of primary tumors described. Inclusion of tumor stiffness in grading systems might potentially aid in their classification, differentiation, and clinical prognosis.41–43
In this study, we measured several primary and one secondary CNS tumor and observed that tissue stiffness rose with brain tumor grading. AFM is recognized as a powerful tool that measures the mechanical properties of biological materials at the level of single cells, and thus can uncover mechanopathology at nano- and microscale.44,45 In previous studies, three lines of glioblastoma cells grown on polymer-based hydrogels with various stiffness were mechanically tested with AFM to determine their local elastic properties.21,46 These studies revealed that cells recognized and responded to substrate stiffness by increasing their own stiffness and changing their morphology. However, this adaptive mechanism seems unlikely to be achieved by cells grown in 3-D tissue models, and when the isolates of gliomas or astrocytes are grown on glass or tissue culture plastic, the stiffness of these cells does not correlate with the stiffness of the tissue from which they originate, and at least one or two magnitudes of difference is observed.21,46–49 Interestingly, when single cells isolated from different types of cancers were measured using AFM, their stiffness was reported to be lower than healthy cells.44 This phenomenon has been observed for bladder,24 breast,50 cervix,51 and lung52 cells, with pronounced differences between normal and cancer cell stiffness.
Based on these results, we can conclude that in 2-D culture cells adapt to the mechanical properties of their substrate, but the mechanism of stiffness regulation within the 3-D structure of tissue is very likely more complex. Potentially, it might involve the ability of cells to impose mechanical force on the extracellular network, and this mechanical coupling between active cells and active biopolymer-based ECM could be one of the reasons we observed different values of Young’s modulus in our tissue measurements compared to measurements taken from individual cells in 2-D culture.46
Previous work with cells or particles embedded in 3-D matrix systems that were used to approximate native tissue architecture revealed that increasing cell numbers within a biopolymer gel as well as active network remodeling are required for stiffening and compression stiffening, a behavior that is not observed in systems with low cell density.53 However, this was observed with the use of shear rheometry, which compresses the sample up to hundreds of micrometers of its initial height, while the use of AFM does not allow for sample compression to this extend. Nonetheless, we observed the different extent of compression stiffening in most of the tissue measured when indentation depth of the AFM tip was increased by a factor of two, except for metastatic adenocarcinoma that originated from the lung. Nearly a doubling increase of Young’s modulus as a result of compression stiffening was also observed in bovine brain tissue by Budday et al, but following different measurement methods, higher indentation depths, and indenter sizes of 0.75–1.5 mm.54 This trend was also observed by another research group.55 The force applied in the AFM measurements as well as the geometry and size of the indenting probe allow for nano- and microscale deformations, are on the scale of single cells, cell clusters or cell-ECM microstructures. Bulk rheometry is not affected by these limitations, and samples that are large and have limited variability in their structure can be easily evaluated. In order to estimate the contribution of cells and ECM in overall tissue mechanics, gradual tissue decellularization and subsequent mechanical measurements can be performed.53 As shown previously, the shear modulus (stiffness) of brain tissue does not change during decellularization when measured without compression. Nevertheless, a strong reduction in the degree of compression stiffening was noted when cell numbers decreased.53 Overall, these results are consistent with the hypothesis that the ECM is the dominant component in the generation of tissue stiffness, but requires tightly packed cells to generate compression stiffening.
Our results suggest that tissue stiffness can rise with brain tumor grading and can be observed when comparing meningioma (WHO G1) to hemangiopericytoma (WHO G2), or glioblastoma (WHO G4). Previous research with MRE scans has shown that meningioma tissue stiffness is greater than surrounding healthy tissue, while in the same setting glioblastoma stiffness is lower.56,57 However, brain is a viscoelastic material and has a large viscous contribution, and thus its mechanical properties are nonlinear. For this reason, the direct comparison of MRE to AFM data is not possible. Moreover, even comparison between different studies using MRE is challenging, because the frequencies used during each MRE scan greatly impact the results and usually vary from 1 Hz up to two kHz,23,58,59 while frequency modulation of the AFM technique does not allow the reaching of these limits. Additionally, the magnitude difference might be explained by exclusion of intracranial pressure and additional pressure gradients applied by the tumors, which is not observed in ex vivo AFM measurements. Studies of brain tumors using shear wave elastography have indicated that increased stiffness may correlate with tumor grading and that gliomas are the softest and meningiomas the stiffest.60 However, on MRE healthy tissue is stiffer than glioblastoma, while in shear wave elastography all grades of tumor are stiffer than healthy tissue.57,60,61
Our research on glioblastoma tissue measured immediately after excision shows its heterogeneity and increased stiffness when compared to healthy tissue. On the other hand, research has shown that glioma tissue is softer than healthy tissue when measured using a different microindentation device with a larger contact area.21 Nevertheless, in our studies the overall AFM tip area in contact with the sample was around 30 µm2, which corresponds to the single cell level, while the microindentation device used previously had a >9,000-fold higher contact area, and thus recorded bulk response from the tissue. Still, tissue stiffness measurements obtained from either method cannot be correlated with the stiffness of cells seeded onto 2-D gels that are as soft as brain.46 Due to the study design, groups II–V had only one subject, which is a limitation of our research. Though one can still observe mechanical differences among these groups, care needs to be taken before generalizing the conclusions. Further research with larger samples would be beneficial for confirmation of the changes and clarifying the overall mechanical behavior of these tumor types.
Conclusion
Evaluation of tissue mechanics using AFM together with histopathological observation provides a new setting to improve characterization of cancer progression at the nano- and microscale level and could enrich the current tumor grading system. Collected data indicate that tissue stiffening might indicate pathological changes in the CNS even at the nano- and microscale that correlate with increased malignancy. However, due to our sample size, further analysis of mechanical differences needs to be studied with larger samples to generalize our findings.
Data Sharing and Data Accessibility
The deidentified data that support the findings of this study are available from the corresponding author upon reasonable request.
Acknowledgment
Schematic figures were created with BioRender.
Funding
This work was funded by grants from the National Science Centre, Poland (UMO-2018/30/M/NZ6/00502 to RB) and (UMO-2017/26/D/ST4/00997 to KP) and the Medical University of Bialystok (SUB/1/DN/19/002/1162 to MC).
Disclosure
The authors declare no conflicts of interest for this work.
References
1. Ogawa S, Moriyasu F, Yoshida K, et al. Relationship between liver tissue stiffness and histopathological findings analyzed by shear wave elastography and compression testing in rats with non-alcoholic steatohepatitis. J Med Ultrason (2001). 2016;43(3):355–360. doi:10.1007/s10396-016-0698-9
2. Lupsor M, Badea R, Stefanescu H, et al. Analysis of histopathological changes that influence liver stiffness in chronic hepatitis C. Results from a cohort of 324 patients. J Gastrointestin Liver Dis. 2008;17(2):155–163.
3. Wang L, Xia P, Lv K, et al. Assessment of renal tissue elasticity by acoustic radiation force impulse quantification with histopathological correlation: preliminary experience in chronic kidney disease. Eur Radiol. 2014;24(7):1694–1699. doi:10.1007/s00330-014-3162-5
4. Xu W, Mezencev R, Kim B, Wang L, McDonald J, Sulchek T. Cell stiffness is a biomarker of the metastatic potential of ovarian cancer cells. PLoS One. 2012;7(10):e46609. doi:10.1371/journal.pone.0046609
5. Chamming’s F, Latorre-Ossa H, Le Frere-belda MA, et al. Shear wave elastography of tumour growth in a human breast cancer model with pathological correlation. Eur Radiol. 2013;23(8):2079–2086. doi:10.1007/s00330-013-2828-8
6. Pogoda K, Janmey PA. Glial tissue mechanics and mechanosensing by glial cells. Front Cell Neurosci. 2018;12:25. doi:10.3389/fncel.2018.00025
7. Lekka M, Gil D, Pogoda K, et al. Cancer cell detection in tissue sections using AFM. Arch Biochem Biophys. 2012;518(2):151–156. doi:10.1016/j.abb.2011.12.013
8. Engstrom TA, Pogoda K, Cruz K, Janmey PA, Schwarz JM. Compression stiffening in biological tissues: on the possibility of classic elasticity origins. Phys Rev E. 2019;99(5):052413. doi:10.1103/PhysRevE.99.052413
9. Janmey PA, Pogoda K. Compressive tumours cause neuronal damage. Nat Biomed Eng. 2019;3(3):171–172. doi:10.1038/s41551-019-0370-y
10. Georges PC, Hui JJ, Gombos Z, et al. Increased stiffness of the rat liver precedes matrix deposition: implications for fibrosis. Am J Physiol Gastrointest Liver Physiol. 2007;293(6):G1147–1154. doi:10.1152/ajpgi.00032.2007
11. Boyd NF, Li Q, Melnichouk O, et al. Evidence that breast tissue stiffness is associated with risk of breast cancer. PLoS One. 2014;9(7):e100937. doi:10.1371/journal.pone.0100937
12. Murphy MC, Huston J, Jack CR, et al. Decreased brain stiffness in Alzheimer’s disease determined by magnetic resonance elastography. J Magn Reson Imaging. 2011;34(3):494–498. doi:10.1002/jmri.22707
13. Streitberger KJ, Sack I, Krefting D, et al. Brain viscoelasticity alteration in chronic-progressive multiple sclerosis. PLoS One. 2012;7(1):e29888. doi:10.1371/journal.pone.0029888
14. Mitchell GF, Hwang SJ, Vasan RS, et al. Arterial stiffness and cardiovascular events: the Framingham Heart Study. Circulation. 2010;121(4):505–511. doi:10.1161/CIRCULATIONAHA.109.886655
15. Holtzmann K, Gautier HO, Christ AF, Guck J, Karadottir RT, Franze K. Brain tissue stiffness is a sensitive marker for acidosis. J Neurosci Methods. 2016;271:50–54. doi:10.1016/j.jneumeth.2016.07.002
16. Jain RK, Martin JD, Stylianopoulos T. The role of mechanical forces in tumor growth and therapy. Annu Rev Biomed Eng. 2014;16:321–346. doi:10.1146/annurev-bioeng-071813-105259
17. Seano G, Nia HT, Emblem KE, et al. Solid stress in brain tumours causes neuronal loss and neurological dysfunction and can be reversed by lithium. Nat Biomed Eng. 2019;3(3):230–245. doi:10.1038/s41551-018-0334-7
18. Nia HT, Liu H, Seano G, et al. Solid stress and elastic energy as measures of tumour mechanopathology. Nat Biomed Eng. 2016;1.
19. Stylianopoulos T, Martin JD, Chauhan VP, et al. Causes, consequences, and remedies for growth-induced solid stress in murine and human tumors. Proc Natl Acad Sci U S A. 2012;109(38):15101–15108. doi:10.1073/pnas.1213353109
20. Jamin Y, Boult JKR, Li J, et al. Exploring the biomechanical properties of brain malignancies and their pathologic determinants in vivo with magnetic resonance elastography. Cancer Res. 2015;75(7):1216–1224. doi:10.1158/0008-5472.CAN-14-1997
21. Pogoda K, Chin L, Georges PC, et al. Compression stiffening of brain and its effect on mechanosensing by glioma cells. New J Phys. 2014;16:075002. doi:10.1088/1367-2630/16/7/075002
22. Nicolle S, Lounis M, Willinger R, Palierne JF. Shear linear behavior of brain tissue over a large frequency range. Biorheology. 2005;42(3):209–223.
23. Chatelin S, Constantinesco A, Willinger R. Fifty years of brain tissue mechanical testing: from in vitro to in vivo investigations. Biorheology. 2010;47(5–6):255–276. doi:10.3233/BIR-2010-0576
24. Zemla J, Danilkiewicz J, Orzechowska B, Pabijan J, Seweryn S, Lekka M. Atomic force microscopy as a tool for assessing the cellular elasticity and adhesiveness to identify cancer cells and tissues. Semin Cell Dev Biol. 2018;73:115–124. doi:10.1016/j.semcdb.2017.06.029
25. Stylianou A, Lekka M, Stylianopoulos T. AFM assessing of nanomechanical fingerprints for cancer early diagnosis and classification: from single cell to tissue level. Nanoscale. 2018;10(45):20930–20945. doi:10.1039/C8NR06146G
26. Ansardamavandi A, Tafazzoli-Shadpour M, Omidvar R, Nili F. An AFM-based nanomechanical study of ovarian tissues with pathological conditions. Int J Nanomedicine. 2020;15:4333–4350. doi:10.2147/IJN.S254342
27. Ciasca G, Sassun TE, Minelli E, et al. Nano-mechanical signature of brain tumours. Nanoscale. 2016;8(47):19629–19643. doi:10.1039/C6NR06840E
28. Ciasca G, Mazzini A, Sassun TE, et al. Efficient spatial sampling for AFM-based cancer diagnostics: a comparison between neural networks and conventional data analysis. Condens Matter. 2019;4(2):58. doi:10.3390/condmat4020058
29. Minelli E, Ciasca G, Sassun TE, et al. A fully-automated neural network analysis of AFM force-distance curves for cancer tissue diagnosis. Appl Phys Lett. 2017;111(14):143701. doi:10.1063/1.4996300
30. Huml M, Silye R, Zauner G, Hutterer S, Schilcher K. Brain tumor classification using AFM in combination with data mining techniques. Biomed Res Int. 2013;2013:176519. doi:10.1155/2013/176519
31. Abramczyk H, Imiela A. The biochemical, nanomechanical and chemometric signatures of brain cancer. Spectrochim Acta A Mol Biomol Spectrosc. 2018;188:8–19. doi:10.1016/j.saa.2017.06.037
32. Venkatasubramanian RT, Grassl ED, Barocas VH, Lafontaine D, Bischof JC. Effects of freezing and cryopreservation on the mechanical properties of arteries. Ann Biomed Eng. 2006;34(5):823–832. doi:10.1007/s10439-005-9044-x
33. Duginski GA, Ross CJ, Laurence DW, Johns CH, Lee C-H. An investigation of the effect of freezing storage on the biaxial mechanical properties of excised porcine tricuspid valve anterior leaflets. J Mech Behav Biomed Mater. 2020;101:103438. doi:10.1016/j.jmbbm.2019.103438
34. Kirmizis D, Logothetidis S. Atomic force microscopy probing in the measurement of cell mechanics. Int J Nanomedicine. 2010;5:137. doi:10.2147/IJN.S5787
35. Elkin BS, Azeloglu EU, Costa KD, Morrison Iii B. Mechanical heterogeneity of the rat hippocampus measured by atomic force microscope indentation. J Neurotrauma. 2007;24(5):812–822. doi:10.1089/neu.2006.0169
36. Christ AF, Franze K, Gautier H, et al. Mechanical difference between white and gray matter in the rat cerebellum measured by scanning force microscopy. J Biomech. 2010;43(15):2986–2992. doi:10.1016/j.jbiomech.2010.07.002
37. Williams AS, Dakin Haché K. Variable fidelity of tissue‐marking dyes in surgical pathology. Histopathology. 2014;64(6):896–900. doi:10.1111/his.12328
38. Wen PY, Huse JT. 2016 World Health Organization classification of central nervous system tumors. Continuum (Minneap Minn). 2017;23(6,Neuro–oncology):1531–1547. doi:10.1212/CON.0000000000000536
39. Helmlinger G, Netti PA, Lichtenbeld HC, Melder RJ, Jain RK. Solid stress inhibits the growth of multicellular tumor spheroids. Nat Biotechnol. 1997;15(8):778–783. doi:10.1038/nbt0897-778
40. Chauhan VP, Boucher Y, Ferrone CR, et al. Compression of pancreatic tumor blood vessels by hyaluronan is caused by solid stress and not interstitial fluid pressure. Cancer Cell. 2014;26(1):14–15. doi:10.1016/j.ccr.2014.06.003
41. Barnes JM, Przybyla L, Weaver VM. Tissue mechanics regulate brain development, homeostasis and disease. J Cell Sci. 2017;130(1):71–82. doi:10.1242/jcs.191742
42. Sharp AA, Ortega AM, Restrepo D, Curran-Everett D, Gall K. In vivo penetration mechanics and mechanical properties of mouse brain tissue at micrometer scales. IEEE Trans Biomed Eng. 2009;56(1):45–53. doi:10.1109/TBME.2008.2003261
43. Morrison PF, Chen MY, Chadwick RS, Lonser RR, Oldfield EH. Focal delivery during direct infusion to brain: role of flow rate, catheter diameter, and tissue mechanics. Am J Physiol. 1999;277(4):R1218–1229. doi:10.1152/ajpregu.1999.277.4.R1218
44. Lekka M, Pabijan J. Measuring elastic properties of single cancer cells by AFM. Methods Mol Biol. 2019;1886:315–324.
45. Lekka M. Discrimination between normal and cancerous cells using AFM. Bionanoscience. 2016;6:65–80. doi:10.1007/s12668-016-0191-3
46. Pogoda K, Bucki R, Byfield FJ, et al. Soft substrates containing hyaluronan mimic the effects of increased stiffness on morphology, motility, and proliferation of glioma cells. Biomacromolecules. 2017;18(10):3040–3051. doi:10.1021/acs.biomac.7b00324
47. Curry N, Ghezali G, Kaminski Schierle GS, Rouach N, Kaminski CF. Correlative STED and atomic force microscopy on live astrocytes reveals plasticity of cytoskeletal structure and membrane physical properties during polarized migration. Front Cell Neurosci. 2017;11:104. doi:10.3389/fncel.2017.00104
48. Lee SM, Nguyen TH, Na K, et al. Nanomechanical measurement of astrocyte stiffness correlated with cytoskeletal maturation. J Biomed Mater Res A. 2015;103(1):365–370. doi:10.1002/jbm.a.35174
49. Miller WJ, Leventhal I, Scarsella D, Haydon PG, Janmey P, Meaney DF. Mechanically induced reactive gliosis causes ATP-mediated alterations in astrocyte stiffness. J Neurotrauma. 2009;26(5):789–797. doi:10.1089/neu.2008.0727
50. Nikkhah M, Strobl JS, Schmelz EM, Agah M. Evaluation of the influence of growth medium composition on cell elasticity. J Biomech. 2011;44(4):762–766. doi:10.1016/j.jbiomech.2010.11.002
51. Prabhune M, Belge G, Dotzauer A, Bullerdiek J, Radmacher M. Comparison of mechanical properties of normal and malignant thyroid cells. Micron. 2012;43(12):1267–1272. doi:10.1016/j.micron.2012.03.023
52. Cross SE, Jin YS, Rao J, Gimzewski JK. Nanomechanical analysis of cells from cancer patients. Nat Nanotechnol. 2007;2(12):780–783. doi:10.1038/nnano.2007.388
53. van Oosten ASG, Chen X, Chin L, et al. Emergence of tissue-like mechanics from fibrous networks confined by close-packed cells. Nature. 2019;573(7772):96–101. doi:10.1038/s41586-019-1516-5
54. Budday S, Nay R, de Rooij R, et al. Mechanical properties of gray and white matter brain tissue by indentation. J Mech Behav Biomed Mater. 2015;46:318–330. doi:10.1016/j.jmbbm.2015.02.024
55. van Dommelen JA, van der Sande TP, Hrapko M, Peters GW. Mechanical properties of brain tissue by indentation: interregional variation. J Mech Behav Biomed Mater. 2010;3(2):158–166. doi:10.1016/j.jmbbm.2009.09.001
56. Hughes JD, Fattahi N, Van Gompel J, et al. Higher-resolution magnetic resonance elastography in meningiomas to determine intratumoral consistency. Neurosurgery. 2015;77(4):653–659. doi:10.1227/NEU.0000000000000892
57. Reiss-Zimmermann M, Streitberger KJ, Sack I, et al. High resolution imaging of viscoelastic properties of intracranial tumours by multi-frequency magnetic resonance elastography. Clin Neuroradiol. 2015;25(4):371–378. doi:10.1007/s00062-014-0311-9
58. Kurt M, Wu L, Laksari K, et al. Optimization of a multifrequency magnetic resonance elastography protocol for the human brain. J Neuroimaging. 2019;29(4):440–446. doi:10.1111/jon.12619
59. Schregel K, Nazari N, Nowicki MO, et al. Characterization of glioblastoma in an orthotopic mouse model with magnetic resonance elastography. NMR Biomed. 2018;31(10):e3840. doi:10.1002/nbm.3840
60. Chauvet D, Imbault M, Capelle L, et al. In vivo measurement of brain tumor elasticity using intraoperative shear wave elastography. Ultraschall Med. 2016;37(6):584–590. doi:10.1055/s-0034-1399152
61. Pepin KM, McGee KP, Arani A, et al. MR Elastography Analysis of Glioma Stiffness and IDH1-Mutation Status. AJNR Am J Neuroradiol. 2018;39(1):31–36. doi:10.3174/ajnr.A5415
 © 2020 The Author(s). This work is published and licensed by Dove Medical Press Limited. The
full terms of this license are available at https://www.dovepress.com/terms
and incorporate the Creative Commons Attribution
- Non Commercial (unported, 3.0) License.
By accessing the work you hereby accept the Terms. Non-commercial uses of the work are permitted
without any further permission from Dove Medical Press Limited, provided the work is properly
attributed. For permission for commercial use of this work, please see paragraphs 4.2 and 5 of our Terms.
© 2020 The Author(s). This work is published and licensed by Dove Medical Press Limited. The
full terms of this license are available at https://www.dovepress.com/terms
and incorporate the Creative Commons Attribution
- Non Commercial (unported, 3.0) License.
By accessing the work you hereby accept the Terms. Non-commercial uses of the work are permitted
without any further permission from Dove Medical Press Limited, provided the work is properly
attributed. For permission for commercial use of this work, please see paragraphs 4.2 and 5 of our Terms.