Back to Journals » International Journal of Nanomedicine » Volume 9 » Issue 1
N-Succinyl-chitosan nanoparticles coupled with low-density lipoprotein for targeted osthole-loaded delivery to low-density lipoprotein receptor-rich tumors
Authors Zhang C, Zhu Q, Zhou Y, Liu Y, Chen W ![]() , Yuan Z, Yang S, Zhou X, Zhu A, Zhang X
, Yuan Z, Yang S, Zhou X, Zhu A, Zhang X ![]() , Jin Y
, Jin Y
Received 27 December 2013
Accepted for publication 15 February 2014
Published 13 June 2014 Volume 2014:9(1) Pages 2919—2932
DOI https://doi.org/10.2147/IJN.S59799
Checked for plagiarism Yes
Review by Single anonymous peer review
Peer reviewer comments 2
Chun-ge Zhang,*,1 Qiao-ling Zhu,*,1 Yi Zhou,*,1,2 Yang Liu,1 Wei-liang Chen,1 Zhi-Qiang Yuan,1 Shu-di Yang,1 Xiao-feng Zhou,3,4 Ai-jun Zhu,1 Xue-nong Zhang,*,1 Yong Jin*,5
1Department of Pharmaceutics, College of Pharmaceutical Sciences, Soochow University, Suzhou, 2The Children's Hospital of Wuxi People's Hospital, Nanjing Medical University, Wuxi, 3College of Radiological Medicine and Protection, Soochow University, Suzhou, 4Changshu Hospital of Traditional Chinese Medicine, Changshu, 5Invasive Technology Department, The Second Affiliated Hospital of Soochow University, Suzhou, People's Republic of China
*These authors contributed equally to this work
Abstract: N-Succinyl-chitosan (NSC) was synthesized and NSC nanoparticles (NPs) with loaded osthole (Ost) (Ost/NSC-NPs) were prepared by emulsion solvent diffusion. Subsequently, low-density lipoprotein (LDL)-mediated NSC-NPs with loaded Ost (Ost/LDL-NSC-NPs) were obtained by coupling LDL with Ost/NSC-NPs through amide linkage. The average particle size of Ost/NSC-NPs was approximately 145 nm, the entrapment efficiency was 78.28%±2.06%, and the drug-loading amount was 18.09%±0.17%. The release of Ost from Ost/NSC-NPs in vitro showed a more evident sustained effect than the native material. The half maximal inhibitory concentration of Ost/LDL-NSC-NPs was only 16.23% that of the free Ost at 24 hours in HepG2 cells. Ost inhibited HepG2 cell proliferation by arresting cells in the synthesis phase of the cell cycle and by triggering apoptosis. Cellular uptake and subcellular localization in vitro and near-infrared fluorescence real-time imaging in vivo showed that Ost/LDL-NSC-NPs had high targeting efficacy. Therefore, LDL-NSC-NPs are a promising system for targeted Ost delivery to liver tumor.
Keywords: liver cancer, targeting efficacy, antitumor activity
Introduction
Hepatic carcinoma is the third leading cause of cancer-associated deaths globally, and the related morbidity and mortality percentages are dramatically increasing.1,2 Moreover, no cure that is adequate, specific, and effective exists for hepatic carcinoma. Only a small portion of therapeutic drugs are absorbed by tumors; most drugs are distributed in normal tissues, which results in severe side effects on normal tissues during the process of eliminating cancer cells.3,4 Thus, the identification of novel, highly effective tumor-targeting drug delivery systems with few side effects is urgent.
Osthole (Ost) (7-methoxy-8-[3-methylpent-2-enyl] coumarin) is an active coumarin constituent isolated from the dried fruit of Cnidium monnieri (L.) Cusson.5–9 Ost has various pharmacological and biological applications, and current research is focused on its antitumor activity. Several previous studies have reported that Ost is effective in inducing cell apoptosis, arresting cell cycle, and inhibiting cell proliferation.10–13 However, Ost is water insoluble, poorly absorbed through oral administration, has low bioavailability, and is unstable when exposed to light, all of which limit the clinical application of Ost.14
Chitosan (CS) is the only natural cationic polysaccharide, with advantageous qualities such as satisfactory biocompatibility and biodegradability, as well as low immunogenicity and cytotoxicity. Accordingly, CS-based carriers are attracting increased interest as a component of targeted drug delivery systems.15–21 CS is insoluble within a neutral or basic pH range because of the formation of intramolecular and intermolecular hydrogen bonds. Water-soluble N-succinyl-CS (NSC) has been synthesized by introducing succinyl groups into the N-terminus of glucosamine units in CS, and the prepared NSC is found to be an ideal matrix for loading hydrophilic and bioactive biomacromolecules.22–25
Low-density lipoprotein receptor (LDLr) is widely found on the surface of various cells and tissues and is overexpressed in some malignant cells, such as hepatic carcinoma, acute myelocytic leukemia, colorectal carcinoma, and lung cancer.26,27 Low-density lipoprotein (LDL) is an endogenous nanoparticle (NP) with good biocompatibility, good biodegradability, and low immunogenicity. Moreover, LDL can avoid being identified and rapidly cleared by the reticuloendothelial system in vivo. Apolipoprotein B (ApoB) on the LDL surface is the ligand that binds to LDLr in hepatocytes. Thus, LDL is an ideal and potential ligand for actively targeting liver tumors.
This study aimed to develop a novel carrier for targeted Ost delivery to liver tumors. Ost/NSC-NPs and Ost/LDL-NSC-NPs were prepared and evaluated for particle size, entrapment efficiency (EE), and drug-loading (DL) amount. The release of Ost from Ost/NSC-NPs in vitro was measured in two media with different pH values. Furthermore, the antitumor activity of Ost/NSC-NPs and Ost/LDL-NSC-NPs on HepG2 cells and the underlying mechanism were investigated in vitro. Near-infrared (NIR) fluorescence real-time imaging was also performed in vivo to confirm the targeting characteristics of the two NPs.
Materials and methods
Materials
CS (deacetylation degree, 93.1%; molecular weight, 8–10 kDa) was provided by Xingcheng Biochemical Co, Ltd (Nantong, People’s Republic of China). Succinic anhydride was purchased from Aladdin Reagents (Shanghai, People’s Republic of China). Ost (purity, 98%) was supplied by Langze Pharmaceutical Science and Technology Co, Ltd (Nanjing, People’s Republic of China). Palmitic acid, 3-(4,5-dimethyl-2-thiazolyl)-2,5-diphenyl-2H-tetrazolium bromide (MTT), fluorescein isothiocyanate (FITC) isomer, and Hoechst 33258 were obtained from Sigma–Aldrich (St Louis, MO, USA). N-hydroxysuccinimide (NHS) and 1-(3-Dimethylaminopropyl)-3-ethylcarbodiimide hydrochloride (EDC·HCl) were purchased from Aladdin Reagents. Annexin V-FITC apoptosis detection kit and cell cycle and apoptosis analysis kits were purchased from Beyotime Institute of Biotechnology (Haimen, People’s Republic of China). RPMI 1640 medium and fetal bovine serum were purchased from HyClone (Logan, UT, USA). Sulfo-cyanine 7 (Cy7)-NHS ester was purchased from Lumiprobe Corporation (Hallandale Beach, FL, USA). All other materials were used without further treatment.
HepG2 cells were provided by Jiangsu Province Key Laboratory of Biotechnology and Immunology (Suzhou, People’s Republic of China). RPMI 1640 medium containing 10% fetal bovine serum was used for cell culture. HepG2 cells were cultivated at 37°C with 5% CO2 until the confluence reached 75%.
Four-week-old nude mice were purchased from the Experimental Animal Center, Soochow University (Suzhou, People’s Republic of China). All animals were fed according to the requirements of the National Institutes of Health guidelines for the care and use of laboratory animals, and procedures were performed in compliance with the guidelines of the Institutional Animal Care.
Preparation of LDL sample
LDL (1.019–1.063 g·mL−1) was isolated from fresh human plasma using a previously reported method and then quantified by Bradford assay.28 The obtained LDL sample was stored at 4°C for less than 2 weeks before use.
Synthesis of NSC
NSC was synthesized as previously reported.29 In a typical procedure, 2 g (12 mmol) of CS and 2 g (20 mmol) of succinic anhydride were added to 40 mL of dimethyl sulfoxide at room temperature with stirring. The mixture was placed in a 60°C oil bath, and the chemicals were allowed to react for 6 hours. After leaving the mixture undisturbed overnight and then filtered, the obtained precipitate was immersed in ethanol for 6 hours. The precipitate was filtered again and dissolved in distilled water, after which sodium hydroxide solution was added with stirring until pH 10.0 was reached. The solution was filtered, and the filtrate was precipitated using triple-volume acetone. The precipitate from this reaction was filtered and washed twice with ethanol (70%) and acetone. The final product was subsequently dried in a vacuum.
Preparation of Ost/NSC-NPs and Ost/LDL-NSC-NPs
Ost/NSC-NPs were prepared by the emulsion solvent diffusion method. In a typical procedure, 0.1 g of NSC and 0.3 g of poloxamer 188 were added to 50 mL of distilled water with magnetic stirring (500 rpm) at 40°C. Exactly 0.02 g of Ost was dissolved in 10 mL of methylene chloride and acetone (3:1, v/v) containing 0.03 g of granulesten. Subsequently, the organic phase was added to the NSC solution with stirring. After approximately 20 minutes, the organic solvent was volatilized, and Ost/NSC-NP solution was obtained.
Ost/LDL-NSC-NPs were prepared by coupling with LDL and NSC-NPs. In a typical procedure, 0.029 g of EDC·HCl, 0.017 mg of NHS, and 1 mL of LDL were added to 50 mL of the prepared Ost/NSC-NP samples. The pH of the mixture was adjusted to 5.6, and then the mixture was stirred (500 rpm) at 37°C for 4 hours to produce Ost/LDL-NSC-NPs.
Evaluation of NSC-NPs
Dynamic light scattering (PSS Company, Port Richey, FL, USA) was used to measure the particle size and zeta potential of NPs. Transmission electron microscopy (TEM) (FEI, Hillsboro, OR, USA) and atomic force microscopy (AFM) (Bruker, Billerica, MA, USA) were used to determine the morphology of NPs.
A reverse-phase high-performance liquid chromatography (HPLC) system (Agilent Technologies, Santa Clara, CA, USA) was used to measure the EE and DL of Ost. The NP solution was ultracentrifuged (40,000 rpm) for 45 minutes at 4°C, and the supernatant was reserved for detection. The detection wavelength was set at 322 nm, and the column temperature was set at 25°C. The mobile phase contained acetonitrile and water (60:40, v/v) at a flow velocity of 1 mL·min−1 . The EE and DL were calculated as follows:

where C1 is the total Ost concentration detected in the NPs solution, C2 is the Ost concentration measured in the supernatant, V is the actual volume of prepared NPs solution, and Wc is the theoretical amount of NSC added.
Drug release assay in vitro
The concentrations of Ost released from Ost/NSC-NPs or Ost solution in vitro were measured by HPLC. In a typical procedure, 5 mL of Ost/NSC-NP solution was added to dialysis tubing (molecular weight cut off 3500) and subsequently placed inside a jar containing 50 mL of phosphate-buffered saline (PBS) (pH 5.4 and 7.4, containing 1% sodium dodecyl sulfate). The jar was maintained at 37°C±0.5°C with gentle shaking for 48 hours. At a preset time, 100 μL aliquots were removed from the jar and replaced with 100 μL of fresh black medium. The Ost solution was handled the same way as the control. The amount of Ost released from the formulations and the total amount of Ost in the formulations were detected by HPLC. The ratio was used to calculate the cumulative release percentage.
In vitro cytotoxicity assay
MTT assay was used to determine in vitro cell cytotoxicity. In a typical procedure, HepG2 cells were seeded onto a 96-well plate (1×10⁴ cells/well). After incubation for 24 hours, the cells were treated with 100 μL of samples (Ost, Ost/NSC-NPs, Ost/LDL-NSC-NPs, NSC-NPs, and LDL-NSC-NPs) with a series of concentrations for 24 hours. Subsequently, 20 μL of MTT solution (5 mg·mL−1) was added, and the cells were cultivated for another 4 hours. Finally, the culture medium was removed, and 100 μL of dimethyl sulfoxide was added to each well. The absorbance of each well at 570 nm was measured by enzyme immunoassay. The in vitro cell cytotoxicity was calculated as follows:

where ODcontrol was obtained in the absence of samples, and ODsample was obtained in the presence of samples. Each value was the average of five parallel experiments.
Cell apoptosis assays
Cells were initially checked by Hoechst 33258 staining to identify the morphological characteristics of the nucleus. In a typical procedure, HepG2 cells were seeded onto six-well plates (1×10⁵ cells/well) and incubated for 48 hours. When the confluence of the cells reached approximately 75%, the culture medium was removed, and cells were treated with 1 mL of Ost (100 μg·mL−1; Ost, Ost/NSC-NPs, and Ost/LDL-NSC-NPs) and blank (NSC-NPs and LDL-NSC-NPs) formulations for 48 hours. Subsequently, the medium was removed, and 0.5 mL of 4% formaldehyde was added to the well, and cells were fixed for 10 minutes at room temperature. Finally, cells were stained by Hoechst 33258 (10 mg·mL−1) for 10 minutes and washed twice with cold PBS. The morphology of the nucleus was observed under a fluorescent microscope (Olympus Corporation, Tokyo, Japan).
Flow cytometry was also used to detect cell apoptosis by staining with Annexin V-FITC. HepG2 cells were seeded onto six-well plates (1×10⁵ cells/well), incubated for 48 hours, and treated with 1 mL of Ost (100 μg·mL−1; Ost, Ost/NSC-NPs, and Ost/LDL-NSC-NPs) and blank (NSC-NPs and LDL-NSC-NPs) formulations for 24 hours. The cells were stained by the Annexin V-FITC apoptosis detection kit according to the manufacturer’s instructions. Finally, the stained cells were washed twice with cold PBS and analyzed using a flow cytometry FCM FC500 system (Beckman Coulter Inc., Brea, CA, USA).
Cell cycle assay
HepG2 cells were seeded onto six-well plates (1×10⁵ cells/well), cultured for 48 hours, and treated with 1 mL of Ost (100 μg·mL−1; Ost, Ost/NSC-NPs, and Ost/LDL-NSC-NPs) and blank (NSC-NPs and LDL-NSC-NPs) formulations for 24 hours. After incubation, the treated and blank cells were trypsinized and collected, washed twice with cold PBS, and treated with cell cycle and apoptosis analysis kits according to the manufacturer’s instructions. DNA content was detected using FCM-FC500 (Beckman Coulter Inc.).
Cellular uptake
To synthesize FITC-labeled NSC, 5 mg of FITC and 150 mg of NSC were added to 30 mL of phosphate buffer (pH 9.12), and the reaction was allowed to progress for 24 hours with stirring. The mixture was dialyzed for 3 days, and the purified product was freeze dried. Ost/FITC-NSC-NPs and Ost/FITC-LDL-NSC-NPs were prepared as described above. The entire procedure was performed in the dark.
HepG2 cells were seeded onto six-well plates (1×10⁵ cells/well), incubated for 48 hours and treated with Ost/FITC-NSC-NPs and Ost/FITC-LDL-NSC-NPs (both at 100 μg·mL−1) for 24 hours. Cells were trypsinized and collected at preset time points (30 minutes, 1 hour, and 3 hours), after which the cells were washed twice with cold PBS. Cell fluorescence was detected by flow cytometry.
Subcellular localization of NPs
In vitro subcellular localization of the NPs was visualized by confocal laser scanning microscopy (CLSM) (TCS-SP2; Leica Microsystems, Wetzlar, Germany). Cover slips were placed on six-well plates, and cells were cultured over the slips (1×10⁵ cells/well) for 24 hours. Cells were treated with Ost/FITC-NSC-NPs and Ost/FITC-LDL-NSC-NPs (both at 100 μg·mL−1) for defined time points (30 minutes, 1 hour, and 3 hours) and were fixed with 4% formaldehyde for 10 minutes. Nuclei were stained with 0.5 mL of Hoechst 33258 (10 μg·mL−1) for 10 minutes. Cells were then washed three times with cold PBS, and the slides were imaged by CLSM.
Uptake process of NPs observed by AFM
Cover slips were placed on six-well plates, and cells were cultured over the slips (1×10⁵ cells/well) for 48 hours. After treating with Ost/LDL-NSC-NPs for 4 hours, cells were washed three times with cold PBS and fixed with 4% formaldehyde. Micrographs were obtained by AFM.
NIR fluorescence real-time imaging in vivo
To synthesize Cy7-labeled NSC, 0.25 mg of sulfo-Cy7-NHS ester and 50 mg of NSC were added to carbonate buffer (pH 8.3) and reacted for 24 hours with stirring. The mixture was dialyzed for 3 days, and the purified product was freeze dried. Ost/Cy7-NSC-NPs and Ost/Cy7–LDL-NSC-NPs were prepared as described above. The entire process was performed in the dark.
HepG2 cells (2×10⁶) were administered by subcutaneous injection into the forelimb of nude mice. When the volume of the subcutaneous transplanted tumor reached approximately 50–100 mm3, Ost/Cy7-NSC-NPs and Ost/Cy7–LDL-NSC-NPs were injected into nude mice with HepG2 tumor via the tail vein. In preset time points (1, 3, 24, 48, and 72 hours) after injection with NPs, fluorescent distribution was imaged with an in vivo imaging system (IVIS Lumina II; Caliper Life Sciences, Hopkinton, MA, USA). Nude mice with tumors were sacrificed, and the major organs were collected at 72 hours. Organs were washed three times with PBS and examined with an in vivo imaging system.
Statistical methodology
All data are shown as the mean ± standard deviation. Statistical analysis was performed by one-factor analysis of variance (SPSS 16; SPSS, IBM Corporation, Armonk, NY, USA). Data were considered to be statistically significant at P<0.05.
Results and discussion
Synthesis and characterization of NSC
The synthesis scheme and the proposed mechanism of NPs for tumor targeting are presented in Figure 1. The Fourier transform infrared spectroscopy spectra of CS and NSC are shown in Figure 2. The CS spectrum shows distinctive amide absorptions at 1,638 cm−1 and 1,561 cm−1. Regarding the NSC spectrum, the amide peaks strengthened, and a new peak assigned to –COOH in succinyl appeared at 1,725 cm−1. The proton nuclear magnetic resonance (1H NMR) spectra of CS and NSC are shown in Figure 3. The 1H NMR assignments of NSC were as follows: 1H NMR (deuterium [D2O]) δ =1.90 ppm (NH[CO]CH3); δ =2.23–2.48 ppm (CH2CH2 of succinyl); δ =2.60 ppm (H-2 of d-glucosamine unit); δ =3.53–3.77 ppm (H-3, H-4, H-5, H-6, H-6′ of d-glucosamine unit), δ =4.58 ppm (H-1 of d-glucosamine unit). Based on the ratio of the integral peak of H in succinyl to H-2 in the d-glucosamine unit, the succinylation degree of NSC was 48.8%.
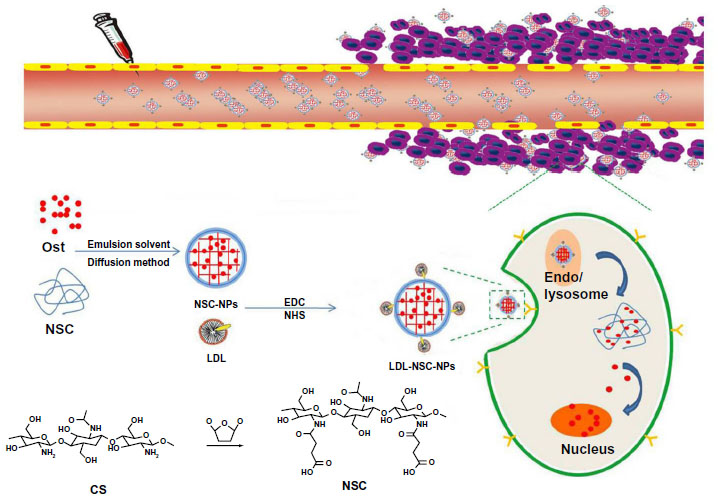 | Figure 1 Schematic of the synthesis and mechanism of nanoparticles for tumor targeting. |
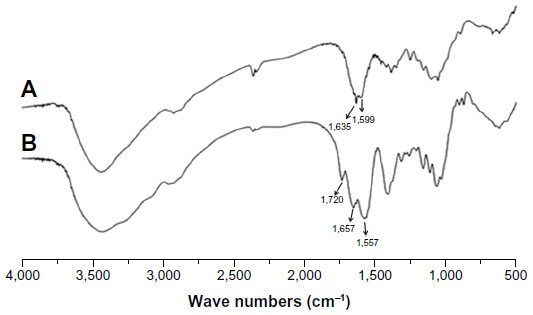 | Figure 2 FTIR spectra of CS (A) and NSC (B). |
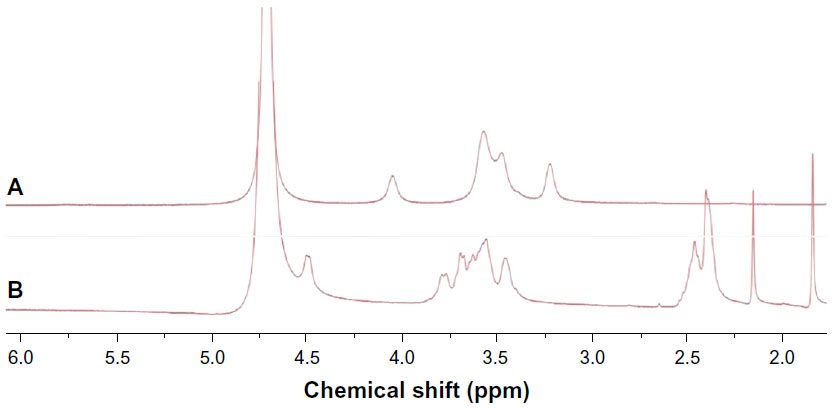 | Figure 3 1H-NMR spectra of CS (A) in D2O and DCL (9:1, v/v) and of NSC (B) in D2O. |
Preparation and evaluation of NPs
Ost/NSC-NPs were prepared through the emulsion solvent diffusion method. The EE and DL were 78.28%±2.06% and 18.09%±0.17%, respectively. The average particle size and zeta potential were around 145 nm (polydispersity index <0.3) and −37.08±1.95 mV, respectively.
The standard curve equation of Ost was A = 99.973C – 72.111 (R2=0.9992), and the detected linear range was from 2–25 μg·mL−1. Meanwhile, the recovery and precision of the detection method agreed with the requirement of sample analysis in vitro.
The morphological characteristics of Ost/NSC-NPs were observed by TEM (Figure 4A) and AFM (Figure 4B). The NP size was approximately 120 nm. Most NPs were uniform, round, and appeared separated from one another. The size of Ost/NSC-NPs observed by TEM and AFM were smaller than the size obtained by dynamic light scattering. The difference in the results may be due to the dehydration and shrinkage of NPs in the process of preparing samples for detection.
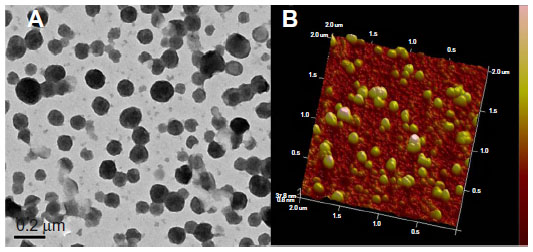 | Figure 4 Morphology and particle size of Ost/NSC-NPs as shown by TEM (A) and AFM (B). |
Most of the fenestrated sinusoids in the liver were smaller than 200 nm, and the tumor vessels were not as developed as normal vessels. Consequently, fenestrated liver sinusoid permeability increased, and appropriately sized NPs passed through the tumor vessels and remained in the tumor.29 The prepared Ost/NSC-NPs accumulated in the tumor site through the enhanced permeability and retention effect because the average particle size of the NPs was smaller than the gap in the tumor vessel wall. Additionally, ApoB on the surface of LDL was recognized and found to be bound to LDLr, which was overexpressed in hepatocytes. This finding led to a high positive liver targeting potential of Ost/LDL-NSC-NPs.
In vitro drug release assay
The data of Ost released from formulations are shown in Figure 5. Almost all drugs were released from Ost solution at 8 hours in PBS (pH 5.3) and 12 hours in PBS (pH 7.4). The release rate of Ost from Ost/NSC-NPs was initially rapid, maintained a sustained pace, and then slowly proceeded toward the end. Only approximately 75% of Ost was released in 24 hours. In addition, Ost was more quickly released in pH 5.3 PBS than in pH 7.4 PBS, which was advantageous for tumor treatment because the tumor pH is lower than the pH of normal tissue.
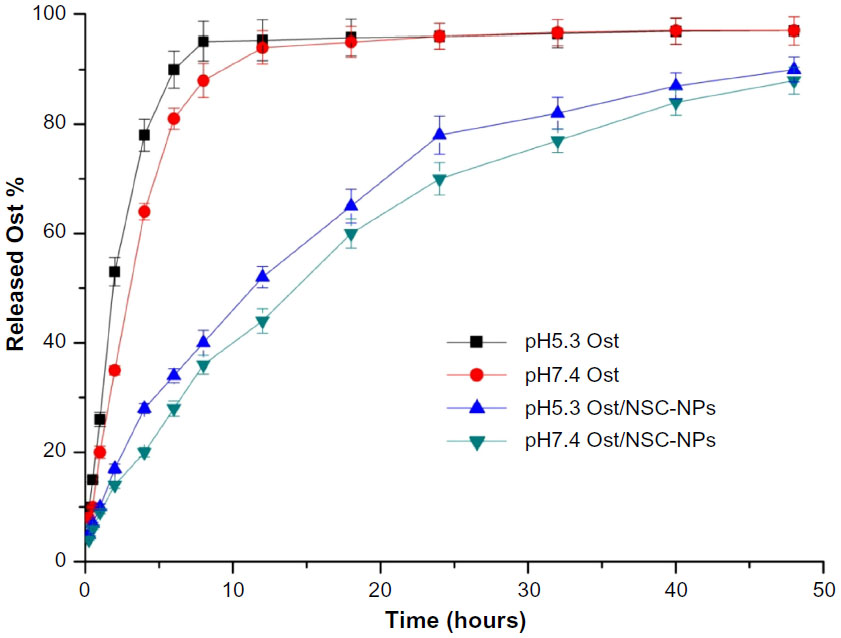 | Figure 5 In vitro release of Ost from nanoparticles in various media compared with Ost alone. |
Cytotoxicity assay in vitro
The in vitro cytotoxicities of different Ost formulations, including Ost, Ost/NSC-NPs, and Ost/LDL-NSC-NPs, to HepG2 cells were examined by the MTT assay (Figure 6). All Ost formulations inhibited HepG2 cell proliferation in a dose-dependent manner. Among the Ost formulations, Ost/LDL-NSC-NPs exerted the strongest inhibitory effect at various concentrations. The half maximal inhibitory concentration values of Ost, Ost/NSC-NPs, and Ost/LDL-NSC-NPs were 228.40, 50.02, and 37.09 μg·mL−1, respectively. The inhibition rates showed statistically significant differences among the Ost formulations. The cytotoxicity of Ost/LDL-NSC-NPs significantly increased, indicating that ApoB on LDL was recognized by LDLr on HepG2 cells and facilitated the NP uptake. Consequently, the intracellular drug concentration increased. Two blank NPs (NSC-NPs and LDL-NSC-NPs) had little inhibitory activity at low concentrations but displayed certain cytotoxicity at high concentrations, whereas no statistically significant difference existed between them. However, NPs with loaded-Ost exhibited greater inhibitory activity than that of the sum of Ost and its carrier. This result indicated synergistic cytoxicity between Ost and its corresponding blank carrier.
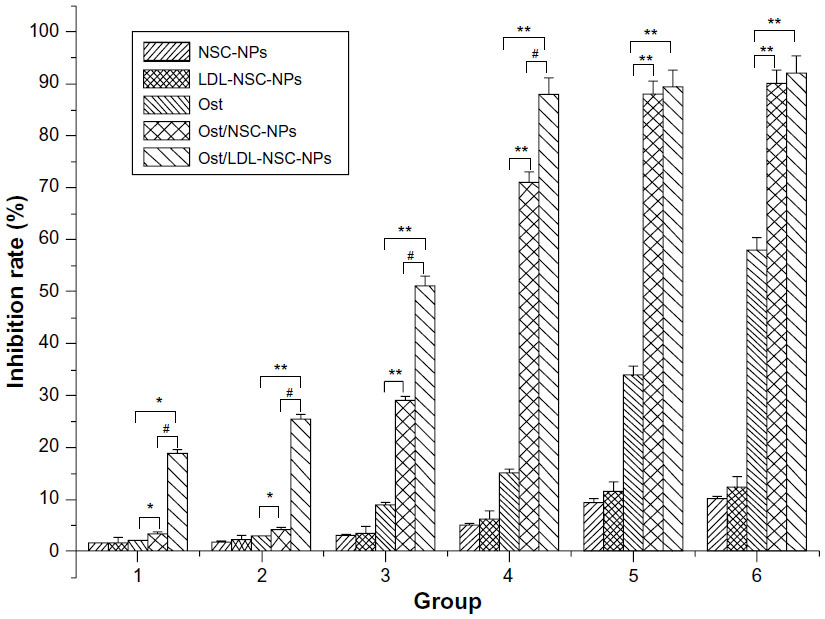 | Figure 6 Cytotoxic effects of various formulations against HepG2 in vitro. |
Cell apoptosis assays
The morphological characteristics of cell nucleus as measured by fluorescence microscopy are presented in Figure 7. The nuclei of untreated cells (Figure 7A) and cells treated with blank NPs (NSC-NPs [Figure 7B] and LDL-NSC-NPs [Figure 7C]) displayed homogeneous fluorescence after Hoechst 33258 staining. However, nuclei were segmented into dense nuclear parts after treatment with various Ost formulations. Compared with Ost (Figure 7D) and Ost/NSC-NPs (Figure 7E), Ost/LDL-NSC-NPs (Figure 7F) produced more apoptotic bodies. This result confirmed that the apoptosis pathway was one mechanism by which Ost induced HepG2 cell death.
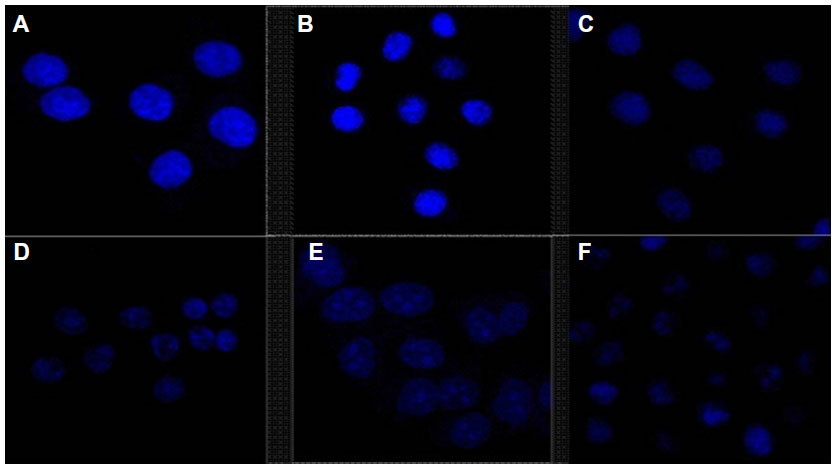 | Figure 7 Effects of Ost, Ost/NSC-NPs, and Ost/LDL-NSC-NPs on HepG2 apoptosis. |
Early apoptosis and necrosis induced by various Ost formulations can be distinguished through Annexin V–FITC/propidium iodide (PI) staining and measured by flow cytometry (Figure 8). Ost/LDL-NSC-NPs (Figure 8F) caused the highest percentage of apoptosis among the test treatments, followed by Ost/NSC-NPs (Figure 8E) and by Ost (Figure 8D). No obvious apoptosis was found after treatment with the two types of blank NPs (NSC-NPs [Figure 8B] and LDL-NSC-NPs [Figure 8C]) as well as control cells (Figure 8A). The percentages of early apoptosis induced by Ost formulations are shown in Figure 9.
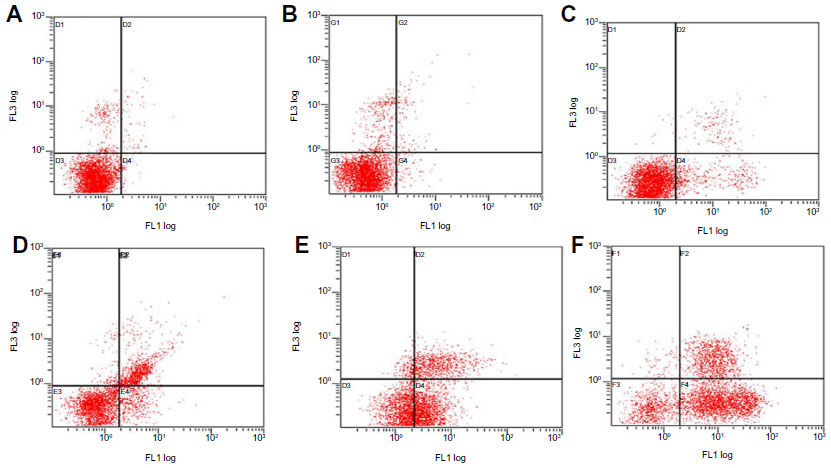 | Figure 8 Apoptosis was also verified through flow cytometry. |
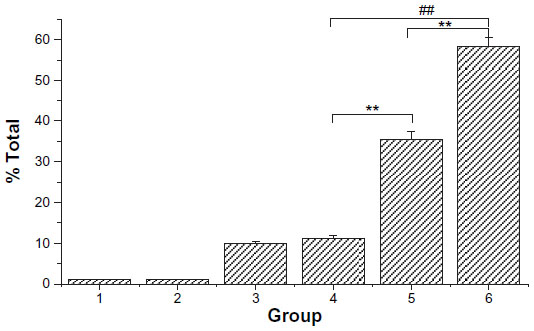 | Figure 9 Percentage of early apoptosis induced by Ost formulations. |
Results of the MTT assay and cellular nucleus staining revealed the following: Ost encapsulated in NPs exhibited a slow release rate and maintained intracellular drug concentration at a certain time, which was beneficial for inhibiting the proliferation of HepG2 cells. NPs with LDL facilitated the uptake of more Ost by cells, thereby inducing higher cytotoxicity than other Ost formulations.
Cell cycle assay
To determine whether Ost arrested cell cycle in addition to apoptosis induction, HepG2 cells at different stages of the cell cycle were identified by PI staining and subsequently measured by flow cytometry (Figure 10 and Table 1). A Sub-G0 peak was evident after treatment with the three Ost formulations, further confirming that Ost induced HepG2 cell death. The result also revealed that the three Ost formulations arrested HepG2 cells in the synthesis phase to different extents. Compared with Ost (Figure 10D) and Ost/NSC-NPs (Figure 10E), Ost/LDL-NSC-NPs (Figure 10F) showed the strongest cell-cycle arresting ability. No significant cell-cycle arrest was found in cells treated with blank NPs, namely, NSC-NPs (Figure 10B) and LDL-NSC-NPs (Figure 10C) as well as control cells (Figure 10A). These results may indicate that higher Ost intracellular uptake mediated by LDL peptide corresponded with a stronger ability to arrest the cell cycle.
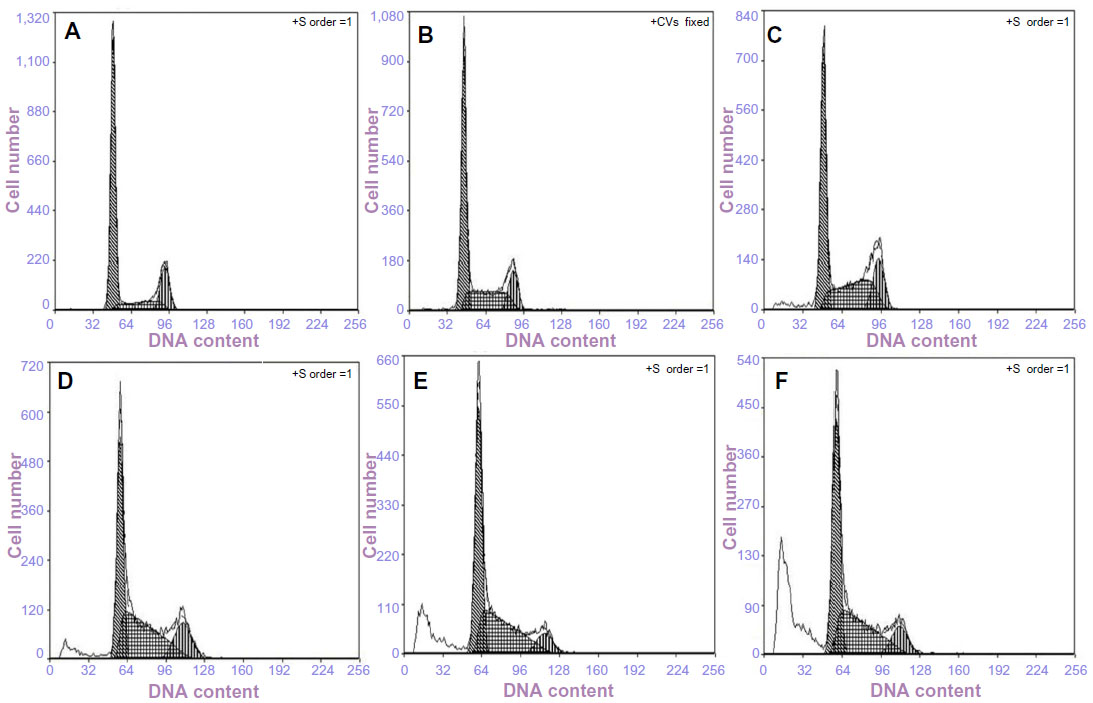 | Figure 10 Analysis of DNA content in cell cycle using a flow cytometer. |
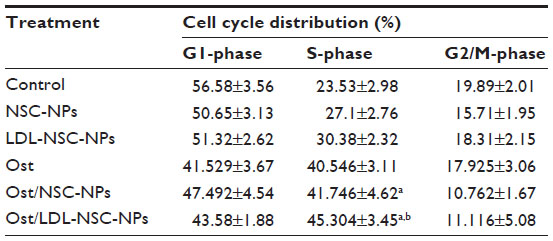 | Table 1 Percentage of HepG2 cells in various phases of the cell cycle after incubation with various Ost formulations (equivalent Ost concentration =100 μg·mL−1) |
Cellular uptake
The cellular uptake amount of NPs was evaluated by FITC labeling. Figure 11 shows the intracellular uptake characteristics of Ost/FITC-NSC-NPs and Ost/FITC-LDL-NSC-NPs after 30 minutes, 1 hour, and 3 hours of treatment. No significant difference in cellular uptake amount was observed between the two NPs at 30 minutes. However, significantly more cellular uptake was observed with Ost/FITC-LDL-NSC-NPs treatment than Ost/FITC-NSC-NPs at 1 hour, suggesting that LDL on the particle surface interacted with LDLr, which was overexpressed on HepG2 cells. Subsequently, a significant increase in intracellular Ost concentration was observed. Almost all cells were positive after the 3 hours treatment for both NPs, which may be due to the drug uptake reaching the saturation point.
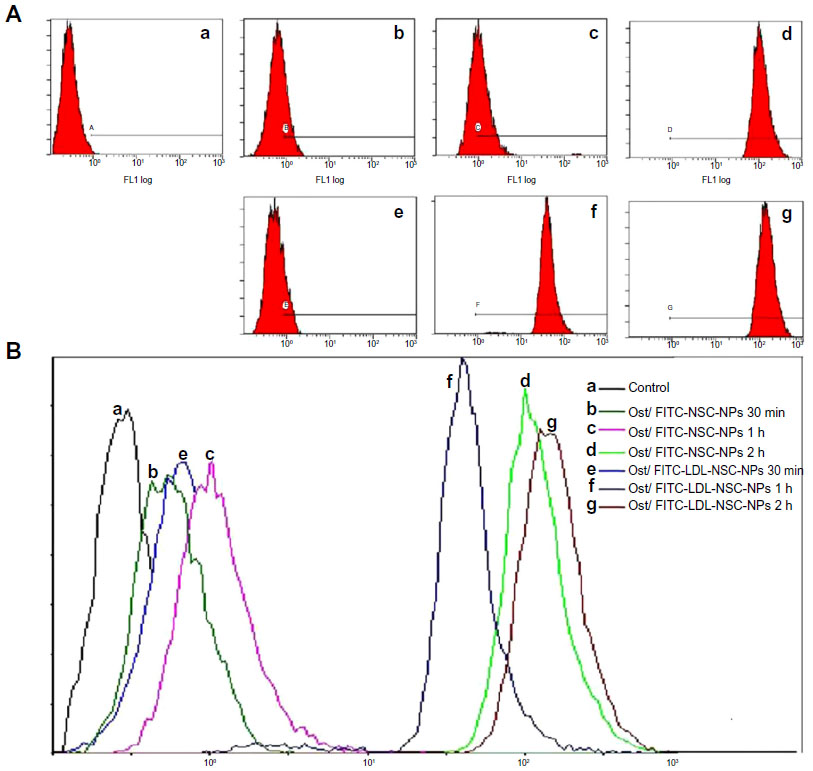 | Figure 11 Flow cytometry analysis of drug uptake. |
Subcellular localization of NPs
The subcellular localization characteristics of two types of NPs were also investigated by FITC labeling. Fluorescence intensity was detected by CLSM (Figure 12). Cell nuclei were stained with Hoechst 33258 and appeared as blue fluorescence, whereas NPs were labeled by FITC and appeared as green fluorescence. After 30 minutes of incubation, both NPs partly appeared in the cytoplasm at 1 hour. Ost/FITC-LDL-NSC-NPs were found partly localized in the nucleus, whereas almost all Ost/FITC-NSC-NPs were still in the cytoplasm. The fluorescence intensity in HepG2 cells treated with the two NPs increased, and fluorescence in the nucleus increased with increased incubation time, indicating that the cellular uptake of both NPs was time dependent. In addition, the intensity of fluorescence in HepG2 cells incubated with Ost/FITC-LDL-NSC-NPs was higher than Ost/FITC-NSC-NPs at any time ranging from 30 minutes to 3 hours. These results were consistent with the experimental findings on cellular uptake, ie, the interaction between LDL- and LDLr-facilitated NPs taken up by HepG2 cells.
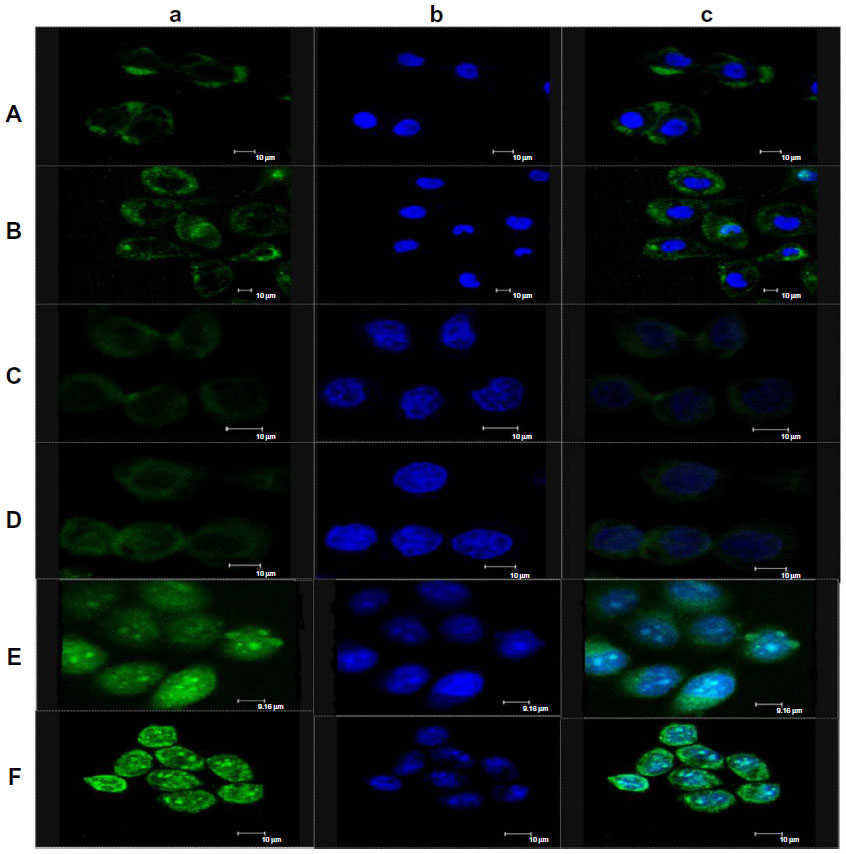 | Figure 12 Subcellular localization of different FITC-labeled NPs evaluated by confocal laser scanning microscopy after incubation with (A) Ost/FITC-NSC-NPs, 30 minutes; (B) Ost/FITC-LDL-NSC-NPs, 30 minutes; (C) Ost/FITC-NSC-NPs, 1 hour; (D) Ost/FITC-LDL-NSC-NPs, 1 hour; (E) Ost/FITC-NSC-NPs, 3 hours; and (F) Ost/FITC-LDL-NSC-NPs, 3 hours. |
Uptake process of NPs observed by AFM
The cellular uptake process of Ost/LDL-NSC-NPs was investigated by AFM (Figure 13). The surface morphology of HepG2 cells without any treatment was found to be relatively flat, as shown in Figure 13A. Cell surface incubated with NPs for 4 hours presented multiple depressions (Figure 13B). These changes indicated that endocytosis was the pathway by which NPs were taken up by cells.
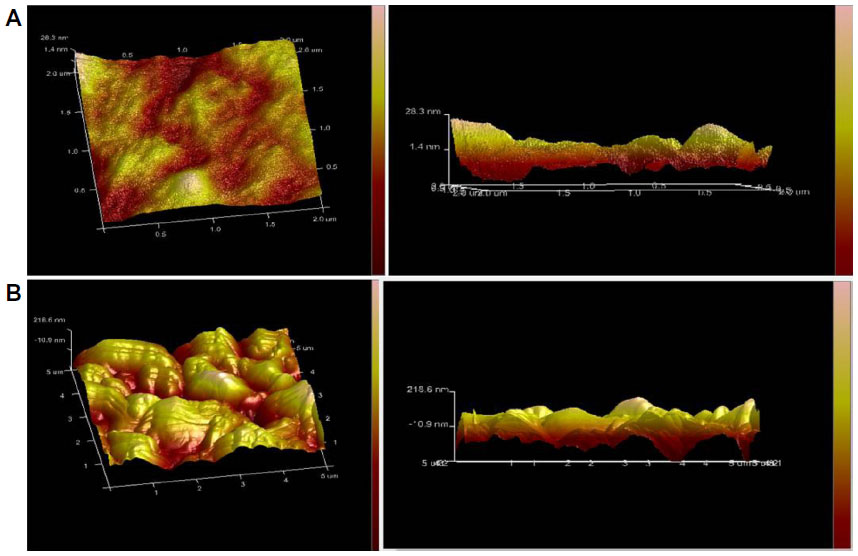 | Figure 13 Atomic force microscopy image of HepG2 cells. |
Statistical analysis was performed on the height of the cell surface (Figure 14). Figure 14A shows that the height of the cell surface mostly ranged between 22–30 nm without any treatment. The height of the cell surface was mostly between 150–200 nm after incubation with NPs for 4 hours, as shown in Figure 14B. The height change between Figure 14A and B fitted the particle sizes of the NPs, suggesting adsorptive endocytosis induced by the interaction of NPs with HepG2 cell membrane. Hence, NPs were taken up by the cells through an endocytosis pathway.
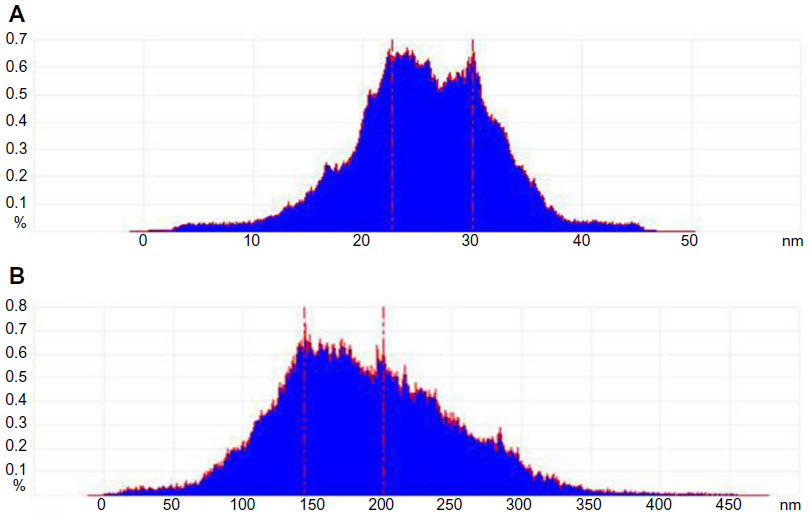 | Figure 14 Size distribution histogram of protrusions on HepG2 cells. |
NIR multispectral fluorescence real-time imaging in vivo
The potential targeting effect of NSC-NPs and LDL-NSC-NPs was evaluated by Cy7 labeling. After injecting Cy7-labeled NPs through the tail vein, the fluorescence of NPs in tumor-bearing nude mice was measured by in vivo multispectral NIR fluorescent imaging. The time-dependent biodistributions of two NPs were imaged from 1 hour to 72 hours postinjection. Beyond 72 hours postinjection, both NPs were mostly located in the tumor site, suggesting that NPs gathered in the tumor region through an enhanced permeability and retention effect (Figure 15A). Meanwhile, higher intensity of NIR fluorescence in live tumor-bearing nude mice was observed after treatment with LDL-NSC-NPs compared with that of NSC-NPs at any time after injection (Figure 15A and B), indicating that the specific interaction of LDL with LDLr increased the accumulation of NPs in the tumor region. The intensity of NIR fluorescence in the tumor and major organs 72 hours postinjection also indicated that more LDL-NSC-NPs accumulated in tumor tissue compared with NSC-NPs. Additionally, the intensities of NIR fluorescence in liver and spleen treated with LDL-NSC-NPs were lower compared than the intensities under treatment with NSC-NPs (Figure 15C and D). Thus, NPs with LDL can easily accumulate in tumor tissue and can avoid being quickly metabolized by the liver and spleen.
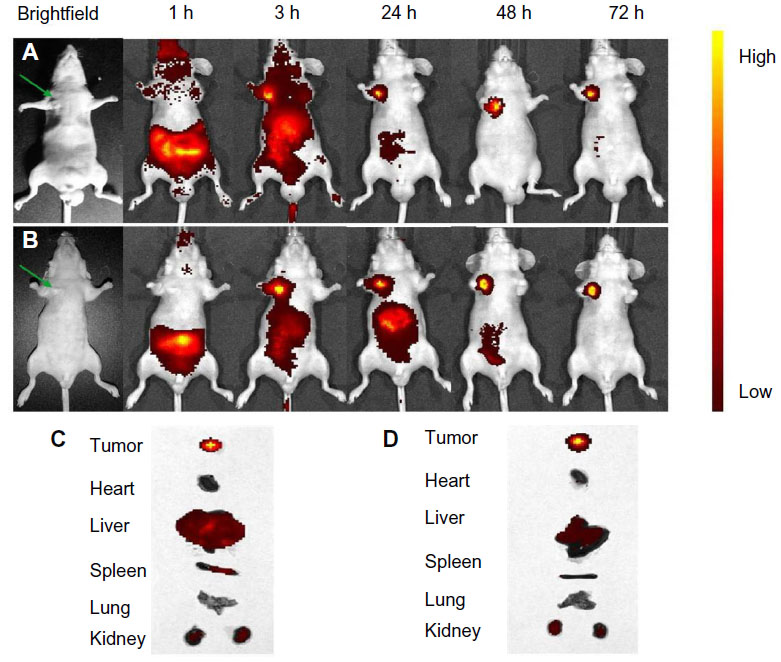 | Figure 15 In vivo fluorescence imaging of subcutaneous tumor-bearing nude mice after intravenous injection of Cy7-labeled NSC-NPs (A) and Cy7-labeled LDL-NSC-NPs (B). |
Tumor targeting can be classified as active and passive. Active targeting occurs only after NPs passively accumulate in the tumor. In this study, structural changes in the vascular wall and incomplete development of lymphoid tissue in a solid tumor were attributed to NP accumulation. NPs that permeated the tumor were not drained and remained in the tumor tissues. The recognition and interaction of LDL and LDLr on the surface of HepG2 cells facilitated NP absorption by cells through endocytosis.
Conclusion
A new liver-targeting carrier (Ost/LDL-NSC-NPs) based on water-soluble NSC was synthesized and characterized to have a stable EE and high DL. Ost formulations induced cell apoptosis and arrested the cell cycle at the synthesis phase. Encapsulating Ost into NPs enhanced the pathway. Ost/LDL-NSC-NPs induced the highest percentage of apoptosis and showed the strongest ability to arrest the cell cycle with increased intracellular Ost concentration. This result agreed with the experimental findings on cellular uptake and in vitro cytotoxicity. CLSM images showed that NPs can be localized in the nuclei in a time-dependent manner. The tumor targeting of Ost/LDL-NSC-NPs in a subcutaneous tumor-bearing nude model was observed using an NIR multispectral fluorescence real-time imaging system. Thus, LDL-NSC-NPs were a potential drug delivery system for targeted Ost and other similar hydrophobic drugs to liver tumor.
Acknowledgments
This work was supported by the National Natural Science Foundation of China projects (No 81273463), the Jiangsu Science and Technology Support Plan (BE2011670), the National Student and Innovative experimental plan (111028533, microcomputer number: 5731503311), and the Priority Academic Program Development of Jiangsu Higher Education Institutions.
Author contributions
The authors contributed equally to this paper.
Disclosure
The authors report no conflicts of interest in this work.
References
Befeler AS, Di Bisceglie AM. Hepatocellular carcinoma: diagnosis and treatment. Gastroenterology. 2002;122(6):1609–1619. | |
Bruix J, Llovet JM. Prognostic assessment and evaluation of the benefits of treatment. J Clin Gastroenterol. 2002;35(5 Suppl 2):S138–S142. | |
Cheong I, Huang X, Bettegowda C, et al. A bacterial protein enhances the release and efficacy of liposomal cancer drugs. Science. 2006;314(5803):1308–1311. | |
Moghimi SM, Hunter AC, Murray JC. Nanomedicine: current status and future prospects. FASEB J. 2005;19(3):311–330. | |
Liang HJ, Suk FM, Wang CK, et al. Osthole, a potential antidiabetic agent, alleviates hyperglycemia in db/db mice. Chem Biol Interact. 2009;181(3):309–315. | |
Ming LG, Zhou J, Cheng GZ, Ma HP, Chen KM. Osthol, a coumarin isolated from common cnidium fruit, enhances the differentiation and maturation of osteoblasts in vitro. Pharmacology. 2011;88(1–2):33–43. | |
Nakamura T, Kodama N, Arai Y, et al. Inhibitory effect of oxycoumarins isolated from the Thai medicinal plant Clausena guillauminii on the inflammation mediators, iNOS, TNF-alpha, and COX-2 expression in mouse macrophage RAW 264.7. J Nat Med. 2009;63(1):21–27. | |
He Y, Qu S, Wang J, et al. Neuroprotective effects of osthole pretreatment against traumatic brain injury in rats. Brain Res. 2012;1433:127–136. | |
Hsieh MT, Hsieh CL, Wang WH, Chen CS, Lin CJ, Wu CR. Osthole improves aspects of spatial performance in ovariectomized rats. Am J Chin Med. 2004;32(1):11–20. | |
Okamoto T, Kobayashi T, Yoshida S. Chemical aspects of coumarin compounds for the prevention of hepatocellular carcinomas. Curr Med Chem Anticancer Agents. 2005;5(1):47–51. | |
Yang D, Gu T, Wang T, Tang Q, Ma C. Effects of osthole on migration and invasion in breast cancer cells. Biosci Biotechnol Biochem. 2010;74(7):1430–1434. | |
Xu X, Zhang Y, Qu D, Jiang T, Li S. Osthole induces G2/M arrest and apoptosis in lung cancer A549 cells by modulating PI3K/Akt pathway. J Exp Clin Cancer Res. 2011;30:33. | |
Kao SJ, Su JL, Chen CK, et al. Osthole inhibits the invasive ability of human lung adenocarcinoma cells via suppression of NF-κB-mediated matrix metalloproteinase-9 expression. Toxicol Appl Pharmacol. 2012;261(1):105–115. | |
Hu XJ, Liu Y, Zhou XF, et al. Synthesis and characterization of low-toxicity N-caprinoyl-N-trimethyl chitosan as self-assembled micelles carriers for osthole. Int J Nanomedicine. 2013;8:3543–3558. | |
Nagpal K, Singh SK, Mishra DN. Chitosan nanoparticles: a promising system in novel drug delivery. Chem Pharm Bull (Tokyo). 2010;58(11):1423–1430. | |
Nam HY, Kwon SM, Chung H, et al. Cellular uptake mechanism and intracellular fate of hydrophobically modified glycol chitosan nanoparticles. J Control Release. 2009;135(3):259–267. | |
Ngawhirunpat T, Wonglertnirant N, Opanasopit P, et al. Incorporation methods for cholic acid chitosan-g-mPEG self-assembly micellar system containing camptothecin. Colloids Surf B Biointerfaces. 2009;74(1):253–259. | |
Cavazzana-Calvo M, Lagresle C, Hacein-Bey-Abina S, Fischer A. Gene therapy for severe combined immunodeficiency. Annu Rev Med. 2005;56:585–602. | |
Gao S, Chen J, Xu X, et al. Galactosylated low molecular weight chitosan as DNA carrier for hepatocyte-targeting. Int J Pharm. 2003;255(1–2):57–68. | |
Chandy T, Das GS, Rao GH. 5-Fluorouracil-loaded chitosan coated polylactic acid microspheres as biodegradable drug carriers for cerebral tumours. J Microencapsul. 2000;17(5):625–638. | |
Veiseh O, Sun C, Fang C, et al. Specific targeting of brain tumors with an optical/magnetic resonance imaging nanoprobe across the blood-brain barrier. Cancer Res. 2009;69(15):6200–6207. | |
Song Y, Onishi H, Nagai T. Pharmacokinetic characteristics and antitumor activity of the N-succinyl-chitosan-mitomycin C conjugate and the carboxymethy- chitin-mitomycin C conjugate. Biol Pharm Bull. 1993;16(1):48–54. | |
Onishi H, Takahashi H, Yoshiyasu M, Machida Y. Preparation and in vitro properties of N-succinylchitosan- or carboxymethylchitin-mitomycin C conjugate microparticles with specified size. Drug Dev Ind Pharm. 2001;27(7):659–667. | |
Song Y, Onishi H, Nagai T. Synthesis and drug-release characteristics of the conjugates of mitomycin C with N-succinyl-chitosan and carboxymethyl-chitin. Chem Pharm Bull (Tokyo). 1992;40(10):2822–2825. | |
Zhu AP, Yuan LH, Chen T, Wu H, Zhao F. Interactions between N-succinyl-chitosan and bovine serum albumin. Carbohyd Polym. 2007;69(2):363–370. | |
Firestone RA. Low-density lipoprotein as a vehicle for targeting antitumor compounds to cancer cells. Bioconjug Chem. 1994;5(2):105–113. | |
Südhof TC, Goldstein JL, Brown MS, Russell DW. The LDL receptor gene: a mosaic of exons shared with different proteins. Science. 1985;228(4701):815–822. | |
Schumaker VN, Puppione DL. Sequential flotation ultracentrifugation. Methods Enzymol. 1986;128:155–170. | |
Sun S, Wang A. Adsorption properties of N-succinyl-chitosan and cross-linked N-succinyl-chitosan resin with Pb(II) as template ions. Sep Purif Technol. 2006;51(3):409–415. |
 © 2014 The Author(s). This work is published and licensed by Dove Medical Press Limited. The
full terms of this license are available at https://www.dovepress.com/terms
and incorporate the Creative Commons Attribution
- Non Commercial (unported, 3.0) License.
By accessing the work you hereby accept the Terms. Non-commercial uses of the work are permitted
without any further permission from Dove Medical Press Limited, provided the work is properly
attributed. For permission for commercial use of this work, please see paragraphs 4.2 and 5 of our Terms.
© 2014 The Author(s). This work is published and licensed by Dove Medical Press Limited. The
full terms of this license are available at https://www.dovepress.com/terms
and incorporate the Creative Commons Attribution
- Non Commercial (unported, 3.0) License.
By accessing the work you hereby accept the Terms. Non-commercial uses of the work are permitted
without any further permission from Dove Medical Press Limited, provided the work is properly
attributed. For permission for commercial use of this work, please see paragraphs 4.2 and 5 of our Terms.