Back to Journals » International Journal of Nanomedicine » Volume 14
N-acetylcysteine reverses the decrease of DNA methylation status caused by engineered gold, silicon, and chitosan nanoparticles
Authors Sooklert K, Nilyai S, Rojanathanes R ![]() , Jindatip D, Sae-liang N, Kitkumthorn N, Mutirangura A, Sereemaspun A
, Jindatip D, Sae-liang N, Kitkumthorn N, Mutirangura A, Sereemaspun A
Received 6 February 2019
Accepted for publication 16 April 2019
Published 24 June 2019 Volume 2019:14 Pages 4573—4587
DOI https://doi.org/10.2147/IJN.S204372
Checked for plagiarism Yes
Review by Single anonymous peer review
Peer reviewer comments 2
Editor who approved publication: Prof. Dr. Anderson Oliveira Lobo
Kanidta Sooklert,1,* Siwaporn Nilyai,1,* Rojrit Rojanathanes,2 Depicha Jindatip,3 Nutchanart Sae-liang,1 Nakarin Kitkumthorn,4 Apiwat Mutirangura,5 Amornpun Sereemaspun,1
1Nanomedicine Research Unit, Department of Anatomy, Faculty of Medicine, Chulalongkorn University, Bangkok, Thailand; 2Department of Chemistry, Faculty of Science, Chulalongkorn University, Bangkok, Thailand; 3Department of Anatomy, Faculty of Medicine, Chulalongkorn University, Bangkok, Thailand; 4Department of Oral Biology, Faculty of Dentistry, Mahidol University, Bangkok, Thailand; 5Center of Excellence in Molecular Genetics of Cancer and Human Diseases, Department of Anatomy, Faculty of Medicine, Chulalongkorn University, Bangkok, Thailand
*These authors contributed equally to this work
Introduction: Engineered nanoparticles (ENPs) are one of the most widely used types of nanomaterials. Recently, ENPs have been shown to cause cellular damage by inducing ROS (reactive oxygen species) both directly and indirectly, leading to the changes in DNA methylation levels, which is an important epigenetic mechanism. In this study, we investigated the effect of ENP-induced ROS on DNA methylation.
Materials and methods: Human embryonic kidney and human keratinocyte (HaCaT) cells were exposed to three different types of ENPs: gold nanoparticles, silicon nanoparticles (SiNPs), and chitosan nanoparticles (CSNPs). We then evaluated the cytotoxicity of the ENPs by measuring cell viability, morphology, cell apoptosis, cell proliferation, cell cycle distribution and ROS levels. Global DNA methylation levels was measured using 5-methylcytosine immunocytochemical staining and HPLC analysis. DNA methylation levels of the transposable elements, long interspersed element-1 (LINE-1) and Alu, were also measured using combined bisulfite restriction analysis technique. DNA methylation levels of the TEs LINE-1 and Alu were also measured using combined bisulfite restriction analysis technique.
Results: We found that HaCaT cells that were exposed to SiNPs exhibited increased ROS levels, whereas HaCaT cells that were exposed to SiNPs and CSNPs experienced global and Alu hypomethylation, with no change in LINE-1 being observed in either cell line. The demethylation of Alu in HaCaT cells following exposure to SiNPs and CSNPs was prevented when the cells were pretreated with an antioxidant.
Conclusion: The global DNA methylation that is observed in cells exposed to ENPs is associated with methylation of the Alu elements. However, the change in DNA methylation levels following ENP exposure is specific to particular ENP and cell types and independent of ROS, being induced indirectly through disruption of the oxidative defense process.
Keywords: epigenetic, DNA methylation, LINE-1, Alu, nanotoxicity
Introduction
Nanotechnology has been receiving growing interest across a number of fields, with engineered nanoparticles (ENPs) being one of the most highly used nanomaterials for a range of applications, such as cosmetics, food additives, and biomedicine, because of their special physicochemical properties. However, it has previously been shown that many kinds of ENPs are toxic to organisms, causing cyto- and genotoxicity, including inflammation, oxidative stress, immunotoxicity, and DNA damage,1–3 with the level of toxicity often depending on the physicochemical properties of the ENP, such as the size, shape, charge, and chemical composition.4–6 In addition, exposure to ENPs has been shown to cause epigenetic changes,7 whereby gene expression is altered without any change in the DNA sequences, by inducing histone modification and changes miRNA expression and global DNA methylation, with the latter being particularly well studied due to its potential importance for maintaining genome stability.8
Recent studies have demonstrated that ENPs can induce changes in not only the global DNA methylation level but also the DNA methylation level of transposable elements (TEs), including long interspersed nuclear elements (LINEs) and short interspersed nuclear elements (SINEs), respectively, both in vitro and in vivo using an inhalation exposure model.9 Furthermore, because TEs (particularly LINE-1 and Alu) account for 30% of the genome, it has been argued that their methylation levels can be used as an indicator of global DNA methylation levels.10 Full-length LINE-1 contains approximately 6,000 base pairs and accounts for 17% of the human genome, with approximately 600,000 copies being dispersed throughout it. In contrast, Alu is the most abundant SINE in the human genome, with around 1 million copies making up approximately 11% of the genome. It has previously been reported that changes in the DNA methylation levels of LINE-1 and Alu are correlated with diseases, particularly various types of cancers and autoimmune diseases.11 Moreover, such changes have been observed in models following exposure to various environmental toxicants, such as lead, benzene, and ultrafine air pollution particles.12–14 However, the mechanisms by which ENPs induce changes in DNA methylation levels remain unclear.
Several previous studies have found that ENPs can increase the level of ROS, which has been shown to cause intracellular macromolecular damage, induce an inflammatory response, and potentially have an impact on epigenetic changes.1,15–18 Therefore, in this study, we investigated whether ROS generation after exposure to ENPs causes changes in the DNA methylation levels of LINE-1 and Alu in vitro. Because changes in DNA methylation levels have been shown to be both ENP-specific and cell-specific,19 we investigated the effects of three types of ENPs with different chemical properties [gold nanoparticles (AuNPs) to represent metal ENPs, silica nanoparticles (SiNPs) to represent metal oxide ENPs, and chitosan nanoparticles (CSNPs) to represent polymer ENPs] on two different cell types [human embryonic kidney (HEK293) and human keratinocyte (HaCaT) cells]. These cell types were selected because the kidney has various important functions related to the removal of toxins and keratinocytes represent the first barrier for environmental toxicants. We determined the effect of each ENP by evaluating the amount of ROS generated and measuring both the global DNA methylation level and the DNA methylation level of LINE-1 and Alu following ENP exposure. We also compared the effect of ENP exposure on cells that had and had not been exposed to the antioxidant agent N-acetyl cysteine (NAC) to clarify the role of ROS in DNA methylation.
Materials and methods
ENP preparation and characterization
AuNPs were synthesized by reacting 1 mL of 1% gold (III) chloride trihydrate (HAuCl4·3H2O) with 12 mL of 0.0202 mM sodium acetate and 37 mL of Milli-Q® water. The solution was stirred in range of 75–95°C for 2 hrs, after which it became red-wine in color. LUDOX® AM SiNPs (aqueous suspensions in H2O) were purchased from Sigma-Aldrich (Sigma, St Louis, MO, USA). CSNPs were synthesized and provided by the Chitin Research Center, Chulalongkorn University, Thailand. The total surface charge of each type of ENP was measured using a Zetasizer Nano (Malvern, UK), whereas the size and shape were observed under a transmission electron microscope (TEM) (Hitachi High-Technologies Corporation, Tokyo, Japan).
Protein corona formation and nanoparticles agglomeration analysis
ENPs were incubated for 1 hr with cell culture media in an orbital shaking incubator at 37°C. The ENPs mixture were subjected to centrifugation at 16,000×g/20°C for 15 mins. After centrifugation, the ENPs-corona pellets were resuspended in phosphate-buffered saline (PBS) and re-centrifuged three times for removed the unbound proteins. The ENPs-corona pellets were collected, and the protein concentration was quantified using a BCA Protein Assay Kit (Thermo Scientific, Waltham, MA, USA). The size distribution of ENPs in cell culture media was also measured by dynamic light scattering using a Zetasizer Nano.
Cell culture
HEK293 and HaCaT cell lines were purchased from American Type Culture Collection (ATCC, Manassas, VA, USA). HEK293 and HaCaT cells were cultured in DMEM and supplemented with 10% (v/v) fetal bovine serum (Gibco, Waltham, MA, USA) and 1% (v/v) penicillin/streptomycin (Gibco, USA). The cells were grown in an incubator (Esco, Singapore) at 37°C with 5% carbon dioxide.
Cellular toxicity of the ENPs
The viability of HEK293 and HaCaT cells following exposure to the ENPs was assessed using PrestoBlue® (Invitrogen, Waltham, MA, USA), which is a resazurin-based reagent that becomes strongly fluorescent after accepting electrons from molecules in living cells that are involved in cellular respiration. Briefly, the cells were plated in 96-well plates and challenged with each of the ENPs for 72 hrs. PrestoBlue® was then added, and the plate was incubated at 37°C for 30 mins. The fluorescence intensity was detected at an emission wavelength of 495 nm and an excitation wavelength of 530 nm using a Varioskan Flash microplate reader (Thermo Scientific). The percentage of cell viability was then calculated with respect to a control group of untreated cells.
Cell morphology
HEK293 and HaCaT cells were seeded into a 24-well plate and treated with each of the ENPs for 72 hrs once the cells had attached to the bottom. The cell morphology was then observed under a phase-contrast inverted microscope (Eclipse TS 100; Nikon, Tokyo, Japan).
Detection of apoptosis by annexin V and PI staining
Apoptosis was determined by fluorescein isothiocyanate (FITC)-conjugated annexin V and propidium iodide (PI) staining (BD Biosciences, Franklin Lakes, NJ, USA) according to the manufacturer’s instructions. Briefly, cells were treated with ENPs and incubated for 72 hrs. After the treatment, cells were harvested and washed twice with cold phosphate-buffered saline and resuspended in 1x annexin V binding buffer. FITC conjugated annexin V and PI working solutions were added and incubated for 15 mins in the dark. Within 1 hr after staining, cells were analyzed by flow cytometry (Beckman Coulter CytoFlex, Brea, CA, USA).
Cell proliferation analysis
The cell proliferation analysis was performed by using the CellTrace™ Cell Proliferation Kits (Invitrogen). Following the manufacturer’s instructions, cells were loaded with the CellTrace™ DMSO stock solution in PBS and incubated for 20 mins at 37°C. Afterwards, the loading solution was removed, and the cells were washed by culture medium containing 10% FBS. The stained cells were treated with ENPs for 72 hrs. After 72 hrs, cells were harvested and resuspended in PBS for flow cytometry analysis.
DNA-based cell cycle analysis
The cell cycle phases were analyzed by measuring DNA content after PI staining. Briefly, the ENPs treated cells were collected and fixed in 70% alcohol at room temperature (25°C) for 20 mins. Then, the cells were subsequently incubated with 100 μg/mL RNase A at 4°C for 30 mins. Following this process, the cells were stained with 50 μg/mL PI solution (Thermo Scientific) at room temperature (25°C) for 15 mins in the dark. The data from stained cells were collected on the CytoFLEX research flow cytometer using CytExpert Software (Beckman Coulter CytoFlex).
Measurement of intracellular ROS
The formation of intracellular ROS following exposure to each of the ENPs was determined using 2′,7′-dichlorodihydrofluorescein diacetate (H2DCFDA; Invitrogen), which is converted into non-fluorescent 2′,7′-dichlorodihydrofluorescein through the removal of acetate groups by intracellular esterases and then dichlorofluorescein (DCF) following oxidation by ROS, which produces a fluorescent signal. A 10 mM H2DCFDA stock solution was prepared in dimethyl sulfoxide and diluted 1,000-fold with DMEM without serum for use as a working concentration. Briefly, HEK293 and HaCaT cells were seeded into a 96-well plate and washed twice with PBS. H2DCFDA was then added to each well, and the plate was incubated at 37°C in the dark for 30 mins. The cells were then washed twice with PBS and treated with the ENPs. The fluorescence intensity was detected after 3 and 6 hrs at an emission wavelength of 485 nm and an excitation wavelength of 528 nm using a Varioskan Flash microplate reader (Thermo Scientific). The percentage of ROS generation was calculated by normalizing the level to an untreated control group. The cells treatment with H2O2 was represented as positive control.
Immunocytochemical staining with 5-mc
To examine the levels of global methylation, HEK293 and HaCaT cells were exposed to each of the ENPs and then added to low-melting-point agarose gel to form gel blocks. These gel blocks were fixed in formalin, embedded in paraffin, and sectioned at 5 µm, following which the sections were dewaxed in xylene and rehydrated using ethanol. The sections then underwent antigen retrieval by immersing them in citric acid (pH 6) and heating them in a microwave oven (full power) for 10 mins. Following this, the slides were immersed in hydrochloric acid at room temperature for 15 mins to expose the CpG dinucleotides. To quench any endogenous peroxidase activity, the sections were treated with 3.0% hydrogen peroxide for 4 mins. They were then incubated for 60 mins at room temperature with a commercial antibody against 5-mc to assess global DNA methylation levels, followed by a further 60 mins with secondary antibody (horseradish peroxidase polymer). Finally, the sections were incubated with 3,3′-diaminobenzidine and counterstained with hematoxylin. The sections were scanned using an Axio Scan.Z1 (Zeiss, Jena, Germany), and counts of global methylated cells (brown) and global unmethylated cells (blue) were made in 10 random fields of view per slide using the Adobe Photoshop program (Creative Suite 6; Adobe, San Jose, CA, USA). The percentage of methylation was then calculated by dividing the number of methylated cells by the total number of cells counted. The cells treatment with 5-azacytidine were used to reflect the hypomethylation condition.
HPLC analysis
Seventy-two hours after treating with ENPs, DNA was extracted from HEK293 and HaCaT cells using a Blood & Cell Culture DNA Mini Kit (Qiagen, Hilden, Germany) and quantified using a NanoDrop™ 2000 Spectrophotometer (Thermo Fisher Scientific, Waltham, MA, USA). Following this process, the genomic DNA was digested using 8-OHdG Assay Preparation Reagent Set (FUJIFILM Wako Pure Chemical Corporation, Osaka, Japan). In brief, 20 µg DNA from all samples were heated for 2 mins at 98°C and then were chilled on ice for 10 mins. Next, 19 µl of acetic acid buffer and 10 µl of nuclease P1 solution were added and incubated for 30 mins at 37°C. After flash centrifuge, 20 µl of tris buffer and 1 µl of alkaline phosphatase solution were added and incubated for 30 mins at 37°C. Each sample was transferred to a filter cup of an ultracentrifuge device and centrifuged at 15,000×g at 4°C for 20 mins. Samples were then kept at −20°C until HPLC analysis. The standards 2′-deoxycytidine (dC) and 5-methyl-2′-deoxycytidine (5mdC) were prepared in 0.1% hydrochloric acid. HPLC was performed on Shimadzu prominence UFLC LC-20AD (Shimadzu, Kyoto, Japan). An enable C18P 4E column (250 mm x 4.6 mm, 5 µm) was used for separation. The separation was achieved with two mobile phases: 0.1% (v/v) trifluoroacetic acid and methanol. The flow rate was set at 1 mL/min and the injected sample volume was 20 µL. The UV detection was set at 280 nm.
Combined bisulfite restriction analysis (COBRA)
COBRA is a standard technique and simple method that is used to detect the methylation level of interspersed repetitive nuclear elements.20,21 HEK293 and HaCaT cells were exposed to each of the ENPs for 72 hrs, following which DNA was extracted using the QIAamp® DNA Mini Kit (Qiagen) according to the manufacturer’s instructions. Bisulfite conversion of genomic DNA was performed using the EZ DNA Methylation-Gold™ Kit (Zymo Research, Orange, CA, USA) as described by the manufacturer. Bisulfite-treated DNA was then amplified by PCR using primers that were specific to the LINE-1 (F: 5′-CCG-TAA-GGG-GTT-AGG-GAG-TTT-TT-3′ and R: 5′-RTA-AAA-CCC-TCC-RAA-CCA-AAT-ATA-AA-3′) and Alu (F: 5′-GGCGCGGTGGTTTACGTTTGTAA-3′ and R: 5′-CAC-CAT-ATT-AAC-CAA-ACT-AAT-CCC-GA-3′) sequences.22 The PCR conditions were as follows: pre-denaturation at 95°C for 15 mins; followed by 35 cycles of denaturation at 95°C for 1 mins, annealing at 55°C for LINE-1 and 53°C for Alu for 1 mins, and extension at 72°C for 1 min, with a final extension step at 72°C for 7 mins. The PCR products of LINE-1 (160 bp containing two CpG dinucleotides) and Alu (133 bp containing two CpG dinucleotides) were cut by adding 1 U of the restriction enzymes TaqI and TasI at 65°C overnight and were separated on 8% non-denaturing polyacrylamide gels, stained with SYBR® Green and visualized under a STORM scanner (STORM 825; GE Healthcare, Australia). The total DNA methylation levels of LINE-1 and Alu were then calculated as described previously.20,23
Statistical analysis
All data are presented as mean ± SD. Differences between treatment groups were analyzed using ANOVA, followed by Tukey’s multiple comparison test for comparisons between multiple groups or unpaired t-tests for comparisons between two groups. All analyses were performed in GraphPad Prism 5 (GraphPad Software, Inc., La Jolla, CA, USA) with a significance level of P<0.05.
Results
Characterization of the ENPs
The size and dispersion of the nanoparticles that were used in this study were estimated by examining their morphology and measuring their primary diameter under a TEM and determining their zeta potential using a Zetasizer. All the three ENPs were spherical, with approximate diameters of 23 nm for AuNPs, 17 nm for SiNPs, and 54 nm for CSNPs (Figure 1A–C and Table 1). Both AuNPs and SiNPs exhibited a negative charge, whereas CSNPs had a positive charge. Among the three ENPs used in this study, SiNPs showed the greatest stability.
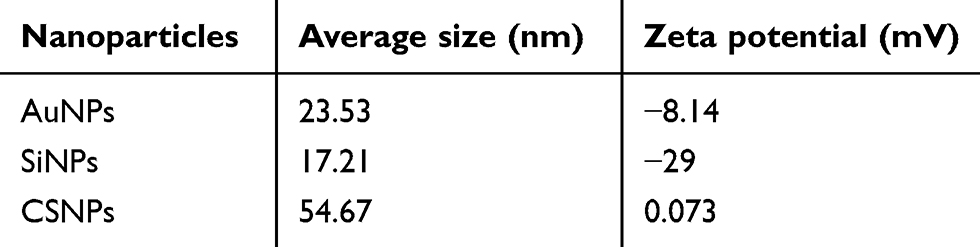 | Table 1 Size distributions and zeta potential values of the engineered nanoparticles |
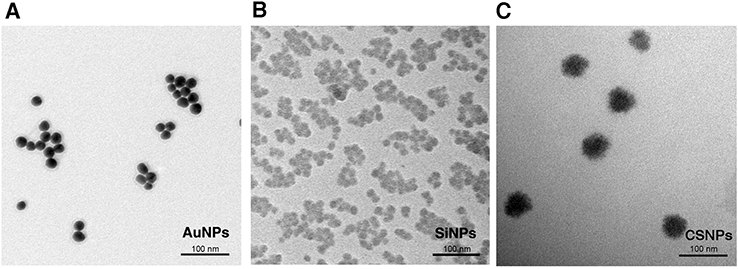 | Figure 1 Transmission electron micrographs of the engineered nanoparticles. (A) Gold nanoparticles (AuNPs), (B) silicon nanoparticles (SiNPs), and (C) chitosan nanoparticles (CSNPs). |
Protein corona formation and agglomeration of ENPs
Amounts of protein adsorbed onto ENPs and hydrodynamic diameter of ENPs before and after incubation with cell culture media were investigated by using BCA Protein Assay Kit (Thermo Scientific) and Zetasizer Nano, respectively. After incubation with cell culture media, the amounts of protein that coated with AuNPs, SiNPs, and CSNPs was 86.33+0.16, 200.02+0.18, and 88.71+0.07 µg/mL, respectively (Table 2). As showed in Table 2, the hydrodynamic diameters of SiNPs and CSNPs were slightly larger than before incubation with cell culture media. Whereas the hydrodynamic diameters of AuNPs became a bit smaller after incubation with cell culture media.
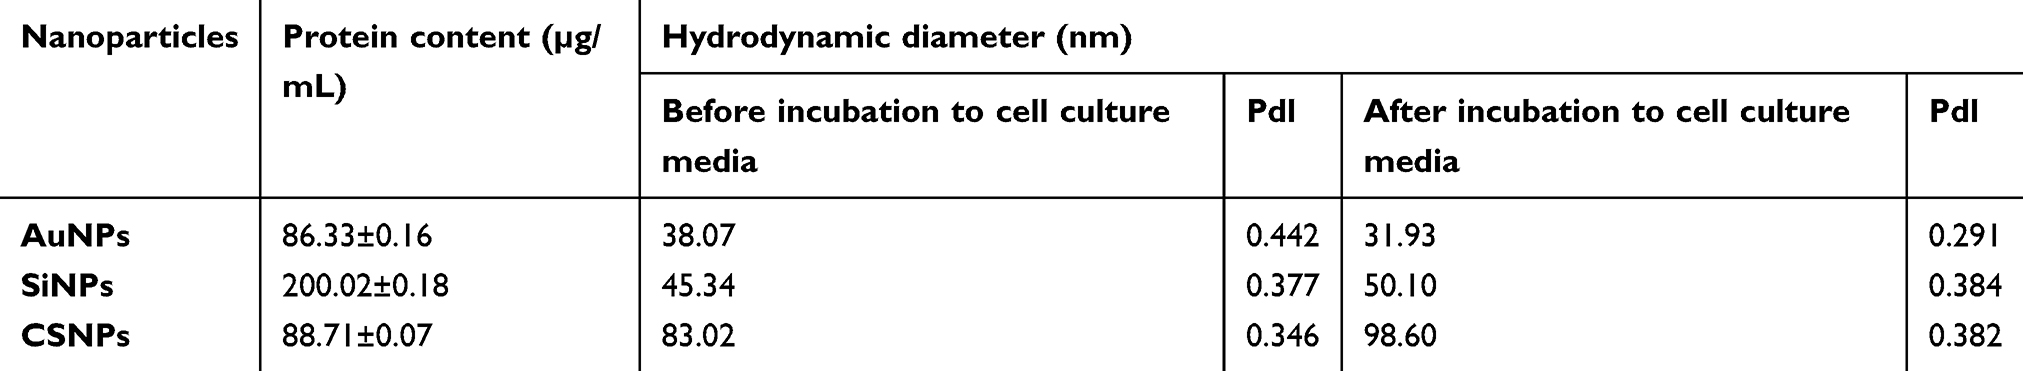 | Table 2 Protein corona and hydrodynamic diameter of ENPs before and after incubation with cell culture media for 1 hr |
Cell morphology
The morphologies of HEK293 and HaCaT cells following exposure to each of the three ENPs for 72 hrs are shown in Figure 2. HEK293 cells that had been exposed to 10 µg/mL AuNPs and up to 100 µg/mL CSNPs had the same morphology as untreated control cells, but exposure to 100 µg/mL AuNPs reduced the number of cells. In contrast, HEK293 cells that had been exposed to 10 and 100 µg/mL SiNPs exhibited morphological changes, particularly at the higher concentration, with the cells appearing to be impaired and exhibiting a deformed conformation and some also showing shrinkage. Similarly, HaCaT cells that were treated with 10 µg/mL AuNPs and up to 100 µg/mL CSNPs had the same morphology as untreated control cells, but exposure to 100 µg/mL AuNPs reduced the number of cells. Furthermore, the number of HaCaT cells decreased following exposure to SiNPs in a dose-dependent manner.
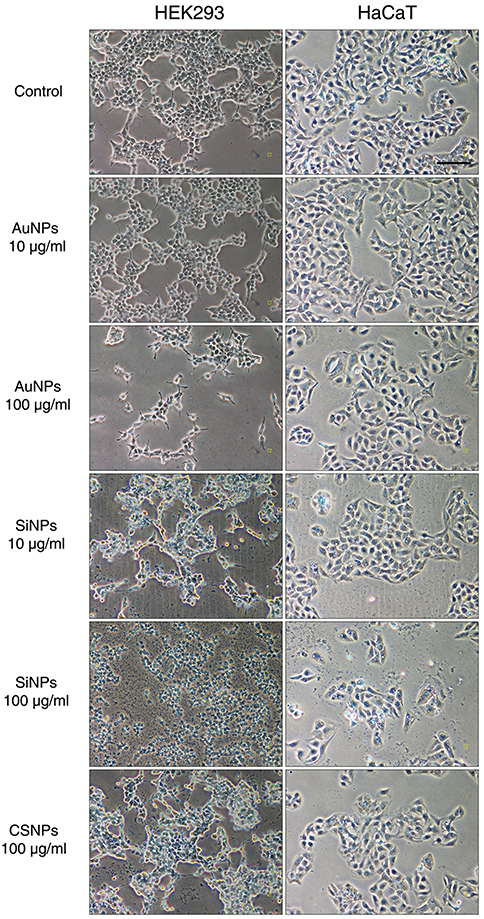 | Figure 2 Cell morphology following treatment with the engineered nanoparticles. Human embryonic kidney (HEK293; left) and keratinocyte (HaCaT; right) cells were treated with gold nanoparticles (AuNPs), silicon nanoparticles (SiNPs), and chitosan nanoparticles (CSNPs) for 72 hrs and then visualized under a phase-contrast microscope (magnification, 200×). Cells in the control group were treated with engineered nanoparticle-free medium. |
Cell viability
The viabilities of HEK293 and HaCaT cells following exposure to 10, 50, and 100 µg/mL of each of the three ENPs for 72 hrs are shown in Figure 3A–F, respectively. Exposure to AuNPs decreased the viability of HEK293 cells at 100 µg/mL and HaCaT cells at 50 and 100 µg/mL, whereas SiNPs were only toxic to HEK293 cells at 50 and 100 µg/mL, and CSNPs did not reduce the viability of either cell line at any concentration.
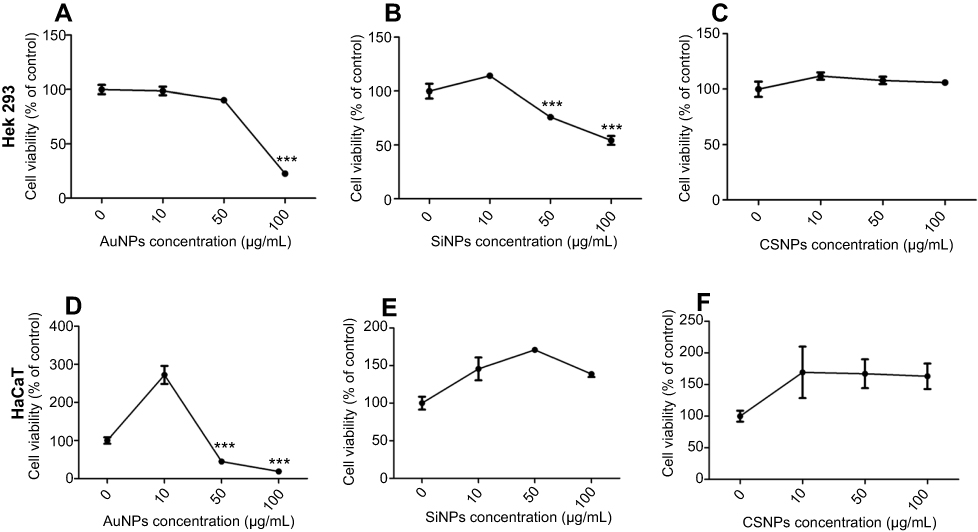 | Figure 3 Cellular toxicity of the engineered nanoparticles.Notes: Human embryonic kidney (HEK293; A–C) and keratinocyte (HaCaT; D–F) cells were challenged with 0 µg/mL (control), 10, 50, and 100 µg/mL of gold nanoparticles (AuNPs), silicon nanoparticles (SiNPs), and chitosan nanoparticles (CSNPs) for 72 hrs. The percentage of cell viability was then calculated relative to the untreated control group. Values are mean ± SD. ***P<0.001 versus the control group. |
Cell apoptosis
After treatment with ENPs and double staining with annexin V and PI, the cells with annexin
V+/PI- (indicating early apoptosis), annexin V+/PI+ (indicating late apoptosis) and annexin V-/PI+ (indicating necrosis) were observed. Results in Figure 4 showed that the treatment with AuNPs and SiNPs reduced the viability of HEK293 (Figure 4A and C) and HaCaT (Figure 4B and D) cells in a dose-dependent manner. The results displayed that the percentages of both apoptotic and necrotic cells were also increased after the concentrations of AuNPs and SiNPs are increased. Besides, we found that the percentages of apoptotic and necrotic cells after CSNPs treatment were not significantly different compared to control group.
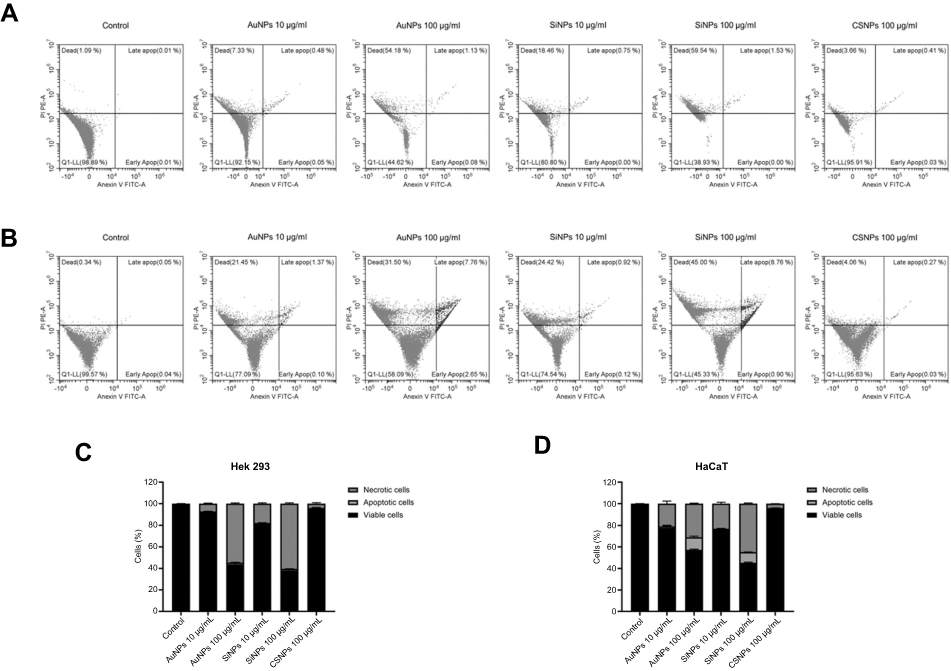 | Figure 4 Apoptosis and necrosis rates of human embryonic kidney (HEK293) and keratinocyte (HaCaT) cells measured using flow cytometry with double staining of Annexin V and PI.Notes: The scatterplot shows HEK293 (A) and HaCaT (B) cells treated with ENPs. The quantitative analysis of apoptotic and necrotic cells of treated – HEK293 (C) and HaCaT (D) cells determined by flow cytometry. Abbreviation: ENPs, engineered nanoparticles. |
Cell proliferation
To confirm that ENPs may exert a cytostatic effect, cell proliferation analysis using a carboxyfluorescein succinimidyl ester (CFSE) reagent was completed. CFSE is cell permeable that readily diffuse into cells and bind covalently to intracellular amines. The fluorescent intensity of CFSE is not transferred to adjacent cells but will become approximately half of the integrated CFSE in each daughter cell. The discrete peaks in the histograms represent successive generations of live. Flow cytometry analysis revealed that HEK293 (Figure 5A and C) and HaCaT (Figure 5B and D) cells treated with concentration of 100 μg/mL AuNPs and SiNPs had increased cell proliferation. Whereas CSNPs treatment with concentrations of 100 μg/mL had no significant difference in cell proliferation level compared to control group (Figure 5).
 | Figure 5 Cell proliferation analysis.Notes: Proliferation of carboxyfluorescein succinimidyl ester (CFSE)-labeled human embryonic kidney (HEK293) (A) and keratinocyte (HaCaT) (B) cells treated with engineered nanoparticles (ENPs) for 72 hrs. The percentages of proliferating HEK293 (C) and HaCaT (D) cells as measured by the CFSE-based assay. *P<0.01, ****P<0.0001 vs control. |
Cell cycle
To explore whether ENPs mediated effect on cell cycle, a DNA-based cell cycle analysis was performed using flow cytometry. In HEK393 cells, exposure to AuNPs and SiNPs resulted in a decreased cell percentage in the S phase, while exposure to CSNPs had no significant difference in cell cycle distribution compared to control group (Figure 6A and C). The flow cytometer analysis of HaCaT cells showed an increased cell percentage in the G0/G1 phase and a decreased cell percentage in the S phase in the cells treated with 10 μg/mL AuNPs and SiNPs (Figure 6B and D).
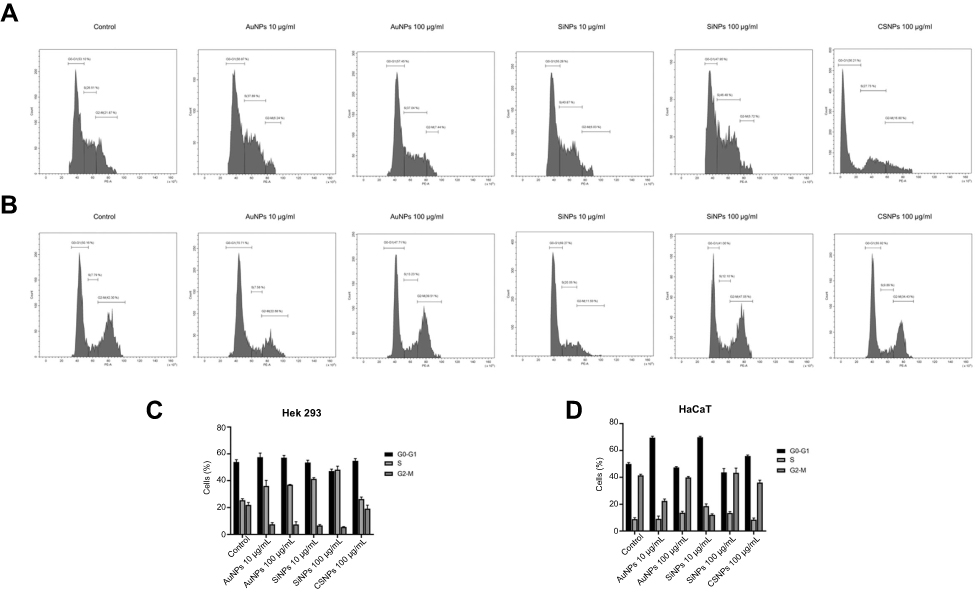 | Figure 6 Cell cycle analysis using propidium iodide (PI) staining and flow cytometry.Notes: Flow histogram showed cell cycle distribution of PI-stained human embryonic kidney (HEK293) (A) and keratinocyte (HaCaT) (B) cells treated with different concentrations of engineered nanoparticles (ENPs). The quantitative measurement cell cycle distribution of ENPs treated HEK293 (C) and HaCaT (D) cells. |
ROS generation
The intracellular ROS levels in HEK293 and HaCaT cells at 3 and 6 hrs after being challenged by the ENPs are shown in Figure 7A and B, respectively. Neither cell type exhibited a significant change in ROS levels following exposure to AuNPs or CSNPs. However, exposure to SiNPs increased the ROS level in a dose-dependent manner, with HEK293 cells treated with 100 µg/mL SiNPs and HaCaT cells treated with 50 and 100 µg/mL SiNPs having significantly higher ROS levels than that in the untreated control group at both 3 and 6 hrs.
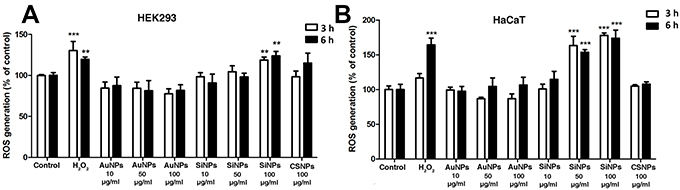 | Figure 7 Total ROS levels in the engineered nanoparticle-treated cells.Notes: (A) Human embryonic kidney (HEK293) and (B) human keratinocyte (HaCaT) cells were treated with gold nanoparticles (AuNPs), silicon nanoparticles (SiNPs), and chitosan nanoparticles (CSNPs) for 72 hrs, and the percentage ROS generation relative to the untreated control group was determined after 3 and 6 hrs. Cells in the control groups were left untreated (Control) or treated with H2O2 as a positive control. Values are mean ± SD. **P<0.01; *** P<0.001 versus the control group. |
Global DNA methylation
The global DNA methylation statuses of the HEK293 and HaCaT cells following exposure to the ENPs, as determined by 5-methylcytosine (5-mc) immunocytochemical staining, are shown in Figure 8, whereas the percentages of DNA methylated cells are provided in Table 3. All of the ENP-treated HEK293 cells exhibited high levels of methylation that were identical to that in the untreated control group. Similarly, HaCaT cells that were treated with AuNPs did not exhibit any difference in methylation from the control group. However, HaCaT cells that were exposed to 10 µg/mL SiNPs and 100 µg/mL CSNPs had significantly lower levels of methylation than untreated control cells.
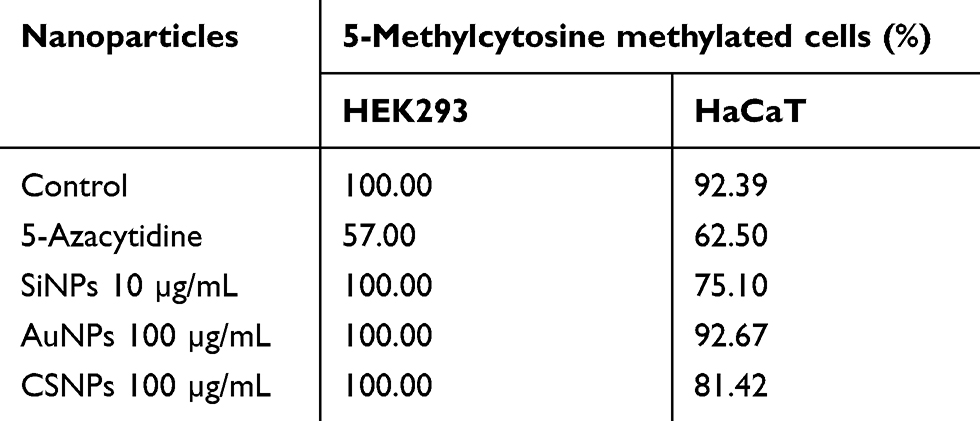 | Table 3 Percentage of methylated cells from immunocytochemical staining of 5-methylcytosine in HEK293 and HaCaT cell exposed to engineered nanoparticles for 72 hr |
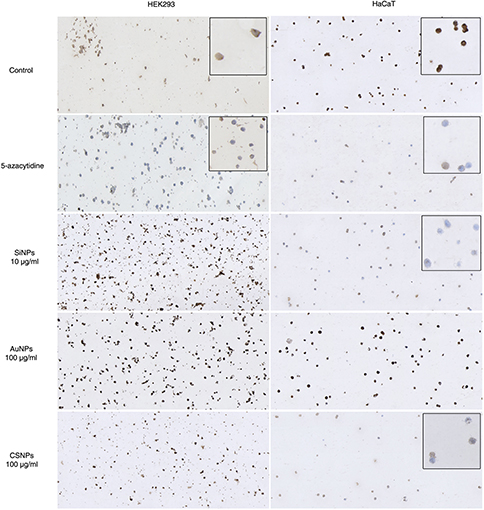 | Figure 8 Global DNA methylation levels in the engineered nanoparticle-exposed cells. Notes: Human embryonic kidney (HEK293; left) and keratinocyte (HaCaT; right) cells were treated with gold nanoparticles (AuNPs), silicon nanoparticles (SiNPs), and chitosan nanoparticles (CSNPs) for 72 hrs and stained with 5-methylcytosine to measure the global DNA methylation levels. Cells in the control groups were left untreated (Control) or treated with the DNA demethylation agent 5-azacytidine to reflect the hypomethylation condition. Methylated cells are brown, whereas unmethylated cells are blue. |
Determination of 5-methylcytosine by HPLC
The global DNA methylation statuses of the HEK293 and HaCaT cells following exposure to the ENPs as determined by HPLC approach were presented as a ratio 5 mdC/(dC +5 mdC)×100% in Figure 9. In HaCaT cells, exposure to 100 µg/mL CSNPs showed the significantly reduced levels of methylation. The values of genomic DNA methylation in the HaCaT cells obtained from HPLC approach are consistent with the immunocytochemical staining method. Whereas in HEK293 cells, both 100 µg/mL CSNPs and 100 µg/mL AuNPs treatments are affected by reduction in methylation levels.
 | Figure 9 Quantification of effects of engineered nanoparticles on DNA methylation (5mdC). Notes: The mean values of 5mdC percentage of total DNA in human embryonic kidney (HEK293) (A) and keratinocyte (HaCaT) (B) cells quantified by HPLC analysis. ****P<0.0001 vs control. |
DNA methylation of LINE-1 and Alu
The DNA methylation levels of LINE-1 and Alu in HEK293 and HaCaT cells following exposure to the ENPs for 72 hrs are shown in Figure 10. HEK293 cells did not exhibit any change in the DNA methylation level of either TE following exposure to any of the ENPs (Figure 10A and B). In contrast, exposure of HaCaT cells to high and low doses of SiNPs and 100 µg/mL CSNPs significantly decreased the methylation level of Alu but not LINE-1 (Figure 10C and D), whereas exposure to AuNPs had no effect on either TE.
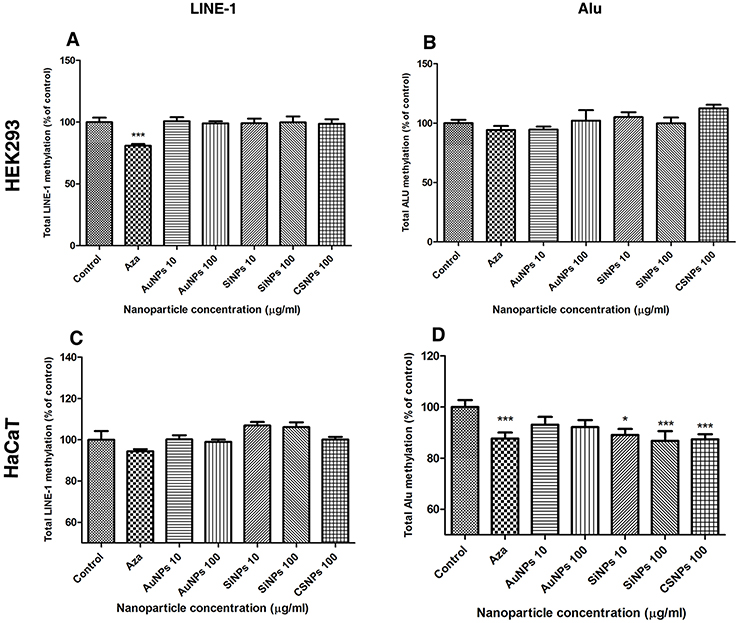 | Figure 10 Total methylation levels of LINE-1 and Alu in the engineered nanoparticle-exposed cells.Notes: The percentage methylation of LINE-1 (A and C) and Alu (B and D) with respect to the control were measured in human embryonic kidney (HEK293) and keratinocyte (HaCaT) cells that had been treated with gold nanoparticles (AuNPs), silicon nanoparticles (SiNPs), and chitosan nanoparticles (CSNPs) for 72 hrs. Cells in the control groups were left untreated (Control) or treated with the DNA demethylation agent 5-azacytidine (Aza) to represent the hypomethylation condition. Values are mean ± SD. *P<0.05, ***P<0.001 versus the control group. |
Effect of antioxidant pretreatment on Alu DNA methylation
To test the hypothesis that the observed changes in the DNA methylation levels of Alu in HaCaT cells resulted from ENP-induced ROS generation, HaCaT cells were incubated with the antioxidant NAC for 30 mins before being exposed to the ENPs for 72 hrs. We found that the pretreated cells did not exhibit any decrease in the DNA methylation level of Alu following exposure to 10 and 100 µg/mL SiNPs and CSNPs (Figure 11). Exposure to AuNPs did not affect the DNA methylation level of Alu in NAC-pretreated or untreated cells.
 | Figure 11 DNA methylation level of Alu in the engineered nanoparticle-exposed cells pretreated with N-acetylcysteine (NAC).Notes: Human keratinocyte (HaCaT) cells were pretreated with the antioxidant NAC for 30 mins before being exposed to gold nanoparticles (AuNPs), silicon nanoparticles (SiNPs), and chitosan nanoparticles (CSNPs) for 72 hrs. Cells in the control groups were left untreated (Control) or treated with the DNA demethylation agent 5-azacytidine (Aza) to represent the hypomethylation condition. Comparisons were made between the total Alu DNA methylation levels in the NAC-pretreated cells (+) and un-pretreated cells (−) using unpaired t-tests and between the NAC-pretreated cells, Aza, and control using analysis of variance. Values are mean ± SD. **P<0.01, ***P<0.001. Abbreviation: NS, not significant. |
Discussion
Nanomaterials are receiving increasing attention for use in many types of consumer products, increasing the likelihood of human exposure. Therefore, it is important that their toxicity is thoroughly understood. Several groups have recently investigated the effects of nanomaterials on epigenetic changes or “nanoepigenetics.” In this study, we gained new insights into the epigenotoxicity of ENPs, demonstrating that they alter global DNA methylation levels and DNA methylation levels of TEs via a mechanism that is independent of oxidative stress. Moreover, we proved that NAC can attenuate ENP-induced DNA hypomethylation.
The toxicity of ENPs to HEK293 and HaCaT cells was evaluated by examining both cell viability and cell morphology. However, there was inconsistency in some of the results. Both HEK293 and HaCaT cells that were treated with high doses of AuNPs exhibited a >50% decrease in viability, whereas HaCaT cells that were exposed to SiNPs, which were expected to be more toxic based on their effects on cell number and morphology, showed a higher percentage viability than the untreated control group. The PrestoBlue reagent that was used to evaluate cell viability in this study is resazurin-based and becomes fluorescent after accepting free electrons from a molecule that is involved in cellular respiration, such as nicotinamide adenine dinucleotide phosphate, and thus also initiates a cellular stress response.24 The morphology results indicated that the majority of HEK293 cells were deformed following SiNP exposure, resulting in a loss of function and an inability to survive. In contrast, HaCaT cells may have a higher tolerance, with any surviving cells still generating free electrons that are taken up by the foreign agent.
It has been proposed that ENP-induced changes in DNA methylation levels in cells are caused by ROS.19,25 Here, we measured intracellular oxidative stress levels in cells at 3 and 6 hrs after being challenged by ENPs, with this time period being selected based on the findings of a previous report and the fact that ROS production typically occurs fairly quickly to protect the cell from the foreign agent, after which ROS can be eliminated by intracellular antioxidant molecules.1,26 We found that ROS levels in HaCaT cells were increased at both 3 and 6 hrs after exposure to SiNPs, supporting the findings of a previous study. In addition, the ROS level in HEK293 cells was significantly higher following exposure to a high dose of SiNPs, which matches the findings of Fen Wang (2009) that exposure of HEK293 cells to 20- and 50-nm SiNPs induces the production of ROS in a dose-dependent manner at 24 hrs.3 In contrast, neither AuNPs nor CSNPs affected the ROS level in either cell line. CSNPs are one of the most commonly used vectors for drug or gene delivery and are considered safe to use in the skin and other organs. Based on the viability, morphology, and ROS content of CSNP-treated cells, these polymer nanoparticles did not exhibit any cytotoxicity at the selected doses and time periods in the present study. In contrast, there has been some controversy regarding the cytotoxicity of AuNPs, with the results depending on the exposure model used.27,28 The toxicity of ENPs has also been suggested to depend on the physical and chemical properties of the ENPs, such as their size, charge, and stability.29,30 However, the AuNPs that were used in our study did not increase ROS levels in HEK293 or HaCaT cells following short-term exposure.
Epigenetic modifications have been reported to play critical roles in many cellular processes, and the effects of nanomaterials on epigenetic mechanisms continue to receive attention. SiNPs, in particular, have been found to induce global DNA methylation in HaCaT cells following short-term exposure and also affect the expression of the DNA methylation machinery.31 Our study provided strong evidence that HaCaT cells become hypomethylated after 72 hrs of exposure to SiNPs, whereas HEK293 cells did not experience any change in global DNA methylation levels following exposure to any of the ENPs, indicating that this effect was cell-specific. Surprisingly, CSNPs also had the ability to induce genomic hypomethylation in HaCaT cells. CSNPs are generally thought to be biocompatible and biodegradable nanoparticles that are well suited to medical applications.32 However, Yu-Lan Hu reported on the toxicity of CSNPs in zebrafish (Danio rerio) embryos, with 200-nm CSNPs increasing the rate of cell death as well as the expression of ROS and the heat shock protein 70 gene.33 Furthermore, Mi-Ryung Park confirmed that CSNPs can impair mitochondrial function in mouse preimplantation embryos and can downregulate genes that are involved in the developmental process.34 Here, we demonstrated for the first time that CSNPs can induce global DNA hypomethylation in keratinocyte cells.
The DNA methylation levels of repetitive DNA sequences are expected to represent global DNA methylation levels because they comprise a large number of CpG sequences and are abundant throughout the human genome.10 LINE-1 and Alu are the two most abundant non-coding elements in the human genome and are associated with the cell stress response, genome stability, and numerous diseases.35,36 Therefore, the highlight of this study was the investigation into the effect of ENP exposure on the DNA methylation levels of LINE-1 and Alu elements. We found that SiNP and CSNP exposure induces hypomethylation of Alu in HaCaT cells but not in HEK293 cells, which is in accordance with the global DNA methylation results. In contrast, the DNA methylation level of LINE-1 was not affected by exposure to any of the ENPs, indicating that the effect of the ENPs on the DNA methylation level of retrotransposable elements is DNA sequence-specific. This is likely due to LINE-1 and Alu being regulated by different mechanisms and exhibiting different transcription patterns in response to cellular stressors.37,38 Similarly, previous studies on pollution exposure in humans found a relationship between exposure to persistent organic pollutants and hypomethylation of Alu but not LINE-1, and the abundance of Alu element has been shown to be strongly correlated with cellular stress responses.39–41
In addition to inducing intracellular ROS production, ENPs have been shown to interfere with the oxidative stress balance by depleting the antioxidant capacity of cells.4 Glutathione (GSH) plays a critical role in the cellular defense mechanism against oxidative stress and has been shown to become unbalanced in cells that have been exposed to ENPs.3 However, the protective effects of antioxidants on DNA methylation in ENP-exposed cells have not previously been investigated. Although we did not directly measure the concentration of GSH in the present study, we did find that the pretreatment of HaCaT cells with NAC, which is a precursor of GSH, before they were challenged with ENPs prevented DNA hypomethylation of the Alu elements. ENPs may induce the production of intracellular ROS and deplete GSH levels. Interestingly, it should also be noted that the production of GSH directly influences DNA methylation levels by altering pools of the methyl donor S-adenosyl methionine (SAM). Under normal conditions, homocysteine is converted into methionine via the methionine cycle and used in the synthesis of SAM. However, when cells require a greater production of antioxidants such as GSH for defense against cellular oxidative stress, homocysteine is pushed into the GSH synthesis pathway, decreasing the level of SAM. In addition, the genome-wide methylome also affects the global DNA hypomethylation level.42 These findings suggest that ENPs induce changes in DNA methylation levels indirectly by disturbing the cellular oxidative defense process and that NAC represents a candidate protective drug where there is a high risk of ENP exposure.
The level of DNA methylation can change dynamically in response to the environment and specific stressors.43 Lu et al showed that industry-related nanoparticles, including printer-emitted ENPs, mild steel-welding fumes, copper oxide, and titanium dioxide, affect the epigenome in lung cells.9 Furthermore, like us, they found that DNA methylation levels of LINE-1 and Alu/SINE elements (Alu in humans and SINE in mice) can change in both directions (ie, hypo- or hypermethylation) depending on the ENP and cell type.9 This indicates that the effects of ENPs on epigenetic mechanisms rely on many factors, including ENP properties, such as their charge, size, shape, and chemical composition, and cell type. It is believed that various properties of cells, such as receptor expression, metabolic activities, xenobiotic clearance systems, and oxidative stress defense mechanisms, influence the toxicity responses of cells.44
Conclusion
The increasing evidences that exposure to various types of ENPs causes epigenetic alterations are an important nanoepigenetic issue. Our findings indicate that changes in the DNA methylation levels of TEs could be used as a biomarker for evaluating ENP exposure, with the methylation of Alu in particular being responsive to nanoparticle-induced cellular toxicity. However, the toxicity of ENPs on the DNA methylation mechanism and the characteristics of ENPs that affect the level of DNA methylation alteration require further investigation for specific types of cells and ENPs.
Acknowledgments
The authors would like to thank Chitin Research Center, Chulalongkorn University, Thailand for their kind cooperation in chitosan nanoparticles preparation and Mr. Preecha Rengvejvorachai from Department of Pathology, Faculty of Medicine, Chulalongkorn University, Thailand, for his useful critiques and valuable technical support on this study. This work was supported by the 90th Anniversary of Chulalongkorn University Fund (Ratchadaphiseksomphot Endowment Fund, Chulalongkorn University). This study also supported by National Research Council of Thailand (NRCT). SN was supported by the 90th Anniversary of Chulalongkorn University Fund (Ratchadaphiseksomphot Endowment Fund, Chulalongkorn University) and National Research Council of Thailand (NRCT).
Author contributions
All authors contributed to data analysis, drafting or revising the article, gave final approval of the version to be published, and agree to be accountable for all aspects of the work.
Disclosure
KS was supported by the Ratchadapiseksomphot Endowment Fund (postdoctoral fellowship), Chulalongkorn University. AS was supported by the Ratchadaphiseksomphot Endowment Fund of Chulalongkorn University (RES560530230-AM). The authors report no other conflicts of interest in this work.
References
1. Nabeshi H, Yoshikawa T, Matsuyama K, et al. Amorphous nanosilica induce endocytosis-dependent ROS generation and DNA damage in human keratinocytes. Part Fibre Toxicol. 2011;8:1. doi:10.1186/1743-8977-8-1
2. AshaRani PV, Low Kah Mun G, Hande MP, Valiyaveettil S. Cytotoxicity and genotoxicity of silver nanoparticles in human cells. ACS Nano. 2009;3(2):279–290. doi:10.1021/nn800596w
3. Wang F, Gao F, Lan M, Yuan H, Huang Y, Liu J. Oxidative stress contributes to silica nanoparticle-induced cytotoxicity in human embryonic kidney cells. Toxicol In Vitro. 2009;23(5):808–815. doi:10.1016/j.tiv.2009.04.009
4. Yang H, Liu C, Yang D, Zhang H, Xi Z. Comparative study of cytotoxicity, oxidative stress and genotoxicity induced by four typical nanomaterials: the role of particle size, shape and composition. J Appl Toxicol. 2009;29(1):69–78. doi:10.1002/jat.1385
5. Kim Y-J, Yu M, Park H-O, Yang S. Comparative study of cytotoxicity, oxidative stress and genotoxicity induced by silica nanomaterials in human neuronal cell line. Mol Cell Toxicol. 2010;6(4):336–343. doi:10.1007/s13273-010-0045-y
6. Sohaebuddin SK, Thevenot PT, Baker D, Eaton JW, Tang L. Nanomaterial cytotoxicity is composition, size, and cell type dependent. Part Fibre Toxicol. 2010;7:22. doi:10.1186/1743-8977-7-22
7. Stoccoro A, Karlsson HL, Coppede F, Migliore L. Epigenetic effects of nano-sized materials. Toxicology. 2013;313(1):3–14. doi:10.1016/j.tox.2012.12.002
8. Hou L, Zhang X, Wang D, Baccarelli A. Environmental chemical exposures and human epigenetics. Int J Epidemiol. 2012;41(1):79–105. doi:10.1093/ije/dyr154
9. Lu X, Miousse IR, Pirela SV, Melnyk S, Koturbash I, Demokritou P. Short-term exposure to engineered nanomaterials affects cellular epigenome. Nanotoxicology. 2016;10(2):140–150. doi:10.3109/17435390.2015.1025115
10. Nelson HH, Marsit CJ, Kelsey KT. Global methylation in exposure biology and translational medical science. Environ Health Perspect. 2011;119(11):1528–1533. doi:10.1289/ehp.1103423
11. Kitkumthorn N, Mutirangura A. Long interspersed nuclear element-1 hypomethylation in cancer: biology and clinical applications. Clin Epigenet. 2011;2(2):315–330. doi:10.1007/s13148-011-0032-8
12. Tarantini L, Bonzini M, Apostoli P, et al. Effects of particulate matter on genomic DNA methylation content and iNOS promoter methylation. Environ Health Perspect. 2009;117(2):217–222. doi:10.1289/ehp.11898
13. Madrigano J, Baccarelli A, Mittleman MA, et al. Prolonged exposure to particulate pollution, genes associated with glutathione pathways, and DNA methylation in a cohort of older men. Environ Health Perspect. 2011;119(7):977–982. doi:10.1289/ehp.1002773
14. Baccarelli A, Wright RO, Bollati V, et al. Rapid DNA methylation changes after exposure to traffic particles. Am J Respir Crit Care Med. 2009;179(7):572–578. doi:10.1164/rccm.200807-1097OC
15. Li JJ, Hartono D, Ong CN, Bay BH, Yung LY. Autophagy and oxidative stress associated with gold nanoparticles. Biomaterials. 2010;31(23):5996–6003. doi:10.1016/j.biomaterials.2010.04.014
16. Sarkar A, Das J, Manna P, Sil PC. Nano-copper induces oxidative stress and apoptosis in kidney via both extrinsic and intrinsic pathways. Toxicology. 2011;290(2–3):208–217. doi:10.1016/j.tox.2011.09.086
17. Jaeger A, Weiss DG, Jonas L, Kriehuber R. Oxidative stress-induced cytotoxic and genotoxic effects of nano-sized titanium dioxide particles in human HaCaT keratinocytes. Toxicology. 2012;296(1–3):27–36. doi:10.1016/j.tox.2012.02.016
18. Ziech D, Franco R, Pappa A, Panayiotidis MI. Reactive oxygen species (ROS)-induced genetic and epigenetic alterations in human carcinogenesis. Mutat Res – Fundam Mol Mech Mutagen. 2011;711(1–2):167–173. doi:10.1016/j.mrfmmm.2011.02.015
19. Ma Y, Guo Y, Wu S, Lv Z, Zhang Q, Ke Y. Titanium dioxide nanoparticles induce size-dependent cytotoxicity and genomic DNA hypomethylation in human respiratory cells. RSC Adv. 2017;7(38):23560–23572. doi:10.1039/C6RA28272E
20. Jintaridth P, Mutirangura A. Distinctive patterns of age-dependent hypomethylation in interspersed repetitive sequences. Physiol Genomics. 2010;41(2):194–200. doi:10.1152/physiolgenomics.00146.2009
21. Asada K, Kotake Y, Asada R, et al. LINE-1 hypomethylation in a choline-deficiency-induced liver cancer in rats: dependence on feeding period. J Biomed Biotechnol. 2006;2006(1):17142. doi:10.1155/JBB/2006/17142
22. Kitkumthorn N, Tuangsintanakul T, Rattanatanyong P, Tiwawech D, Mutirangura A. LINE-1 methylation in the peripheral blood mononuclear cells of cancer patients. Clin Chim Acta. 2012;413(9–10):869–874. doi:10.1016/j.cca.2012.01.024
23. Patchsung M, Boonla C, Amnattrakul P, Dissayabutra T, Mutirangura A, Tosukhowong P. Long interspersed nuclear element-1 hypomethylation and oxidative stress: correlation and bladder cancer diagnostic potential. PLoS One. 2012;7(5):e37009. doi:10.1371/journal.pone.0037009
24. Erikstein BS, Hagland HR, Nikolaisen J, et al. Cellular stress induced by resazurin leads to autophagy and cell death via production of reactive oxygen species and mitochondrial impairment. J Cell Biochem. 2010;111(3):574–584. doi:10.1002/jcb.22741
25. Choudhury SR, Ordaz J, Lo CL, Damayanti NP, Zhou F, Irudayaraj J. From the cover: zinc oxide nanoparticles-induced reactive oxygen species promotes multimodal cyto- and epigenetic toxicity. Toxicol Sci. 2017;156(1):261–274. doi:10.1093/toxsci/kfw252
26. Gao F, Ma N, Zhou H, et al. Zinc oxide nanoparticles-induced epigenetic change and G2/M arrest are associated with apoptosis in human epidermal keratinocytes. Int J Nanomed. 2016;11:3859–3874. doi:10.2147/IJN.S107021
27. Tabish AM, Poels K, Byun HM, et al. Changes in DNA methylation in mouse lungs after a single intra-tracheal administration of nanomaterials. PLoS One. 2017;12(1):e0169886. doi:10.1371/journal.pone.0169886
28. Li JJ, Zou L, Hartono D, Ong C-N, Bay B-H, Lanry Yung L-Y. Gold nanoparticles induce oxidative damage in lung fibroblasts in vitro. Adv Mater. 2008;20(1):138–142. doi:10.1002/(ISSN)1521-4095
29. Lu X, Miousse IR, Pirela SV, et al. In vivo epigenetic effects induced by engineered nanomaterials: A case study of copper oxide and laser printer-emitted engineered nanoparticles. Nanotoxicology. 2016;10(5):629–639. doi:10.3109/17435390.2015.1108473
30. Shyamasundar S, Ng CT, Yung LY, Dheen ST, Bay BH. Epigenetic mechanisms in nanomaterial-induced toxicity. Epigenomics. 2015;7(3):395–411. doi:10.2217/epi.15.3
31. Gong C, Tao G, Yang L, Liu J, Liu Q, Zhuang Z. SiO(2) nanoparticles induce global genomic hypomethylation in HaCaT cells. Biochem Biophys Res Commun. 2010;397(3):397–400. doi:10.1016/j.bbrc.2010.05.076
32. Mohammed MA, Syeda JTM, Wasan KM, Wasan EK. An overview of chitosan nanoparticles and its application in non-parenteral drug delivery. Pharmaceutics. 2017;9:4. doi:10.3390/pharmaceutics9040053
33. Hu YL, Qi W, Han F, Shao JZ, Gao JQ. Toxicity evaluation of biodegradable chitosan nanoparticles using a zebrafish embryo model. Int J Nanomed. 2011;6:3351–3359. doi:10.2147/IJN.S25853
34. Park MR, Gurunathan S, Choi YJ, et al. Chitosan nanoparticles cause pre- and postimplantation embryo complications in mice. Biol Reprod. 2013;88(4):88. doi:10.1095/biolreprod.112.105882
35. Carnell AN, Goodman JI. The long (LINEs) and the short (SINEs) of it: altered methylation as a precursor to toxicity. Toxicol Sci. 2003;75(2):229–235. doi:10.1093/toxsci/kfg138
36. Schulz WA, Steinhoff C, Florl AR. Methylation of endogenous human retroelements in health and disease. Curr Top Microbiol Immunol. 2006;310:211–250.
37. Gonzalgo ML, Jones PA. Rapid quantitation of methylation differences at specific sites using methylation-sensitive single nucleotide primer extension (Ms-SNuPE). Nucleic Acids Res. 1997;25(12):2529–2531.
38. Li TH, Schmid CW. Differential stress induction of individual Alu loci: implications for transcription and retrotransposition. Gene. 2001;276(1–2):135–141.
39. Kim KY, Kim DS, Lee SK, et al. Association of low-dose exposure to persistent organic pollutants with global DNA hypomethylation in healthy Koreans. Environ Health Perspect. 2010;118(3):370–374. doi:10.1289/ehp.0901131
40. Rusiecki JA, Baccarelli A, Bollati V, Tarantini L, Moore LE, Bonefeld-Jorgensen EC. Global DNA hypomethylation is associated with high serum-persistent organic pollutants in Greenlandic Inuit. Environ Health Perspect. 2008;116(11):1547–1552. doi:10.1289/ehp.11338
41. Schmid CW. Does SINE evolution preclude Alu function? Nucleic Acids Res. 1998;26(20):4541–4550.
42. Hitchler MJ, Domann FE. An epigenetic perspective on the free radical theory of development. Free Radic Biol Med. 2007;43(7):1023–1036. doi:10.1016/j.freeradbiomed.2007.06.027
43. Sierra MI, Valdes A, Fernandez AF, Torrecillas R, Fraga MF. The effect of exposure to nanoparticles and nanomaterials on the mammalian epigenome. Int J Nanomed. 2016;11:6297–6306. doi:10.2147/IJN.S120104
44. Magdolenova Z, Collins A, Kumar A, Dhawan A, Stone V, Dusinska M. Mechanisms of genotoxicity. A review of in vitro and in vivo studies with engineered nanoparticles. Nanotoxicology. 2014;8(3):233–278. doi:10.3109/17435390.2013.773464
 © 2019 The Author(s). This work is published and licensed by Dove Medical Press Limited. The
full terms of this license are available at https://www.dovepress.com/terms
and incorporate the Creative Commons Attribution
- Non Commercial (unported, 3.0) License.
By accessing the work you hereby accept the Terms. Non-commercial uses of the work are permitted
without any further permission from Dove Medical Press Limited, provided the work is properly
attributed. For permission for commercial use of this work, please see paragraphs 4.2 and 5 of our Terms.
© 2019 The Author(s). This work is published and licensed by Dove Medical Press Limited. The
full terms of this license are available at https://www.dovepress.com/terms
and incorporate the Creative Commons Attribution
- Non Commercial (unported, 3.0) License.
By accessing the work you hereby accept the Terms. Non-commercial uses of the work are permitted
without any further permission from Dove Medical Press Limited, provided the work is properly
attributed. For permission for commercial use of this work, please see paragraphs 4.2 and 5 of our Terms.