Back to Journals » Diabetes, Metabolic Syndrome and Obesity » Volume 7
Myocardial perfusion imaging for evaluation of suspected ischemia and its relationship with glycemic control in South African subjects with diabetes mellitus
Authors Shmendi A, Pirie F, Naidoo D, Tlou B, Pilloy W, Motala A
Received 6 August 2014
Accepted for publication 2 September 2014
Published 14 November 2014 Volume 2014:7 Pages 545—552
DOI https://doi.org/10.2147/DMSO.S72335
Checked for plagiarism Yes
Review by Single anonymous peer review
Peer reviewer comments 4
Editor who approved publication: Professor Ming-Hui Zou
Akram Shmendi,1 Fraser Pirie,2 Datshana P Naidoo,3 Boikhutso Tlou,4 Wilfred Pilloy,5 Ayesha A Motala2
1Department of Medicine, 2Department of Diabetes and Endocrinology, 3Department of Cardiology, 4Department of Biostatistics, 5Department of Nuclear Medicine, University of KwaZulu-Natal, Durban, South Africa
Background: The relationship between myocardial perfusion imaging (MPI) abnormalities, diabetes mellitus, and glucose control in South African populations is unknown. It was hypothesized that in subjects undergoing MPI for suspected coronary artery disease (CAD), those with diabetes would have more extensive perfusion defects and that diabetes control would influence MPI abnormalities. The aim of this study was to examine the relationship between the severity of CAD diagnosed with MPI in subjects with and without diabetes and to determine the relationship between diabetes control and extent of CAD.
Methods: This study was a retrospective chart review of 340 subjects in whom MPI scans were performed over a 12-month period.
Results: Subjects with diabetes had a higher prevalence of abnormal MPI, with more extensive ischemia, compared with subjects without diabetes (85.6% versus 68%; odds ratio 2.81, P<0.01). Glycated hemoglobin ≥7.0% was associated with a higher risk of abnormal MPI, with more extensive ischemia, compared with subjects having diabetes and glycated hemoglobin <7.0% (odds ratio 2.46, P=0.03) and those without diabetes (odds ratio 4.55, P=0.0001).
Conclusion: Subjects with diabetes have more extensive myocardial ischemia when compared with subjects without diabetes. Furthermore, poorer diabetes control is associated with more abnormalities on MPI scanning.
Keywords: myocardial perfusion imaging, diabetes mellitus, coronary artery disease, glycated hemoglobin
Introduction
The prevalence, incidence, and mortality of all forms of cardiovascular disease are 2–8-fold higher in persons with diabetes.1 In addition, diabetes is an established “coronary risk-equivalent”, ie, patients with diabetes belong to the same risk category as patients with known coronary artery disease (CAD).2 Patients with diabetes and no history of myocardial infarction have been reported to have as high a risk of both myocardial infarction (20% versus 19%) and coronary mortality (15% versus 16%) as patients without diabetes who have a history of myocardial infarction.3
Identification of the presence and severity of CAD in subjects with type 2 diabetes is hampered by the poor sensitivity of electrocardiographic (ECG) tests, and further testing is often required for a definitive diagnosis.4 Coronary angiography is still the gold standard for identification of CAD, despite the existence of different modalities of noninvasive imaging studies, as the temporal and spatial resolution of conventional coronary angiography is higher than any noninvasive study.5 Furthermore, despite results of noninvasive studies showing ischemia, a significant proportion of these patients do not have ischemic disease on conventional coronary angiography or are not eligible for revascularization.6 Coronary angiography is a costly procedure, with limited availability, and carries a risk of complications due to its invasive nature, so it is not feasible or available for many patients.4 Myocardial perfusion imaging (MPI) is a screening test used for the diagnosis and estimation of the extent and severity of CAD, and is reported to have similar diagnostic accuracy for CAD in subjects with and without diabetes mellitus.7
Several reports have compared MPI with other forms of stress imaging in the diagnosis of CAD. A meta-analysis compared the performance of an exercise tolerance test (ETT), single photon-emission computed tomographic (SPECT)-MPI with both exercise and pharmacologic stress, and stress echocardiography in patients with a 25%–75% pretest risk for coronary artery disease. Coronary angiography was performed for each positive test.8 The study reported that ETT had a sensitivity of 68% and specificity of 77%, thallium SPECT-MPI a sensitivity of 88% and specificity of 77%, and stress echocardiography a sensitivity of 76% and specificity of 88% in the diagnosis of CAD, when compared with coronary angiography. Other reports have suggested that the severity of MPI abnormalities in patients with diabetes is a predictor of future myocardial infarction and cardiac death, and the use of stress MPI in conjunction with clinical information can provide risk stratification in these patients.9,10
Control of hyperglycemia and modification of other CAD risk factors is essential for the prevention of CAD and its complications in subjects with type 2 diabetes. Several studies have examined the relationship between long-term glucose control, measured by glycated hemoglobin (HbA1c) in patients with diabetes, and the extent and severity of CAD.11,12 DeLuca et al noted that the prevalence of silent myocardial ischemia detected by stress or pharmacological MPI in patients who had no previous history of CAD was greater in those with diabetes than in those without diabetes. In addition, the prevalence of silent myocardial ischemia was greater in patients with poorly controlled diabetes (HbA1c >7.6%) as compared with those with optimal glycemic control (HbA1c <7.6%).11 Another study found that the risk for abnormal MPI and the prevalence of myocardial ischemia (detected by MPI) was greater in subjects with diabetes than in subjects without diabetes, and more abnormalities were found in those with poor glycemic control.12 Similarly, Ravipati et al noted that higher HbA1c levels were associated with more severe angiographically determined CAD.13
The current study aimed to examine the relationship between the extent and severity of CAD, diagnosed with MPI, in relation to the presence of diabetes and other CAD risk factors. The hypothesis was that patients with diabetes have more abnormal and severe perfusion defects compared with those without diabetes, with increased risk in those with poor long-term glycemic control.
Materials and methods
Study population and patient selection
This was a retrospective chart review of 340 patients referred for MPI studies to the Department of Cardiology at Inkosi Albert Luthuli Central Hospital in Durban, KwaZulu-Natal, between January 1, 2012 and December 31, 2012.
Data collection
Electronic medical records were used to access patient demographic and relevant medical history, including the diagnosis of diabetes, hypertension, prior CAD, use of lipid-lowering medication and aspirin, smoking, and other risk factors. In this study, subjects with diabetes were defined as individuals taking anti-hyperglycemic agents (oral agents, insulin, or combination) while subjects with dyslipidemia were defined as individuals taking lipid-lowering medications or with abnormal lipid levels (total cholesterol ≥5.18 mmol/L, triglycerides ≥1.7 mmol/L, low-density lipoprotein cholesterol ≥2.59 mmol/L, and high-density lipoprotein cholesterol <1.0 mmol/L in males or <1.3 mmol/L in females). Glycemic control was considered optimal if HbA1c was <7.0% (53 mmol/mol) and was considered to be suboptimal if HbA1c was ≥7.0% (53 mmol/mol). Hypertension was diagnosed if patients were taking anti-hypertensive medication, and smoking was defined as current smokers, according to the medical records.
Results of a resting ECG, exercise treadmill tests, and echocardiography were obtained from the medical records. An abnormal ECG was defined as one showing either an ischemic or infarct pattern. An abnormal ETT was defined as one showing an ischemic pattern during stress. Abnormal echocardiography was defined as the presence of a valvular abnormality, abnormal wall motion, or signs of left ventricular dysfunction. Finally, abnormal wall motion was defined as either hypokinesia or akinesia. In addition, results of biochemical tests, including plasma glucose, HbA1c, serum lipids, and creatinine were recorded. The presence or absence of microalbuminuria was determined by a spot urine albumin/creatinine ratio exceeding 3.5 mg/mmol in females and 2.5 mg/mmol in males.
MPI protocol
All patients completed either a symptom-limited exercise test using a standard Bruce protocol or received a weight-based dipyridamole infusion over 4 minutes followed by 4 minutes of low-level treadmill exercise, if tolerated.14 A 2-day imaging protocol (stress-rest) was performed using 15 mCi of technetium 99m-sestamibi injected at the peak of stress for stress imaging on the first day, and the same dose of technetium 99m-sestamibi for rest imaging at least 24 hours after stress imaging. Imaging started 30–60 minutes after the stress injection and 60–90 minutes after the rest injection.14
SPECT was performed while the patient was in a supine position and gated acquisition (step and shoot with 32–64 steps separated by 3°–6°) was undertaken on the stress images. In the vast majority (95%), the images were interpreted without attenuation correction. Attenuation correction was done only in those patients with a very high body mass index (BMI). Images and figures were analyzed with MPI (Siemens Corridor 4DM V501) and reviewed by a nuclear physician and cardiologist together. The rest and stress transaxial slices were uploaded to be automatically processed and analyzed by the described software. The results were then displayed as functional maps, where the degree of ischemia was presented along the representative segments. The same data processed through the same program will produce identical results and there is no subjective interpretation. Agreement was reached between the cardiologist and nuclear physician, with <5% interobserver variability. A study was interpreted as abnormal if there was evidence of ischemia, infarction, or a combination. Ischemia was defined as stress-induced reduction in myocardial tracer uptake which reversed by more than 10% with rest, and infarction was defined as a fixed reduction in myocardial tracer uptake. Both reversible and fixed reduction in myocardial tracer uptake could occur in different areas of the heart in a single patient.
The summed difference score was used for stratification of ischemia into mild (2–4.99), moderate (5–7), and severe (>7) grades. The score is derived from the difference between two semi-quantitative scores, ie, the summed stress score, which detects the extent and severity of perfusion defect during stress, and the summed rest score, which detects the extent and severity of perfusion defect during rest. These scores have been shown to have substantial diagnostic value in the assessment of CAD.15
Statistical analysis
Statistical Package for the Social Sciences version 21.0 software (IBM Corporation, Armonk, NY, USA) was used to analyze the data. The chi-squared test was used for categorical variables and the Student’s t-test was used for continuous variables. The Mann–Whitney test was used to compare subjects with and without diabetes and the well-controlled versus poorly controlled patients with diabetes; the test variable was the MPI result. In addition, subjects with a normal MPI scan were compared with those with an abnormal scan. Multiple linear regression analysis was used to assess the effect of diabetes duration, HbA1c, lipid levels, blood pressure, smoking, and other risk factors on the severity of CAD. Bonferroni correction was used to calculate the differences in the degree of ischemia. A P-value <0.05 was regarded as statistically significant.
Results
Clinical and laboratory results
Table 1 shows the clinical and laboratory characteristics of the study group. The total study group included 340 subjects, of whom 146 (43%) did not have diabetes and 194 (57%) had diabetes.
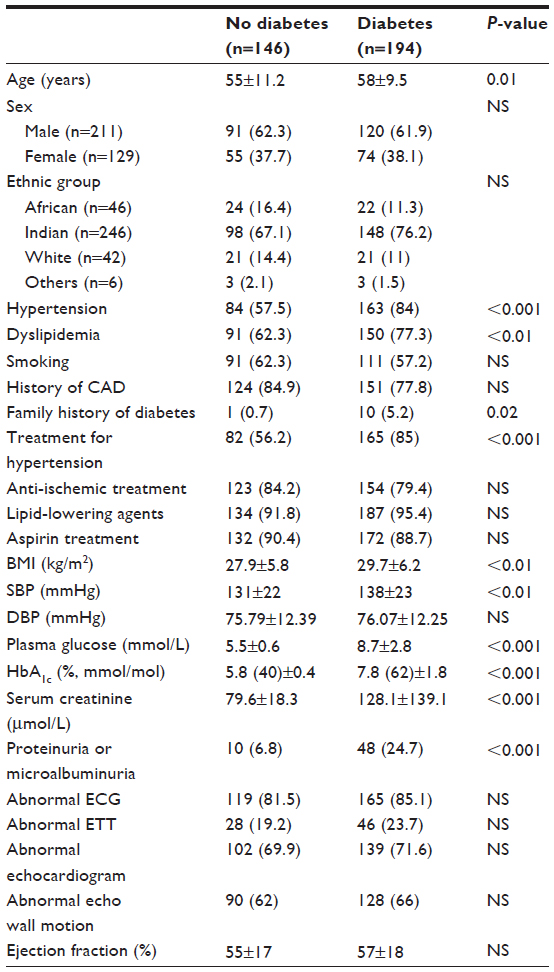 | Table 1 Clinical and laboratory characteristics of the study subjects (n=340) |
When compared with subjects without diabetes, those with diabetes were older, more had a diagnosis of hypertension, dyslipidemia, and a family history of diabetes, and more were using anti-hypertensive medications. In addition, subjects with diabetes had a higher BMI, systolic blood pressure (BP), serum creatinine, plasma glucose, and HbA1c, and a greater frequency of proteinuria or microalbuminuria. There was no significant difference between the groups for sex, ethnic group, smoking history, history of CAD, history of peripheral vascular disease, history of cardiovascular disease, diastolic BP, lipid levels (total cholesterol, triglycerides, high-density lipoprotein cholesterol, and low-density lipoprotein cholesterol), or use of aspirin or anti-ischemic and lipid-lowering agents. In addition, there was no difference in ECG, ETT, or echocardiographic findings.
MPI study
Normal versus abnormal
Seventy-four (22%) subjects had normal MPI scans and 266 (78%) had abnormal MPI scans (Table 2). When compared with those who had normal MPI scans, the group with abnormal scans included more males and smokers, and were more likely to have diabetes, a family history of CAD, and peripheral vascular disease. In addition, subjects with abnormal MPI had a higher plasma glucose, HbA1c, total cholesterol, and low-density lipoprotein cholesterol, were more likely to be on anti-ischemic medications, and more likely to have an abnormal ECG and abnormal echocardiography. Subjects with abnormal MPI had a lower BMI and lower systolic BP. An abnormal ETT, duration of diabetes, and nature of treatment for hyperglycemia were not associated with an abnormal MPI scan.
 | Table 2 Comparison of subjects with normal and abnormal MPI results |
Diabetes versus no diabetes
When subjects with diabetes were compared with those without diabetes (Table 3), an abnormal MPI was more frequent in those with diabetes. In addition, both MPI ischemia and infarction were more frequently demonstrated in those with diabetes.
 | Table 3 Results of MPI in subjects with (n=194) and without diabetes mellitus (n=146) |
Diabetes control and MPI result
Of the subjects with diabetes, 88 patients (45%) had an HbA1c <7.0% and 106 patients (55%) had an HbA1c ≥7.0%. When subjects with poor glycemic control were compared with those with optimal glycemic control (Table 4), an abnormal MPI was more frequent in those with HbA1c ≥7.0%. The subjects with diabetes and poor glycemic control more often had an abnormal MPI when compared with subjects without diabetes (Table 5). In addition, MPI ischemia and infarction were more frequently demonstrated in those who had poor glycemic control compared with those who had optimal glycemic control and when compared with those without diabetes.
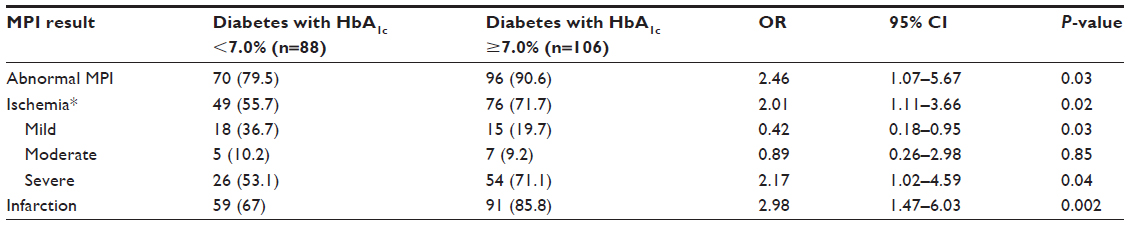 | Table 4 Myocardial perfusion imaging results in subjects with diabetes mellitus based on glycemic control |
 | Table 5 MPI results in subjects without diabetes (n=146) and those with diabetes and HbA1c ≥7.0% (n=106) |
Grade of ischemia and diabetes status
Despite ischemia being more common overall in subjects with diabetes than in those without diabetes, there was no significant difference between the groups for each level of ischemia as defined by the summed difference score (Table 3). However, in the subjects with diabetes, mild ischemia was more often found in subjects with HbA1c <7.0% (Table 4). More severe ischemia was found in the subjects with diabetes compared with subjects without diabetes (Table 3), and in subjects with diabetes and HbA1c ≥7.0% (Tables 4 and 5). After Bonferroni correction, a significant difference remained between moderate and severe MPI ischemia in subjects with diabetes compared with those without diabetes (P=0.007).
Multiple linear regression analysis was used to assess the effect of diabetes duration, HbA1c, lipid levels, blood pressure, smoking, and other risk factors for severity of CAD. None of the risk factors were significant, as depicted in Table 6.
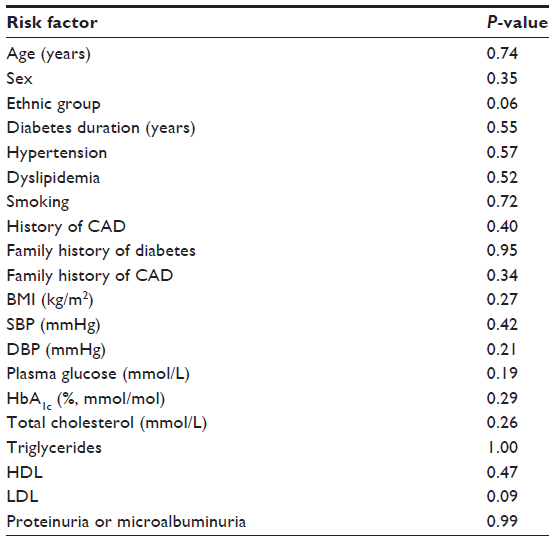 | Table 6 Multiple linear regression analysis results |
Discussion
In this study, abnormal MPI scans were more often found in men and those with diabetes, dyslipidemia, and abnormal ECG and echocardiography. In subjects with diabetes, there was a higher prevalence of CAD risk factors and MPI evidence of ischemia and infarction. The frequency and severity of MPI abnormalities was higher in diabetic subjects with poor glycemic control.
All patients in the current study were referred to a tertiary cardiology service for assessment of possible CAD, and therefore represent a group of subjects in whom risk factors for or symptoms of CAD had been identified. CAD is a major cause of morbidity and mortality in subjects with diabetes,16 and the current study has shown both MPI-defined myocardial ischemia and infarction to be more common in the group with diabetes. Amongst the risk factors examined for CAD, the study showed older age, higher BMI, more frequent hypertension, higher systolic BP, and lipid abnormalities in the group with diabetes when compared with the group without diabetes.
The UK Prospective Diabetes Study showed that better glycemic control was associated with a reduction in both CAD prevalence and mortality after a mean of 10 years of follow-up.17 Although this is a cross-sectional and retrospective study, poorer glycemic control amongst the subjects with diabetes was associated with more extensive ischemia and infarction on MPI scanning. These findings are in accord with those reported by DeLuca et al and Nicole et al.11,12 In a retrospective chart review, DeLuca et al demonstrated that the prevalence of silent myocardial ischemia detected by MPI in diabetic patients who had no known CAD was higher in those with HbA1c ≥7.6% than in those with HbA1c <7.6% (50% versus 28%, P<0.005). Nicole et al demonstrated that the risk and prevalence of abnormal MPI (ischemia, infarction, or mixed defect) in patients with symptoms of CAD was greater in diabetic patients than in those without diabetes (41% versus 28%, P<0.001). In the same study, MPI abnormality was more severe in those with diabetes and poor glycemic control (HbA1c ≥7.0%) than in nondiabetic patients (41% versus 28%, P=0.02), and the prevalence of abnormal MPI scans increased as HbA1c increased (46% of diabetes with HbA1c ≥8.0% versus 28% of nondiabetics, P=0.02).
In the current study, when the subjects with diabetes were grouped according to HbA1c, mild ischemia (as defined by the summed difference score) was more common in those with HbA1c <7.0%, lending further support to the notion that glycemic control plays an important role in both the extent and severity of CAD in subjects with diabetes.
In this study, a family history of diabetes was found more often in the group with diabetes, but there was no association between MPI abnormalities and family history. Other studies have shown a strong association between family history and atherosclerosis, measured by carotid-intima media thickness, even in subjects with normal glucose tolerance.18 It is possible that the retrospective nature of the current study may have weakened the association with family history. A recent review has further highlighted the importance of family history as a risk factor for atherosclerosis and emphasized the role of prediabetes as an additional important risk factor.19 No data on prediabetes were collected in the present study.
Despite the association between more prevalent and severe MPI abnormalities and presence of diabetes, duration of known diabetes was not associated with MPI-defined CAD in the current study. This may be accounted for by the nature of the study (retrospective, cross-sectional) or by underdiagnosis of diabetes prior to the onset of ischemic symptoms that would prompt diagnostic testing.
The retrospective nature of this study is a limitation in that reliance was placed on the accuracy of available medical records. Furthermore, the study is limited by referral bias, since the majority of patients were referred for MPI on the basis of presence of symptoms, and the majority had multiple CAD risk factors.
Screening for the presence of asymptomatic CAD in subjects with diabetes is hampered by the limited sensitivity and specificity of noninvasive diagnostic modalities. Previous studies have shown that the ETT has a sensitivity of 68% and specificity of 77% for diagnosis of CAD.20 In subjects with an abnormal MPI scan, an abnormal resting ECG was more often present in those with MPI-defined CAD, but there was no association with an abnormal ETT. Several factors could account for this, including autonomic neuropathy, which may impair exercise tolerance as well as affect the heart rate, BP, and cardiac output responses to exercise.21 Poor physical fitness and other comorbidities, such as peripheral vascular disease, would also interfere with the ability of the patient to exercise to a level high enough to produce meaningful results on ETT. In addition, baseline ECG abnormalities, such as left ventricular hypertrophy and resting ST-segment changes, are common in patients with diabetes and this may interfere with interpretation of the ETT.
Other noninvasive modalities that provide useful information on the presence and extent of atherosclerosis in subjects at risk for CAD include use of ultrasound to determine flow-mediated vasodilatation, anteroposterior abdominal aorta diameter, and intima-media thickness of the common carotid artery, as recently reviewed by Ciccone et al.22 These modalities were not evaluated in the current study.
It is not feasible to perform coronary angiography in large numbers of patients with suspected CAD, so accurate noninvasive screening tools are required to assist in risk stratification. This is particularly important in subjects with diabetes, in whom ECG-based screening methods have limited sensitivity.23 While MPI scanning is more costly and less widely available than ECG-based diagnostic tools, it has the advantage of the ability to distinguish areas of reversible ischemia from areas of fixed ischemia, as well as to more accurately map the vascular territories affected. In addition, functional detail is obtained by measurement of ejection fraction, making this a useful noninvasive tool to evaluate CAD in subjects with diabetes.
Conclusion
The current study has shown that subjects with diabetes carry a greater burden of CAD than those without diabetes. Furthermore, poorer glycemic control is associated with more severe CAD. MPI scanning is a useful tool in the assessment of these patients, providing more information than ECG-based diagnostic investigations.
Acknowledgment
The authors are grateful to the staff of the Department of Nuclear Medicine at Inkosi Albert Luthuli Central Hospital for their assistance.
Disclosure
The authors report no conflicts of interest in this work.
References
Redberg RF, Greenland P, Fuster V, et al. Prevention Conference VI: Diabetes and Cardiovascular Disease, Writing Group III: risk assessment in persons with diabetes. Circulation. 2002;105:144–152. | |
[No authors listed]. Third Report of the National Cholesterol Education Program (NCEP) Expert Panel on Detection, Evaluation, and Treatment of High Blood Cholesterol in Adults (Adult Treatment Panel III). Circulation. 2002;106:3143–3421. | |
Haffner SM, Lehto S, Rönnemaa T, Pyörälä K, Laakso M. Mortality from coronary heart disease in subjects with type 2 diabetes and in non-diabetic subjects with and without prior myocardial infarction. N Engl J Med. 1998;339:229–234. | |
Bax JJ, Inzucchi SE, Bonow RO, Schuijf JD, Freeman MR, Barrett EJ; Global Dialogue Group for the Evaluation of Cardiovascular Risk in Patients with Diabetes. Cardiac imaging for risk stratification in diabetes. Diabetes Care. 2007;30:1295–1304. | |
Rubinshtein R, Jaffe R. Fractional flow reserve guided revascularization in daily practice. Cardiovasc Diagn Ther. 2013;3:122–124. | |
Santos MB, Ferreira AM, de Araújo Gonçalves P, et al. Diagnostic yield of current referral strategies for elective coronary angiography in suspected coronary artery disease – an analysis of the ACROSS registry. Rev Port Cardiol. 2013;32:483–488. | |
Kang X, Berman DS, Lewin HC, et al. Comparative ability of myocardial perfusion single-photon emission computed tomography to detect coronary artery disease in patients with and without diabetes mellitus. Am Heart J. 1999;137:949–957. | |
Garber AM, Solomon NA. Cost-effectiveness of alternative test strategies for the diagnosis of coronary artery disease. Ann Intern Med. 1999;130:719–728. | |
Giri S, Shaw LJ, Murthy DR, et al. Impact of diabetes on the risk stratification using stress single-photon emission computed tomography myocardial perfusion imaging in patients with symptoms suggestive of coronary artery disease. Circulation. 2002;105:32–40. | |
Vanzetto G, Halimi S, Hammoud T, et al. Prediction of cardiovascular events in clinically selected high risk NIDDM patients. Prognostic value of exercise stress test and thallium-201 single photon emission computed tomography. Diabetes Care. 1999;22:19–26. | |
DeLuca AJ, Saulle LN, Aronor WS, Ravipati G, Weiss MB. Prevalence of silent myocardial ischemia in persons with diabetes mellitus or impaired glucose tolerance and association of HbA1c with prevalence of silent myocardial ischemia. Am J Cardiol. 2005;95:1472–1474. | |
Lynn Fillipon NM, Kitkungvan D, Dani SS, Downey BC. The relationship between glycosylated hemoglobin and myocardial perfusion imaging. Clin Cardiol. 2012;35:565–569. | |
Ravipati G, Aronow WS, Ahn C, Sujata K, Saulle LN, Weiss MB. Association of hemoglobin A1c with severity of coronary artery disease in patients with diabetes mellitus. Am J Cardiol. 2006;97:968–969. | |
Hesse B, Tagil K, Cuocolo A, et al. EANM/ESC procedural guidelines for myocardial perfusion imaging. Eur J Nucl Med Mol Imaging. 2005;32:855–897. | |
Danias PG, Papaioannou GI, Ahlberg AW, et al. Usefulness of electrocardiographic-gated stress technetium-99m sestamibi single photon emission computed tomography to differentiate ischemic from nonischemic cardiomyopathy. Am J Cardiol. 2004;94:14–19. | |
Bax J, Young L, Frye R, Bonow RO, Steinberg HO, Barrett EJ. Screening for coronary artery disease in patient with diabetes. Diabetes Care. 2007;30:2729–2736. | |
Holman RR, Paul SK, Bethel MA, Matthews DR, Neil HA. 10-Year follow-up of intensive glucose control in type 2 diabetes. N Engl J Med. 2008;359:1577–1589. | |
Pannacciulli N, De Pergola G, Ciccone M, Rizzon P, Giorgino F, Giorgino R. Effect of family history of type 2 diabetes on the intima-media thickness of the common carotid artery in normal-weight, overweight, and obese glucose-tolerant young adults. Diabetes Care. 2003;26:1230–1234. | |
Ciccone MM, Scicchitano P, Cameli M, et al. Endothelial function in pre-diabetes, diabetes and diabetic cardiomyopathy: a review. J Diabetes Metab. 2014;5:364. | |
Hayashino Y, Nagata-Kobayashi S, Morimoto T, Maeda K, Shimbo T, Fukui T. Cost effectiveness of screening for coronary artery disease in asymptomatic patients with type 2 diabetes and additional atherogenic risk factors. J Gen Intern Med. 2004;19:1181–1191. | |
Vinik A, Ziegler D. Diabetic cardiovascular autonomic neuropathy. Circulation. 2007;115:387–397. | |
Ciccone MM, Bilianoub E, Balbarinic A, et al. Task force on: ‘Early markers of atherosclerosis: influence of age and sex’. J Cardiovasc Med (Hagerstown). 2013;14:757–766. | |
Schlegel T, Kulecz W, Feiverson A, et al. Accuracy of advanced versus strictly conventional 12 lead ECG for detection and screening of coronary artery disease, left ventricular hypertrophy, and left ventricular systolic dysfunction. BMC Cardiovasc Disord. 2010;10:28. |
 © 2014 The Author(s). This work is published and licensed by Dove Medical Press Limited. The
full terms of this license are available at https://www.dovepress.com/terms
and incorporate the Creative Commons Attribution
- Non Commercial (unported, 3.0) License.
By accessing the work you hereby accept the Terms. Non-commercial uses of the work are permitted
without any further permission from Dove Medical Press Limited, provided the work is properly
attributed. For permission for commercial use of this work, please see paragraphs 4.2 and 5 of our Terms.
© 2014 The Author(s). This work is published and licensed by Dove Medical Press Limited. The
full terms of this license are available at https://www.dovepress.com/terms
and incorporate the Creative Commons Attribution
- Non Commercial (unported, 3.0) License.
By accessing the work you hereby accept the Terms. Non-commercial uses of the work are permitted
without any further permission from Dove Medical Press Limited, provided the work is properly
attributed. For permission for commercial use of this work, please see paragraphs 4.2 and 5 of our Terms.