Back to Journals » ImmunoTargets and Therapy » Volume 15
Myeloid Cell-Derived Thrombospondin-1 Mediates Anti-Metastatic Effects of Histamine Dihydrochloride in B16 Melanoma
Authors Issdisai N ![]() , Kaya M, Hellstrand K, Grauers Wiktorin H, Martner A
, Kaya M, Hellstrand K, Grauers Wiktorin H, Martner A
Received 20 January 2026
Accepted for publication 16 April 2026
Published 6 June 2026 Volume 2026:15 596703
DOI https://doi.org/10.2147/ITT.S596703
Checked for plagiarism Yes
Review by Single anonymous peer review
Peer reviewer comments 2
Editor who approved publication: Professor Jadwiga Jablonska
Nuttida Issdisai,1 Mustafa Kaya,1 Kristoffer Hellstrand,2 Hanna Grauers Wiktorin,1,3,* Anna Martner1,*
1Department of Microbiology and Immunology, Institute of Biomedicine, Sahlgrenska Academy, University of Gothenburg, Gothenburg, Sweden; 2Department of Infectious Diseases, Institute of Biomedicine, Sahlgrenska Academy, University of Gothenburg, Gothenburg, Sweden; 3Department of Immunology, Genetics and Pathology, Uppsala University, Uppsala, Sweden
*These authors contributed equally to this work
Correspondence: Anna Martner, Department of Microbiology and Immunology, Institute of Biomedicine, Sahlgrenska Academy, University of Gothenburg, Gothenburg, Sweden, Email [email protected]
Introduction: Histamine dihydrochloride (HDC) has been shown to reduce metastatic spread of tumors by modulating myeloid cells, including immunosuppressive monocytes. Thrombospondin-1 (TSP-1), a matricellular glycoprotein present in the pre-metastatic niche, has also been implicated in limiting tumor metastasis. Microarray analyses have identified THBS1, encoding TSP-1, as an HDC-induced gene in human myeloid cells. This study investigated the mechanisms underlying HDC-induced TSP-1 expression and assessed whether TSP-1 contributes to the anti-metastatic effects of HDC in melanoma progression.
Methods: TSP-1 expression and secretion were analyzed in human and murine myeloid cell subsets following HDC stimulation. Patient datasets were used to assess the clinical relevance of THBS1 expression in melanoma tissue. The functional significance of TSP-1 for HDC-mediated metastasis control was investigated in the B16F10 melanoma model of hematogenous lung metastasis in wild-type and TSP-1 knockout (KO) mice.
Results: HDC robustly induced TSP-1 expression and secretion across multiple myeloid cell populations, including human and murine myeloid-derived suppressor cells. This effect was mediated via histamine type-2 receptors (H2Rs) and downstream cAMP-PKA signaling. Analysis of human melanoma datasets revealed reduced THBS1 expression in tumor tissue and an association between high THBS1 expression and improved overall survival. In addition, THBS1 expression correlated with the histamine synthesis gene histidine decarboxylase in human melanoma samples. In vivo, systemic HDC treatment increased lung TSP-1 levels and reduced pulmonary metastasis in wild-type but not in TSP-1 KO mice.
Discussion: We identify TSP-1 as a downstream effector of HDC in myeloid cells and show that its induction is mediated by H2R-dependent cAMP-PKA signaling. The association between THBS1 expression and favorable survival in human melanoma supports a protective role for TSP-1. These findings suggest a previously unrecognized myeloid-cell mediated mechanism of HDC with potential relevance for metastasis control. The diagram illustrates the effect of histamine on myeloid cells and its impact on metastatic burden in the lungs. On the left, a myeloid cell is shown with histamine interacting with the histamine type 2 receptor, leading to activation of AC, cAMP and PKA, which subsequently increases THBS1 production. This process results in the release of TSP-1. On the right, two scenarios are depicted: ’No histamine’ shows lungs with a higher metastatic burden, while ’Histamine’ shows lungs with a reduced metastatic burden. The diagram highlights the role of histamine in reducing metastatic burden through its action on myeloid cells.Diagram of histamine’s effect on myeloid cells and metastatic burden in lungs.
Keywords: thrombospondin-1, histamine dihydrochloride, cAMP–PKA signaling, myeloid-derived suppressor cells, lung metastasis, B16 melanoma
Introduction
Histamine dihydrochloride (HDC), a chlorinated salt of the endogenous biogenic amine histamine, has demonstrated immunostimulatory properties and anti-tumor activity in preclinical and clinical settings.1–4 Endogenous histamine is generated by histidine decarboxylase, which is primarily expressed in mast cells, basophils and myeloid progenitors.5–7 HDC is approved in the European Union as an adjunct to immunotherapy for patients with acute myeloid leukemia (AML).8–11 In this context, HDC is thought to act by targeting immunosuppressive myeloid cell populations, including myeloid-derived suppressor cells (MDSCs), thereby facilitating the elimination of leukemic cells by natural killer (NK) cells and cytotoxic T lymphocytes.10,12,13
Beyond its clinical utility in AML, HDC has demonstrated anti-tumor and anti-metastatic efficacy in murine models of solid cancer, including melanoma and breast cancer. In these studies, the therapeutic effects of HDC were linked to its modulation of MDSCs and other immunosuppressive myeloid subsets that promote immune evasion and metastatic dissemination.13,14 In addition, HDC was reported to enhance the therapeutic efficacy of immune checkpoint inhibitors targeting programmed cell death protein 1 (PD-1) and its ligand PD-L1 in murine colorectal cancer models,13 further supporting its role as an immunomodulatory agent with potential application across cancer types.
Despite these findings, the detailed mechanisms underlying the anti-tumor effects of HDC remain incompletely understood. In a previous study, transcriptomic profiling of HDC-treated PLB-985 human myelomonocytic cells identified THBS1, encoding thrombospondin-1 (TSP-1), as the most highly upregulated gene following HDC exposure.15
TSP-1 is a multifunctional matricellular protein with context-dependent effects in cancer, including melanoma. These diverse activities likely stem from its ability to engage multiple receptors such as integrins, CD36, CD47 and LRP-1 expressed on tumor cells, endothelial cells and immune cells.16,17 Within the tumor microenvironment, TSP-1 is produced by several cellular sources, including tumor cells, platelets, stromal populations and myeloid cells.16,18 The best characterized anti-tumor function of TSP-1 is the inhibition of angiogenesis through CD36-mediated signaling in endothelial cells, thereby limiting neovascularization, tumor growth and metastatic progression, as demonstrated in melanoma and other cancers.19–21 Beyond its vascular effects, TSP-1 can also contribute to tumor control by inducing apoptosis in CD36-expressing cancer cells22 and by modulating the immune microenvironment, for example through promotion of M1-like macrophage polarization.23
However, TSP-1 is also reported to exert context-dependent pro-tumorigenic effects, underscoring its pleiotropic functions within the tumor microenvironment. In established tumors, TSP-1 engagement of CD47 expressed by infiltrating T cells was shown to promote T cell exhaustion.24 In addition, macrophage-derived TSP-1 was reported to exert divergent effects on tumor progression, promoting primary tumor growth via activation of TGF-β-dependent fibrosis, while suppressing metastasis through anti-angiogenic mechanisms.25 Notably, recent studies demonstrate that enforced expression of TSP-1 in metastasis-promoting Gr1⁺ myeloid cells reprograms these cells into metastasis-restraining effector cells within the tumor microenvironment,26,27 highlighting a potentially protective role for myeloid-derived TSP-1 in limiting metastatic dissemination.
These previous results prompted us to investigate the mechanisms underlying HDC-induced TSP-1 expression in myeloid cells and to determine whether TSP-1 contributes to the anti-metastatic effects of HDC in a preclinical model of melanoma metastasis. We identify a previously unrecognized mechanism in which HDC, via agonist activity at histamine type 2 receptors (H2Rs) and downstream activation of the cAMP/protein kinase A (PKA) signaling pathway, induces TSP-1 production in myeloid cells. Our results also imply that the observed induction of TSP-1 is required for the anti-metastatic properties of HDC, thus suggesting a novel axis linking histamine receptor signaling to TSP-1-mediated modulation of melanoma progression.
Materials and Methods
Cell Lines
The human myelomonoblastic cell line PLB-985 wild type (WT) and its NOX2-deficient variant (NOX2-KO) were kindly provided by Dr. Mary Dinauer (Washington University School of Medicine, St. Louis, MO, USA). Cells were cultured in Iscoves’ Modified Dulbecco´s medium (IMDM; Gibco) supplemented with 10% fetal calf serum (FCS), 2 mM L-glutamine (Gibco), 100 U/mL penicillin, and 100 µg/mL streptomycin (Gibco) and maintained at 37°C in 5% CO2.
B16F10 murine melanoma cells were originally obtained from the American Type Culture Collection (ATCC) and were sourced in 2022 from the Cell Culture Laboratory at the Department of Virology, University of Gothenburg. Cells were cultured in IMDM supplemented with 10% FCS, 2 mM L-glutamine, 1 mM sodium pyruvate (Gibco), 100 U/mL penicillin, and 100µg/mL streptomycin at 37°C in 5% CO2. Cells were passaged and expanded for one week prior to injection into mice.
Upon receipt of the cell lines, aliquots were prepared and confirmed to be free from Mycoplasma contamination using PCR-based detection. Cell line authentication was performed in 2025 by Eurofins Genomics through Short Tandem Repeat analysis, confirming their identities as PLB-985 and B16F10.
Isolation of Peripheral Blood Mononuclear Cells and Monocytes
Peripheral blood mononuclear cells (PBMCs) were isolated from healthy blood donor buffy coats using density centrifugation with Lymphoprep (0707861, Stemcell Technologies). Monocytes were subsequently purified from PBMCs using the Pan Monocyte Isolation Kit (Miltenyi Biotec), according to the manufacturer’s instructions. This negative selection yielded unlabeled monocytes at a purity exceeding 85% across all donors.
For comparative analysis of TSP-1 production in myeloid cells from cancer patients and healthy controls, cryopreserved PBMCs were used. These included samples from nine newly diagnosed, untreated pancreatic ductal adenocarcinoma (PDAC) patients enrolled in the immune phenotype pancreatic cancer (IPEP) trial,28 along with cryopreserved PBMCs from healthy donors recruited at the blood center at Sahlgrenska University Hospital. The PBMCs had been isolated by density gradient centrifugation with Lymphoprep and subsequently cryopreserved. The IPEP study was approved by the Regional Ethics Review Board in Gothenburg, Sweden (ethical approval no. 057–18, approved on 7 March 2018) and was conducted in accordance with the Declaration of Helsinki. All participants were >18 years of age and gave written informed consent before enrolment.
Cell Cultures and Treatments
PLB-985 cells were treated in complete medium with 0.1–1000 µM HDC (Sigma-Aldrich), 100 nM diphenyleneiodonium (DPI; Sigma-Aldrich), 500 U/mL catalase (Sigma-Aldrich), 1 µM GSK2795039 (Medchemexpress), 50 µM ranitidine (GlaxoSmithKline), 50 µM AH 20239AA (a chemical inert control to ranitidine; GlaxoSmithKline), 100 µM N-methylhistamine (NMH; Sigma-Aldrich), or 10 µM fexofenadine (Sigma-Aldrich). Treatments were applied individually or in combinations for 8 to 48 hours. PBMCs, monocytes, and non-monocyte fractions were cultured in complete IMDM in the presence or absence of 100 µM HDC for 24 or 48 hours.
In some experiments, primary human monocytes cultured in complete IMDM were treated with 100 µM HDC, 100 µM NMH, 20 µM forskolin (Sigma-Aldrich), 10 nM cholera toxin (Sigma-Aldrich), or 500 µM 8-bromoadenosine 3′,5′-cyclic monophosphate sodium salt (8-bromo-cAMP; Sigma-Aldrich), either alone or in combination with 10 µM of the PKA inhibitor H89 (Medchemexpress). H89 was added 30 minutes prior to stimulation, and cells were incubated for 24 hours before the collection of cell culture supernatants.
ELISA
Cell culture supernatants from PLB-985 cells, PBMCs and isolated monocytes were collected at various time points. TSP-1 levels were quantified by the human DuoSet TSP-1 ELISA kit (R&D Systems), according to the manufacturer’s instructions.
Assessment of Metastasis in Mice
Female C57BL/6J mice were obtained from Charles River Laboratories (Sulzfeld, Germany), while B6.129S2-Thbs1tm1Hyn/J (TSP-1 knockout, TSP-1 KO) mice were obtained from The Jackson Laboratory (Karlslunde, Denmark) and subsequently bred in-house. All animals were housed under specific pathogen-free conditions with an unlimited supply of food and water at the Experimental Biomedicine facility, University of Gothenburg. Purchased animals were acclimatized for at least one week at the facility prior to being used for experiments. All experiments were performed in accordance with institutional guidelines and were approved by the Regional Animal Ethics Committee in Gothenburg, Sweden. The work was carried out under two ethical permits: permit no. 5.8.18–14,836/2019 (application ID 002483, approved on Jan 22, 2020) and permit no. 5.8.18–13,591/2023 (application ID 005593, approved on Aug 23, 2023). The study followed the ARRIVE guidelines for reporting animal research.
C57BL/6J and TSP-1 KO mice at 7–12 weeks of age were randomly assigned to experimental groups of 4–5 mice per group. Mice were injected intraperitoneally (i.p.) every other day with three doses of physiological NaCl (control) or HDC (Sigma-Aldrich), 1500 µg/mouse in a prophylactic manner. The day after the first i.p. injection, 1.0–1.5×10⁵ B16F10 cells were injected intravenously (i.v.) via the tail vein. The injector was unaware of the treatment (HDC or NaCl) at the time of tumor cell injection, while group allocation was otherwise known to the experimentalist. Three weeks post-inoculation of B16F10 cells, mice were anaesthetized with isoflurane vapour and euthanized by cervical dislocation. Lungs were then collected and metastatic foci were enumerated by light microscopy. No mice were excluded from this dataset.
Isolation of Gr1+ Myeloid Cells
Bone marrow cells were harvested from the tibia and femur bones of naive C57BL/6J mice. Following red blood cell lysis using ACK lysis buffer (prepared by the Clinical Microbiology, Sahlgrenska University Hospital), Gr1+ myeloid cells were labeled with a biotinylated anti-Ly6C/Ly6G antibody (553125, clone RB6-8C5, BD Biosciences), followed by incubation with streptavidin-conjugated MACS beads (130–048-101, Miltenyi Biotec) and positive isolation according to the manufacturer’s protocols. The purity of isolated Gr1+CD11b+ cells was consistently >95%, as confirmed by flow cytometry. Isolated cells were cultured in RPMI 1640 medium (Gibco), supplemented with 10% FCS, 2 mM L-glutamine, 100 U/mL penicillin, and 100 µg/mL streptomycin at 37°C in 5% CO2 in the presence or absence of 100 µM HDC.
Western Blot Analysis of TSP-1
Gr1+ cells were counted and equal numbers from each condition were lysed in NuPAGE LDS sample buffer (NP0007, Invitrogen), supplemented with NuPAGE reducing agent (NP0004, Invitrogen) and a protease inhibitor cocktail (P8380, Sigma-Aldrich). Lysates were heated to 70°C for 10 minutes and separated on NuPAGE 4–12% Bis-Tris gels (NP0322, Invitrogen).
Lung tissues from C57BL/6J WT and TSP-1 KO mice were homogenized and lysed in RIPA buffer (R0278, Sigma-Aldrich) supplemented with the protease inhibitor cocktail (P8380, Sigma-Aldrich), using a gentleMACS Dissociator according to the manufacturer’s instructions (Miltenyi Biotec). Total protein concentrations were determined using the Pierce BCA protein assay kit (23227, Invitrogen). Equal amounts of protein were mixed with NuPAGE LDS sample buffer (NP0007, Invitrogen) and NuPAGE reducing agent (NP0004, Invitrogen), heated at 70°C for 10 minutes, and loaded onto NuPAGE 4–12% Bis-Tris gels (NP0322, Invitrogen).
Proteins were transferred to nitrocellulose membranes using the iBlot Gel Transfer Device (Invitrogen). Membranes were blocked with 5% bovine serum albumin (BSA; 12861781, MP Biomedicals) and incubated with a recombinant anti-TSP-1 antibody (1:1000) (ab263905, Abcam), followed by incubation with an IRDye 800CW conjugated donkey anti-rabbit IgG secondary antibody (1:10,000) (926–32213, LI-COR). β-actin was used as a loading control (ab213262, Abcam) due to its stable expression in mouse lung tissue across experimental conditions. Detection was performed using the Li-Cor 9120 Odyssey imaging system. Band intensities were quantified by densitometric analysis using NIH ImageJ software,29 normalized to β-actin and expressed relative to control. Original blots are shown in Supplementary Figures 1–3.
Quantitative Reverse-Transcription Real-Time PCR of Thbs1
C57BL/6J mice were injected i.p. every other day with three doses of physiological NaCl (control) or HDC at 1500 µg/mouse. Peripheral blood was drawn from vena saphena into RNAprotect Animal Blood Tubes (Qiagen), four hours after the final HDC or NaCl injection for Thbs1 analysis. Total RNA was extracted using RNeasy Protect Animal Blood Kit (Qiagen), according to the manufacturer’s instructions. For each sample, 120 ng of total RNA was reverse-transcribed into cDNA using the GrandScript cDNA synthesis kit (TATAA Biocenter AB). Quantitative PCR (qPCR) of Thbs1 was performed using SYBR GrandMaster Mix (TATAA Biocenter AB) on a 7500 Fast Real-Time PCR System (Invitrogen).
Data acquisition and analysis were conducted using the ABI Prism 7000 Sequence Detection System (PE Applied Biosystem). Reference gene stability was assessed using NormFinder software. Among nine candidate reference genes, Clta and β-actin were identified as the most stable and were used for normalization. Relative gene expression levels were calculated using the 2 −ΔΔCT method.
Primers for Thbs1 and β-actin were designed based on published sequences,30 and the Clta primer pair was designed to span exon-exon junctions. Primer sequences were as follows:
Thbs1: Forward 5’- GAAG CAACAAGTGGTGTCAGT-3’
Reverse 5’- ACAGTCTATGTA GAGTTGAGCCC −3’
β-actin: Forward 5’- AGTGTGACGTTGACATCCGTA −3’
Reverse 5’- GCCAGAGCAGTAATCTCCTTCT −3’
Clta: Forward 5’- GGATGCTGTTGACGGAGTGAT −3’
Reverse 5’- GAGAATTGGCATCGAGGGCT −3’
Microarray Data
Microarray data from a previous study of WT PLB-985 cells, which were cultured for 48 hours in the absence or presence of 100 µM HDC or 0.5% DMSO,15 were retrieved for re-analysis and are available in the Gene Expression Omnibus under accession number GSE100671. Genes were ranked by log2 fold change (log2FC) and false discovery rate–adjusted p-value (Padj). Differential expression was defined as |log2FC| ≥ 1 with Padj ≤ 0.01. Volcano plots were generated in GraphPad Prism, with –log10(Padj) plotted against log2FC to visualize differential gene expression.
Bioinformatic Analysis of Human Samples
Transcriptomic and clinical data from 472 patients with skin cutaneous melanoma (SKCM) were obtained from The Cancer Genome Atlas (TCGA) via the cBioPortal database (https://www.cbioportal.org). Correlation analyses were performed between THBS1 and histidine decarboxylase (HDC), prostaglandin receptors (PTGIR and PTGER2), adenylyl cyclase isoform 7 (ADCY7), and the regulatory subunit of protein kinase A (PRKAR2B) using Spearman correlation coefficient. Scatter plots were generated with linear regression lines.
Single-cell RNA sequencing from melanoma patients was obtained from the Single Cell portal (https://www.singlecell.broadinstitute.org) (n=16,291 cells).31 THBS1 expression levels were analyzed across annotated immune cell populations.
To compare THBS1 expressions between tumor and normal tissues, RNA-Seq data for SKCM were analyzed using the TNMplot (https://www.tnmplot.com) database.32 The analysis was performed using the “RNA-Seq data” option, selecting THBS1 as the gene of interest and skin cutaneous melanoma as the tissue type. Normal samples were obtained from non-cancerous patients and pediatric tissues (GTEx), while tumor samples were derived from TCGA-SKCM data. The Mann–Whitney U-test was applied automatically by TNMplot to assess the statistical significance of expression differences between tumor and normal samples.
Overall survival data for 458 SKCM patients were obtained from TCGA via the cBioPortal database. Patient clinical data, including survival time (months) and survival status (deceased =1 or censored =0), were downloaded as text files and formatted for analysis in GraphPad Prism. THBS1 mRNA expression values were analyzed using cBioPortal z-scores, which are centered at zero; thus, a z-score of 0 corresponds closely to the median expression level in this cohort. Patients were dichotomized into high and low THBS1 expression groups using this median-centered threshold (EXP > 0 = high expression; EXP < 0 = low expression). Kaplan–Meier survival curves were generated to compare overall survival (OS) between the two groups, and the log-rank (Mantel–Cox) test was used to determine statistical significance. The number of patients at risk at the 40-month point was displayed below the survival curves.
Statistical Analysis
Publicly available whole-transcriptome microarray datasets of HDC-treated and untreated human monocytic PLB-985 cells15 were obtained and reprocessed. Raw data were normalized and analyzed using the limma package (Linear Models for Microarray Data) in R. Differential expressions were determined by linear modelling with empirical Bayes-moderated t-test, and Padj were calculated using the Benjamini-Hochberg false discovery rate (FDR) correction. Genes were considered significantly differentially expressed if they exhibited log2FC ≥ 1 and Padj ≤ 0.01.
For in vitro experiments, comparisons between two groups were performed using either a paired or a Welch’s unpaired t-test. When comparing more than two groups, one-way ANOVA followed by Holm-Šídák’s post hoc test was applied. For ex vivo data, comparisons between two groups were analyzed using the non-parametric Wilcoxon signed-rank test. In vivo data were first assessed for normality using the Shapiro–Wilk test. For normally distributed data with unequal variances, Welch’s t-test was used. When normality assumptions were not met, group comparisons were performed using the Mann–Whitney U-test. P-values are designated as follows: *p <0.05, **p <0.01, ***p <0.001, **** p<0.0001. All statistical analyses were performed using GraphPad Prism (San Diego, CA, USA). Illustrations were created with BioRender.
Results
HDC Triggers Formation of TSP-1 in Human and Murine Myeloid Cells
Reanalysis of transcriptome data from human monocytic PLB-985 cells exposed to HDC15 identified 387 genes with significantly increased expression. Among these, THBS1, encoding TSP-1, was the most strongly upregulated transcript, showing a 2.5-fold induction with an adjusted p-value < 1×10⁻⁸ (Figure 1A). To assess whether this transcriptional upregulation translated into elevated protein levels, PLB-985 cells were treated with HDC at concentrations ranging from 0.1 to 1000 µM. After 48 hours, cell supernatants were collected and analyzed for TSP-1 content. HDC induced a strong and dose-dependent increase of TSP-1 (Figure 1B). In analyses of the kinetics of HDC-induced TSP-1 production, supernatants were collected at various time points following HDC exposure. A significant rise was not detected until after four hours, with levels peaking at eight hours and remaining stable thereafter (Figure 1C).
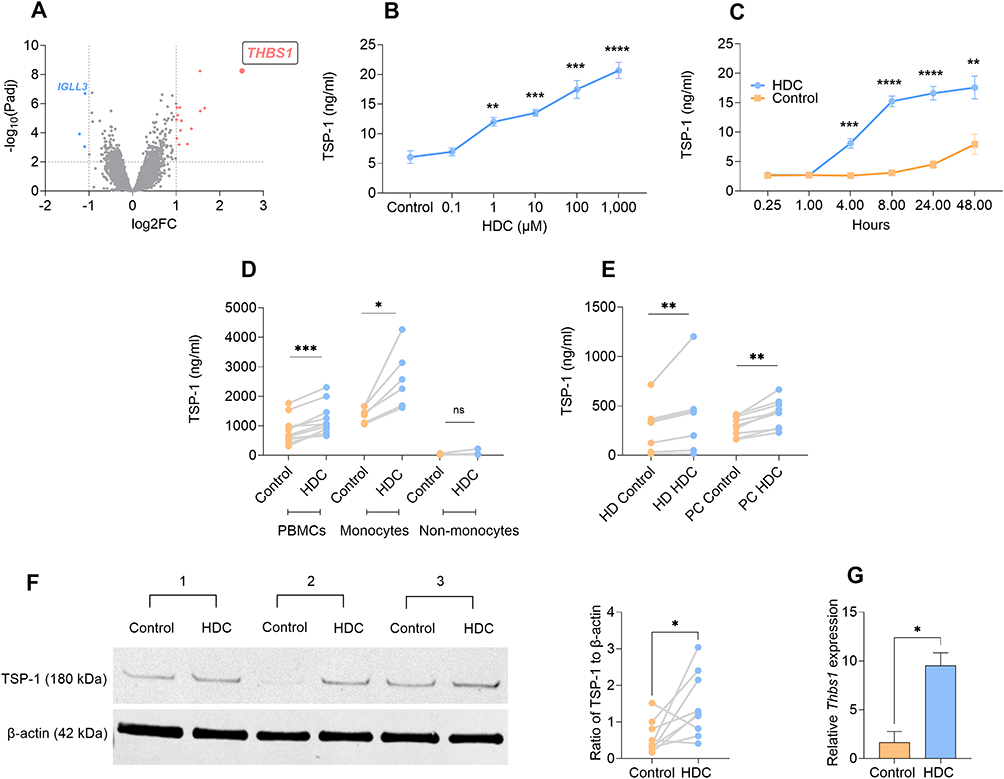 |
Figure 1 Histamine dihydrochloride (HDC) induces TSP-1 production in human and murine myeloid cells. (A) Volcano plot showing fold change gene expression in HDC treated vs. untreated PLB-985 cells, as determined by microarray (n=4 per group); the x-axis represents log2 fold change (log2FC), and the y-axis represents -log10 of the adjusted p-value (Padj). Dotted lines indicate the thresholds for statistical significance (Padj = 0.01; -log10(Padj) = 2) and biological relevance |log2FC| ≥ 1. Pink dots represent significantly upregulated genes (log2FC ≥ 1, Padj ≤ 0.01), and blue dots represent significantly downregulated genes (log2FC ≤ –1, Padj ≤ 0.01). (B) PLB-985 cells were stimulated with HDC in concentrations ranging from 0.1 to 1000 µM for 48 hours, after which TSP-1 levels in cell supernatant were determined by ELISA (n=5); Welch’s unpaired t-test. (C) PLB-985 cells were stimulated with 100 µM HDC and TSP-1 production was determined at time points ranging from 15 minutes to 48 hours after which TSP-1 levels in cell supernatant were determined by ELISA (n=6); Welch’s unpaired t-test. (D) Freshly isolated peripheral blood mononuclear cells (PBMCs; n=11), and PBMCs separated into monocyte (n=6) and non-monocyte (n=4) fractions were stimulated with 100 µM HDC and TSP-1 levels in supernatant were determined after 48 hours by ELISA; Wilcoxon signed rank test. (E) Cryopreserved PBMCs from pancreatic cancer (PC) patients (n=9), or healthy donors (HDs) (n=7) were stimulated with 100 µM HDC and TSP-1 levels in the supernatant were determined after 48 hours by ELISA; Wilcoxon signed rank test. (F) Gr1+ bone marrow cells from naïve C57BL/6 mice were stimulated with 100 µM HDC for 48 hours or were left unstimulated (Control) after which TSP-1 levels were determined by Western blot. Representative TSP-1 blots from three mice are shown to the left. Quantification of β-actin-normalized TSP-1 levels from six independent experiments is shown to the right (n=9); Wilcoxon signed rank test. Band intensities were quantified by densitometry using ImageJ (NIH), normalized to β-actin, and expressed relative to control. (G) C57BL/6 mice were treated with three doses of HDC or NaCl (Control) every other day. Blood was drawn four hours after the final treatment and was analyzed for Thbs1 expression by RT-qPCR (n=3 mice per group); Welch’s unpaired t-test. Results are presented as mean ± SEM. P-values are designated as follows: ns = non-significant, *p < 0.05, **p < 0.01, ***p < 0.001, ****p < 0.0001. |
To determine whether primary myeloid cells generate TSP-1 upon HDC exposure, PBMCs were isolated from healthy donors and separated into monocytic and non-monocytic fractions prior to exposure of cells to HDC. A robust induction of TSP-1 was observed in PBMCs and in the monocyte fraction, but not in non-monocytic cells (Figure 1D). Myeloid cells in cancer patients often exhibit an immunosuppressive function and a MDSC-like phenotype.33 To determine whether HDC induces TSP-1 also in myeloid cells from cancer patients, we utilized PBMCs from patients with pancreatic cancer, previously characterized to contain 6.2%±1.2% (mean±SEM) monocytic MDSCs28 (defined as HLA-DRlow cells within the CD11b+CD14+ monocyte population). In alignment with the results obtained using healthy donor cells, HDC induced robust production of TSP-1 from myeloid cells, including MDSC, of the pancreatic cancer patients (Figure 1E).
In mouse experiments, Gr1+ myeloid cells isolated from bone marrow of naïve C57BL/6 mice were stimulated with HDC ex vivo. Western blot analysis revealed a significant induction of TSP-1 in these cells (Figure 1F). To define if systemic administration of HDC stimulates TSP-1, C57BL/6 mice were treated with three i.p. injections of HDC every second day. Four hours after the final dose, blood was collected for analysis of Thbs1 expression by RT-qPCR. Systemic administration of HDC significantly increased Thbs1 gene expression (Figure 1G).
HDC Triggers TSP-1 via Histamine H2 Receptor-Induced cAMP-PKA Signaling
HDC may engage multiple histamine receptors expressed on myeloid cells. To identify the receptor responsible for mediating HDC-induced TSP-1 production, PLB-985 cells were treated with HDC in the presence or absence of receptor-specific antagonists. The histamine type-1 receptor (H1R)-specific antagonist fexofenadine did not inhibit HDC-induced TSP-1 formation in PLB-985 cells, whereas the H2R-specific antagonist ranitidine completely abrogated induced TSP-1 production. A chemically inert structural analog of ranitidine, AH 20239AA, did not affect HDC-induced TSP-1 production, suggesting that antagonism at H2R rather than non-specific properties of ranitidine explained the reversal of TSP-1 induction. In further support of the role of H2R for HDC-triggered formation of TSP-1, the H2R-selective agonist NMH robustly triggered TSP-1 production (Figure 2A).
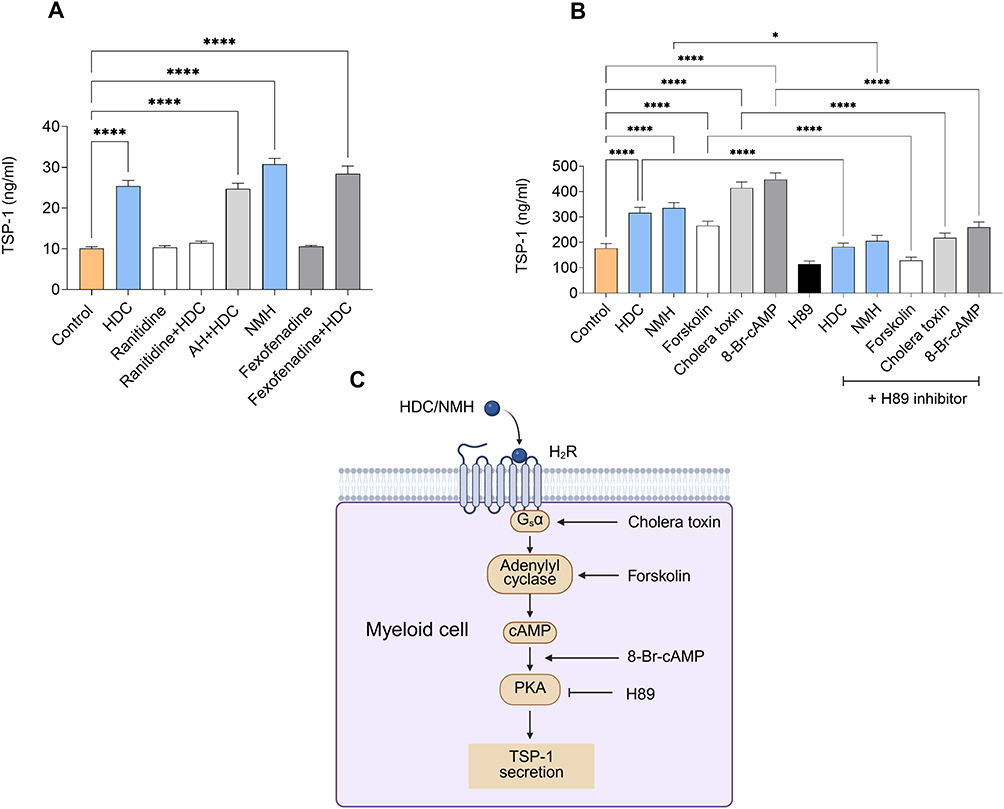 |
Figure 2 Histamine dihydrochloride (HDC) induces TSP-1 production from myeloid cells via H2-receptor-mediated cAMP-PKA signaling. (A) PLB-985 cells were stimulated for 48 hours with 100 µM HDC, 50 µM ranitidine, 50 µM AH (a chemically inert control for ranitidine), 100 µM N-methylhistamine (NMH) and 10 µM fexofenadine or a combination thereof (n=6-12). TSP-1 levels were measured in the cell supernatant by ELISA; one-way ANOVA followed by Holm-Šídák’s test. (B) Human monocytes were treated with 100 µM HDC, 100 µM of the H2-receptor agonist NMH and known cAMP inducers as follows: 20 µM forskolin, 10 nM cholera toxin and 500 µM 8-Bromo-cAMP, either alone or in combination with the 10 µM PKA inhibitor H89. TSP-1 levels were measured in the supernatant after 24 hours of incubation by ELISA (n=7-11). One-way ANOVA followed by Holm-Šídák’s test. (C) Proposed mechanism of HDC-induced TSP-1 in myeloid cells. Created with BioRender. Results are presented as mean ± SEM. P-values are designated as follows: *p < 0.05, ****p < 0.0001. |
Earlier studies demonstrated that HDC inhibits NOX2-derived reactive oxygen species (ROS) in myeloid cells via agonistic activity at H2Rs.34,35 To determine whether NOX2 inhibition contributes to TSP-1 induction, we tested a panel of NOX2-targeting approaches. Neither the pan-NOX inhibitor DPI, the ROS scavenger catalase, nor the NOX2-specific inhibitor GSK2795039, all applied at doses that efficiently reduced ROS in myeloid cells, induced TSP-1 production in PLB-985 cells. We then compared WT and NOX2-deficient PLB-985 cells stimulated with HDC and found that HDC induced comparable levels of TSP-1 in both cell lines (Supplementary Figure 4). These findings show that HDC-induced TSP-1 expression in myeloid cells occurs independently of NOX2 inhibition.
Histamine signaling through H2Rs may utilize several transduction pathways, including cyclic adenosine monophosphate (cAMP)-protein kinase A (PKA) via G protein-coupled stimulation of adenylate cyclase.36,37 To determine whether this pathway mediated HDC-induced TSP-1 production, human monocytes were treated with the cAMP inducers forskolin and cholera toxin, or with the stable cAMP analog 8-bromo-cAMP. All compounds significantly increased TSP-1 levels. The PKA inhibitor H89 effectively reduced TSP-1 induction by both the cAMP inducers and by HDC/NMH, supporting involvement of the cAMP-PKA axis for HDC-induced formation of TSP-1 in myeloid cells (Figure 2B).
Consistent with these in vitro results, analysis of TCGA-SKCM RNA-seq data showed that THBS1 expression in melanoma patients was positively associated with multiple components of the cAMP-PKA signaling pathway. Hence, THBS1 showed strong positive correlations with two Gs-coupled prostaglandin receptors, PTGIR and PTGER2, both of which activate adenylyl cyclase and increase intracellular cAMP levels (Supplementary Figure 5A-B). THBS1 also positively correlated with ADCY7, a myeloid cell-enriched adenylyl cyclase isoform that catalyzes cAMP synthesis following Gs-coupled receptor activation38,39 (Supplementary Figure 5C), and PRKAR2B, a regulatory subunit of PKA (Supplementary Figure 5D). Together, these pharmacologic and transcriptomic findings support a model in which HDC induced TSP-1 expression in myeloid cells via H2R-mediated cAMP–PKA signaling, as schematically depicted in (Figure 2C).
Anti-Metastatic Effects of HDC are Mediated by TSP-1
Previous studies demonstrate reduced metastasis formation in murine melanoma following systemic administration of HDC.14,28,35 As TSP-1 expressions in Gr1+ myeloid cells have been implicated in the suppression of metastasis,26 we hypothesized that HDC-induced TSP-1 might contribute to the reduction of metastasis in the melanoma model. Wild-type and TSP-1 KO mice were treated with HDC one day prior to, and one and three days after, i.v. injection of B16F10 melanoma cells. Three weeks post-inoculation, lung tissues were harvested for quantification of metastatic foci and for analysis of TSP-1 protein and Thbs1 mRNA levels (Figure 3A). HDC treatment significantly reduced the number of metastatic foci in the lungs of WT animals, but an anti-metastatic effect was absent in TSP-1 KO mice (Figure 3B). Western blot analysis of lung lysates confirmed elevated TSP-1 protein levels in HDC-treated WT mice, whereas no TSP-1 protein was detected in TSP-1 KO mice (Figure 3C and D). No corresponding increase in Thbs1 mRNA levels was observed at this late point (Supplementary Figure 6), suggesting that the sustained effects of HDC-induced TSP-1 are primarily exerted at the protein level.
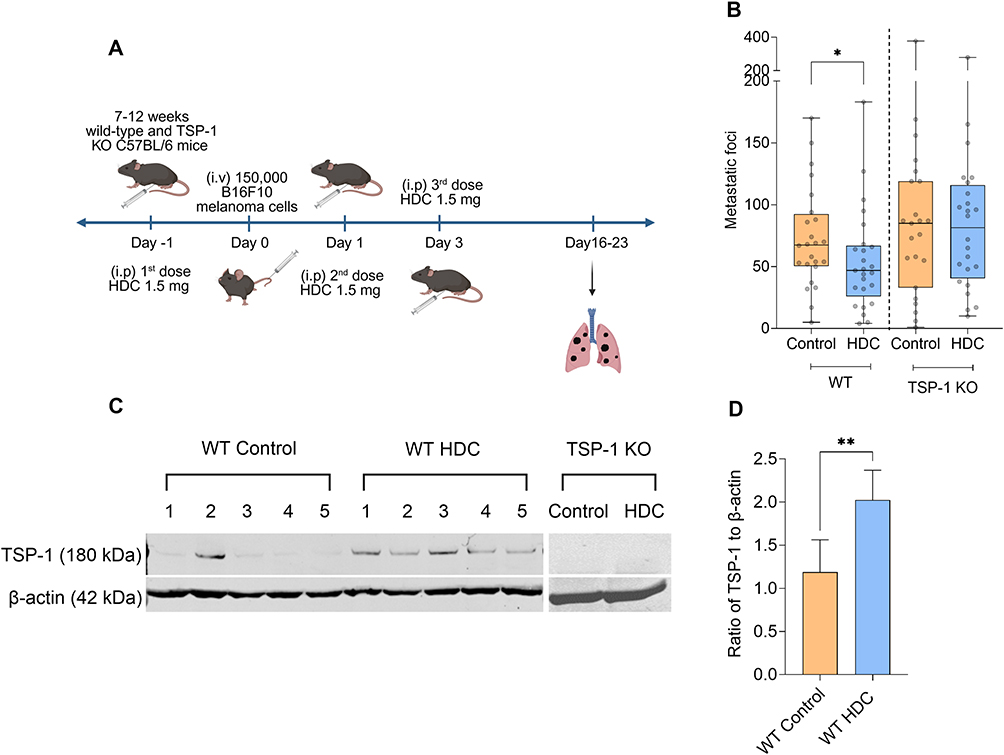 |
Figure 3 Histamine dihydrochloride (HDC) reduces melanoma metastasis in a TSP-1-dependent manner. Wild-type (WT) or TSP-1-deficient (TSP-1 KO) C57BL/6 mice were treated with HDC or NaCl (control) one day before and one and three days after intravenous (i.v.) inoculation with 1.0–1.5×10⁵ B16F10 cells, as depicted in (A); created with BioRender. (B) Number of metastatic foci in the lungs three weeks after tumor cell inoculation. (C and D) Western blot analysis of TSP-1 protein in lung lysates from WT and TSP-1 KO mice at the experimental endpoint, where (C) shows representative blots, while (D) shows quantification of TSP-1 normalized to β-actin. Band intensities were quantified by densitometric analysis using ImageJ (NIH), normalized to β-actin, and expressed relative to control. (B and D) show compiled data from five independent experiments with four to five mice per group; WT Control (n=24), WT HDC (n=25), TSP-1 KO Control (n=23), TSP-1 KO HDC (n=24); Mann–Whitney U-test. In (B), results are shown as box-and-whisker plots displaying all data points; boxes indicate interquartile range and whiskers indicate the minimum and maximum values. In (D), data are shown as mean ± SEM. P-values are designated as follows: *p < 0.05, **p < 0.01. |
THBS1 is Downregulated in Melanoma and High THBS1 Expression Associates with Improved Patient Survival
We next evaluated the potential relevance of our findings in melanoma patients using publicly available clinical datasets. Tissue histamine levels are primarily regulated by histidine decarboxylase (HDC), which is the rate-limiting enzyme responsible for converting histidine into histamine.40 In the TCGA-SKCM melanoma dataset, HDC and THBS1 displayed a strong and significant positive correlation (Figure 4A), favoring the hypothesis that endogenous histamine might promote TSP-1 expression in the human melanoma microenvironment.
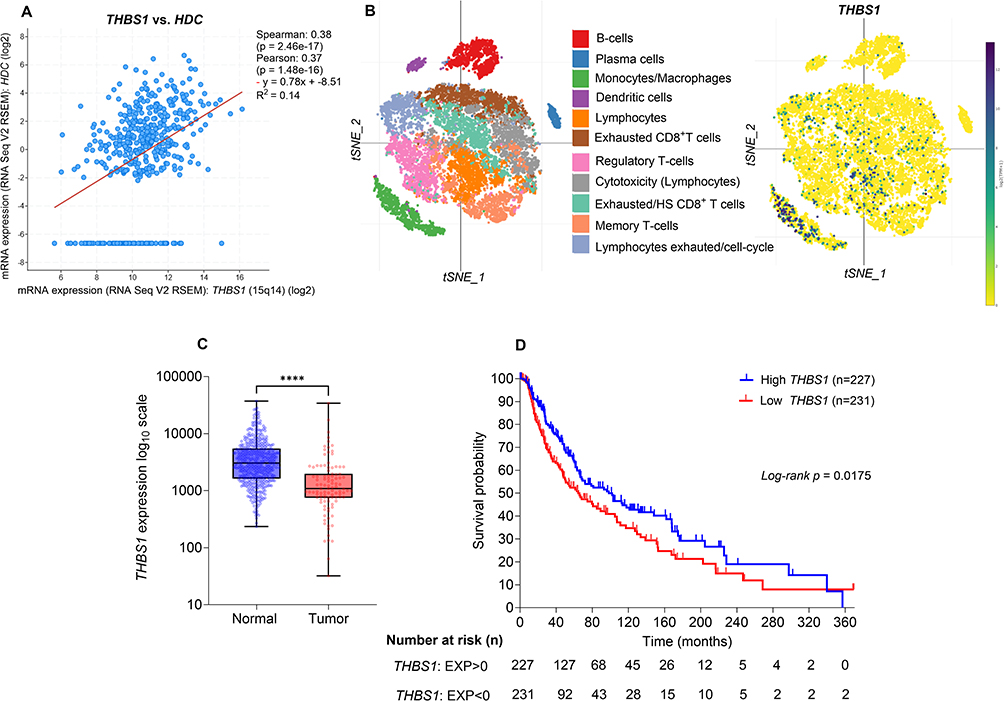 |
Figure 4 THBS1 positively correlates with histidine decarboxylase (HDC) and elevated THBS1 levels are associated with improved survival in melanoma. (A) Scatter plot showing the correlation between THBS1 and HDC mRNA expression in 472 TCGA skin cutaneous melanoma (SKCM) samples. Expression values are presented as log2-transformed RNA-Seq V2 RSEM data. Both Spearman and Pearson correlation analyses revealed a significant positive association between THBS1 and HDC expression. The red line indicates the linear regression fit. (B) t-SNE plots from a melanoma single-cell RNA-seq dataset31 showing that monocytes/macrophages exhibited the highest THBS1 expression among the immune cell subsets. (C) RNA-seq data from TNMplot32 comparing THBS1 levels between melanoma tumor (n=104) and normal skin (n=474) tissues; Mann–Whitney U-test. (D) Kaplan–Meier curves of overall survival in the TCGA-SKCM cohort stratified by THBS1 mRNA expression. THBS1 mRNA expression z-scores were obtained from cBioPortal, where a z-score of 0 approximates the cohort median. Patients were grouped into high (EXP > 0; n=227) and low (EXP < 0; n=231) THBS1 expression categories. Survival differences were assessed using the log-rank (Mantel–Cox) test. The number of patients at risk is shown below the curves. ****p < 0.0001. |
To determine which immune cells express THBS1 in patient tumors, we analyzed single-cell RNA-seq datasets from human melanoma. THBS1 expression was found to be strongly enriched in monocytes/macrophages, with markedly lower levels in other intratumoral immune cell populations (Figure 4B). Furthermore, analysis of bulk RNA-seq data from the TNMplot database showed that THBS1 levels were significantly reduced in melanoma tumor tissues compared with normal skin (Figure 4C). In the TCGA-SKCM cohort, high THBS1 expression was associated with significantly improved overall survival (Figure 4D). Taken together, these analyses indicate that THBS1 is expressed in myeloid cells within melanoma tumors, and that high THBS1 levels are linked to improved patient survival, supporting a potential protective role for TSP-1 in melanoma.
Discussion
The main findings of this study were (i) that HDC induces de novo TSP-1 production in myeloid cells through the H2R/cAMP/PKA pathway, and (ii) that this induction contributes to, or explains, the previously reported anti-metastatic properties of HDC.14 TSP-1 is a multifunctional protein involved in cell-matrix interactions, inflammation, vascular responses and tissue repair. It is produced by platelets, endothelial cells, fibroblasts, myeloid cells and some cancer cells.16,18 Best known as an endogenous inhibitor of angiogenesis, TSP-1 reduces VEGF availability and directly engages endothelial cell receptors such as CD36 and CD47 to induce endothelial cell apoptosis and suppress proliferation, thereby impairing formation of new blood vessel.19,22,41 TSP-1 expression is induced by cytokines such as TGF-β, IL-1, and TNF, as well as growth factors inducing PDGF and bFGF, consistent with its role in inflammation, vascular responses, and tissue repair.42,43
TSP-1 has been reported to exert context-dependent effects in cancer, including melanoma. While its anti-angiogenic and anti-metastatic functions are established in preclinical models, TSP-1 has also been reported to display immunosuppressive or tumor-promoting activities in certain settings.16,44 These seemingly divergent roles likely reflect differences in tumor stage, tumor type, cellular context and receptor engagement within the tumor microenvironment. Notably, anti-angiogenic and metastatic-restrictive effects appear to dominate in early or pre-metastatic settings, whereas tumor-promoting effects may become more relevant in established tumors.24,25,45
In experimental settings, HDC has been shown to reduce hematogenous spread of cancer cells in vivo, including B16F10 melanoma cells,14,35 while exerting only minor effects on primary tumor growth.13 Clinical findings are in line with this stage-dependent pattern of activity. Treatment with HDC thus reduces relapse risk in AML when given after chemotherapy in a setting of minimal residual disease,9–11,46 whereas in patients with established metastatic melanoma, a Phase III trial showed only modest effects on tumor burden, despite a significant improvement in overall survival achieved by treatment with HDC.47 These observations suggest that the anti-tumor effects of HDC may be more pronounced at a low malignant burden.
In parallel, TSP-1 has been implicated in reprogramming immunosuppressive M2-like macrophages toward a more anti-tumor M1-like state23 and myeloid-derived TSP-1 was shown to limit distant metastasis.26,27 Collectively, these data may provide a mechanistic explanation for the clinical observations, as HDC-driven induction of TSP-1 in myeloid cells within the pre-metastatic niche may restrain early metastatic seeding and outgrowth rather than eliminating established lesions.
Mechanistically, previous studies have implicated Gr1+ myeloid cells, NK cells and inhibition of NOX2-derived ROS as contributors to its anti-metastatic effects.14,28,35 Extending these observations, we here show HDC-induced TSP-1 production from Gr1+ myeloid cells within the tumor microenvironment and that the anti-metastatic efficacy of HDC is abrogated in TSP-1-deficient mice. These results suggest that induction of TSP-1 is an important mediator of the anti-tumor activity of HDC, and further studies are needed to define the downstream anti-metastatic effects of HDC-induced TSP-1 and to identify the effector cell populations involved.
Our study aimed to clarify downstream mechanisms of relevance to the induction of TSP-1 by HDC. Firstly, the finding that the HDC increased THBS1 transcription and TSP-1 protein became detectable only after several hours indicates de novo synthesis rather than rapid release from intracellular stores. Secondly, TSP-1 induction was fully dependent on H2R-mediated activation of the cAMP/PKA axis. Additional cAMP-elevating agents robustly induced TSP-1, further supporting this pathway as a core regulator of TSP-1 synthesis in myeloid cells. These observations align with a previous report showing that cholera toxin, which activates adenylate cyclase through persistent Gsα stimulation, upregulates THBS1.36
Transcriptomic data from the TCGA-SKCM melanoma dataset further reinforces this mechanistic model. HDC, encoding the rate-limiting histidine decarboxylase in histamine formation in tissues,40 showed positive correlation with THBS1, supporting that endogenous histamine may stimulate TSP-1 production within the melanoma microenvironment. THBS1 also correlated positively with multiple components of the cAMP-PKA pathway, which additionally supports the relevance of this signaling cascade in vivo.
The bioinformatic analysis of melanoma patient samples revealed a marked downregulation of THBS1 in tumors compared with normal skin, suggesting a potential role for TSP-1 as a stromal or immune-regulatory factor that is lost during melanoma progression. Moreover, higher intratumoral THBS1 expression was associated with significantly improved overall survival, further suggesting that TSP-1 exerts protective, anti-tumor functions in melanoma.
A key strength of this study is the integration of mechanistic, in vivo, and translational analyses. We show that HDC induces TSP-1 through H2R-dependent cAMP-PKA signaling and provide in vivo evidence that TSP-1 contributes to the anti-metastatic properties of HDC in experimental melanoma. The inclusion of patient expression and survival data further supports the clinical relevance of these findings. Several limitations should however be noted. The in vivo experiments were conducted in a single experimental metastasis model, which may not fully reflect spontaneous metastatic progression. In addition, although our data support an important role for myeloid cell-derived TSP-1, other sources of TSP-1 were not examined in detail. Finally, while TSP-1 appears to be an important mediator of HDC activity, additional immunoregulatory mechanisms are likely to contribute. Taken together, our findings identify a previously unrecognized HDC-TSP-1 axis in myeloid cells, while highlighting the need for validation in additional tumor models and clinical settings.
Conclusion
This study identifies a previously unrecognized mechanism by which HDC activates H2R/cAMP/PKA signaling to induce de novo TSP-1 synthesis in myeloid cells, which associated with reduced metastasis in the B16 melanoma model. Given the clinical need for strategies that limit metastasis, our results support the potential of HDC, or other pharmacological activators of the cAMP/PKA axis in myeloid cells, to enhance TSP-1 production and thereby modulate tumor cell dissemination.
Abbreviations
HDC, histamine dihydrochloride; HDC, histidine decarboxylase; TSP-1, thrombospondin-1; H2Rs, histamine type 2 receptors; PKA, protein kinase A; AML, acute myeloid leukemia; MDSCs, myeloid-derived suppressor cells; NK, natural killer; WT, wild type; TSP-1 KO, TSP-1 knockout; PBMCs, peripheral blood mononuclear cells; IPEP, immune phenotype pancreatic cancer; DPI, diphenyleneiodonium; NMH, N-methylhistamine; i.v., intravenous; i.p., intraperitoneal; qPCR, quantitative PCR.
Data Sharing Statement
All data needed to evaluate the conclusions in the paper are presented in the main text, figures, and supplementary figures. The datasets used for bioinformatic analyses are described in the method section.
Acknowledgments
We thank Dr. Mary Dinauer for providing the PLB-985 cell lines.
Author Contributions
All authors made a significant contribution to the work reported, whether that is in the conception, study design, execution, acquisition of data, analysis and interpretation, or in all these areas; took part in drafting, revising or critically reviewing the article; gave final approval of the version to be published; have agreed on the journal to which the article has been submitted; and agree to be accountable for all aspects of the work.
Funding
This work was supported by The Swedish research Council, 2023-02193 (AM); The Swedish state via the ALF agreement, ALFGBG-277380 (AM) and ALFGBG-718421 (KH); The Swedish Cancer Foundation 254740Pj (AM), 243718 S (AM) and 243472Pj (KH); Sjöbergsstiftelsen 2024-984 (AM); Wilhelm och Martina Lundgrens Vetenskapsfond 2021-3819 (HGW) and 2023-SA-4333 (NI); Assar Gabrielsson’s foundation FB-2047 (HGW), FB22-58 (NI), FB23-13 (NI), FB24-125 (NI), and FB25-117 (NI), and Anna-Lisa och Bror Björnssons Stiftelse (NI).
Disclosure
Authors A.M. and K.H. are inventors of pending patents related to the use of histamine in cancer treatment. K.H also reports personal fees from Delbert Pharma, Paris, France, outside the submitted work. The authors report no other conflicts of interest in this work.
References
1. Hellstrand K, Hermodsson S, Brune M, et al. Histamine in cancer immunotherapy. Scand J Clin Lab Invest. 1997;57(3):193–15. doi:10.3109/00365519709060027
2. Grauers Wiktorin H, Aydin E, Hellstrand K, Martner A. NOX2-derived reactive oxygen species in cancer. Oxid Med Cell Longev. 2020;2020:7095902. doi:10.1155/2020/7095902
3. Sarasola MP, Taquez Delgado MA, Nicoud MB, Medina VA. Histamine in cancer immunology and immunotherapy. Current status and new perspectives. Pharmacol Res Perspect. 2021;9(5):e00778. doi:10.1002/prp2.778
4. Tiligada E, Ennis M. Histamine pharmacology: from Sir Henry Dale to the 21st century. Br J Pharmacol. 2020;177(3):469–489. doi:10.1111/bph.14524
5. Hirasawa N. Expression of histidine decarboxylase and its roles in inflammation. Int J Mol Sci. 2019;20(2). doi:10.3390/ijms20020376
6. Moriguchi T, Takai J. Histamine and histidine decarboxylase: immunomodulatory functions and regulatory mechanisms. Genes Cells. 2020;25(7):443–449. doi:10.1111/gtc.12774
7. Yang XD, Ai W, Asfaha S, Bhagat G, et al. Histamine deficiency promotes inflammation-associated carcinogenesis through reduced myeloid maturation and accumulation of CD11b+Ly6G+ immature myeloid cells. Nat Med. 2011;17(1):87–95. doi:10.1038/nm.2278
8. Nilsson MS, Hallner A, Brune M, et al. Complete remission after the first cycle of induction chemotherapy determines the clinical efficacy of relapse-preventive immunotherapy in acute myeloid leukaemia. Br J Haematol. 2020;188(4):e49–e53. doi:10.1111/bjh.16320
9. Nilsson MS, Fiegl M, Hiddemann W, et al. Histamine dihydrochloride and low-dose interleukin-2 has anti-leukemic efficacy in NPM1-mutated and myelomonocytic/monocytic acute myeloid leukemia. Haematologica. 2024;109(11):3781–3784. doi:10.3324/haematol.2024.285342
10. Nilsson MS, Martner A, Wennström L, et al. Histamine dihydrochloride and low-dose interleukin-2 in an emerging landscape of relapse prevention in acute myeloid leukemia. Ther Adv Hematol. 2025;16:20406207251351086. doi:10.1177/20406207251351086
11. Nilsson MS, Hallner A, Brune M, et al. Immunotherapy with HDC/IL-2 may be clinically efficacious in acute myeloid leukemia of normal karyotype. Hum Vaccin Immunother. 2020;16(1):109–111. doi:10.1080/21645515.2019.1636598
12. Rydström A, Hallner A, Aurelius J, et al. Dynamics of myeloid cell populations during relapse-preventive immunotherapy in acute myeloid leukemia. J Leukoc Biol. 2017;102(2):467–474. doi:10.1189/jlb.5VMA1116-455R
13. Grauers Wiktorin H, Nilsson MS, Kiffin R, et al. Histamine targets myeloid-derived suppressor cells and improves the anti-tumor efficacy of PD-1/PD-L1 checkpoint blockade. Cancer Immunol Immunother. 2019;68(2):163–174. doi:10.1007/s00262-018-2253-6
14. Aydin E, Johansson J, Nazir FH, Hellstrand K, Martner A. Role of NOX2-derived reactive oxygen species in NK cell-mediated control of murine melanoma metastasis. Cancer Immunol Res. 2017;5(9):804–811. doi:10.1158/2326-6066.Cir-16-0382
15. Kiffin R, Grauers Wiktorin H, Nilsson MS, et al. Anti-leukemic properties of histamine in monocytic leukemia: the role of NOX2. Front Oncol. 2018;8:218. doi:10.3389/fonc.2018.00218
16. Kaur S, Bronson SM, Pal-Nath D, et al. Functions of thrombospondin-1 in the tumor microenvironment. Int J Mol Sci. 2021;22(9). doi:10.3390/ijms22094570
17. Ramchandani D, Mittal V. Thrombospondin in tumor microenvironment. Adv Exp Med Biol. 2020;1272:133–147. doi:10.1007/978-3-030-48457-6_8
18. Jaffe EA, Ruggiero JT, Falcone DJ. Monocytes and macrophages synthesize and secrete thrombospondin. Blood. 1985;65(1):79–84.
19. Dawson DW, Pearce SF, Zhong R, Silverstein RL, Frazier WA, Bouck NP. CD36 mediates the In vitro inhibitory effects of thrombospondin-1 on endothelial cells. J Cell Biol. 1997;138(3):707–717. doi:10.1083/jcb.138.3.707
20. Chu LY, Ramakrishnan DP, Silverstein RL. Thrombospondin-1 modulates VEGF signaling via CD36 by recruiting SHP-1 to VEGFR2 complex in microvascular endothelial cells. Blood. 2013;122(10):1822–1832. doi:10.1182/blood-2013-01-482315
21. Rofstad EK, Graff BA. Thrombospondin-1-mediated metastasis suppression by the primary tumor in human melanoma xenografts. J Invest Dermatol. 2001;117(5):1042–1049. doi:10.1046/j.0022-202x.2001.01552.x
22. Wang S, Blois A, El Rayes T, et al. Development of a prosaposin-derived therapeutic cyclic peptide that targets ovarian cancer via the tumor microenvironment. Sci Transl Med. 2016;8(329):329ra34. doi:10.1126/scitranslmed.aad5653
23. Martin-Manso G, Galli S, Ridnour LA, et al. Thrombospondin 1 promotes tumor macrophage recruitment and enhances tumor cell cytotoxicity of differentiated U937 cells. Cancer Res. 2008;68(17):7090–7099. doi:10.1158/0008-5472.Can-08-0643
24. Weng CH, Assouvie A, Dong L, et al. Thrombospondin-1-CD47 signaling contributes to the development of T cell exhaustion in cancer. Nat Immunol. 2025;26(12):2296–2311. doi:10.1038/s41590-025-02321-5
25. Jiang Y, Min L, Yang X, et al. Macrophage Mtdh deficiency discordantly regulated tumor growth and metastasis through increased thrombospondin-1 production. J Immunother Cancer. 2026;14(2). doi:10.1136/jitc-2025-013655
26. Catena R, Bhattacharya N, El Rayes T, et al. Bone marrow-derived Gr1+ cells can generate a metastasis-resistant microenvironment via induced secretion of thrombospondin-1. Cancer Discov. 2013;3(5):578–589. doi:10.1158/2159-8290.Cd-12-0476
27. Sui L, Wang S, Ganguly D, et al. PRSS2 remodels the tumor microenvironment via repression of Tsp1 to stimulate tumor growth and progression. Nat Commun. 2022;13(1):7959. doi:10.1038/s41467-022-35649-9
28. Grauers Wiktorin H, Aydin E, Kiffin R, et al. Impact of surgery-induced myeloid-derived suppressor cells and the NOX2/ROS axis on postoperative survival in human pancreatic cancer. Cancer Res Commun. 2024;4(4):1135–1149. doi:10.1158/2767-9764.Crc-23-0447
29. Schneider CA, Rasband WS, Eliceiri KW. NIH Image to ImageJ: 25 years of image analysis. Nat Meth. 2012;9(7):671–675. doi:10.1038/nmeth.2089
30. Liauw J, Hoang S, Choi M, et al. Thrombospondins 1 and 2 are necessary for synaptic plasticity and functional recovery after stroke. J Cereb Blood Flow Metab. 2008;28(10):1722–1732. doi:10.1038/jcbfm.2008.65
31. Sade-Feldman M, Yizhak K, Bjorgaard SL, et al. Defining T cell states associated with response to checkpoint immunotherapy in melanoma. Cell. 2018;175(4):998–1013.e20. doi:10.1016/j.cell.2018.10.038
32. Bartha Á, Győrffy B. TNMplot.com: a web tool for the comparison of gene expression in normal, tumor and metastatic tissues. Int J Mol Sci. 2021;22(5). doi:10.3390/ijms22052622
33. Tang H, Li H, Sun Z. Targeting myeloid-derived suppressor cells for cancer therapy. Cancer Biol Med. 2021;18(4):992–1009. doi:10.20892/j.issn.2095-3941.2020.0806
34. Hellstrand K, Asea A, Dahlgren C, Hermodsson S. Histaminergic regulation of NK cells. Role of monocyte-derived reactive oxygen metabolites. J Immunol. 1994;153(11):4940–4947.
35. Hellstrand K, Asea A, Hermodsson S. Role of histamine in natural killer cell-mediated resistance against tumor cells. J Immunol. 1990;145(12):4365–4370.
36. Sanders L, Lynham JA, Kaumann AJ. Chronic beta 1-adrenoceptor blockade sensitises the H1 and H2 receptor systems in human atrium: rôle of cyclic nucleotides. Naunyn Schmiedebergs Arch Pharmacol. 1996;353(6):661–670. doi:10.1007/bf00167185
37. Shayo C, Davio C, Brodsky A, et al. Histamine modulates the expression of c-fos through cyclic AMP production via the H2 receptor in the human promonocytic cell line U937. Mol Pharmacol. 1997;51(6):983–990. doi:10.1124/mol.51.6.983
38. Duan B, Davis R, Sadat EL, et al. Distinct roles of adenylyl cyclase VII in regulating the immune responses in mice. J Immunol. 2010;185(1):335–344. doi:10.4049/jimmunol.0903474
39. Jiang LI, Sternweis PC, Wang JE. Zymosan activates protein kinase A via adenylyl cyclase VII to modulate innate immune responses during inflammation. Mol Immunol. 2013;54(1):14–22. doi:10.1016/j.molimm.2012.10.027
40. Dy M, Schneider E. Histamine-cytokine connection in immunity and hematopoiesis. Cytokine Growth Factor Rev. 2004;15(5):393–410. doi:10.1016/j.cytogfr.2004.06.003
41. Jiménez B, Volpert OV, Crawford SE, et al. Signals leading to apoptosis-dependent inhibition of neovascularization by thrombospondin-1. Nat Med. 2000;6(1):41–48. doi:10.1038/71517
42. Chen Y, Leask A, Abraham DJ, et al. Thrombospondin 1 is a key mediator of transforming growth factor β-mediated cell contractility in systemic sclerosis via a mitogen-activated protein kinase kinase (MEK)/extracellular signal-regulated kinase (ERK)-dependent mechanism. Fibrogenesis Tissue Repair. 2011;4(1):9. doi:10.1186/1755-1536-4-9
43. Breitkopf K, Sawitza I, Westhoff JH, et al. Thrombospondin 1 acts as a strong promoter of transforming growth factor beta effects via two distinct mechanisms in hepatic stellate cells. Gut. 2005;54(5):673–681. doi:10.1136/gut.2004.042911
44. Huang T, Sun L, Yuan X, Qiu H. Thrombospondin-1 is a multifaceted player in tumor progression. Oncotarget. 2017;8(48):84546–84558. doi:10.18632/oncotarget.19165
45. Marcheteau E, Farge T, Pérès M, et al. Thrombospondin-1 silencing improves lymphocyte infiltration in tumors and response to anti-PD-1 in triple-negative breast cancer. Cancers. 2021;13(16). doi:10.3390/cancers13164059
46. Brune M, Castaigne S, Catalano J, et al. Improved leukemia-free survival after postconsolidation immunotherapy with histamine dihydrochloride and interleukin-2 in acute myeloid leukemia: results of a randomized Phase 3 trial. Blood. 2006;108(1):88–96. doi:10.1182/blood-2005-10-4073
47. Agarwala SS, Glaspy J, O’Day SJ, et al. Results from a randomized phase III study comparing combined treatment with histamine dihydrochloride plus interleukin-2 versus interleukin-2 alone in patients with metastatic melanoma. J Clin Oncol. 2002;20(1):125–133. doi:10.1200/jco.2002.20.1.125
 © 2026 The Author(s). This work is published and licensed by Dove Medical Press Limited. The
full terms of this license are available at https://www.dovepress.com/terms
and incorporate the Creative Commons Attribution
- Non Commercial (unported, 4.0) License.
By accessing the work you hereby accept the Terms. Non-commercial uses of the work are permitted
without any further permission from Dove Medical Press Limited, provided the work is properly
attributed. For permission for commercial use of this work, please see paragraphs 4.2 and 5 of our Terms.
© 2026 The Author(s). This work is published and licensed by Dove Medical Press Limited. The
full terms of this license are available at https://www.dovepress.com/terms
and incorporate the Creative Commons Attribution
- Non Commercial (unported, 4.0) License.
By accessing the work you hereby accept the Terms. Non-commercial uses of the work are permitted
without any further permission from Dove Medical Press Limited, provided the work is properly
attributed. For permission for commercial use of this work, please see paragraphs 4.2 and 5 of our Terms.