Back to Journals » Journal of Pain Research » Volume 12
Music Reduces Pain Unpleasantness: Evidence from an EEG Study
Authors Lu X ![]() , Thompson WF, Zhang L, Hu L
, Thompson WF, Zhang L, Hu L
Received 12 April 2019
Accepted for publication 29 November 2019
Published 13 December 2019 Volume 2019:12 Pages 3331—3342
DOI https://doi.org/10.2147/JPR.S212080
Checked for plagiarism Yes
Review by Single anonymous peer review
Peer reviewer comments 3
Editor who approved publication: Dr Michael Schatman
Xuejing Lu,1,2 William Forde Thompson,3,4 Libo Zhang,1,2 Li Hu1,2
1CAS Key Laboratory of Mental Health, Institute of Psychology, Beijing, People’s Republic of China; 2Department of Psychology, University of Chinese Academy of Sciences, Beijing, People’s Republic of China; 3Department of Psychology, Macquarie University, Sydney, New South Wales, Australia; 4ARC Centre of Excellence in Cognition and Its Disorders, Sydney, New South Wales, Australia
Correspondence: Li Hu
CAS Key Laboratory of Mental Health, Institute of Psychology, Beijing 100101, People’s Republic of China
Tel +86 18084053555
Fax +86-10-84249369
Email [email protected]
Background: Music is sometimes used as an adjunct to pain management. However, there is limited understanding of by what means music modulates pain perception and how the brain responds to nociceptive inputs while listening to music, because clinical practice typically involves the coexistence of multiple therapeutic interventions. To address this challenge, laboratory studies with experimental and control conditions are needed.
Methods: In the present investigation, we delivered nociceptive laser stimuli on 30 participants under three conditions – participants were sitting in silence, listening to their preferred music, or listening to white noise. Differences among conditions were quantified by self-reports of pain intensity and unpleasantness, and brain activity sampled by electroencephalography (EEG).
Results: Compared with the noise and silence conditions, participants in the music condition reported lower ratings on pain unpleasantness, as reflected by reduced brain oscillations immediately prior to the nociceptive laser stimulus at frequencies of 4–15 Hz in EEG. In addition, participants showed smaller P2 amplitudes in laser-evoked potentials (LEPs) when they were listening to music or white noise in comparison to sitting in silence. These findings suggest that a general modulation effect of sounds on pain, with a specific reduction of pain unpleasantness induced by the positive emotional impact.
Conclusion: Music may serve as a real-time regulator to modulate pain unpleasantness. Results are discussed in view of current understandings of music-induced analgesia.
Keywords: preferred music, pain, analgesic effect, emotional modulation, EEG, brain oscillations
Introduction
As a universal language, music can alleviate pain, a phenomenon known as music-induced analgesia. Unlike some pharmacological interventions that may come with a risk of undesirable side effects and adverse consequences, including addiction, suicidal ideation, and even death from overdose,1–3 music is safe and nonaddictive in pain relief. Although the efficacy of music therapy is not universally agreed upon at the moment,4,5 music-induced analgesia has been demonstrated in a range of pain conditions (see6–11 for meta-analysis results), such as labor pain12,13 and pain associated with cancer.14
Nevertheless, there is limited understanding of by what means music modulates pain perception and how the brain responds to nociceptive inputs while listening to music, as clinical practice typically involves the coexistence of multiple therapeutic factors and environmental conditions. For this reason, strict experimental studies are needed, in which easy-controlled painful stimulations are applied to healthy volunteers, and the analgesic effect of music are assessed without potential confounding factors. Existing experimental studies, though relatively rare, have shown that pleasant (consonant) music reduces pain perception in response to experimental pain stimulation when compared with unpleasant music (the dissonant arrangement of the same selections),15 regardless whether pleasant (consonant) music conveyed happy or sad emotion.16,17 In addition, self-selected or preferred music shows a stronger analgesic effect than researcher-selected music.18,19
Neuroscientific evidence also supports the notion that music can interact with pain pathways. Using functional magnetic resonance imaging (fMRI), researchers compared individuals’ brain activations during pain while they were listening to music or resting in silence, and they observed activations not only in brain regions associated with pleasant music listening, such as the amygdala, hippocampus, and nucleus accumbens, but also in regions in the descending pain modulatory pathway, such as periaqueductal gray (PAG), rostral ventromedial medulla (RVM), and dorsal gray matter of the spinal cord.20 Although such results are highly promising, it is not possible to tell whether these effects were caused by the strong emotions evoked by the music, by the attentional shift from pain to auditory stimulation, or by some other consequence of music listening.
To gain a better understanding of the analgesic effect of music listening, the present investigation applied acute pain stimulation under three experimental conditions: preferred music, white noise, and silence. Differences among conditions were observed through self-reports of pain intensity and unpleasantness, and in brain activity as measured by electroencephalography (EEG). This manipulation that music and white noise served as background sounds allowed us to determine the influences of implicit emotional modulation evoked by sounds, consistent with an extensive body of research on the automatic and implicit emotional effects of background sounds.21–23 Nociceptive laser stimuli were employed to induce acute pain in the present study, since (1) laser pulses could elicit a clear pinprick sensation, related to the activation of Aδ skin nociceptors, without coactivation of the fast-conducting Aβ fibers,24 and (2) they are easy to control and manipulate, thus constituting a standard method to induce pain in experimental investigations with EEG recordings.25 Although the neural mechanisms associated with acute pain and chronic pain are different, investigations on acute pain modulation can yield new insights into the music-induced analgesia and its neural mechanisms.
Materials and Methods
Participants
Thirty individuals (18 females) who were 18 to 28 years of age (M = 21.62 years, SD = 2.36 years) participated in the present study. None reported any hearing impairment or neurological or psychiatric disorder. All participants were right-handed and had 14.93 ± 1.82 years education (range from 13 to 19 years). Five participants (16.7%) had formal music training but less than 2 years, and the remaining participants reported no formal music training. This study was conducted in accordance with the Declaration of Helsinki and approved by the Ethics Committee at the Institute of Psychology, Chinese Academy of Sciences. The written informed consent for participation was obtained from all participants prior to testing.
Sensory Stimuli
Nociceptive-specific radiant-heat stimuli, generated by an infrared neodymium yttrium aluminum perovskite (Nd:YAP) laser (Electronic Engineering, Italy), were used as the pain stimulation in the present study. The laser wavelength was 1.34 μm. At this wavelength, the laser pulses activate directly nociceptive terminals in the most superficial skin layers.26,27 The laser beam was transmitted via an optic fiber and its diameter was set at approximately 7 mm (~38 mm2) by focusing lenses. Laser pulses were delivered to a circular area (diameter = 4 cm) on the dorsum of participants’ left hands. The pulse duration was 4 ms. After each stimulation, the laser beam target was shifted by at least 1 cm in a random direction within the circular area to avoid nociceptor fatigue and/or sensitization.
The auditory stimuli included white noise and music excerpts. White noise was generated using free software Audacity (available at https://www.audacityteam.org/) with constant amplitude. For music excerpts, participants were asked to provide one of their preferred music, regardless of music types, upon arrival. All sounds were presented at a comfortable level with equal intensity via headphones (Sennheiser HD 201).
Experimental Procedure
To determine the laser intensity used in the experiment and to familiarize with the laser stimuli, participants were instructed to rate the pain intensity of an initial series of laser stimuli prior to the experiment on a Numerical Rating Scale (NRS) ranging from 0 (no sensation) to 10 (most intense pain tolerable), with 4 denoting pinprick pain threshold.28 The energy of laser stimuli to be used in the experiment was individually determined by increasing the stimulus energy in steps of 0.25 J, until an average rating of 7 out of 10 was obtained, which represents a moderate level of pain. The energies used in the present study were 3.76 ± 0.53 J across all participants, ranging from 2.75 to 4.50 J.
There were three blocked conditions in the present study: silence, music, and noise. As shown in Figure 1, each block started with a phase in which participants were either sitting in silence or listening to their preferred music or white noise for two minutes. They were then instructed to focus on the laser stimuli, keep their eyes open, and gaze at a cross fixation on the screen in front of them. Sixteen laser stimuli were presented while the auditory stimulus (or silence) was ongoing. After the presentation of each laser stimulus, there was a 3–5 s pause, and then participants were asked to rate the pain intensity and unpleasantness orally within a time window of 3–5 s for each rating. The next trial started 1–3 s randomly after the ratings. To further investigate the pain modulation effect of the preferred music and white noise, there was an additional phase in which participants were asked to rate the auditory stimulus they had just heard on arousal, valence, liking, and the extent to which it attracted their attention. The scales ranged from 0 to 10, and the dimensions included (a) relaxed – exited, (b) unpleasant – pleasant, (c) dislike – like, and (d) not attracted – very attracted. Therefore, four additional ratings were obtained for the music and white noise conditions. Participants were encouraged to take a short break between two consecutive blocks. Before each block and after the last block, the skin surface temperature of their stimulated hand was measured. The presentation orders of the three experimental blocks were counterbalanced across participants with equal gender ratio for each order.
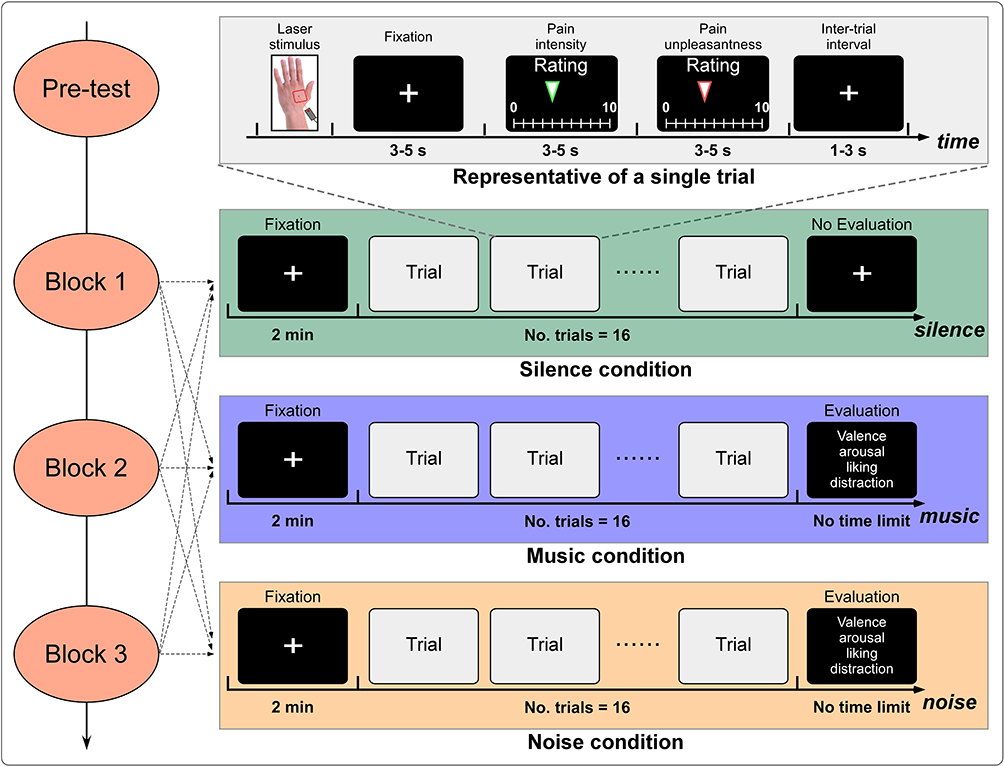 |
Figure 1 The schema of the experimental procedure. All participants underwent a pre-test first, in which the laser intensity used in the formal experiment was individually determined. Sequentially, silence, music, and noise blocks were presented pseudo-randomly. |
EEG Recording
For each block, EEG data were recorded continuously from direct current (DC) at a 1024 Hz sampling rate using an ActiveTwo AD-box (BioSemi, Netherlands). Participants wore an EEG cap with 62 Ag/AgCl electrodes placed according to the International 10–20 system. Electrode impedances were kept below 10 kΩ. Note that BioSemi systems work with a “zero-ref” setup, replacing the conventional “ground” electrodes with two separate electrodes, a common mode sense active electrode and a driven right leg passive electrode. These two electrodes form a feedback loop, driving the average potential of the participant as close as possible to the ADC reference (which can be considered as the amplifier “zero”) voltage (see https://www.biosemi.com/faq/cms&drl.htm for further information).
EEG Preprocessing
Offline processing of the EEG data was performed in MATLAB (R2016a; Mathwork, USA) using the EEGLAB toolbox.29 Continuous EEG data were re-referencing to average reference, and then were highpass filtered at 0.1 Hz and lowpass filtered at 30 Hz. Subsequently, EEG data were segmented into short epochs extending from −500 ms before to 1000 ms after the onset of laser stimuli with baseline correction using the prestimulus interval. EEG data of bad channels were corrected using spherical interpolation. To identify and remove eyeblinks and movements, an independent component analysis using the runica algorithm implemented in the EEGLAB toolbox was conducted.29
Time-Domain Analysis
For each participant, laser-evoked potentials (LEPs) were obtained by averaging epochs. Peak amplitudes and latencies of N1, N2, and P2 waves were measured from the averaged LEP waveform. N1 wave was defined as the most negative deflection preceding the N2 wave, which showed a contralateral central-temporal scalp distribution. A bipolar montage, ie, central and temporal electrode contralateral to the stimulated side referenced to Fz (C4-Fz and T8-Fz), was recommended to optimally detect the N1 wave.30,31 N2 and P2 waves, defined as the most negative and positive deflections between 150 and 500 ms after stimulus onset respectively,32,33 were measured at the scalp vertex (Cz-avg) for each participant. Single-subject average waveforms were subsequently averaged to obtain group-level waveforms. Group-level scalp topographies at the peak latencies of these LEP waves were computed by spline interpolation.
Time-Frequency Analysis
To identify brain oscillations associated with music modulation, a time-frequency analysis was applied to single-trial EEG responses. Although gamma-band oscillations are closely related to pain perception,25,34,35 the signal-to-noise ratio (SNR) of gamma-band oscillations is quite low,25 and a large number of trials and participants are required to correctly identify gamma-band oscillations. Since the number of trials in each experimental condition was limited, our analysis was focused on comparing brain oscillations at lower frequencies (ie, 1–30 Hz). Specifically, a time-frequency distribution (TFD) of the EEG time course was obtained using a windowed Fourier transform (WFT) with a fixed 300-ms Hanning window. For each time course, the WFT yielded a complex time-frequency estimate F(t,f) at each point (t,f) of the time-frequency plane, extending from −500 to 1000 ms (in 1-ms intervals) in the time domain, and from 1 to 30 Hz (in 1-Hz intervals) in the frequency domain. The resulting spectrogram, P(t,f) = |F(t,f)|2, represents the signal power as a joint function of time and frequency at each time-frequency point. The spectrogram was then baseline-corrected using the subtraction approach (reference interval: −400 to −100 ms relative to stimulus onset) at each frequency.36 Please note that TFDs without baseline correction could be used to assess the effect of music on spontaneous EEG oscillations (ie, prior to laser stimuli), and TFDs with baseline correction could be used to investigate the effect of music on laser-elicited EEG modulations (ie, post laser stimuli). Both variables were used for further statistical analyses.
Statistical Analysis
One-way repeated-measures analysis of variance (ANOVA) was conducted to assess the possible difference of the skin surface temperature of the stimulated hand before each block and after the last block. In addition, paired sample t-tests were applied to compare the ratings on arousal, valence, liking, and attentional level between music and noise. Cohen’s d was calculated to reflect the effect size for the t-tests.
Averaged ratings of pain intensity and pain unpleasantness, calculated for each condition and participant, were compared using one-way repeated-measures ANOVAs, with the within-subject factor of condition (silence, music, and noise). Greenhouse-Geisser adjustments were used in light of violations of sphericity, and Bonferroni correction was used for multiple comparisons, where appropriate. Partial eta-squared (ηp2) was calculated to reflect the effect size for the ANOVAs. The same statistical analyses were conducted on the peak latencies and amplitudes of N1, N2, and P2 waves of LEPs.
In addition, point-by-point one-way repeated-measures ANOVAs, combined with nonparametric permutation testing,33,37,38 were performed to assess the significance of the effect of music on time-frequency EEG activities (TFDs without baseline correction for spontaneous EEG oscillations and TFDs with baseline correction for laser-elicited EEG modulations), and to define the significant regions of interest (ROIs) at each EEG channel (the same analysis was performed on all EEG channels).38 More specifically, each point (t, f) of the time-frequency maps was first compared using a one-way repeated-measures ANOVA with the within-subject factor of condition. This yielded one time-frequency map of F-values, representing the main effect of condition, and time-frequency points with a p-value ≤ 0.05 were selected for subsequent analyses. To account for the multiple-comparison problem in the point-by-point statistical analysis of time-frequency representations,33,37,38 significant time-frequency points (p ≤ 0.05) were then categorized in clusters based on their adjacency in the time-frequency plane (cluster-level statistical analysis) and only clusters composed of more than 200 adjacent significant time-frequency points were considered. The sum of the F-values of all time-frequency points composing a cluster, defined its cluster-level statistics (∑F). Subsequentially, for every participant, we randomly permutated 5000 times the time-frequency representations of the three conditions. In each permutation, the same one-way repeated-measures ANOVA was performed at every time-frequency point of the identified clusters, thus yielding a cluster-level statistic ∑F’(m) at the m-th permutation. Permutation distributions D(∑F) of the cluster-level F-statistics were obtained from ∑F’(m). For each identified cluster, its two-tailed p-value pF was obtained by locating the observed ∑F under the permutation distribution D(∑F) estimated from permutated ∑F(m). Finally, clusters having a p-value smaller than a defined threshold (pF ≤ 0.05) were used to define time-frequency ROIs for the subsequent analysis. Within the identified ROIs, we computed the mean of all time-frequency points for each condition and participant for displaying purpose. The obtained summary values at each EEG channel were compared using one-way repeated-measures ANOVAs, with the within-subject factor of condition.
Results
Behavioral Results
As shown in Figure 2, we observed a statistically reliable condition effect on the ratings of pain unpleasantness (silence = 3.94 ± 2.28; music = 2.91 ± 2.09; noise = 3.93 ± 2.29), F(2,58) = 5.79, p = 0.005, ηp2 = 0.17. Post-hoc analyses suggested that participants felt less unpleasant towards painful stimuli while listening to music, when compared with listening to noise (p = 0.034) or sitting in silence (p = 0.045). The difference observed among conditions cannot be attributed to the skin surface temperature, as no difference was found over time (Block 1 = 32.64 ± 1.38 °C; Block 2 = 32.52 ± 1.60 °C; Block 3 = 32.50 ± 1.36 °C; End of experiment = 32.54 ± 1.56 °C), F(3,87) = 0.43, p = 0.73, ηp2 = 0.02. In contrast, there was a trend showing that the pain intensity was smaller in the music condition, even though the reported pain intensity among the three experimental conditions was statistically comparable (silence = 5.57 ± 1.38; music = 5.11 ± 1.23; noise = 5.52 ± 1.22), F(2,58) = 1.89, p = 0.16, ηp2 = 0.06. The evaluation on auditory stimuli showed that, when compared with noise, music was more relaxing, pleasant, and liked, all p < 0.001. However, music and noise were comparable in terms of their attentional level, p > 0.05 (see Table 1 for details).
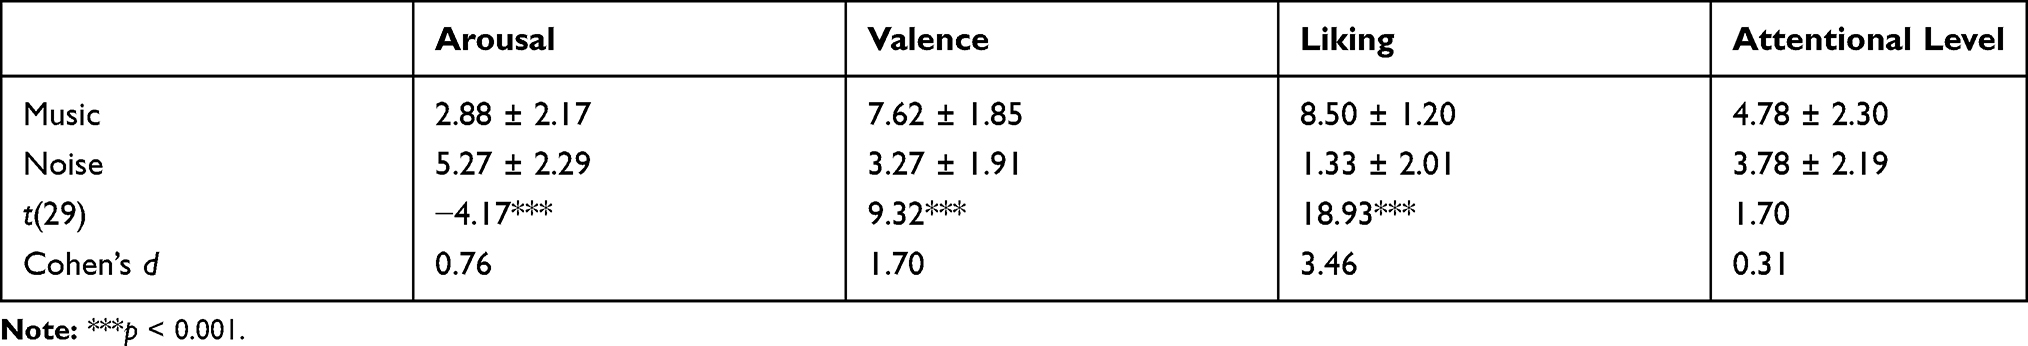 |
Table 1 Comparisons of Ratings (Mean ± SD) on Arousal, Valence, Liking, and Attentional Level Between Music and White Noise Conditions |
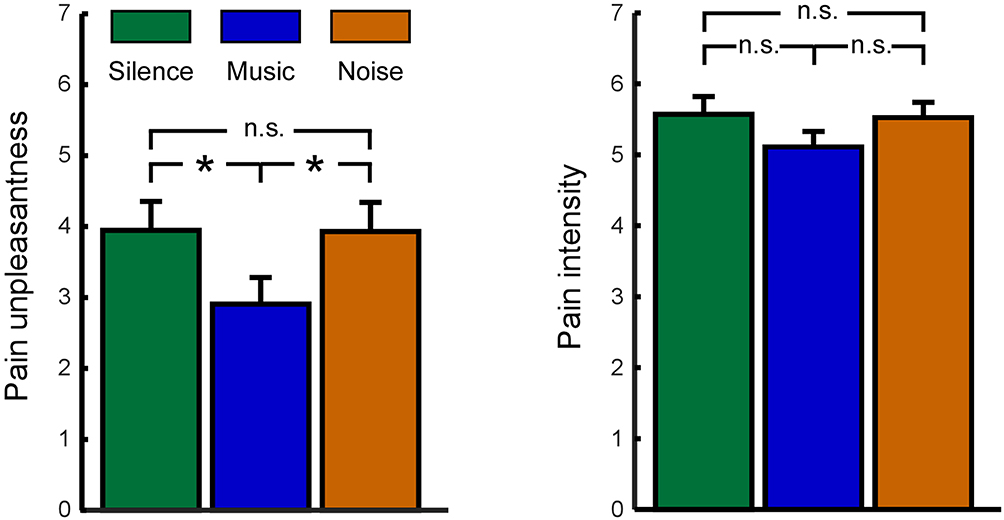 |
Figure 2 The effect of music on pain unpleasantness (left panel) and pain intensity (right panel). Whereas the reported pain unpleasantness was significant smaller for music condition (blue bar) in comparison to silence condition (green bar) and noise condition (orange bar), the reported pain intensity among the three experimental conditions was statistically comparable. *Indicates p < 0.05; n.s. indicates not significant; error bar represents one standard error. |
EEG Results: Time Domain
As shown in Table 2, no difference on N1 amplitudes or latencies was observed among the three experimental conditions at C4 (amplitude: F(2,58) = 0.37, p = 0.69, ηp2 = 0.01; latency: F(2,58) = 0.34, p = 0.72, ηp2 = 0.01) and T8 (amplitude: F(2,58) = 0.23, p = 0.80, ηp2 = 0.01; latency: F(2,58) = 1.57, p = 0.22, ηp2 = 0.05). Whereas N2 amplitudes were comparable among the three experimental conditions, F(2,58) = 1.57, p = 0.22, ηp2 = 0.05, the analysis on P2 amplitude yielded a significant effect of condition, F(2,58) = 5.46, p = 0.008, ηp2 = 0.16 (see Figure 3). Post-hoc analyses indicated that the amplitude of P2 wave was significantly smaller in the music condition than in the silence condition (p = 0.012). In addition, there was a trend showing that the P2 amplitude was smaller in the noise condition than in the silence condition (p = 0.053). For the latency, a significant effect of condition was neither found for the N2 nor P2 waves, F(2,58) = 0.14, p = 0.87, ηp2 = 0.005, and F(2,58) = 0.06, p = 0.91, ηp2 = 0.002, respectively (see Table 2).
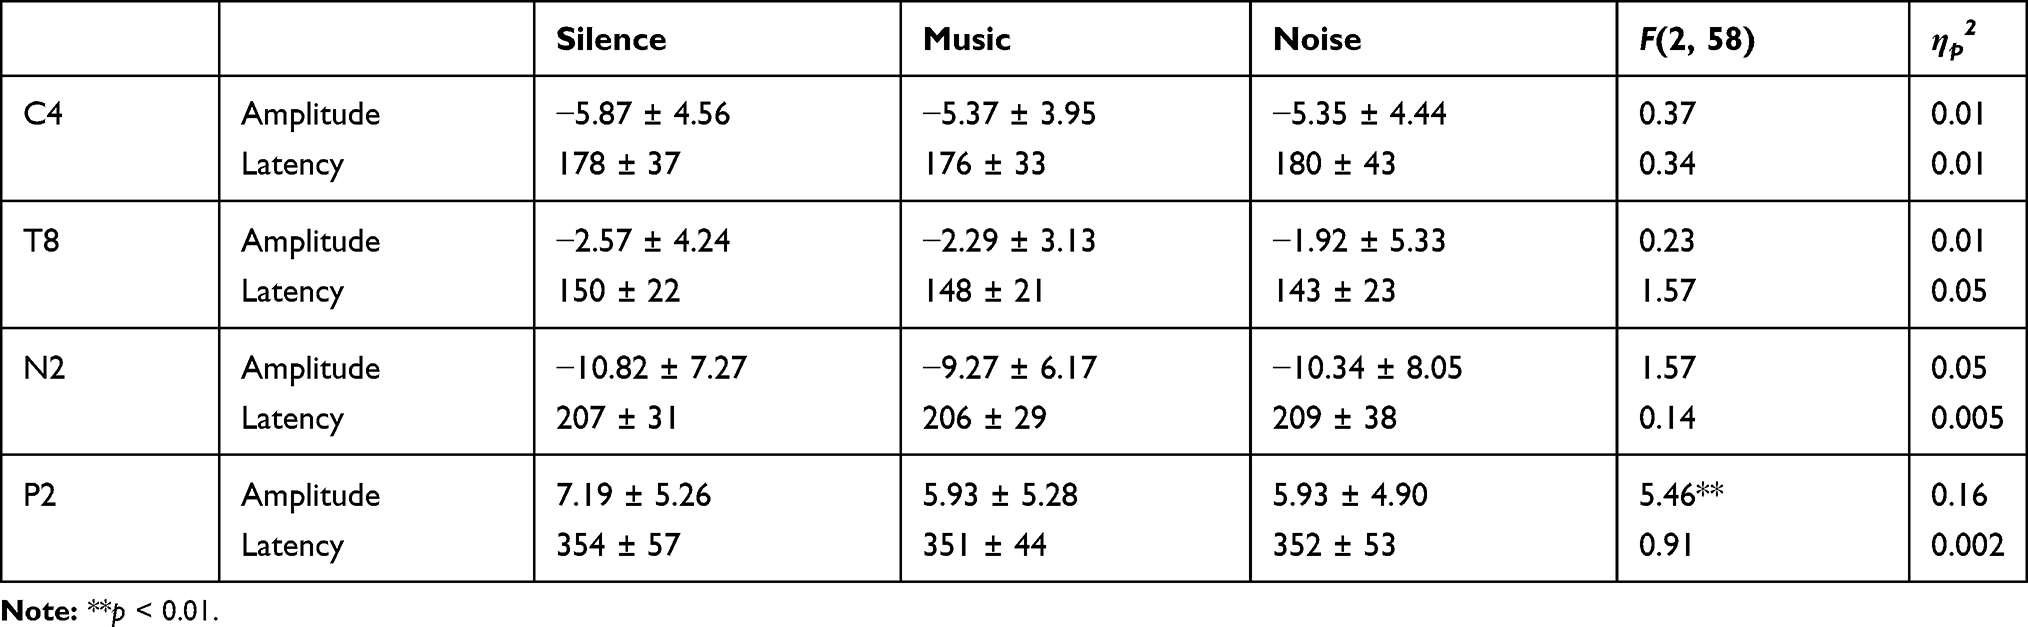 |
Table 2 Comparisons of Amplitude (μV) and Latency (ms) of N1 Wave Measured at Central (C4-Fz) and Temporal (T8-Fz) Regions Contralateral to Laser Stimuli, and N2 and P2 Waves Measured at Central Region (Cz-Avg) Among the Three Experimental Conditions |
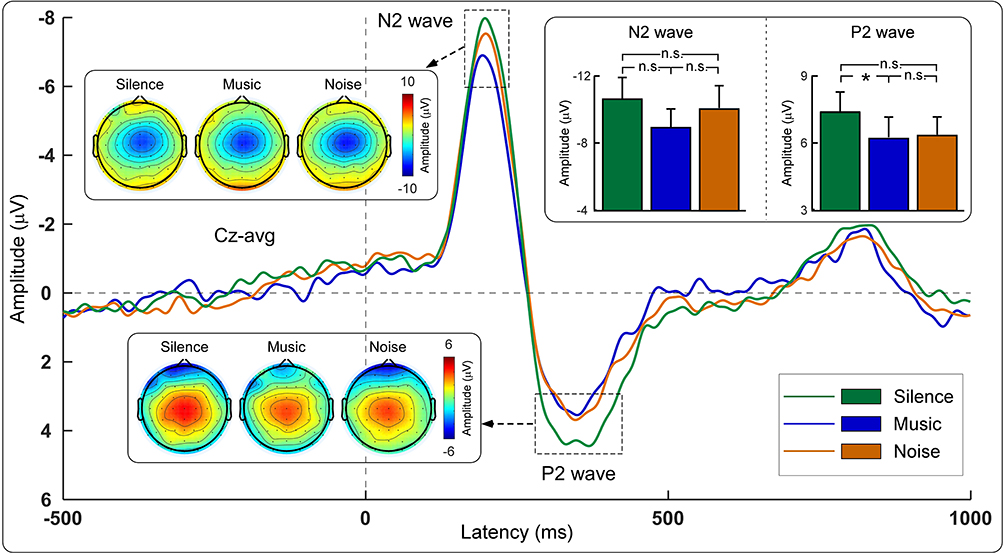 |
Figure 3 The grand average LEP waveforms (Cz-avg) and the scalp topographies of N2 and P2 waves for each experimental condition. The bar charts showed comparisons of N2 and P2 amplitudes between the three experimental conditions. Data from the silence, music, and noise conditions are expressed in green, blue, and orange, respectively. *Indicates p < 0.05; n.s. indicates not significant; error bar represents one standard error. |
EEG Results: Time-Frequency Domain
As demonstrated in Figure 4, one time-frequency cluster (dominant at the alpha frequency band) in the prestimulus interval was significantly different among the three conditions (−207 ms – 0 ms, 4–15 Hz; maximal at central electrodes) for TFDs without baseline correction. Further statistical analysis indicated that the magnitude of the prestimulus EEG oscillations within the ROI at Cz was significantly different among the three conditions, F(2,58) = 11.32, p = 0.003, ηp2 = 0.28. Post-hoc analyses indicated that the magnitude of the prestimulus EEG oscillations was significantly smaller in the music condition (1.59 ± 0.89 μV/Hz), in comparison to the noise condition (1.99 ± 1.30 μV/Hz, p = 0.001) and the silence condition (2.09 ± 1.38 μV/Hz, p = 0.001). In contrast, no significant time-frequency cluster was identified for TFDs with baseline correction.
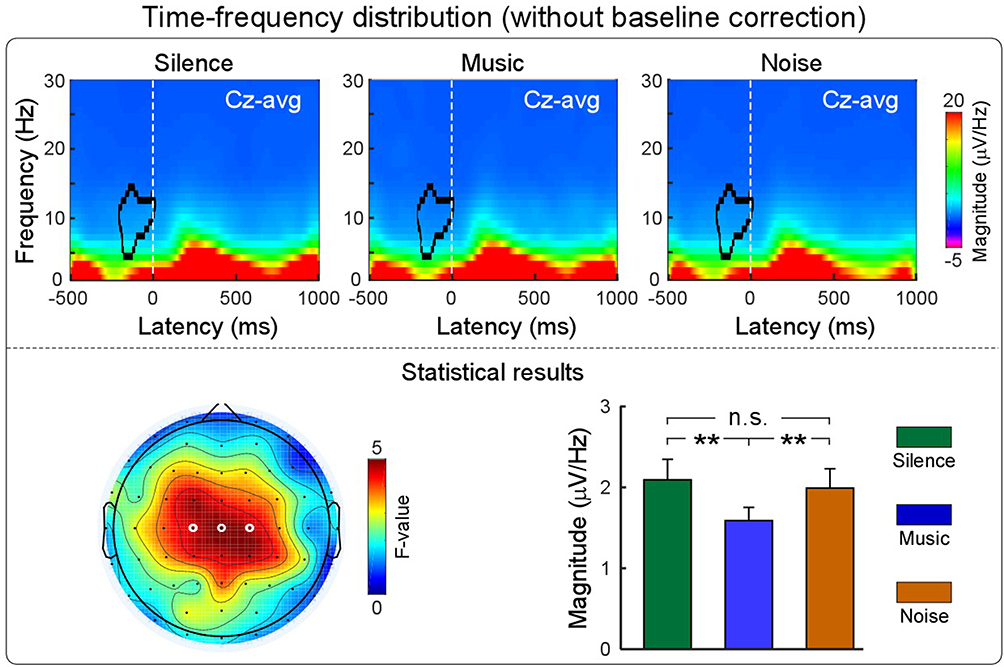 |
Figure 4 The effect of music on TFDs without baseline correction (Cz-avg). The grand average TFDs are displayed for each condition (silence, music, and noise) in the upper panel, and their statistical results are showed in the lower panel. The scalp topography (left, lower panel) indicates the distribution of F-values obtained from the one-way repeated-measures ANOVA (electrodes showed significant effect of condition are marked by white circles). The bar charts (right, lower panel) showed the comparison of the magnitude of the prestimulus EEG oscillations within the ROI at Cz among the three experimental conditions. Data from the silence, music, and noise conditions are expressed in green, blue, and orange respectively. **Indicates p < 0.01; n.s. indicates not significant; error bar represents one standard error. Please note that clear difference of TFDs can be observed in the prestimulus time-frequency cluster when using a different scale of the colorbar (ie, from −1 to 3 μV/Hz; please refer to Supplementary Figure 1). |
Discussion
The present investigation examined the extent to which listening to one’s preferred music or white noise reduces pain perception in comparison to silence. EEG signals were recorded to identify possible neural indicators that encode the modulation of sounds on pain. Compared with the noise and silence conditions, participants in the music condition reported lower ratings on pain unpleasantness, as reflected by reduced brain oscillations immediately prior to the nociceptive laser stimulus at frequencies of 4–15 Hz in EEG. In addition, participants showed smaller P2 amplitudes in LEPs when they were listening to music (statistically significant) or white noise (marginally significant) in comparison to sitting in silence. It should be noted that our findings are not influenced by the participants’ gender (Supplementary Tables 1 and 2).
Music-Induced Analgesia: Behavioral Evidence
One of the main findings of the present study is that participants were more likely to experience a reduction in pain unpleasantness rather than pain intensity when listening to preferred music. It has been suggested that pain unpleasantness is highly sensitive to emotional modulation, whereas pain intensity is typically sensitive to attentional modulation.39 Therefore, this observation can be mainly attributed to a modulation by music of the emotional dimension of pain. Indeed, participants in our investigation were presented with their preferred music, which was evaluated as more relaxing, pleasant, and liked when compared with noise (Table 1). Such manipulation ensured that participants immersed themselves in a pleasant emotional state in the music condition. Two lines of evidence support the view that music-induced analgesia was achieved by the modulation of emotion: (1) listening to music can regulate listeners’ arousal and mood,40 as it can often evoke feelings of intense pleasure in listeners, sometimes experienced as “thrills” or “goose bumps”;41 (2) pain perception, especially the unpleasantness aspect, is reduced when individuals are in a pleasant emotional state.42
It should be noted that music can also act as a source of distraction away from pain,43 although the role of attention was less significant in this study, given that we only observed a downtrend of pain intensity in the music condition. For the failure to observe a significant reduction on pain intensity in the music condition, one explanation is that music-induced analgesia works mainly via emotional modulation rather than attentional modulation. Therefore, only pain unpleasantness but not pain intensity was modulated by music. This explanation is compatible with evidence that music is more effective at modulating the affective dimension rather than the sensory dimension of pain perception.15,44–46 Another possibility is that the number of trials was relatively small in each condition (16 trials), resulting in a limited power to detect the difference between conditions in pain intensity. It is also possible that neither the preferred music nor white noise per se in our manipulation, where music and white noise served as background sounds, was capable enough of drawing attention away from the painful stimuli at least at behavioral level, since otherwise salient distractor would dramatically reduce pain intensity.39,47,48
Music-Induced Analgesia: Electrophysiological Evidence
The analgesic effect of music was further reflected by the LEP results, where a significant condition difference was found on the P2 amplitude. The N2 and P2 waves are two dominant components in LEPs, and their amplitudes are strongly correlated with both stimulus energy and pain perception at within-subject level in most cases.24,25,49 Even both N2 and P2 waves are maximal at the scalp vertex,32,50 they are demonstrated to be generated from distinct sources with different cortical functions. The N2 component is proven to be mainly generated from the bilateral secondary somatosensory cortices and bilateral opercula-insular cortices,31,50,51 reflecting the discriminatory and attentional aspects of pain processing in the brain.52,53 The P2 component is believed to be mainly generated from the anterior and middle cingulate cortices (ACC and MCC), and it is responsible for the processing of cognitive and affective dimensions of pain perception.31,51
In our study, no significant difference was found on the N2 amplitude among the three experimental conditions, while the P2 amplitude was attenuated in the music condition but only marginally attenuated in the noise condition in comparison to the silence condition (Figure 3 and Table 2). This finding may suggest a general modulation effect of sounds on pain, with a specific reduction of the involuntary attentional shift toward nociceptive events induced by the positive emotional impact (ie, preferred music). Indeed, the P2 component of LEPs seems to express arousal and emotive reaction to pain, as similar modulation effect on P2 amplitude was also found when laser stimuli were preceded by the presentation of pleasant pictures.54,55 In addition, the reduction of P2 amplitude could be associated with distraction induced by preferred music or white noise. This interpretation is in a good agreement with the idea that inter-modal modulation of attention would result in the inhibition of later LEPs.56
Music-Induced Analgesia: The Role of Prestimulus EEG Oscillations
Importantly, we observed that the magnitude of EEG oscillations immediately prior to the nociceptive laser stimulus (dominant at alpha frequencies and maximal at central electrodes) was significantly smaller in the music condition than in the noise and silence conditions (Figure 4). This observation is consistent with previous findings showing that prestimulus brain oscillations, which reflect the readiness of the system to respond to an external stimulus,57,58 predict both the perception and the neural responses elicited by subsequent stimuli.59,60 Note that previous studies assessing the modulation of prestimulus alpha oscillations on the neural processing of subsequent sensory stimuli have relied on the extraction of oscillatory features from spontaneous EEG activities (eg,61,62). In these cases, the modulatory effect was dependent on the functional state of the primary sensory cortex pertinent to the modality of the forthcoming stimulus.33 For this reason, prestimulus alpha oscillations have been interpreted as a measure of altered excitability of neuronal ensembles in primary sensory cortices.63 In contrast, the magnitude of prestimulus EEG oscillations was modulated by experimental manipulations in the present study, where participants were either sitting in silence or listening to their preferred music or white noise during the whole experiment. Therefore, the decreased magnitude of alpha oscillations immediately prior to the nociceptive laser stimulus in the music condition is not likely to reflect the excitability of neuronal ensembles in primary sensory cortices, but the activation of brain regions related to the processing of music, considering that a large number of studies reported consistent brain activations (eg, ACC and the prefrontal cortex) when participants were listening to music.64–66 Consequently, the activation of these high-level brain regions could boost top-down modulations on the neural processing of subsequent sensory stimuli via the inhibitory control of emotionally related brain regions on the pain processing pathways.20 Therefore, prestimulus alpha oscillations could serve as neural index to code participants’ emotional state, which further modulate the laser-evoked brain responses (eg, P2 amplitude).
Limitations and Future Directions
To conclude, the current investigation indicates that listening to preferred music can reliably reduce individuals’ pain unpleasantness, as reflected by a decrease in the magnitude of alpha oscillations immediately prior to the nociceptive laser stimulus. In other words, music may serve as a real-time regulator to modulate pain unpleasantness. However, there are several limitations in the present study calling for further investigations. First, the specific contribution of attentional and emotional modulation on the music-induced analgesia was not fully understood. To achieve a better understanding of the essence of music-induced analgesia, future research should focus on isolating the attentional and emotional modulations of music on pain perception by involving attentional and emotional comparable controls, such as soundless film and unpleasant music. Second, the number of trials and participants were limited. For this reason, neural oscillations that are closely related to pain perception (eg, gamma-band oscillations35,38) cannot be reliably extracted due to their low SNR.25 It is necessary to include more experimental trials for each condition and more participants in future studies, given that both would enhance the SNR of laser-evoked brain responses, especially considering the large inter-individual difference of the brain responses.25,67 Last, the present study was limited to healthy participants with experimental pain. Therefore, the generalization of our results should be taken cautiously. Future studies could include investigations on patients with acute or chronic pain to assess the music-induced analgesia in different pain conditions.
Acknowledgments
This work was supported by the National Natural Science Foundation of China (No. 31701000, 31671141, 31822025), the 13th Five-year Informatization Plan of Chinese Academy of Sciences (No. XXH13506), and CAS Key Laboratory of Mental Health, Institute of Psychology (KLMH2018ZG02). The funders had no role in study design, data collection and analysis, decision to publish, or preparation of the manuscript.
Disclosure
The author reports no conflicts of interest in this work.
References
1. Dhalla IA, Persaud N, Juurlink DN. Facing up to the prescription opioid crisis. BMJ. 2011;343:d5142. doi:10.1136/bmj.d5142
2. Kolodny A, Courtwright DT, Hwang CS, et al. The prescription opioid and heroin crisis: a public health approach to an epidemic of addiction. Annu Rev Public Health. 2015;36:559–574. doi:10.1146/annurev-publhealth-031914-122957
3. Rudd RA, Aleshire N, Zibbell JE, Matthew Gladden R. Increases in drug and opioid overdose deaths—United States, 2000–2014. Am J Transplant. 2016;16(4):1323–1327. doi:10.1111/ajt.13776
4. Shim JS, Chae JY, Kang SG, et al. Can listening to music decrease pain, anxiety, and stress during a urodynamic study? A randomized prospective trial focusing on gender differences. Urology. 2017;104:59–63. doi:10.1016/j.urology.2017.02.035
5. Mak N, Reinders IMA, Slockers SA, Westen E, Maas JWM, Bongers MY. The effect of music in gynaecological office procedures on pain, anxiety and satisfaction: a randomized controlled trial. Gynecol Surg. 2017;14(1):14. doi:10.1186/s10397-017-1016-2
6. Zhang JM, Wang P, Yao JX, et al. Music interventions for psychological and physical outcomes in cancer: a systematic review and meta-analysis. Support Care Cancer. 2012;20(12):3043–3053. doi:10.1007/s00520-012-1606-5
7. Tsai HF, Chen YR, Chung MH, et al. Effectiveness of music intervention in ameliorating cancer patients’ anxiety, depression, pain, and fatigue: a meta-analysis. Cancer Nurs. 2014;37(6):E35–E50. doi:10.1097/NCC.0000000000000116
8. Cepeda MS, Carr DB, Lau J, Alvarez H. Music for pain relief. Cochrane Database Syst Rev. 2006;2(2):CD004843.
9. Lee JH. The effects of music on pain: a meta-analysis. J Music Ther. 2016;53(4):430–477. doi:10.1093/jmt/thw012
10. Hole J, Hirsch M, Ball E, Meads C. Music as an aid for postoperative recovery in adults: a systematic review and meta-analysis. Lancet. 2015;386(10004):1659–1671. doi:10.1016/S0140-6736(15)60169-6
11. Standley JM. A meta-analysis of the efficacy of music therapy for premature infants. J Pediatr Nur. 2002;17(2):107–113. doi:10.1053/jpdn.2002.124128
12. Simavli S, Gumus I, Kaygusuz I, Yildirim M, Usluogullari B, Kafali H. Effect of music on labor pain relief, anxiety level and postpartum analgesic requirement: a randomized controlled clinical trial. Gynecol Obstet Invest. 2014;78(4):244–250. doi:10.1159/000365085
13. Hosseini SE, Bagheri M, Honarparvaran N. Investigating the effect of music on labor pain and progress in the active stage of first labor. Eur Rev Med Pharmacol Sci. 2013;17(11):1479–1487.
14. Zimmerman L, Pozehl B, Duncan K, Schmitz R. Effects of music in patients who had chronic cancer pain. West J Nurs Res. 1989;11(3):298–309. doi:10.1177/019394598901100304
15. Roy M, Peretz I, Rainville P. Emotional valence contributes to music-induced analgesia. Pain. 2008;134(1–2):140–147. doi:10.1016/j.pain.2007.04.003
16. Kenntner-Mabiala R, Gorges S, Alpers GW, Lehmann AC, Pauli P. Musically induced arousal affects pain perception in females but not in males: a psychophysiological examination. Biol Psychol. 2007;75(1):19–23. doi:10.1016/j.biopsycho.2006.10.005
17. Zhao H, Chen AC. Both happy and sad melodies modulate tonic human heat pain. J Pain. 2009;10(9):953–960. doi:10.1016/j.jpain.2009.03.006
18. Perlini AH, Viita KA. Audioanalgesia in the control of experimental pain. Can J Behav Sci. 1996;28(4):292.
19. Mitchell LA, MacDonald RA. An experimental investigation of the effects of preferred and relaxing music listening on pain perception. J Music Ther. 2006;43(4):295–316. doi:10.1093/jmt/43.4.295
20. Dobek CE, Beynon ME, Bosma RL, Stroman PW. Music modulation of pain perception and pain-related activity in the brain, brain stem, and spinal cord: a functional magnetic resonance imaging study. J Pain. 2014;15(10):1057–1068. doi:10.1016/j.jpain.2014.07.006
21. Pereira CS, Teixeira J, Figueiredo P, Xavier J, Castro SL, Brattico E. Music and emotions in the brain: familiarity matters. PLoS One. 2011;6(11):e27241. doi:10.1371/journal.pone.0027241
22. Menon V, Levitin DJ. The rewards of music listening: response and physiological connectivity of the mesolimbic system. NeuroImage. 2005;28(1):175–184. doi:10.1016/j.neuroimage.2005.05.053
23. Bogert B, Numminen-Kontti T, Gold B, et al. Hidden sources of joy, fear, and sadness: explicit versus implicit neural processing of musical emotions. Neuropsychologia. 2016;89:393–402. doi:10.1016/j.neuropsychologia.2016.07.005
24. Iannetti GD, Zambreanu L, Tracey I. Similar nociceptive afferents mediate psychophysical and electrophysiological responses to heat stimulation of glabrous and hairy skin in humans. J Physiol. 2006;577(Pt 1):235–248. doi:10.1113/jphysiol.2006.115675
25. Hu L, Iannetti GD. Neural indicators of perceptual variability of pain across species. Proc Natl Acad Sci U S A. 2019;116(5):1782–1791. doi:10.1073/pnas.1812499116
26. Baumgartner U, Cruccu G, Iannetti GD, Treede RD. Laser guns and hot plates. Pain. 2005;116(1–2):1–3. doi:10.1016/j.pain.2005.04.021
27. Bromm B, Treede RD. Nerve-fiber discharges, cerebral potentials and sensations induced by CO2-laser stimulation. Hum Neurobiol. 1984;3(1):33–40.
28. Hu L, Cai MM, Xiao P, Luo F, Iannetti GD. Human brain responses to concomitant stimulation of A and C nociceptors. J Neurosci. 2014;34(34):11439–11451. doi:10.1523/JNEUROSCI.1355-14.2014
29. Delorme A, Makeig S. EEGLAB: an open source toolbox for analysis of single-trial EEG dynamics including independent component analysis. J Neurosci Meth. 2004;134(1):9–21. doi:10.1016/j.jneumeth.2003.10.009
30. Hu L, Mouraux A, Hu Y, Iannetti GD. A novel approach for enhancing the signal-to-noise ratio and detecting automatically event-related potentials (ERPs) in single trials. NeuroImage. 2010;50(1):99–111. doi:10.1016/j.neuroimage.2009.12.010
31. Valentini E, Hu L, Chakrabarti B, Hu Y, Aglioti SM, Iannetti GD. The primary somatosensory cortex largely contributes to the early part of the cortical response elicited by nociceptive stimuli. NeuroImage. 2012;59(2):1571–1581. doi:10.1016/j.neuroimage.2011.08.069
32. Jin QQ, Wu GQ, Peng WW, Xia XL, Hu L, Iannetti GD. Somatotopic representation of second pain in the primary smatosensory cortex of humans and rodents. J Neurosci. 2018;38(24):5538–5550. doi:10.1523/JNEUROSCI.3654-17.2018
33. Tu Y, Zhang Z, Tan A, et al. Alpha and gamma oscillation amplitudes synergistically predict the perception of forthcoming nociceptive stimuli. Hum Brain Mapp. 2016;37(2):501–514. doi:10.1002/hbm.23048
34. Ploner M, Sorg C, Gross J. Brain rhythms of pain. Trends Cogn Sci. 2016;21(2):100–110. doi:10.1016/j.tics.2016.12.001
35. Gross J, Schnitzler A, Timmermann L, Ploner M. Gamma oscillations in human primary somatosensory cortex reflect pain perception. PLoS Biol. 2007;5(5):e133. doi:10.1371/journal.pbio.0050133
36. Hu L, Xiao P, Zhang ZG, Mouraux A, Iannetti GD. Single-trial time–frequency analysis of electrocortical signals: baseline correction and beyond. NeuroImage. 2014;84:876–887. doi:10.1016/j.neuroimage.2013.09.055
37. Maris E, Oostenveld R. Nonparametric statistical testing of EEG- and MEG-data. J Neurosci Methods. 2007;164(1):177–190. doi:10.1016/j.jneumeth.2007.03.024
38. Zhang ZG, Hu L, Hung YS, Mouraux A, Iannetti GD. Gamma-band oscillations in the primary somatosensory cortex - a direct and obligatory correlate of subjective pain intensity. J Neurosci. 2012;32(22):7429–7438. doi:10.1523/JNEUROSCI.5877-11.2012
39. Bushnell MC, Ceko M, Low LA. Cognitive and emotional control of pain and its disruption in chronic pain. Nat Rev Neurosci. 2013;14(7):502–511. doi:10.1038/nrn3516
40. Schafer T, Sedlmeier P, Stadtler C, Huron D. The psychological functions of music listening. Front Psychol. 2013;4:511. doi:10.3389/fpsyg.2013.00511
41. Goldstein A. Thrills in response to music and other stimuli. Physiol Psychol. 1980;8(1):126–129. doi:10.3758/BF03326460
42. Vuilleumier P. How brains beware: neural mechanisms of emotional attention. Trends Cogn Sci. 2005;9(12):585–594. doi:10.1016/j.tics.2005.10.011
43. Hauck M, Metzner S, Rohlffs F, Lorenz J, Engel AK. The influence of music and music therapy on pain-induced neuronal oscillations measured by magnetencephalography. Pain. 2013;154(4):539–547. doi:10.1016/j.pain.2012.12.016
44. Meeuse JJ, Koornstra JJ, Reyners AK. Listening to music does not reduce pain during sigmoidoscopy. Eur J Gastroenterol Hepatol. 2010;22(8):942–945. doi:10.1097/MEG.0b013e328336ec6e
45. Soo MS, Jarosz JA, Wren AA, et al. Imaging-guided core-needle breast biopsy: impact of deditation and music interventions on patient anxiety, pain, and fatigue. J Am Coll Radiol. 2016;13(5):526–534. doi:10.1016/j.jacr.2015.12.004
46. Mitchell LA, MacDonald RA, Brodie EE. A comparison of the effects of preferred music, arithmetic and humour on cold pressor pain. Eur J Pain. 2006;10(4):343–351. doi:10.1016/j.ejpain.2005.03.005
47. Bantick SJ, Wise RG, Ploghaus A, Clare S, Smith SM, Tracey I. Imaging how attention modulates pain in humans using functional MRI. Brain. 2002;125(2):310–319. doi:10.1093/brain/awf022
48. Villemure C, Bushnell CM. Cognitive modulation of pain: how do attention and emotion influence pain processing? Pain. 2002;95(3):195–199. doi:10.1016/S0304-3959(02)00007-6
49. Huang G, Xiao P, Hung YS, Iannetti GD, Zhang ZG, Hu L. A novel approach to predict subjective pain perception from single-trial laser-evoked potentials. NeuroImage. 2013;81:283–293. doi:10.1016/j.neuroimage.2013.05.017
50. Hu L, Valentini E, Zhang ZG, Liang M, Iannetti GD. The primary somatosensory cortex contributes to the latest part of the cortical response elicited by nociceptive somatosensory stimuli in humans. NeuroImage. 2014;84:383–393. doi:10.1016/j.neuroimage.2013.08.057
51. Garcia-Larrea L, Frot M, Valeriani M. Brain generators of laser-evoked potentials: from dipoles to functional significance. Neurophysiol Clin. 2003;33(6):279–292. doi:10.1016/j.neucli.2003.10.008
52. Legrain V, Guérit JM, Bruyer R, Plaghki L. Attentional modulation of the nociceptive processing into the human brain: selective spatial attention, probability of stimulus occurrence, and target detection effects on laser evoked potentials. Pain. 2002;99(1–2):21–39. doi:10.1016/S0304-3959(02)00051-9
53. Garcia-Larrea L, Peyron R, Laurent B, Mauguière F. Association and dissociation between laser-evoked potentials and pain sensation. Neuroreport. 1997;8:3785–3789. doi:10.1097/00001756-199712010-00026
54. de Tommaso M, Sardaro M, Livrea P. Aesthetic value of paintings affects pain thresholds. Conscious Cogn. 2008;17(4):1152–1162. doi:10.1016/j.concog.2008.07.002
55. de Tommaso M, Calabrese R, Vecchio E, De Vito Francesco V, Lancioni G, Livrea P. Effects of affective pictures on pain sensitivity and cortical responses induced by laser stimuli in healthy subjects and migraine patients. Int J Psychophysiol. 2009;74(2):139–148. doi:10.1016/j.ijpsycho.2009.08.004
56. Lorenz J, Garcia-Larrea L. Contribution of attentional and cognitive factors to laser evoked brain potentials. Neurophysiol Clin. 2003;33(6):293–301. doi:10.1016/j.neucli.2003.10.004
57. Boly M, Balteau E, Schnakers C, et al. Baseline brain activity fluctuations predict somatosensory perception in humans. Proc Natl Acad Sci U S A. 2007;104(29):12187–12192. doi:10.1073/pnas.0611404104
58. Gilbert CD, Sigman M. Brain states: top-down influences in sensory processing. Neuron. 2007;54(5):677–696. doi:10.1016/j.neuron.2007.05.019
59. Laufs H, Krakow K, Sterzer P, et al. Electroencephalographic signatures of attentional and cognitive default modes in spontaneous brain activity fluctuations at rest. Proc Natl Acad Sci U S A. 2003;100(19):11053–11058. doi:10.1073/pnas.1831638100
60. Fox MD, Raichle ME. Spontaneous fluctuations in brain activity observed with functional magnetic resonance imaging. Nat Rev Neurosci. 2007;8(9):700–711. doi:10.1038/nrn2201
61. Hu L, Peng W, Valentini E, Zhang Z, Hu Y. Functional features of nociceptive-induced suppression of alpha band electroencephalographic oscillations. J Pain. 2013;14(1):89–99. doi:10.1016/j.jpain.2012.10.008
62. Peng W, Tang D. Pain related cortical oscillations: methodological advances and potential applications. Front Comput Neurosci. 2016;10:9. doi:10.3389/fncom.2016.00009
63. Klimesch W, Sauseng P, Hanslmayr S. EEG alpha oscillations: the inhibition-timing hypothesis. Brain Res Rev. 2007;53(1):63–88. doi:10.1016/j.brainresrev.2006.06.003
64. Salimpoor VN, Zald DH, Zatorre RJ, Dagher A, McIntosh AR. Predictions and the brain: how musical sounds become rewarding. Trends Cogn Sci. 2015;19(2):86–91. doi:10.1016/j.tics.2014.12.001
65. Blood AJ, Zatorre RJ. Intensely pleasurable responses to music correlate with activity in brain regions implicated in reward and emotion. Proc Natl Acad Sci U S A. 2001;98(20):11818–11823. doi:10.1073/pnas.191355898
66. Zatorre RJ. Musical pleasure and reward: mechanisms and dysfunction. Ann N Y Acad Sci. 2015;1337:202–211. doi:10.1111/nyas.12677
67. Apkarian AV, Hashmi JA, Baliki MN. Pain and the brain: specificity and plasticity of the brain in clinical chronic pain. Pain. 2011;152(3 Suppl):S49–S64. doi:10.1016/j.pain.2010.11.010
 © 2019 The Author(s). This work is published and licensed by Dove Medical Press Limited. The
full terms of this license are available at https://www.dovepress.com/terms
and incorporate the Creative Commons Attribution
- Non Commercial (unported, 3.0) License.
By accessing the work you hereby accept the Terms. Non-commercial uses of the work are permitted
without any further permission from Dove Medical Press Limited, provided the work is properly
attributed. For permission for commercial use of this work, please see paragraphs 4.2 and 5 of our Terms.
© 2019 The Author(s). This work is published and licensed by Dove Medical Press Limited. The
full terms of this license are available at https://www.dovepress.com/terms
and incorporate the Creative Commons Attribution
- Non Commercial (unported, 3.0) License.
By accessing the work you hereby accept the Terms. Non-commercial uses of the work are permitted
without any further permission from Dove Medical Press Limited, provided the work is properly
attributed. For permission for commercial use of this work, please see paragraphs 4.2 and 5 of our Terms.