
Back to Journals » International Journal of General Medicine » Volume 18
Muscle Fat Infiltration in Patients with Multiple Myeloma: A Case–Control Study
Authors Zhu T, Zhou H, Zhang D  , Chen X, Lu X
Received 23 June 2025
Accepted for publication 2 October 2025
Published 15 October 2025 Volume 2025:18 Pages 6255—6264
DOI https://doi.org/10.2147/IJGM.S549030
Checked for plagiarism Yes
Review by Single anonymous peer review
Peer reviewer comments 2
Editor who approved publication: Dr Woon-Man Kung
Tianshu Zhu,1,* Hao Zhou,2,* Dingzhe Zhang,2 Xiao Chen,2 Xuzhang Lu1
1Department of Hematology, the Second People’s Hospital of Changzhou, the Third Affiliated Hospital of Nanjing Medical University, Changzhou, People’s Republic of China; 2Department of Radiology, Affiliated Hospital of Nanjing University of Chinese Medicine, Nanjing, People’s Republic of China
*These authors contributed equally to this work
Correspondence: Xiao Chen, Department of Radiology, Affiliated Hospital of Nanjing University of Chinese Medicine, Nanjing, 210029, People’s Republic of China, Email [email protected] Xuzhang Lu, Department of Hematology, the Second People’s Hospital of Changzhou, the Third Affiliated Hospital of Nanjing Medical University, Changzhou, People’s Republic of China, Email [email protected]
Background: Sarcopenia in patients with hematologic malignancies has gained attention. However, muscle fat infiltration in patients with multiple myeloma (MM) has not been well studied. In this study, we showed the prevalence of computed tomography (CT)-based muscle fat infiltration in newly diagnosed MM patients.
Methods: A total of 966 participants, 138 MM patients and 828 controls, who underwent CT examinations were involved in this study. Clinical parameters, such as participants’ age, sex, weight, height and laboratory test results, such as serum lipids, liver and renal function, were collected. The CT radiation attenuation of the bilateral erector spinae (ESRA) muscles and cross-sectional axial skeletal muscle (SMRA) at the medium level of the T11 vertebra were measured on axial CT images. Logistic regression analyses were performed to assess the association between MM and the risk of low muscle CT attenuation. Receiver operating characteristic curve was used to show the performance of muscle CT attenuation in identifying MM.
Results: Muscle CT attenuation in the MM group was significantly lower than in controls (p < 0.001). The prevalence of low muscle CT attenuation in MM patients was significantly higher than those in controls (66.7% vs 19.6%; 60.1% vs 20.4%, p < 0.001). MM was significantly associated with the risk of low ESRA (< 36 HU) (odds ratio (OR) = 15.11, 95% confidence interval (CI): 7.76– 29.39) and SMRA (< 34 HU) (OR = 12.00, 95% CI: 5.91– 24.39) in the fully adjusted models. Subgroup analyses in men and women both showed similar results with the overall population. The area under the curve was 0.827 for ESRA and 0.790 for SMRA in identifying MM patients.
Conclusion: Muscle fat infiltration is common in patients with MM. MM is significantly associated with the risk of muscle fat infiltration.
Keywords: multiple myeloma, muscle fat infiltration, muscle CT attenuation
Introduction
Sarcopenia, the loss of muscle mass and strength, is a significant yet often underrecognized complication in cancer patients.1,2 Studies indicate that sarcopenia in patients with hematologic malignancies is associated with poorer lung function,3 more chemotherapy side effects,4 longer hospitalization,5 poor nutrition and inflammation,6 and shorter overall survival.7,8 Early detection through body composition analysis (eg, computed tomography (CT)-based muscle assessment) and targeted interventions-including nutritional support and resistance exercise may mitigate muscle loss and improve clinical outcomes.9 Given the high prevalence and adverse impact of sarcopenia in hematologic cancers, integrating muscle health monitoring into standard oncologic care is essential for optimizing patient prognosis and quality of life.
Multiple myeloma (MM) is a malignant plasma cell disorder characterized by clonal proliferation of plasma cells in the bone marrow, leading to osteolytic bone lesions, anemia, renal dysfunction, and immunodeficiency.10 It accounts for approximately 10% of all hematologic malignancies11 and remains incurable despite advances in therapy.12 The prevalence of sarcopenia in MM patients has been reported. Williams et al showed that sarcopenia, which was defined as ≤80% high-density muscle within the L3 psoas muscle was found in 51% MM patients who underwent autologous hematopoietic cell transplantation.13 Some studies also showed the association between sarcopenia defined by muscle area/height square and survival, treatment toxicity, and functional outcomes in MM patients.7,14–17
Most of previous studies reported the prevalence of sarcopenia defined by muscle area (32.5%-86.8%),13–17 and focused on the association between muscle mass (eg, muscle area) and outcomes in MM patients. Muscle fat infiltration has increasingly become a subject of scientific interest in recent years. Interestingly, two recent studies showed that muscle radiodensity, rather than muscle area or muscle mass, was associated with overall survival in MM patients.18,19 However, to our knowledge, only one study in Germany reported the prevalence of low muscle density or muscle fat infiltration in MM patients (51%).19 Its prevalence in Asian countries is unknown. In addition, MM patients are often older, which is also a critical factor of sarcopenia or muscle fat infiltration. It is also unclear whether MM patients had a higher risk of muscle fat infiltration than control subjects. Muscle radiodensity remains under investigation in patients with hematologic malignancies. Therefore, in this case–control study, we reported the prevalence of computed tomography-based muscle fat infiltration in MM patients and investigated whether MM was related to higher risk of muscle fat infiltration compared to controls.
Materials and Methods
Study Population
Participants with pathologically confirmed newly diagnosed MMs who were treated at our institution between 2019 and 2021 and underwent computed tomography (CT) were included. MM was diagnosed according to the criteria of the International Myeloma Working Group (IMWG). Age- and sex-matched controls (1:6) were randomly selected from non-multiple myeloma adults (n = 1386) who underwent thoracic/abdominal CT scans including the T11 vertebra using Propensity Score Matching (exact matching with a tolerance level of 0.02 and without replacement). Patients with other type of cancer, cachexia or other hematologic diseases were excluded. The flowchart for the inclusion of participants is shown in Figure 1. Ethics approval was obtained from the Affiliated Hospital of Nanjing University of Chinese Medicine. The study was performed in accordance with the Declaration of Helsinki. The need for informed consent to participate was waived by the Ethics Committee of the Affiliated Hospital of Nanjing University of Chinese Medicine because of the retrospective nature of the study. All patient data were anonymized to maintain confidentiality throughout the research.
 |
Figure 1 The flowchart for the inclusion of multiple myeloma (MM) patients and control subjects. |
General Characteristics of the Participants and Definitions
The clinical, laboratory, and CT features of all the participants were collected. All of these data were retrospectively analyzed and retrieved from our institution’s electronic medical records and picture archiving and communication system (PACS). Clinical parameters such as participants’ age, sex, weight, height and body mass index (BMI) were collected. Laboratory information including the levels of serum alanine aminotransferase (ALT), albumin, creatinine, blood glucose, high-density lipoprotein cholesterol (HDL-c), low-density lipoprotein cholesterol (LDL-c), total cholesterol (TC) and triglyceride (TG) were obtained. Besides, the history of diabetes mellitus (DM) and chronic kidney disease (CKD) were also recorded. The definition of DM was based on the following situations: fasting plasma glucose levels on two separate occasions equal to or greater than 7.0 mmol/L or a prior medical history of DM. CKD was defined by a reduced glomerular filtration rate (GFR) less than 60 mL/min/1.73 m² for over three months.
CT Features of the Participants
Non-contrast CT imaging was performed on a 256-slice clinically used CT scanner (iCT256, Philips, Hamburg, Germany). The CT imaging parameters were as follows: 120kVp, 50–80 mAs, collimation of 64 × 0.6 mm and pitch of 0.8. The mean CT radiation attenuation of bilateral erector spinae (ESRA) muscles and cross-sectional axial skeletal muscle (SMRA) at the medium level of the T11 vertebra were measured on axial CT images using ImageJ software. The identification criteria for CT images of skeletal muscle were −29 to +150 Hounsfield Units (HU) (Figure 2) as proposed in similar studies [20,21]. Muscle fat infiltration presence was defined using two separate metrics (1) T11 ESRA < 36 HU or (2) T11 SMRA < 34 HU. These cut-off points were chosen based on the lowest quartile of ESRA or SMRA of overall participants.
 |
Figure 2 Illustrations of the measurements of computed tomography attenuation for bilateral erector spinae muscles (A) and cross-sectional axial skeletal muscle (B) at the medium level of the T11 vertebra. |
Statistical Analysis
The data obtained in this study were statistically analyzed via the SPSS 24.0 software package. Data for continuous variables were presented as the means ± standard deviations. Nominal variables were reported as count (%). Differences between groups were subsequently compared via independent-sample t tests, Mann‒Whitney U-tests (continuous data), chi-square tests (qualitative data), or Fisher’s exact tests (qualitative data). Multivariable logistic regression analyses were performed to assess the association between MM and the risk of low muscle CT attenuation while adjusting for the selected variables, including age, sex and BMI (model 1), additional adjusting for liver function, renal function, diabetes, albumin (Model 2) and further adjusting for LDL-c, TG and HDL-c (Model 3). Receiver operating characteristic (ROC) curves were used to show the performance of the muscle CT attenuation in identifying MM. The area under the curve (AUC) was compared using Delong test. P values less than 0.05 were considered statistically significant.
Results
Characteristics of the Participants
A total of 966 participants were involved in this study. Table 1 shows their characteristics. The study was composed of 138 MM patients and 828 controls. ALT, creatinine, blood glucose, TG and the prevalence of diabetes or CKD in the MM group were significantly higher than those in controls. (p < 0.001). BMI, HDL-c, LDL-c, ESRA and SMRA in the MM group were significantly lower than those in controls (p < 0.001). In addition, significant differences were observed in weight (p = 0.005), albumin (p = 0.001) and TC (p = 0.012) between MM and controls. Low ESRA was observed in 256 participants (26.50%) and low SMRA was observed in 252 participants (26.08%). The prevalence of low ESRA and SMRA in MM patients were significantly higher than those in controls (66.7% vs 19.6%; 60.1% vs 20.4%, p < 0.001). No significant differences were observed in age, sex and height between MM and controls.
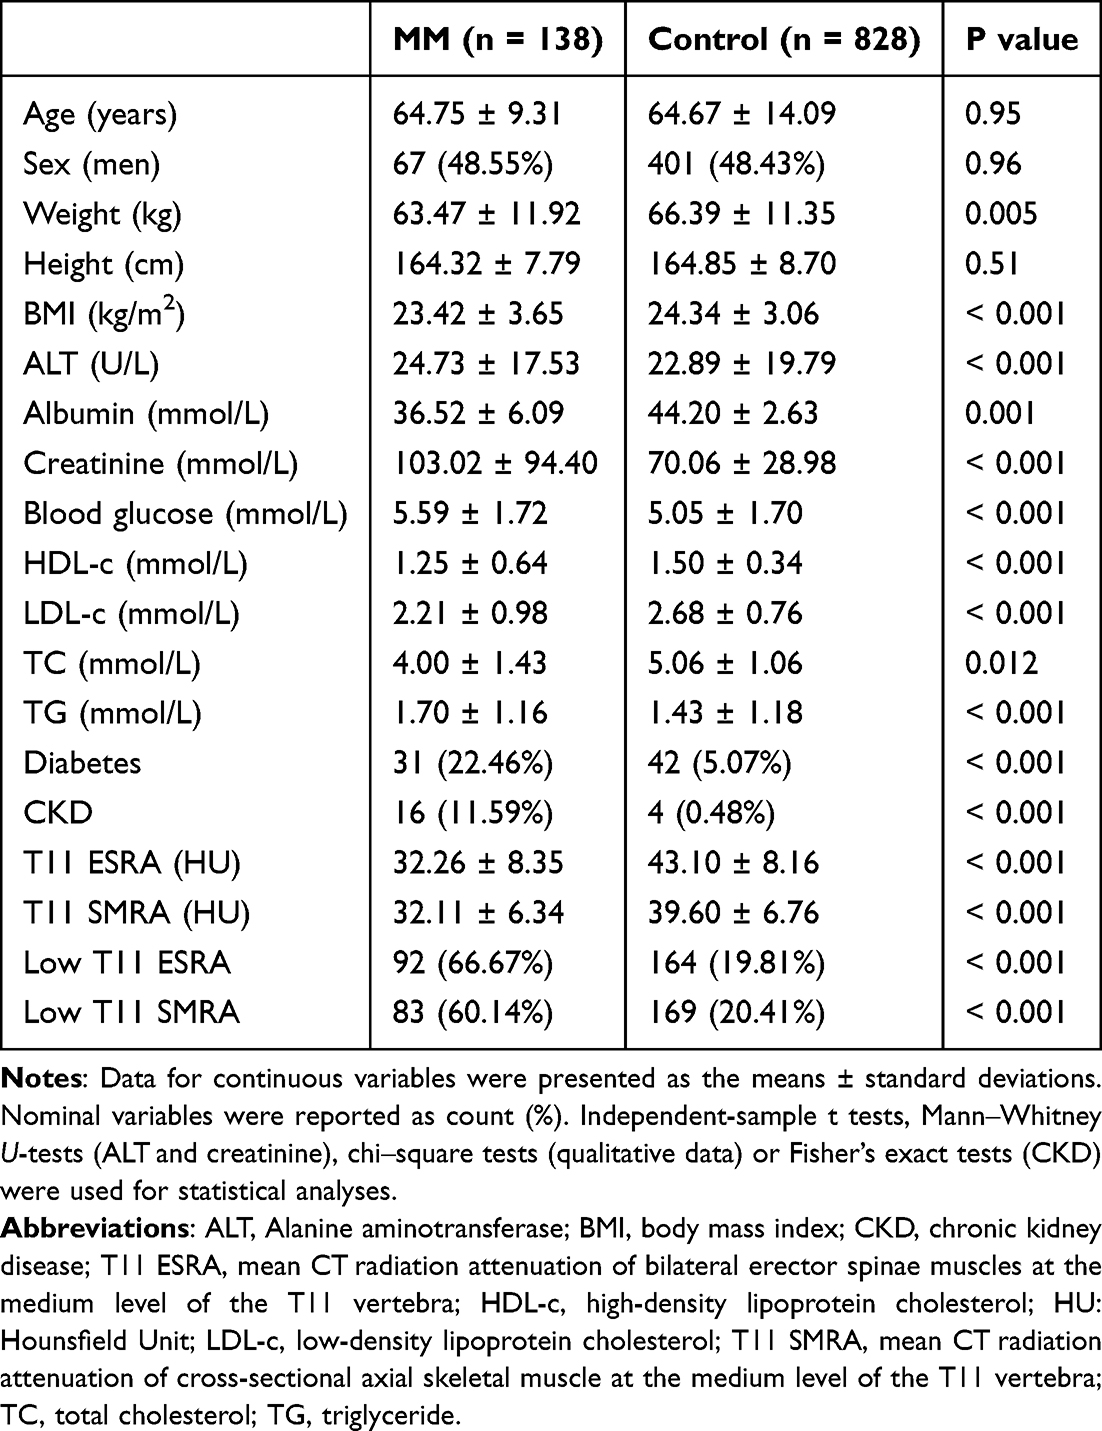 |
Table 1 Characteristics of the Subjects |
Muscle CT Attenuation Divided by Sex and Age Groups
Subsequently, we showed muscle CT attenuation in MM and control groups divided by sex (Figure 3) and age groups (40–60, 60–70, >70 years) (Figure 4). Figure 3 showed ESRA and SMRA in men and women in the MM and control groups. Muscle attenuation was significantly lower in MM group than in control group both in men and women (p < 0.001). Muscle CT attenuation all decreased with age in both MM and control groups (Figure 4). The muscle attenuation values in the MM group were lower than those in the control group across all age categories (all p < 0.001).
 |
Figure 3 Mean muscle computed tomography attenuation between multiple myeloma (MM) patients and control in men (A) and women (B). T11 ESRA: mean CT radiation attenuation of bilateral erector spinae muscles at the medium level of the T11 vertebra; T11 SMRA: mean CT radiation attenuation of cross-sectional axial skeletal muscle at the medium level of the T11 vertebra. |
 |
Figure 4 Muscle computed tomography attenuation between multiple myeloma (MM) patients and control in different age groups. (A) mean computed tomography (CT) radiation attenuation of bilateral erector spinae muscles at the medium level of the T11 vertebra (T11 ESRA); (B) mean CT radiation attenuation of cross-sectional axial skeletal muscle at the medium level of the T11 vertebra (T11 SMRA). * p < 0.001. |
The Association Between MM and the Risk of Low Muscle Attenuation
Table 2 showed the associations between MM and the risk of low muscle attenuation by using logistic regression analysis. MM was significantly associated with the risk of low ESRA (odds ratio (OR) = 14.94, 95% confidence interval (CI): 9.33–23.91; OR = 11.39, 95% CI: 6.16–21.08; OR = 15.11, 95% CI: 7.76–29.39) and low SMRA (OR = 17.64, 95% CI: 10.41–29.89; OR =11.80, 95% CI: 5.99–23.25; OR = 12.00, 95% CI: 5.91–24.39) in all three models (model 1: age, sex and BMI; model 2: additional adjusting for liver function, renal function, diabetes, albumin; model 3: further adjusted for low-density lipoprotein cholesterol, triglyceride and high-density lipoprotein cholesterol). Age, BMI and sex were also significantly associated with the risk of low SMRA in these three models (p < 0.001). Similar results were observed in subjects with low ESRA except BMI (OR = 1.03, 95% CI: 0.98–1.10; OR = 1.04, 95% CI: 0.98–1.10; OR = 1.05, 95% CI: 0.99–1.11).
 |
Table 2 Multivariable Logistic Regression Shown the Association Between MM and the Risk of Low Muscle Attenuation |
Subgroup Analyses
We investigated whether sex affected the association between the MM and the risk of low muscle attenuation by subgroup analyses (Table 3). Significant associations were found between the MM and the risk of low ESRA in men (OR = 20.65, 95% CI: 10.14–42.06; OR = 10.07, 95% CI: 3.87–26.16; OR = 12.18, 95% CI: 4.24–35.00) and women (OR = 10.85, 95% CI: 5.79–20.32; OR = 14.03, 95% CI: 6.12–32.17; OR = 19.16, 95% CI: 7.77–47.29) in the three models. Similarly, the MM was significantly associated with the risk of low SMRA in these three models (p < 0.001).
 |
Table 3 Subgroup Analyses to Show the Association Between the MM and the Risk of Low Muscle Attenuation Divided by Sex Using Multivariable Logistic Regression |
Role of Muscle CT Attenuation in Identifying MM
As shown in Figure 5, ROC curves were plotted to investigate the performance of the muscle CT attenuation in identifying MM. The results showed that the AUC was 0.827 for ESRA and 0.790 for SMRA. ESRA had a better performance than SMRA (p < 0.01).
 |
Figure 5 Receiver operating characteristic (ROC) curve demonstrated the performance of the muscle computed tomography (CT) attenuation in identifying multiple myeloma. Area under the curve was 0.827 for mean CT radiation attenuation of bilateral erector spinae muscles at the medium level of the T11 vertebra (T11 ESRA) and 0.790 for CT radiation attenuation of cross-sectional axial skeletal muscle at the medium level of the T11 vertebra (T11 SMRA). |
Discussion
Musculoskeletal degeneration has been widely reported in various clinical diseases. The evaluation of skeletal muscle mass in patients with malignant tumors has garnered increasing attention in particular.20,21 Sarcopenia, defining as a progressive loss of skeletal muscle mass, strength, and function, is fairly prevalent in many tumor patients, including MM.22–24 However, due to the inconsistent findings on the impact of sarcopenia in MM, we employed muscle fat infiltration as a vehicle to asses musculoskeletal degeneration.14,15 In the present study, we investigated the association between Muscle fat infiltration and MM by measuring the muscle attenuation on CT images and explored whether muscle density can serve as a risk factor for MM and comparing with the clinical and laboratory indicators. Our results showed that MM patients tended to have a lower muscle CT attenuation than that in control groups. The prevalence of low muscle CT attenuation was higher in MM patients than that in controls. Furthermore, our findings also indicated that MM was significantly associated with the risk of low muscle CT attenuation. A decrease in muscle CT attenuation had a acceptable performance in identifying MM.
Patients with tumor burden usually had a bad nutritional status and physical activity, leading to decreased muscle mass. Interestingly, muscle fat infiltration has emerged as a more precise indicator for assessing body composition in MM patients by measuring skeletal muscle radiodensity.24,25 Muscle fat infiltration reflects fat accumulation within muscle tissue, reducing muscle quality and function.25 It may be more sensitive than muscle mass or skeletal muscle area in identifying muscle degradation.26 Although the prevalence of sarcopenia in hematologic malignancies is well documented,1 how MM contributes to muscle fat infiltration is not fully understood. Potential mechanisms include the secretion of inflammatory factors by MM tumor cells, which may disrupt muscle protein synthesis and promote intramuscular fat accumulation.27
Studies showed that sarcopenia played an important role in the prognosis of cancer patients.8 However, the relationship between muscle fat infiltration and hematologic malignancies remains unclear. A recent study found that over half of MM patients had low muscle radiodensity.19 Interestingly, with the progression of the tumor, muscle radiodensity decreased significantly which led to a poorer survival.19 Our study conducted a similar result of the prevalence of muscle fat infiltration in MM patients. Additionally, we discussed the cause of muscle fat infiltration between groups adjusted by patients’ age because an advanced age may also lead to muscle degradation. Our results showed that a decreasing muscle CT attenuation was more commonly seen in elder participants. The reason might be that elders often experienced reduced muscle mass due to factors such as decreased protein synthesis capacity, inadequate protein intake, reduced physical activity or mobility, weakened neuromuscular regulation, and abnormal conditions like diabetes.28,29 Although muscle CT attenuation decreased with age in both groups, MM patients had lower values than controls across all age categories.
Consistent with previous reports, we found that the prevalence of diabetes and renal dysfunction in MM patients was significantly higher than those in control. Renal dysfunction has been regarded as one of the critical clinical features of MM.10,11 An association between diabetes and haematological malignancies or MM has also been reported.30–32 Moreover, our results showed that muscle CT attenuation has good performance in distinguishing MM from controls with AUC values between 0.79 and 0.83. Our data indicated that muscle CT attenuation may play some roles in MM diagnosis.
This study has several advantages. Our study may be the first one to report the prevalence and association between muscle fat infiltration and MM in China. This study also evaluated the impact of muscle fat infiltration in different age and sex group for the first time. However, there are several limitations in our study. First, the sample size is relatively small, particularly for MM patients. Second, although we considered some confounders, diet, physical exercise and alcohol habits were not controlled. Third, muscle fat infiltration was assessed by CT rather than magnetic resonance imaging (MRI), which is considered the good standard method for fat quantification. Furthermore, the relationship between muscle fat infiltration and MM prognosis requires further investigation. Our study is a retrospective study. We did not have the data of prognosis. Further investigations are needed to evaluate the prognostic value of muscle fat infiltration in MM patients.
Conclusions
In summary, our study revealed that muscle fat infiltration was more common in MM patients compared with control group. MM was significantly associated with the high risk of muscle fat infiltration. Muscle fat infiltration has acceptable performance in identifying MM. Muscle fat infiltration may be a useful marker for MM management.
Data Sharing Statement
All the data generated or analyzed and methods during this study are available from the corresponding author (Xiao Chen) upon reasonable request.
Ethical Approval and Consent to Participate
Ethics approval was obtained from the Affiliated Hospital of Nanjing University of Chinese Medicine. The study was performed in accordance with the Declaration of Helsinki. The need for informed consent to participate was waived by the Ethics Committee of the Affiliated Hospital of Nanjing University of Chinese Medicine because of the retrospective nature of the study.
Author Contributions
All authors made a significant contribution to the work reported, whether that is in the conception, study design, execution, acquisition of data, analysis and interpretation, or in all these areas; took part in drafting, revising or critically reviewing the article; gave final approval of the version to be published; have agreed on the journal to which the article has been submitted; and agree to be accountable for all aspects of the work.
Funding
This study was funded by Changzhou Sci&Tech Program (CJ20243020).
Disclosure
The authors report no conflicts of interest in this work.
References
1. Go S-I, Kang MH, Kim H-G. Sarcopenia in terminally Ill patients with cancer: clinical implications, diagnostic challenges, and management strategies. J Hospice Palliative Care. 2025;28(1):10–17. doi:10.14475/jhpc.2025.28.1.10
2. Zhang F-M, Song C-H, Guo Z-Q, et al. Sarcopenia prevalence in patients with cancer and association with adverse prognosis: a nationwide survey on common cancers. Nutrition. 2023;114:112107. doi:10.1016/j.nut.2023.112107
3. Mishra A, Bigam KD, Extermann M, et al. Sarcopenia and low muscle radiodensity associate with impaired FEV 1 in allogeneic haematopoietic stem cell transplant recipients. J Cachexia Sarcopenia Muscle. 2020;11(6):1570–1579. doi:10.1002/jcsm.12604
4. Go S-I, Park MJ, Song H-N, et al. Prognostic impact of sarcopenia in patients with diffuse large B-cell lymphoma treated with rituximab plus cyclophosphamide, doxorubicin, vincristine, and prednisone. J Cachexia Sarcopenia Muscle. 2016;7(5):567–576. doi:10.1002/jcsm.12115
5. Armenian SH, Xiao M, Berano Teh J, et al. Impact of sarcopenia on adverse outcomes after allogeneic hematopoietic cell transplantation. J Natl Cancer Inst. 2019;111(8):837–844. doi:10.1093/jnci/djy231
6. Pénichoux J, Lanic H, Thill C, et al. Prognostic relevance of sarcopenia, geriatric, and nutritional assessments in older patients with diffuse large B-cell lymphoma: results of a multicentric prospective cohort study. Ann Hematol. 2023;102(7):1811–1823. doi:10.1007/s00277-023-05200-x
7. Surov A, Wienke A. Sarcopenia predicts overall survival in patients with malignant hematological diseases: a meta-analysis. Clin Nutr. 2021;40(3):1155–1160. doi:10.1016/j.clnu.2020.07.023
8. Zeng X, Zhang L, Zhang Y, et al. Prevalence and prognostic value of baseline sarcopenia in hematologic malignancies: a systematic review. Front Oncol. 2023;13:1308544. doi:10.3389/fonc.2023.1308544
9. Dreyling E, Räder J, Möller M-D, et al. A randomized controlled ‘real-fitness’ trial to evaluate physical activity in patients with newly diagnosed multiple myeloma. J Cachexia Sarcopenia Muscle. 2025;16(2):e13793. doi:10.1002/jcsm.13793
10. Rajkumar SV. Multiple myeloma: 2024 update on diagnosis, risk-stratification, and management. Am J Hematol. 2024;99(9):1802–1824. doi:10.1002/ajh.27422
11. Kyle RA, Rajkumar SV. Multiple myeloma. Blood. 2008;111(6):2962–2972. doi:10.1182/blood-2007-10-078022
12. Shah UA, Mailankody S. Emerging immunotherapies in multiple myeloma. BMJ. 2020;370:m3176. doi:10.1136/bmj.m3176
13. Williams A, Baruah D, Patel J, et al. Prevalence and significance of sarcopenia in multiple myeloma patients undergoing autologous hematopoietic cell transplantation. Bone Marrow Transplant. 2021;56(1):225–231. doi:10.1038/s41409-020-01008-9
14. Nandakumar B, Baffour F, Abdallah NH, et al. Sarcopenia identified by computed tomography imaging using a deep learning-based segmentation approach impacts survival in patients with newly diagnosed multiple myeloma. Cancer. 2023;129(3):385–392. doi:10.1002/cncr.34545
15. Annibali O, Altomare A, Tomarchio V, et al. Sarcopenia does not impact the outcome of patients with multiple myeloma consolidated with autologous hematopoietic stem cell transplantation. Chemotherapy. 2024;69(3):133–140. doi:10.1159/000535692
16. Barajas Ordonez F, Wolleschak D, Zeller Y, et al. Parameters of body composition do not predict survival in patients with multiple myeloma undergoing autologous stem cell transplantation. Leuk Lymphoma. 2024;65(6):825–832. doi:10.1080/10428194.2024.2319226
17. Surov A, Benkert F, Pönisch W, Meyer H-J. CT-defined body composition as a prognostic factor in multiple myeloma. Hematology. 2023;28(1):2191075. doi:10.1080/16078454.2023.2191075
18. Abdallah NH, Nagayama H, Takahashi N, et al. Muscle and fat composition in patients with newly diagnosed multiple myeloma. Blood Cancer J. 2023;13(1):185. doi:10.1038/s41408-023-00934-3
19. Diallo TD, Blessing AIL, Ihorst G, et al. Myosteatosis in multiple myeloma: a key determinant of survival beyond sarcopenia. Skeletal Radiol. 2024;54(2):275–285.
20. Hemke R, Buckless C, Torriani M. Quantitative imaging of body composition. Seminar Musculosk Radiol. 2020;24(4):375–385. doi:10.1055/s-0040-1708824
21. Jang MK, Park C, Hong S, Li H, Rhee E, Doorenbos AZ. Skeletal muscle mass change during chemotherapy: a systematic review and meta-analysis. Anticancer Res. 2020;40(5):2409–2418. doi:10.21873/anticanres.14210
22. Cruz-Jentoft AJ, Bahat G, Bauer J, et al. Sarcopenia: revised European consensus on definition and diagnosis. Age Ageing. 2019;48(1):16–31. doi:10.1093/ageing/afy169
23. Jogiat UM, Bédard ELR, Sasewich H, et al. Sarcopenia reduces overall survival in unresectable oesophageal cancer: a systematic review and meta-analysis. J Cachexia Sarcopenia Muscle. 2022;13(6):2630–2636. doi:10.1002/jcsm.13082
24. Yuan S, Larsson SC. Epidemiology of sarcopenia: prevalence, risk factors, and consequences. Metabolism. 2023;144:155533. doi:10.1016/j.metabol.2023.155533
25. Aleixo GFP, Shachar SS, Nyrop KA, Muss HB, Malpica L, Williams GR. Myosteatosis and prognosis in cancer: systematic review and meta-analysis. Crit Rev Oncol Hematol. 2020;145:102839. doi:10.1016/j.critrevonc.2019.102839
26. Wang L, Yin L, Zhao Y, et al. Muscle density, but not size, correlates well with muscle strength and physical performance. J Am Med Dir Assoc. 2021;22(4):751–759.e2. doi:10.1016/j.jamda.2020.06.052
27. Zhu Y, Hu Y, Pan Y, et al. Fatty infiltration in the musculoskeletal system: pathological mechanisms and clinical implications. Front Endocrinol. 2024;15:1406046. doi:10.3389/fendo.2024.1406046
28. Wang C, Bai L. Sarcopenia in the elderly: basic and clinical issues. Geriatr Gerontol Int. 2012;12(3):388–396. doi:10.1111/j.1447-0594.2012.00851.x
29. Gao Q, Hu K, Yan C, et al. Associated factors of sarcopenia in community-dwelling older adults: a systematic review and meta-analysis. Nutrients. 2021;13(12):4291. doi:10.3390/nu13124291
30. Tentolouris A, Ntanasis‐Stathopoulos I, Eleftheriadou I, Malandrakis P, Tzeravini E, Gavriatopoulou M. Diabetes mellitus and multiple myeloma; common features of two distinct entities. Diabetes Metab Res Rev. 2022;38(5):e3535. doi:10.1002/dmrr.3535
31. Shah UA, Moshier E, Derkach A, et al. Prevalence and impact of diabetes on survival of patients with multiple myeloma in different racial groups. Blood Adv. 2024;8(1):236–247. doi:10.1182/bloodadvances.2023010815
32. Gong IY, Cheung MC, Read S, Na Y, Lega IC, Lipscombe LL. Association between diabetes and haematological malignancies: a population-based study. Diabetologia. 2021;64(3):540–551. doi:10.1007/s00125-020-05338-7
 © 2025 The Author(s). This work is published and licensed by Dove Medical Press Limited. The
full terms of this license are available at https://www.dovepress.com/terms
and incorporate the Creative Commons Attribution
- Non Commercial (unported, 4.0) License.
By accessing the work you hereby accept the Terms. Non-commercial uses of the work are permitted
without any further permission from Dove Medical Press Limited, provided the work is properly
attributed. For permission for commercial use of this work, please see paragraphs 4.2 and 5 of our Terms.
© 2025 The Author(s). This work is published and licensed by Dove Medical Press Limited. The
full terms of this license are available at https://www.dovepress.com/terms
and incorporate the Creative Commons Attribution
- Non Commercial (unported, 4.0) License.
By accessing the work you hereby accept the Terms. Non-commercial uses of the work are permitted
without any further permission from Dove Medical Press Limited, provided the work is properly
attributed. For permission for commercial use of this work, please see paragraphs 4.2 and 5 of our Terms.