Back to Journals » Drug Design, Development and Therapy » Volume 8
Multiple-dose pharmacokinetics and pharmacodynamics of evogliptin (DA-1229), a novel dipeptidyl peptidase IV inhibitor, in healthy volunteers
Authors Gu N, Park MK, Kim T, Bahng M, Lim KS, Cho S, Yoon SH, Cho J ![]() , Jang I
, Jang I ![]() , Yu K
, Yu K ![]()
Received 7 April 2014
Accepted for publication 28 May 2014
Published 6 October 2014 Volume 2014:8 Pages 1709—1721
DOI https://doi.org/10.2147/DDDT.S65678
Checked for plagiarism Yes
Review by Single anonymous peer review
Peer reviewer comments 5
Namyi Gu,1,3,* Min Kyu Park,1,4,* Tae-Eun Kim,1,5 Mi Young Bahng,2 Kyoung Soo Lim,1 Sang-Heon Cho,1 Seo Hyun Yoon,1 Joo-Youn Cho,1 In-Jin Jang,1 Kyung-Sang Yu1
1Department of Clinical Pharmacology and Therapeutics, Seoul National University College of Medicine and Hospital, Seoul, Republic of Korea; 2Clinical Development Department, Dong-A ST Co, Ltd, Seoul, Republic of Korea; 3Department of Clinical Pharmacology and Therapeutics, Dongguk University College of Medicine and Ilsan Hospital, Goyang, Gyeonggi-do, Republic of Korea; 4Department of Clinical Pharmacology and Therapeutics, Dong-A University College of Medicine and Hospital, Busan, Republic of Korea; 5Department of Clinical Pharmacology and Therapeutics, Kunkuk University Medical Center, Seoul, Republic of Korea
*These authors contributed equally to this work
Purpose: Evogliptin (DA-1229) is a novel, potent, and selective dipeptidyl peptidase IV (DPP-IV) inhibitor in clinical development for the treatment of type 2 diabetes mellitus. This study aimed to investigate the pharmacokinetic and pharmacodynamic profiles and tolerability of evogliptin after repeated oral administration in healthy subjects.
Patients and methods: A block-randomized, double-blind, placebo-controlled, multiple-dose, dose-escalation study was performed in a total of 30 subjects. Repeated once-daily doses of 5, 10, or 20 mg evogliptin or the same doses of placebo were orally administered to ten subjects in each dosage group for 10 days. Subjects in each group were randomized to receive evogliptin or placebo with a ratio of 8:2. Pharmacokinetics of evogliptin were evaluated, with its concentrations in serial plasma and urine samples collected following the first and last administrations. DPP-IV activity and glucagon-like peptide-1, glucose, and insulin levels were quantified to evaluate evogliptin's pharmacodynamics on the first and last dosing days.
Results: All participants completed the study without any serious or severe adverse event. The evogliptin plasma concentration reached its peak within 4–5 hours and decreased relatively slowly, with a terminal elimination half-life of 33–39 hours. Repeated administration resulted in a 1.4- to 1.5-fold accumulation. Evogliptin's systemic exposure and inhibition of plasma DPP-IV activity increased in a dose-dependent manner. Inhibition of DPP-IV activity >80% was sustained over 24 hours in all evogliptin dose groups and provided an increase in postprandial active glucagon-like peptide-1 levels by 1.5- to 2.4-fold. Postprandial glucose levels in the evogliptin-treated groups were reduced 20%–35% compared to placebo, but were not accompanied by increased insulin levels.
Conclusion: Repeated administration of evogliptin in healthy subjects was well tolerated and exhibited linear pharmacokinetics within the 5–20 mg dose range. A once-daily regimen of 5–20 mg evogliptin effectively inhibited DPP-IV activity.
Keywords: DPP-IV, GLP-1, insulin, glucagon-like peptide-1, glucose
Introduction
The International Diabetes Federation reported that the prevalence of diabetes mellitus (DM) in 2013 was 382 million and will rise to 592 million by 2035.1 Type 2 DM is a chronic progressive disorder with metabolic abnormalities that results from pancreatic β-cell dysfunction and peripheral resistance to insulin. The treatment goal of DM is to keep blood glucose levels within the normal range and to prevent macrovascular or microvascular complications such as coronary heart disease, stroke, kidney disease, amputation, and retinopathy.2 However, maintaining long-term intensive blood glucose control without adverse events (AEs) is challenging in many patients with type 2 DM despite mono- or combination therapy with several classes of antihyperglycemic agents.3
Dipeptidyl peptidase IV (DPP-IV) inhibitors were introduced in the last decade as a novel class of antihyperglycemic agents whose mechanism of action is distinguishable from the other available agents. The agents in this class reduce blood glucose level by inhibiting the DPP-IV enzyme, which is primarily responsible for the rapid degradation of incretin hormones including glucagon-like peptide-1 (GLP-1) and glucose-dependent insulinotropic polypeptide.4 Incretins are gut hormones that are released in response to food intake and that induce the synthesis and release of insulin according to glucose level, thereby reducing blood glucose level after a meal.5,6 In addition, increased incretin levels, particularly of GLP-1, increase β-cell mass, potentiate the induction of small islets, and stimulate islet neogenesis in the pancreas.7
Evogliptin (DA-1229) is a piperazine derivative that is in clinical development as a novel DPP-IV inhibitor for the treatment of type 2 DM (Figure 1).8–11 The DPP-IV inhibition of evogliptin was demonstrated to be reversible, highly potent, and selective in in vitro studies.8 It has the half maximal inhibitory concentration (IC50) value of 0.9 in human plasma for DPP-IV, with a 6,000 times higher potency compared to human DPP-VIII and DPP-IX, as well as with more than 20,000 times greater potency compared to human DPP-I, DPP-II, fibroblast activation protein-alpha (FAPα), antiphagocytic protein 1 (APP1), prolidase, and granzyme B.8,10 The interaction of evogliptin with DPP-IV has been proposed to occur through noncovalent binding, such as with linagliptin.8 Evogliptin improved insulin sensitivity in high fat diet-fed mice, delayed the onset of diabetes in young leptin receptor-deficient db/db mice, and increased β-cell replication and neogenesis in streptozotocin-induced diabetic mice.9 According to in vitro studies, evogliptin is not an inducer of cytochrome P450 (CYP) 3A4 nor an inhibitor of CYP1A2, 2C9, 2C19, 2D6, or 3A4, although its metabolism is primarily mediated by CYP3A4.8 As part of the clinical development of evogliptin, the tolerability and the pharmacokinetic (PK) and pharmacodynamic (PD) properties of single-dose regimens were characterized in healthy volunteers.11 Evogliptin displayed dose-proportional PKs and good tolerability within the dose range of 1.25–60 mg. The DPP-IV inhibition increased in a dose-dependent manner, and remained >80% over 24 hours after a single administration of 10–60 mg evogliptin. The objective of the present study was to assess the PK/PD properties of evogliptin after multiple oral doses in normoglycemic, healthy volunteers. Information from these studies should help to characterize the PK/PD profiles of evogliptin and to define the dosing recommendations to support regulatory submissions.
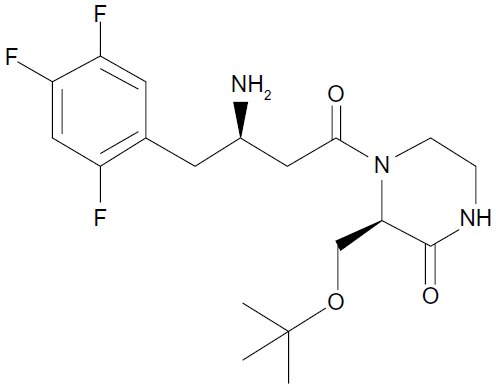 | Figure 1 The chemical structure of evogliptin. |
Materials and methods
The present study was conducted at the Clinical Trials Center of Seoul National University Hospital (SNUH) in Seoul, Republic of Korea. The study was registered in the US National Institutes of Health (ClinicalTrials.gov Identifier: NCT00961025) clinical trials database, and the study protocol was approved by the Institutional Review Board of SNUH. All the study procedures were conducted according to the recommendations of the Declaration of Helsinki on biomedical research involving human subjects.
Subjects
Thirty healthy, Korean, male subjects were enrolled in this study. Subjects with significant medical conditions, such as cardiovascular disease, gastrointestinal disease, hepatic disease, renal disease, respiratory disease, endocrine disease, psychiatric problems, or a history of alcohol and/or drug abuse, were excluded from the study. Furthermore, subjects with family histories of diabetes were also excluded. The subjects were determined to be healthy based on the results of a physical examination, vital signs, 12-lead electrocardiography (ECG), serology, urinary drug screening, and routine clinical laboratory tests (hematology, blood coagulation, clinical chemistry, and urinalysis), which were performed within 21 days prior to the first administration of the study drug. Ingestion of any prescribed medication within 2 weeks or over-the-counter drugs within 1 week before the beginning of the study was also reason for exclusion. The subjects had only the standard meals with fixed calories and composition of nutrients (2,300 kcal/day with 60%–65% carbohydrate, 15% protein, and 20%–25% fat), which were provided by the Clinical Trials Center during the admission period.
Study design
The present study was conducted as a block-randomized, double-blind, placebo-controlled, multiple-dose, dose-escalation study. The study participants were placed into three groups, with ten subjects (including two placebo subjects) per group. Each group was administered 5, 10, or 20 mg of the study drug or the same dose of the placebo once a day for 10 days. The administered doses in this study were determined based on the results of the previously performed single-dose study.11 In the single-dose study, the subjects receiving a single dose of ≥10 mg evogliptin exhibited >80% DPP-IV inhibition for >24 hours. Dose escalation proceeded only after assessment of the safety and tolerability of the previous dose. After fully explaining the study procedures, written informed consent was obtained from all subjects prior to beginning the study. At the baseline visit the day before drug administration, the laboratory test results of the eligible subjects were reevaluated. After overnight fasting, the study drug was administered once daily at 9 am with 240 mL of water for 10 consecutive days except on day 2, on which the study drug was administered at 11 am, because blood was collected to test for active GLP-1, glucose, and insulin levels before and after a morning meal. On days 1 and 10, the subjects fasted for 4 hours after drug administration, and water was allowed 2 hours after drug administration. The subjects who did not exhibit any clinically relevant changes were discharged on day 15, after the scheduled procedures were conducted, and these subjects visited the study center for the post-study visit on days 18, 19, or 20.
Safety and tolerability assessments
A safety assessment was conducted for all subjects who were administered any investigational product. AEs were identified by asking general health-related questions or voluntary reporting by the subjects during the study. To assess the tolerability of evogliptin, a clinical evaluation of vital signs (systolic and diastolic blood pressures, heart rate), physical examinations, clinical laboratory tests (hematology, blood coagulation, clinical chemistry, and urinalysis), and 12-lead ECGs were performed at predefined intervals throughout the study. Computerized impedance cardiography was also performed to monitor the effects of evogliptin on cardiac index, stroke volume, and systemic vascular resistance.
Blood and urine collection
Blood samples (8 mL) were collected to analyze the evogliptin PKs and to assess DPP-IV activity according to the following schedule: pre-dose (0), 0.5, 1, 1.5, 2, 3, 4, 5, 6, 8, 10, 12, and 16 hours after the first administration on day 1; each pre-dose (0 hour) on day 2 to day 9; pre-dose (0 hour) and 0.5, 1, 1.5, 2, 3, 4, 5, 6, 8, 10, 12, 16, 24, 36, 48, 60, 72, 96, and 120 hours after the last administration on day 10. Blood was collected up to 120 hours after the last administration based on the results of a previous single-dose study.11 The collected blood was immediately placed in an ethylenediaminetetraacetic acid (EDTA)-containing tube. Plasma was separated from the samples by centrifugation at 1,600× g for 10 minutes at 4°C, and the plasma was immediately stored at −70°C until analysis.
All voided urine was collected for 24 hours after the first administration and for 120 hours after the last administration with some separated intervals: 0–6 hours, 6–12 hours, 12–24 hours, 24–48 hours, 48–72 hours, 72–96 hours, and 96–120 hours. The urine samples were stored at −70°C until analysis.
The subjects had lunch, dinner, and breakfast at 4, 10, and 24 hours, respectively, after drug administration on day 1 and day 10. Blood samples (8 mL) were collected before each meal (0 hour) and at 0.25, 0.5, 1, and 2 hours after each meal for PD measurements of GLP-1, glucose, and insulin levels.
The blood samples (3 mL) used for GLP-1 measurements were aliquoted into pre-protease inhibitor tubes and were stored in crushed ice and kept in a refrigerator until analysis. To measure serum glucose and insulin levels, additional blood samples were aliquoted into serum-separating tubes for glucose measurement (3 mL) and EDTA tubes for insulin measurement (2 mL).
Quantification of evogliptin concentration in plasma and urine
The concentrations of evogliptin in the plasma and urine were measured by the Department of Clinical Pharmacology and Therapeutics (Seoul National University College of Medicine, Seoul, Republic of Korea) using a validated, high-throughput liquid chromatography/tandem mass spectrometry method with sitagliptin as an internal standard; this method combines online sample extraction with high-turbulence chromatography. The detailed quantification method in this study was the same as that used in the previously published single-dose study of evogliptin.11 Chromatographic separation was conducted on an Onyx Monolithic C18 (Phenomenex Inc., Torrance, CA, USA) and Luna C18 column with a mobile phase consisting of 0.1% formic acid and acetonitrile in distilled water. The intra- and inter-day accuracy for the plasma samples was 104.4%–111.4% and 103.1%–107.3%, respectively. For urine, the intra- and inter-day accuracy was 100.2%–110.1% and 102.4%–106.5%, respectively. The lower limit of quantification in both plasma and urine was 5 ng/mL.
PK analysis
PK parameters were calculated using non-compartmental methods and were assessed using the Phoenix™ WinNonlin® software (v 6.0; Certara, L.P., St Louis, MO, USA). PK analyses were performed using the actual time of blood collection. The maximum plasma concentration of evogliptin (Cmax) and the time to Cmax (Tmax) were estimated directly from the observed values.
The terminal elimination rate constant (λz) was estimated by linear regression of the terminal portion of the log-transformed plasma concentration–time profile, and the half-life (t1/2) was calculated as ln(2) divided by λz. The area under the concentration–time curve (AUC) from the initial dose to the last measurable time point (AUC0–t) or within a dosing interval at the steady state (AUCτ,ss) was calculated using the linear trapezoidal approximation method, and the AUC, which was extrapolated to infinity (AUCinf,ss), was estimated as the sum of AUC0–t and the extrapolated area calculated by the quotient of the concentration at the last observed time point (Clast) and λz. The apparent clearance (CLss/F) was calculated as the dose/AUCτ,ss. The renal clearance (CLR,ss) was calculated as follows:

The accumulation ratio (Rac), with respect to additional parameters in the steady state, was defined as the ratio of AUCτ,ss:AUC0–24h (the AUC of day 1).
SAS® software (v 9.3; SAS Institute Inc., Cary, NC, USA) was used for the statistical analysis, and the level of significance was set at 0.05. The PK parameters were presented as the arithmetic means with standard deviations. Dose proportionality was tested using Cmax,ss and AUCτ,ss with linear regression using log-transformed values (power model).
PD analysis
The relationships between evogliptin concentrations and DPP-IV inhibition were evaluated at each dose. Human plasma DPP-IV activity was measured using the DPP-IV enzyme and the fluorescence substrate Gly-Pro-amino methyl coumarin. DPP-IV activity was measured as the rate of the increase in Gly-Pro-amino methyl coumarin amounts. The inhibition of DPP-IV activity (compared to baseline) was expressed as a percentage decrease using the following equation:

The area under the DPP-IV inhibition–time curve from the time of dosing to the time of the last quantifiable concentration (AUE) was calculated using the linear trapezoidal approximation method. Maximum DPP-IV inhibition (Imax) and the time to reach Imax were estimated directly from the observed values. The time required to inhibit >80% of DPP-IV was expressed graphically. The relationships between the degree of DPP-IV inhibition and the plasma concentrations of evogliptin were evaluated by building a sigmoid Imax model with NONMEM® (v VI; GloboMax™, Hanover, MD, USA).
To evaluate the effects of evogliptin on another PD marker, active GLP-1, serum glucose levels and whole blood insulin levels were measured, and their time-weighted average concentrations were calculated. Active GLP-1 in human plasma was measured using an enzyme-linked immunosorbent assay kit (Linco Research, Inc., St Charles, MO, USA), according to the manufacturer’s specifications. Serum glucose levels were measured using an oxidase enzymatic assay and an automated analyzer (TBA 200FR-1; Toshiba Co, Ltd, Tokyo, Japan), and whole blood insulin levels were measured by immunoradiometric assay, based on coated-tube separation (INS-IRMA Kit; DIAsource ImmunoAssays S.A., Louvain-La-Neuve, Belgium). The AUCs of each PD marker were determined for 2 hours after meals, which were served at 4, 10, and 24 hours after the first and last drug administrations, on day 1 and day 10, respectively. Additionally, we calculated the sum of the AUC for each PD parameter (AUEtotal) and the time-weighted average concentration, which represented the AUC divided by the time.
Results
Subjects
In total, 30 subjects were enrolled and completed the study protocol, and all of the treatments were well tolerated. The subjects were randomly assigned to each dosing group and there were no significant demographic differences. There was no deviation from the protocol-specified procedures during the study and all subjects were included in the safety and tolerability analysis and PK analysis. The mean participant age was 27.5 (range: 23–34) years and the mean weight was 66.3 (58.0–77.1) kg. The mean height was 176.3 (168–181) cm (Table 1).
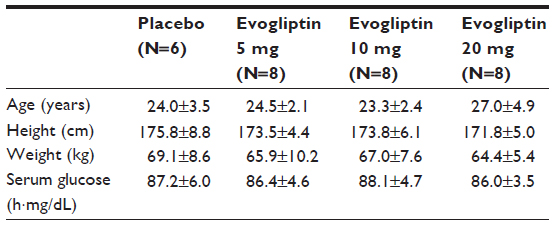 | Table 1 Summary of the baseline characteristics of the population |
Safety and tolerability
During the course of the study, 20 AEs were reported by 12 subjects: one case in a subject (16.7%) who was administered placebos, and 19 cases in eleven subjects (45.8%) who were administered evogliptin (Table 2). The causal relationships between the drug and AEs were judged based on the temporal sequences from the drug administration, the response after discontinuation of the drug, the well-known effects of the study drug or of other drugs in the same class, and explanations from study participants or from other environmental factors. Of the AEs occurring during the study, six were considered to be related to the study drug: fatigue, insomnia, epigastric discomfort, oral mucosa erosion, headache, and high urinary frequency. No serious AEs were reported during the study, and all AEs were mild in severity. All subjects who experienced AEs recovered without concomitant medication or management, except for one subject who was concomitantly medicated with topical policresulen for oral mucosal erosion. No subject discontinued the study due to a clinical adverse experience and no clinically significant changes in the clinical laboratory results, vital signs, computerized impedance cardiography, or ECG were observed.
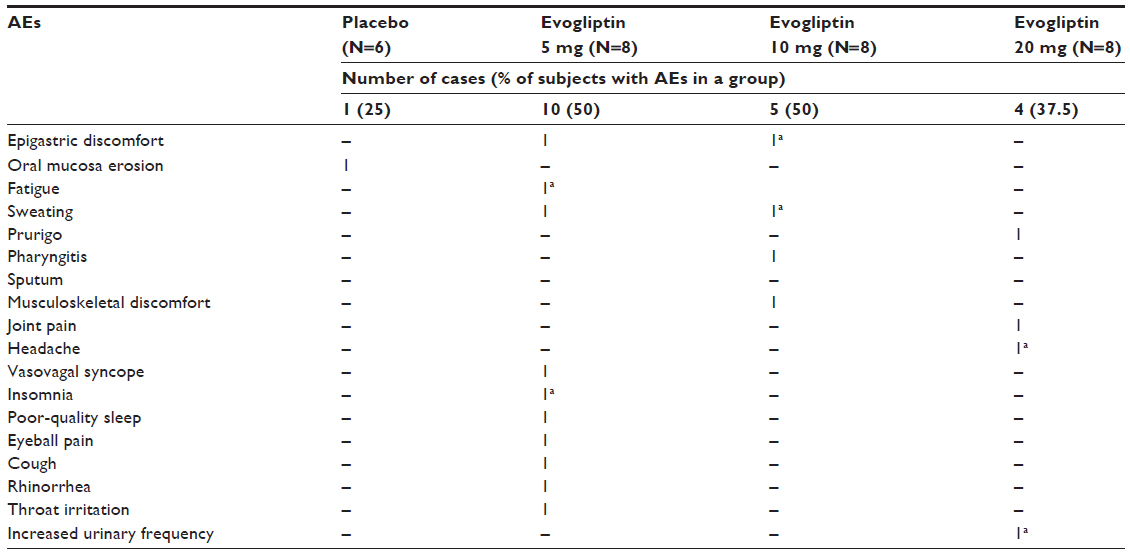 | Table 2 Summary of adverse events (AEs) |
PKs
The PK parameters of evogliptin after the first and last doses are summarized in Table 3. The plasma concentration of evogliptin consistently reached its peak at median Tmax of 4–5 hours after the day 1 and day 10 administrations in all dosage groups (Figure 2). The descending phase was characterized by a relatively steep initial slope within the first 16 hours, followed by a more gradual later slope with a terminal half-life of 33–39 hours. The systemic exposure of evogliptin increased in a dose-dependent manner on days 1 and 10. The 95% confidence intervals of the slopes of the log-transformed Cmax,ss and AUCτ,ss resulted to include the value of 1.0 in power models, suggesting that the dose-proportionality could not be rejected. (0.91–1.33 and 0.78–1.08, respectively). The interindividual variability in systemic exposure of evogliptin was low to moderate, with coefficient of variation (CV%) of <30% and <20% for Cmax,ss and AUCτ,ss, respectively.
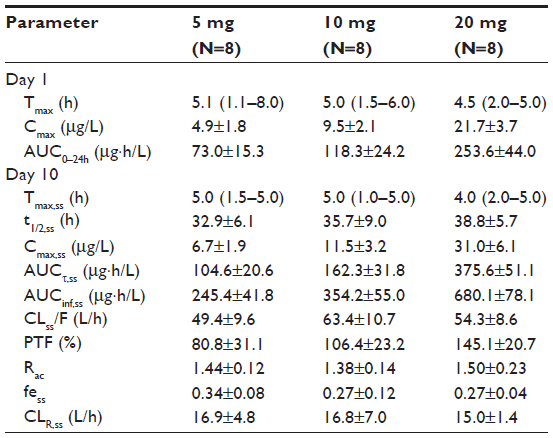 | Table 3 Summary of pharmacokinetic parameters after a single oral dose (day 1) or at the steady state after multiple doses (day 10) of evogliptin 5 mg, 10 mg, or 20 mg |
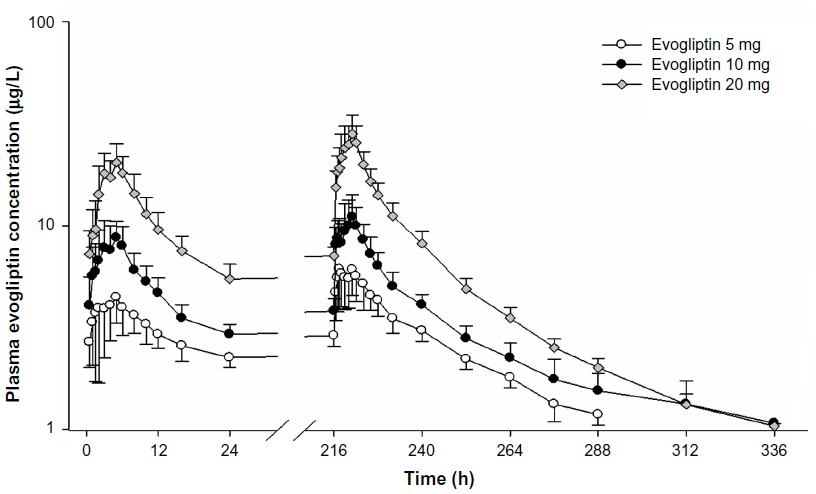 | Figure 2 Mean plasma concentration–time profiles on day 1 and day 10 after multiple doses of evogliptin 5, 10, or 20 mg. |
The steady state was attained within day 3 in all dosage groups. The peak-to-trough ratio at steady state increased in a dose-dependent fashion from 0.81 to 1.45 with an accumulation index of 1.38–1.50. The parameters of disposition at steady state were consistent among all dosage groups; the apparent clearance was 49.4–63.4 L/h, the renal clearance was 15.0–16.8 L/h, and the fraction of urinary excretion was 0.27–0.34.
PDs
Plasma DPP-IV
Plasma DPP-IV inhibition promptly exceeded 80% within 0.5–1 hour and then slowly reached its maximum (Imax,ss) of 91%–96% at 3.5–5.5 hours after the drug administration (Figure 3). On day 10, DPP-IV inhibition >80% was maintained before drug administration in the morning and was sustainably maintained over 80% until 36 hours, 48 hours, and 66 hours after the last administration of 5 mg, 10 mg, and 20 mg evogliptin, respectively. The extent of inhibition increased in a dose-dependent manner (Figure 3). The interindividual variabilities (CV%) of the AUEτ,ss and Imax,ss values were <2% for all evogliptin-treated groups.
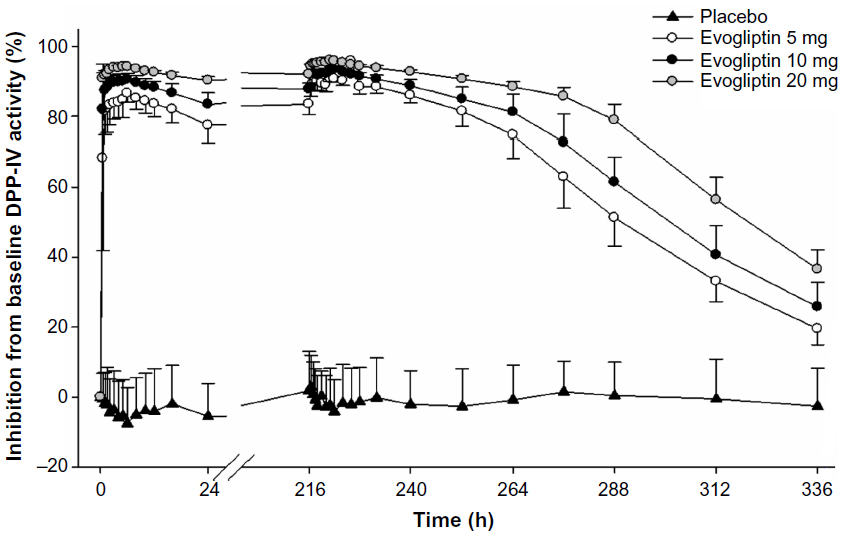 | Figure 3 Mean inhibition percent of dipeptidyl peptidase IV (DPP-IV) activity–time profiles after single or multiple oral administration of evogliptin (5, 10, or 20 mg). |
The relationships of plasma evogliptin concentrations and DPP-IV inhibition after the Tmax of evogliptin nearly overlapped with those before the Tmax of evogliptin (Figure 4). The typical values of Imax and IC50 were 93.2% and 1.28 ng/mL (=2.32 nM), respectively, in the sigmoid Imax model.
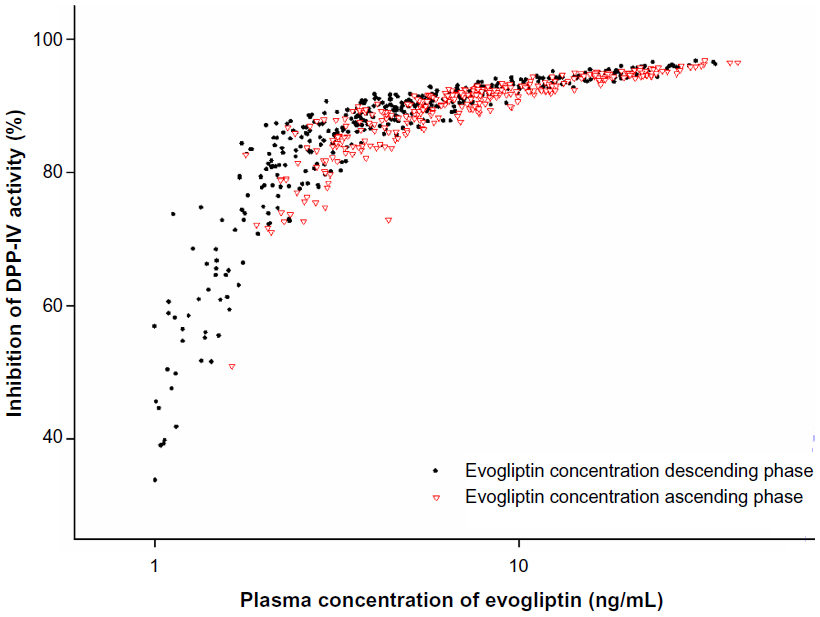 | Figure 4 Relationships between percent inhibition from baseline dipeptidyl peptidase IV (DPP-IV) activity versus plasma evogliptin concentrations. |
Plasma active GLP-1
GLP-1 was released in a biphasic pattern of secretion, showing the first higher peak of plasma active GLP-1 level at 30 minutes and the later smaller peak at 2 hours after a meal (Figure 5A). There was no consistent trend in fasting GLP-1 levels among the treatment groups. Postprandial plasma active GLP-1 concentrations in the evogliptin-treated groups were higher compared to the placebo group. However, the baseline-corrected AUEtotal of GLP-1 among the evogliptin-treated groups was not dose dependent, and was 1.7-, 1.5-, and 2.4-fold greater in the 5 mg, 10 mg, and 20 mg evogliptin groups, respectively, compared to placebo (Table 4). The first peaks of plasma active GLP-1 level were smaller after dinner compared to after lunch or breakfast in all treatment groups including the placebo group. The time-weighted average concentrations of active GLP-1 which were corrected with baseline values after lunch, dinner, and breakfast at steady state were 2.1-, 1.5-, and 2.1-fold higher, respectively, in the evogliptin-treated groups compared to the placebo group.
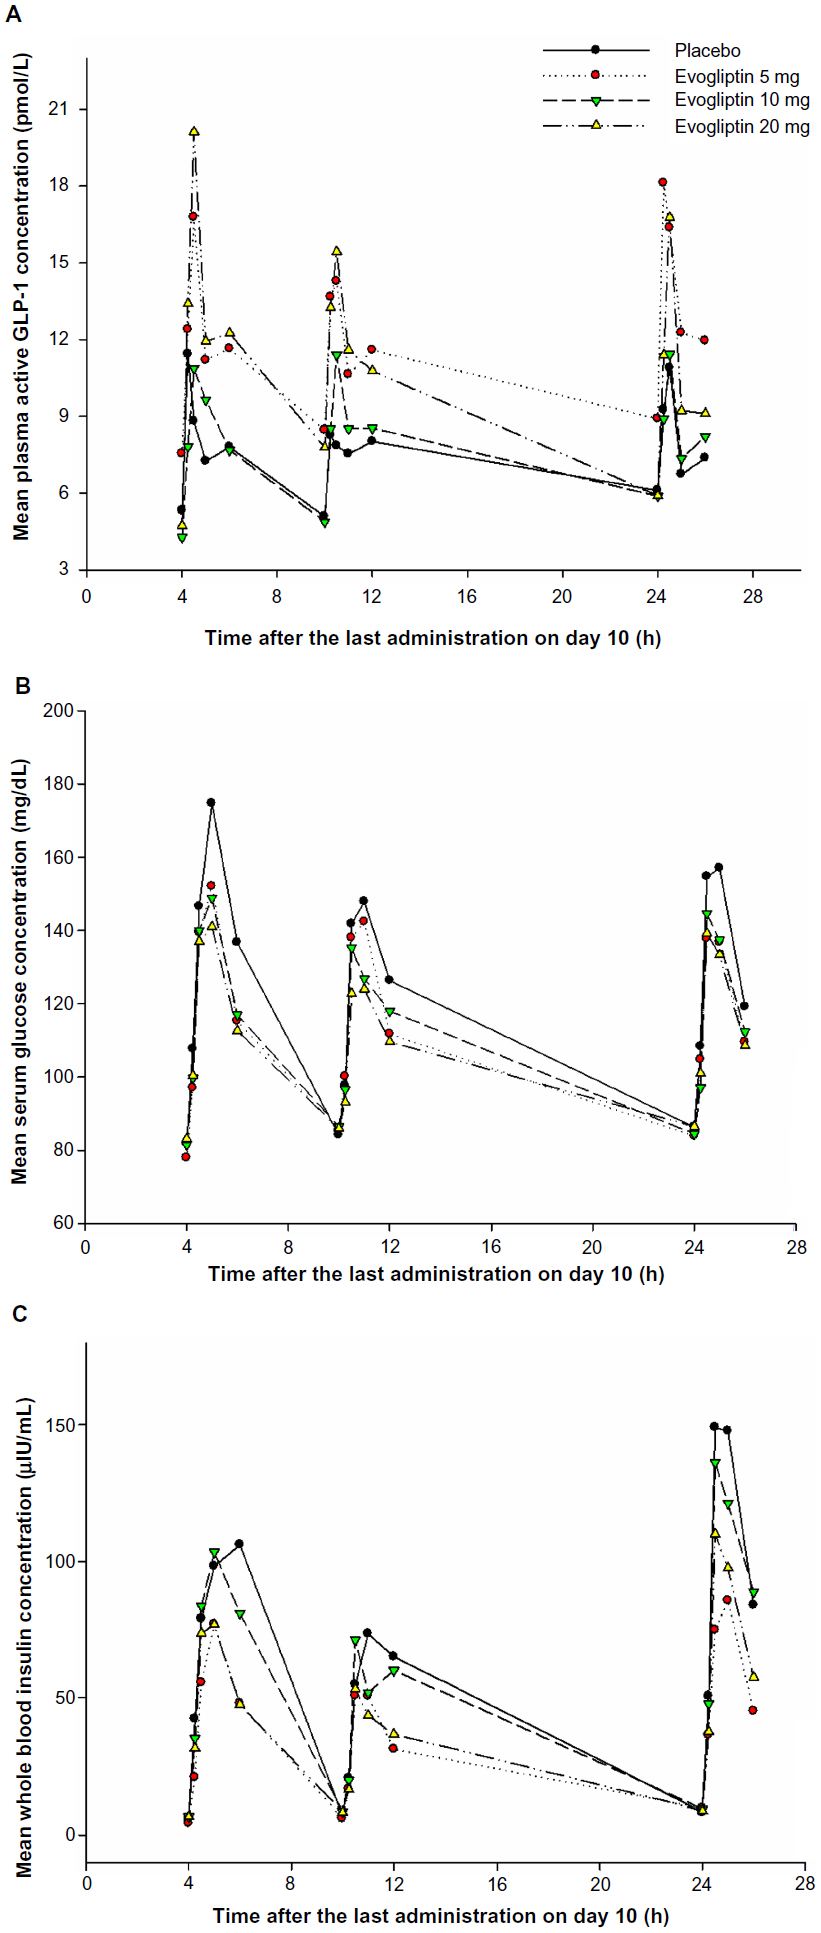 | Figure 5 Mean concentration–time profiles of (A) plasma glucagon-like peptide-1 (GLP-1), (B) serum glucose, and (C) whole blood insulin after multiple doses of placebo or evogliptin (5, 10, or 20 mg). |
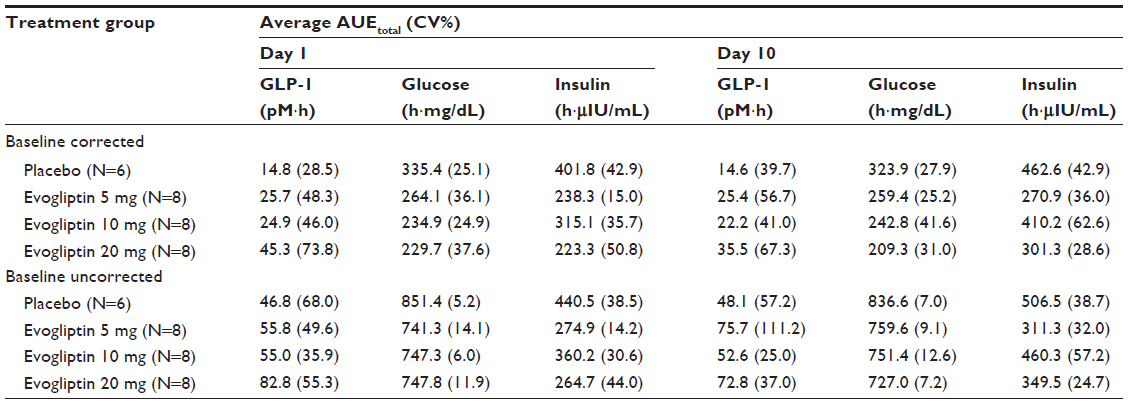 | Table 4 AUEtotal of GLP-1, glucose, and insulin after a single oral dose (day 1) or at the steady state after multiple doses (day 10) of evogliptin 5 mg, 10 mg, or 20 mg |
Serum glucose
Postprandial glucose concentrations peaked at 1 hour after a meal. The increase in glucose concentration tended to be smaller in the evogliptin-treated groups than in the placebo groups (Figure 5B). In addition, the baseline corrected AUEtotal of glucose in the evogliptin-treated groups decreased in a dose-dependent manner and was 20%, 25%, and 35% reduced in the 5 mg, 10 mg, and 20 mg evogliptin groups, respectively, compared to placebo (Table 4). The postprandial glucose levels after dinner were smaller than those after lunch or breakfast in all treatment groups including the placebo group. Evogliptin treatment did not affect the fasting glucose levels.
Whole blood insulin
The time–concentration profile of whole blood insulin was similar to that of serum glucose. Postprandial whole blood insulin concentrations peaked at 1 hour after a meal and were smaller after dinner compared to after lunch or breakfast in all treatment groups including the placebo group. However, postprandial whole blood insulin levels including fasting levels in the evogliptin-treated groups did not differ from those in the placebo group (Figure 5C).
Discussion
Based on the understanding of the critical role of GLP-1 in glucose homeostasis and the pathogenesis of DM, new classes of antihyperglycemic agents that enhance the action of GLP-1, DPP-IV inhibitors, and GLP-1 agonists have been developed. Both incretin-based therapies have several advantages over most classical antidiabetic agents, such as a low risk of hypoglycemia, no weight gain, and improvement in β-cell function.12,13 Compared to GLP-1 receptor agonists, DPP-IV inhibitors are orally available, less expensive, and have better tolerance profiles; cause fewer digestive AEs: and cause neither local reactions nor formation of antibodies, although they are slightly less potent in terms of reductions of HbA1c, appetite, and body weight, with no effect on gastric emptying delay.14–16
Evogliptin shares similar properties with already marketed DPP-IV inhibitors, such as sitagliptin, vildagliptin, saxagliptin, alogliptin, and linagliptin. Evogliptin is a small molecule that is orally available and has demonstrated a similar mode of action in preclinical studies.8,9,11 In healthy volunteers, its systemic exposure and effects on plasma DPP-IV inhibition increased in a dose-dependent manner.11 At steady state with the investigational regimens of this study (once-daily administration of 5–20 mg), plasma DPP-IV inhibition >80% was sustained over 24 hours by evogliptin. This finding supports the rationale for the use of a once-daily regimen of evogliptin.
Evogliptin also exhibits several discriminative aspects in PKs and PDs from other DPP-IV inhibitors. The Tmax of evogliptin was 4–5 hours, which is longer than the Tmax of other DPP-IV inhibitors, of 1–4 hours.17 However, plasma DPP-IV inhibition rapidly surpassed 80% within 0.5–1 hour after administration. Despite its late Tmax, the PDs of evogliptin were not delayed, owing to its high potency to plasma DPP-IV enzyme with relatively low IC50 of 0.9 nM in in vitro study and 2.3 nM in this clinical trial with healthy volunteers; the IC50 of sitagliptin, vildagliptin, saxagliptin, alogliptin, and linagliptin were 19 nM, 62 nM, 50 nM, 24 nM, and 1 nM, respectively in the previous studies.18 The degree of plasma DPP-IV inhibition in this study correlated well with the plasma concentration of evogliptin without hysteresis. This finding was consistent with the binding characteristics of evogliptin, which are competitive and reversible. The terminal elimination half-life (T1/2,ss) of evogliptin of 32.9–38.8 hours is in between that of linagliptin (120 hours) and other DPP-IV inhibitors (2–21 hours).19 The renal clearance and fraction excreted unchanged in urine 15.0–16.8 L/h and 27%–34%, respectively, are comparable to those of vildagliptin and saxagliptin.20,21 Evogliptin reached a steady-state concentration within 3 days and accumulated only a small amount with an accumulation index of 1.38–1.50. The evogliptin regimens that were investigated in this study were comparable to those for saxagliptin and linagliptin (5 mg once daily) in other studies, and with smaller doses than for sitagliptin and vildagliptin (100 mg once daily).17,18
Evogliptin increased the postprandial GLP-1 levels by 1.5- to 2.4-fold and decreased the postprandial glucose levels to 20%–35% compared to placebo in healthy volunteers. The major mechanism of the glucose-lowering effect of GLP-1 is enhanced insulin secretion.22 However, postprandial insulin levels did not increase in this study despite the known insulinotropic effect of GLP-1. Figure 6 presents the temporal relationships for GLP-1 versus glucose, GLP-1 versus insulin, and glucose versus insulin. Counterclockwise hysteresis in Figure 6A and B shows that there was a time delay between GLP-1 on the x-axis and glucose or insulin, respectively, on the y-axis; the changes in GLP-1 level occurred prior to the changes in glucose or insulin levels. In contrast, no definite time delay was observed in the relationship for glucose versus insulin in Figure 6C. This shows that the reciprocal regulation between glucose and insulin occurred in an immediate, intimate, and exquisite manner. Therefore, we suggest that postprandial insulin levels in the evogliptin treatment groups might have been regulated by their lower postprandial glucose levels, which were primarily influenced by the noninsulin-dependent glucose-lowering effects of GLP-1. In this study, insulin levels were more strongly influenced by the insulin-regulatory effect of glucose than by the insulinotropic effects of GLP-1. This glucose-lowering effect of GLP-1, without causing an increase in insulin release, has been previously reported by Flint et al.23 In their study, GLP-1 in physiologic concentrations greatly diminished the rate of entry of nutrients into the circulation by a reduction of gastric emptying rate in obese subjects. Knauf et al reported that GLP-1 increased glucose uptake into muscle even in muscle insulin receptor knock-out mice by signaling in the central nervous system.24
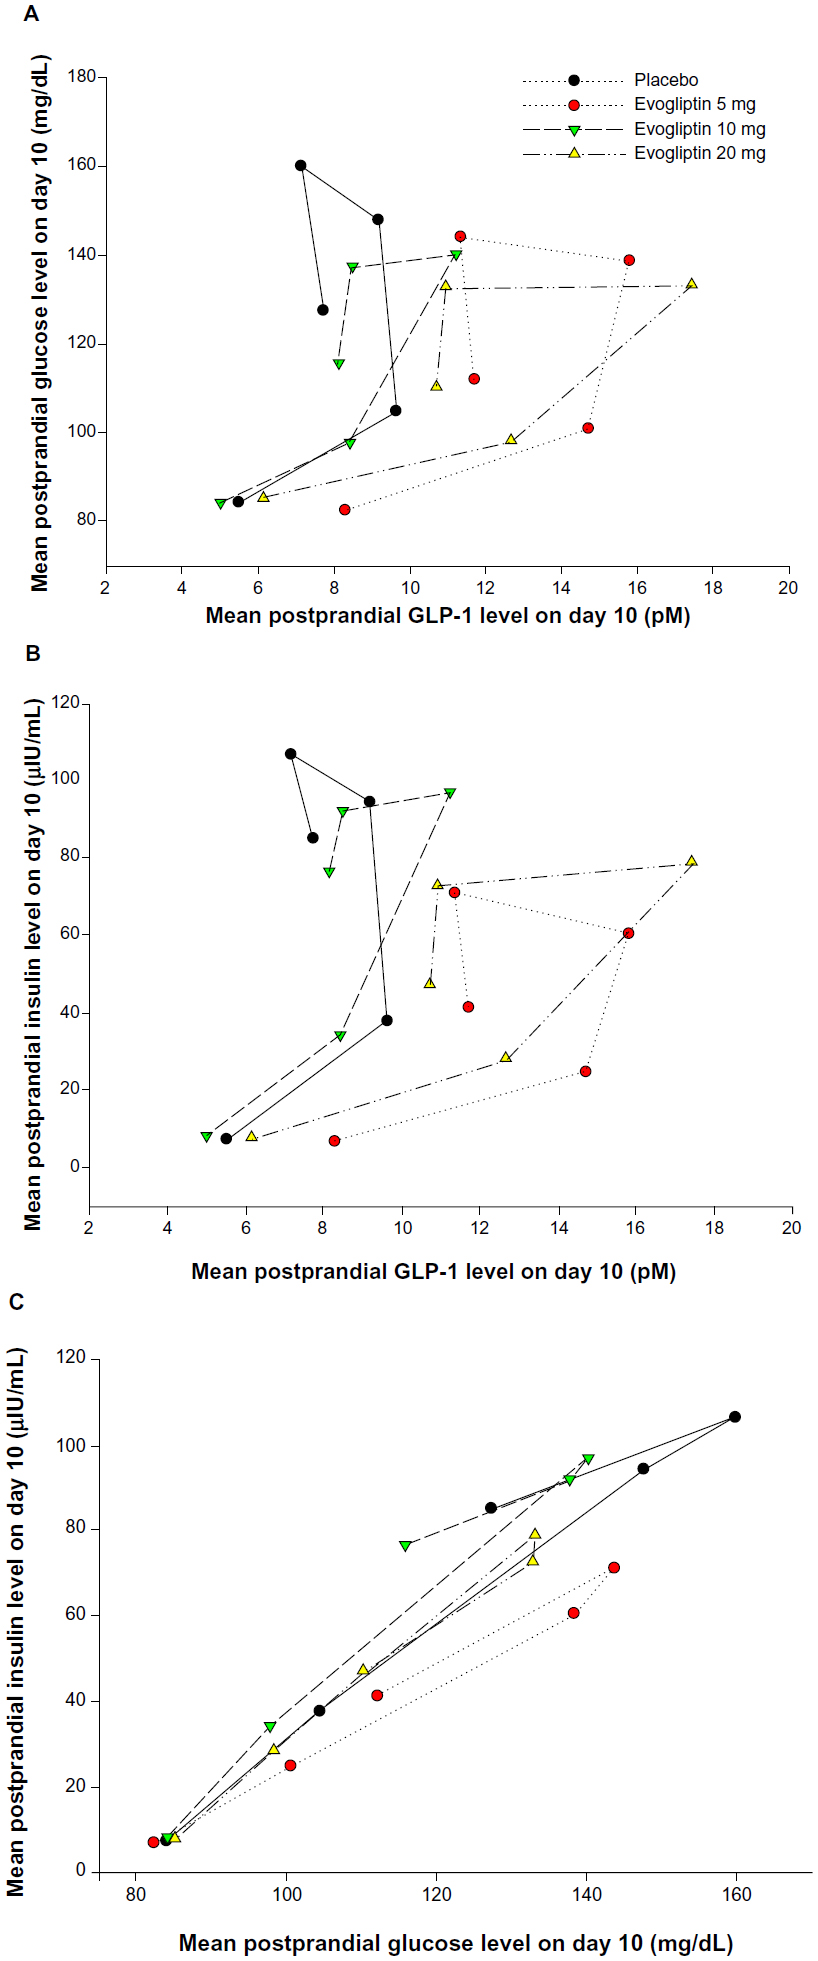 | Figure 6 Relationships among mean postprandial levels of glucagon-like peptide-1 (GLP-1), glucose, and insulin according to time courses after the last administration of placebo or evogliptin (5 mg, 10 mg, or 20 mg). |
The degree of increase in postprandial GLP-1, glucose, and insulin tended to be greater after lunch and breakfast compared to after dinner. Furthermore, this finding was consistently observed in the placebo group. Similarly, Lindgren et al observed that the increase in glucose-dependent insulinotropic polypeptide and GLP-1 secretion in healthy subjects over the first 30 minutes after a standardized meal was markedly (~80%) greater in the morning than in the afternoon.25 They suggested that this increase might be related to diurnal variability in the activity of autonomic nerves or gastrointestinal motility, or in the levels of growth hormone and cortisol. In the present study, the increase in postprandial GLP-1 levels was markedly lower in the evening and was comparable in the morning and in the afternoon. Because the subjects were fasted over 12 hours before lunch and breakfast and for fewer than 6 hours before dinner on the study days, we suggest that these differences might be caused by the duration of fasting period before meal ingestion in regard to gastrointestinal smooth muscle activity or secretion of digestive juices, etc, rather than by the diurnal variability related to daily physical activity or hormonal rhythms, etc. The diurnal variation in postprandial glucose levels was parallel to that in GLP-1 (Figure 5B). However, the diurnal variation in postprandial insulin levels was not parallel to those in postprandial GLP-1 and glucose levels. Postprandial insulin levels were prominently greater at breakfast (the third peak in Figure 5C) than at lunch or dinner in all treatment groups. In other words, the insulin:glucose ratio at breakfast was higher than at lunch or dinner in this study. Similarly, the lower insulin:glucose ratio at dinner, compared to that at breakfast, has been reported by several researchers since the 1970s.26–28 Saad et al reported that lower hepatic insulin extraction and higher insulin sensitivity at breakfast than at lunch or dinner were related to a diurnal pattern in glucose tolerance in healthy humans.29
The results of the present study could not demonstrate any counterregulatory hormonal responses, because the levels of the counterregulatory hormones, including glucagon, adrenaline, growth hormone, and cortisol, were not measured in this study. This study was conducted in a small population of subjects with normal glucose tolerance for a short treatment duration. Therefore, further studies to investigate the efficacy and pharmacologic responses of evogliptin in patients with type 2 DM should be conducted for drug development. Based on the findings of the present study, once-daily dosing regimens of 2.5 mg, 5 mg, and 10 mg evogliptin were used in a multicenter Phase II clinical trial in patients with type 2 DM.
Conclusion
The present PK/PD and tolerability study represents the first assessment of multiple doses of evogliptin in human subjects. Repeated administrations of evogliptin in healthy subjects were well tolerated and exhibited linear PKs within the 5–20 mg dose range. Evogliptin sustained the inhibition of DPP-IV activity >80% over 24 hours in all dose groups and increased the postprandial GLP-1 levels by 1.5- to 2.4-fold compared to placebo.
Acknowledgments
This study was sponsored by Dong-A ST Co, Ltd, of Seoul, Republic of Korea and was supported by a training program grant from the Korea Healthcare Technology R&D Project, Ministry of Health and Welfare, Republic of Korea (A070001).
This study was conducted in Department of Clinical Pharmacology and Therapeutics, Seoul National University College of Medicine and Hospital, Seoul, Republic of Korea. The current affiliation of some authors are as follows: Department of Clinical Pharmacology and Therapeutics, Dongguk University College of Medicine and Ilsan Hospital, Goyang, Gyeonggi-do, Republic of Korea (Dr Gu). Department of Clinical Pharmacology and Therapeutics, Dong-A University College of Medicine and Hospital, Busan, Republic of Korea (Dr Park). Department of Clinical Pharmacology and Therapeutics, Kunkuk University Medical Center, Seoul, Republic of Korea (Dr Kim). Department of Clinical Pharmacology and Therapeutics, CHA University School of Medicine and CHA Bundang Medical Center, Seongnam, Republic of Korea (Dr Lim). Department of Clinical Pharmacology, Inha University Hospital, Inha University School of Medicine, Incheon, Republic of Korea (Dr SH Cho).
Disclosure
The authors report no conflicts of interest, such as stock ownership or patents, in this work. The sponsor’s financial support did not include bonuses for the success of the present study or for the recruitment of subjects.
References
International Diabetes Federation. IDF Diabetes Atlas. 6th ed. Brussels: International Diabetes Federation; 2013. | |
American Diabetes Association. Standards of medical care in diabetes – 2013. Diabetes Care. 2013;36 Suppl 1:S11–S66. | |
Saaddine JB, Engelgau MM, Beckles GL, Gregg EW, Thompson TJ, Narayan KM. A diabetes report card for the United States: quality of care in the 1990s. Ann Intern Med. 2002;136(8):565–574. | |
Drucker DJ. Therapeutic potential of dipeptidyl peptidase IV inhibitors for the treatment of type 2 diabetes. Expert Opin Investig Drugs. 2003;12(1):87–100. | |
Holst JJ, Vilsbøll T, Deacon CF. The incretin system and its role in type 2 diabetes mellitus. Mol Cell Endocrinol. 2009;297(1–2):127–136. | |
Pontikis C, Yavropoulou MP, Toulis KA, et al. The incretin effect and secretion in obese and lean women with polycystic ovary syndrome: a pilot study. J Womens Health (Larchmt). 2011;20(6):971–976. | |
Pospisilik JA, Martin J, Doty T, et al. Dipeptidyl peptidase IV inhibitor treatment stimulates beta-cell survival and islet neogenesis in streptozotocin-induced diabetic rats. Diabetes. 2003;52(3):741–750. | |
Kim HJ, Kwak WY, Min JP, et al. Discovery of DA-1229: a potent, long acting dipeptidyl peptidase-4 inhibitor for the treatment of type 2 diabetes. Bioorg Med Chem Lett. 2011;21(12):3809–3812. | |
Cho JM, Jang HW, Cheon H, et al. A novel dipeptidyl peptidase IV inhibitor DA-1229 ameliorates streptozotocin-induced diabetes by increasing β-cell replication and neogenesis. Diabetes Res Clin Pract. 2011;91(1):72–79. | |
Kim MK, Chae YN, Kim HD, et al. DA-1229, a novel and potent DPP4 inhibitor, improves insulin resistance and delays the onset of diabetes. Life Sci. 2012;90(1–2):21–29. | |
Kim TE, Lim KS, Park MK, et al. Evaluation of the pharmacokinetics, food effect, pharmacodynamics, and tolerability of DA-1229, a dipeptidyl peptidase IV inhibitor, in healthy volunteers: first-in-human study. Clin Ther. 2012;34(9):1986–1998. | |
Drucker DJ, Sherman SI, Gorelick FS, Bergenstal RM, Sherwin RS, Buse JB. Incretin-based therapies for the treatment of type 2 diabetes: evaluation of the risks and benefits. Diabetes Care. 2010;33(2):428–433. | |
Kazafeos K. Incretin effect: GLP-1, GIP, DPP4. Diabetes Res Clin Pract. 2011;93 Suppl 1:S32–S36. | |
Scheen AJ. Dipeptidyl peptidase-4 (DPP-4) inhibitors are favourable to glucagon-like peptide-1 (GLP-1) receptor agonists: yes. Eur J Intern Med. 2012;23(2):126–131. | |
Davidson JA. Incorporating incretin-based therapies into clinical practice: differences between glucagon-like peptide 1 receptor agonists and dipeptidyl peptidase 4 inhibitors. Mayo Clin Proc. 2010; 85(Suppl 12):S27–S37. | |
Gerich J. DPP-4 inhibitors: what may be the clinical differentiators? Diabetes Res Clin Pract. 2010;90(2):131–140. | |
Scheen AJ. Pharmacokinetics of dipeptidyl peptidase-4 inhibitors. Diabetes Obes Metab. 2010;12(8):648–658. | |
Scheen AJ. A review of gliptins in 2011. Expert Opin Pharmacother. 2012;13(1):81–99. | |
Baetta R, Corsini A. Pharmacology of dipeptidyl peptidase-4 inhibitors: similarities and differences. Drugs. 2011;71(11):1441–1467. | |
He YL. Clinical pharmacokinetics and pharmacodynamics of vildagliptin. Clin Pharmacokinet. 2012;51(3):147–162. | |
Li H, Yang L, Tou CK, Patel CG, Zhao J. Pharmacokinetic study of saxagliptin in healthy Chinese subjects. Clin Drug Investig. 2012;32(7):465–473. | |
Gutniak M. [GLP-1 (7–36) amide [GLIP-glucagon like insulinotropic peptide] as a potential treatment for NIDDM]. Journ Annu Diabetol Hotel Dieu. 1998:157–171. French. | |
Flint A, Raben A, Ersbøll AK, Holst JJ, Astrup A. The effect of physiological levels of glucagon-like peptide-1 on appetite, gastric emptying, energy and substrate metabolism in obesity. Int J Obes Relat Metab Disord. 2001;25(6):781–792. | |
Knauf C, Cani PD, Perrin C, et al. Brain glucagon-like peptide-1 increases insulin secretion and muscle insulin resistance to favor hepatic glycogen storage. J Clin Invest. 2005;115(12):3554–3563. | |
Lindgren O, Mari A, Deacon CF, et al. Differential islet and incretin hormone responses in morning versus afternoon after standardized meal in healthy men. J Clin Endocrinol Metab. 2009;94(8):2887–2892. | |
Melani F, Verrillo A, Marasco M, Rivellese A, Osorio J, Bertolini MG. Diurnal variation in blood sugar and serum insulin in response to glucose and/or glucagon in healthy subjects. Horm Metab Res. 1976;8(2):85–88. | |
Lee A, Ader M, Bray GA, Bergman RN. Diurnal variation in glucose tolerance. Cyclic suppression of insulin action and insulin secretion in normal-weight, but not obese, subjects. Diabetes. 1992;41(6):750–759. | |
Van Cauter E, Shapiro ET, Tillil H, Polonsky KS. Circadian modulation of glucose and insulin responses to meals: relationship to cortisol rhythm. Am J Physiol. 1992;262(4 Pt 1):E467–E475. | |
Saad A, Dalla Man C, Nandy DK, et al. Diurnal pattern to insulin secretion and insulin action in healthy individuals. Diabetes. 2012;61(11):2691–2700. |
 © 2014 The Author(s). This work is published and licensed by Dove Medical Press Limited. The
full terms of this license are available at https://www.dovepress.com/terms
and incorporate the Creative Commons Attribution
- Non Commercial (unported, 3.0) License.
By accessing the work you hereby accept the Terms. Non-commercial uses of the work are permitted
without any further permission from Dove Medical Press Limited, provided the work is properly
attributed. For permission for commercial use of this work, please see paragraphs 4.2 and 5 of our Terms.
© 2014 The Author(s). This work is published and licensed by Dove Medical Press Limited. The
full terms of this license are available at https://www.dovepress.com/terms
and incorporate the Creative Commons Attribution
- Non Commercial (unported, 3.0) License.
By accessing the work you hereby accept the Terms. Non-commercial uses of the work are permitted
without any further permission from Dove Medical Press Limited, provided the work is properly
attributed. For permission for commercial use of this work, please see paragraphs 4.2 and 5 of our Terms.