Back to Journals » International Journal of Women's Health » Volume 18
Multiparametric Pelvic-Floor Magnetic Resonance Imaging for the Staging of Anterior-Compartment Clinical Pelvic Organ Prolapse: A Prospective Study
Authors Xiong S, Wu W, Xiao L, Tian D, Wan B, Lv F
Received 19 January 2026
Accepted for publication 14 April 2026
Published 22 April 2026 Volume 2026:18 597329
DOI https://doi.org/10.2147/IJWH.S597329
Checked for plagiarism Yes
Review by Single anonymous peer review
Peer reviewer comments 2
Editor who approved publication: Dr Matteo Frigerio
Shan Xiong,1,2 Wenze Wu,2 Li Xiao,3 Dijiao Tian,4 Bing Wan,4,5 Furong Lv1
1Department of Radiology, The First Affiliated Hospital of Chongqing Medical University, Chongqing, 400016, People’s Republic of China; 2Department of Radiology, Jingzhou Hospital Affiliated to Yangtze University, Jingzhou, 434020, People’s Republic of China; 3Department of Obstetrics and Gynecology, Jingzhou Hospital Affiliated to Yangtze University, Jingzhou, 434020, People’s Republic of China; 4Department of Radiology, Affiliated Renhe Hospital of China Three Gorges University, Yichang, 443001, People’s Republic of China; 5College of Basic Medical Science, Chongqing Medical University, Chongqing, 400016, People’s Republic of China
Correspondence: Furong Lv, Department of Radiology, The First Affiliated Hospital of Chongqing Medical University, No. 1 Youyi Road, Chongqing, 400016, People’s Republic of China, Email [email protected] Bing Wan, Department of Radiology, Affiliated Renhe Hospital of China Three Gorges University, No. 410 Yiling Avenue, Yichang, 443001, People’s Republic of China, Email [email protected]
Objective: This study aimed to evaluate the utility of multiparametric pelvic-floor magnetic resonance imaging (MRI) for identifying stage III–IV anterior-compartment clinical pelvic organ prolapse (POP) and guiding clinical management.
Methods: In total, 123 women with confirmed anterior-compartment clinical POP were prospectively categorized into non-stage III–IV (n = 60) and stage III–IV (n = 63) groups. All participants underwent combined pelvic-floor static–dynamic MRI and T2 star (T2*) mapping. Levator ani muscle (LAM) injury was assessed. The perpendicular distance from the bladder base to the pubococcygeal line (B-PCL), H-line, M-line, levator hiatus area (LHA), levator plate angle, and iliococcygeal angle were measured at rest and maximum Valsalva. T2* values were measured in LAM. Univariate and logistic regression analyses were used to diagnose stage III–IV prolapse. The optimal model was compared with the conventional MRI-based “rule of three”.
Results: Compared with the non-stage III–IV group, the stage III–IV group was significantly older in age; had higher Pelvic Floor Distress Inventory-20 scores; exhibited larger B-PCL, M-line, and LHA values at maximum Valsalva; and demonstrated lower pubovisceral muscle T2* values. Compared with the “rule of three”, the optimal multiparametric MRI-based model achieved an area under the curve of 0.802, with significantly higher sensitivity, modestly lower specificity, and superior overall accuracy.
Conclusion: The multiparametric pelvic-floor MRI-based diagnostic model demonstrates superior performance in identifying stage III–IV anterior-compartment clinical POP. This model provides an objective imaging-based reference to support accurate POP staging and guide clinical management.
Keywords: pelvic organ prolapse, magnetic resonance imaging, T2* mapping, diagnostic imaging, pelvic floor
Introduction
Pelvic organ prolapse (POP) refers to the abnormal descent of one or more pelvic organs resulting from the weakening of the pelvic-floor muscles and supporting connective tissues.1 POP is classified into anterior-, middle-, and posterior-compartment prolapse, with anterior-compartment involvement being the most prevalent.2,3 POP not only results in significant physical morbidity but also exerts substantial psychological effects, thereby reducing quality of life.4–6 POP that necessitates medical evaluation and treatment is commonly referred to as clinical POP and is diagnosed according to established clinical criteria.7 The staging of clinical POP plays a pivotal role in informing management strategies. Conservative management is the mainstay of treatment for patients with non-advanced clinical POP (stage II),8 whereas surgical intervention represents the primary therapeutic approach for those with advanced disease (stages III–IV).9,10 Accordingly, precise staging of clinical POP is essential.
The pelvic organ prolapse quantification (POP-Q) system is the internationally recognized gold standard for POP staging.11 During a POP-Q examination, the patient is placed in the lithotomy position and instructed to perform a breath-holding strain (Valsalva maneuver); the most distal point of the prolapsed organ is identified, and its distance from the hymen is measured to classify POP into stages 0, I, II, III, and IV.12 Despite its global recognition, the POP-Q system is complex and challenging to master, requiring substantial clinical experience to reliably apply.13 Moreover, the POP-Q system does not assess injuries to pelvic-floor supportive structures, which are critical to POP development and progression.14
Pelvic-floor magnetic resonance imaging (MRI), owing to its excellent spatial resolution, superior soft-tissue contrast, and large field of view, is particularly suitable for evaluating pelvic-floor supportive structures and organ positions.15,16 Conventional pelvic-floor MRI comprises rest and dynamic phases enabling the assessment of anatomical defects and real-time organ mobility during the Valsalva maneuver.17 As a critical component of the pelvic floor, the functional and structural integrity of the levator ani muscle (LAM) determines the morphology and dimensions of the levator hiatus. Injury to the LAM markedly impairs the closure capacity of the levator hiatus, diminishing the supportive function of the pelvic floor and thereby representing a key factor in POP development and progression.18 Additionally, previous studies have demonstrated that T2 star (T2*) mapping imaging is highly sensitive to paramagnetic substances resulting from intramuscular hemorrhage in chronically injured muscles and collagen-fiber proliferation associated with muscle fibrosis.19,20 Unlike conventional pelvic-floor MRI, which is limited to assessing muscle morphology, T2* mapping allows the quantitative evaluation of LAM injury through the measurement of the T2* value.21
Currently, the pubococcygeal line (PCL), which is defined as the line connecting the inferior margin of the pubic symphysis to the last coccygeal joint, serves as the most widely used reference for MRI-based staging of POP, with the perpendicular distance from the bladder base to the PCL (B-PCL) measured during the maximum Valsalva maneuver.15,16 MRI staging of anterior-compartment POP typically follows the “rule of three” recommended by expert consensus,15 categorizing prolapse into normal, mild, moderate, and severe, based on B-PCL measurements.22,23 However, studies indicate that MRI staging based solely on bladder position demonstrates only fair agreement with POP-Q staging (κ = 0.29).22 This discrepancy is primarily attributable to differences in maximum intra-abdominal pressure generated in the supine position during MRI versus the lithotomy position during POP-Q examination.22,23 Considering the pivotal role of pelvic-floor supportive-structure injury in POP development and progression14,18 and the established ability of T2* mapping to quantitatively evaluate LAM injury,21 we hypothesized that patients with different POP-Q stages would exhibit corresponding differences in MRI metrics of pelvic-floor supportive structures in addition to organ-position measures. By integrating organ-position metrics, morphological parameters of pelvic-floor supportive structures, and the quantitative parameter T2* value of the LAM obtained through multiparametric pelvic-floor MRI (combining conventional static–dynamic MRI with T2* mapping), a comprehensive evaluation model could be constructed to mitigate mis-staging arising from positional differences.
Because management strategies differ between patients with clinical POP non-stages III–IV and those with stages III–IV,8–10 the further stratification of patients into these categories is clinically important. Currently, aside from the “rule of three”, although several studies have proposed pelvic-floor MRI-based diagnostic models for clinical POP,24,25 no model has been developed specifically to differentiate between non-stage III–IV and stage III–IV categories. Therefore, this study is the first to investigate the performance of the “rule of three” for anterior-compartment clinical POP stages III–IV. Second, baseline characteristics and multiparametric MRI metrics were compared between the clinical POP non-stage III–IV and stage III–IV groups, and correlations among significantly different metrics and Ba were explored. Subsequently, a multivariable logistic regression model was constructed using these differential metrics as independent variables, and the optimal model was identified. The performance of the optimal model was compared with that of the “rule of three”, with the aim of establishing an anterior-compartment clinical POP staging method superior to the “rule of three” and providing a potential reference for guiding clinical-management decisions.
Materials and Methods
Patients
This cross-sectional prospective study was approved by the Clinical Research Ethics Committee of Jingzhou Hospital Affiliated to Yangtze University (approval no. 2025–111-01). Written informed consent was obtained from all participants. Consecutive female patients diagnosed with anterior-compartment clinical POP at the Pelvic Floor Center of Jingzhou Hospital Affiliated to Yangtze University were recruited between April and December 2025. Female patients presenting with POP-specific symptoms—defined as “feeling or seeing a bulge from the vagina” with anterior vaginal wall descent to or beyond the hymen on POP-Q physical examination—were included in the analysis.7 Symptom severity was assessed using the Pelvic Floor Distress Inventory-20 (PFDI-20), which yielded a total score of 300, with higher scores indicating more severe symptoms.26 POP-Q physical examinations were performed to measure and record Ba and determine the stage of anterior-compartment POP. Ba represents the most distal point of anterior-compartment prolapse; positions above the hymen were recorded as negative values, whereas those below the hymen were recorded as positive values. Anterior-compartment POP staging was defined using Ba as follows: stage 0, Ba = −3 cm; stage I, −3 cm < Ba < −1 cm; stage II, −1 cm ≤ Ba ≤ 1 cm; stage III, 1 cm < Ba < total vaginal length (TVL) − 2 cm; and stage IV, Ba ≥ TVL − 2 cm. Both PFDI-20 assessments and POP-Q examinations were conducted and documented by a single pelvic-floor specialist with 17 years of experience. Based on POP-Q findings, patients were classified into either the non-stage III–IV or stage III–IV anterior-compartment clinical POP group. Participants who had a history of pelvic or pelvic-floor surgery, were unwilling to undergo pelvic-floor MRI, had claustrophobia or contraindications to MRI, were unable to perform the Valsalva maneuver during MRI, and had MRI images with severe artifacts that precluded subsequent analysis or measurement were excluded. The patient selection flowchart is illustrated (Figure 1).
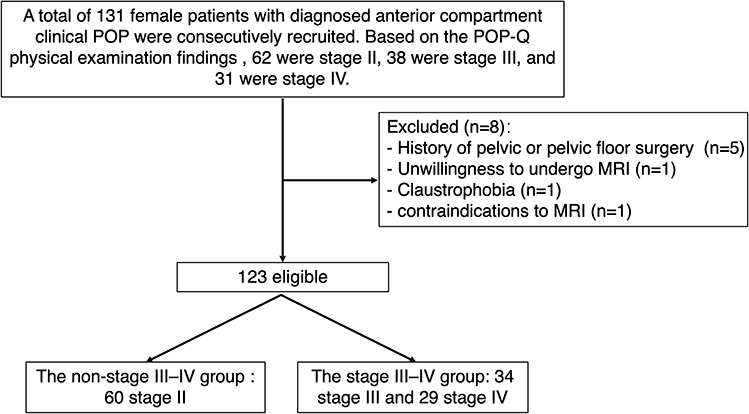 |
Figure 1 Flowchart depicting the patient selection process. Abbreviations: POP, pelvic organ prolapse; POP-Q, pelvic organ prolapse quantification. |
MRI Preparation
All patients emptied their bladders 1 h prior to the examination to ensure moderate bladder filling during imaging. No gel was introduced into the vagina or rectum,25,27,28 and no intravenous contrast agent was administered. The radiologist performing the pelvic-floor MRI provided instruction and training in the Valsalva maneuver until each patient demonstrated understanding of the procedure. During scanning, patients were positioned supine with a soft, wedge-shaped pad beneath the knees to facilitate straining.
MRI Protocol
All patients underwent multiparametric pelvic-floor MRI using a 3.0 T scanner (Skyra, Siemens Healthineers, Erlangen, Germany) equipped with a 16-channel surface coil.
Patients were instructed to breathe quietly while axial and coronal T2-weighted turbo spin-echo (T2-TSE) sequences were acquired (repetition time [TR], 5420 ms; echo time [TE], 67 ms; matrix, 256 × 320; field of view [FOV], 350 mm; slice thickness, 4 mm; slice gap, 0.8 mm; and voxel, 1.1×1.1 × 4.0 mm).
Sagittal half-Fourier acquisition single-shot turbo spin-echo (HASTE) sequences were obtained (TR, 2000 ms; TE, 88 ms; matrix, 152 × 320; FOV, 400 mm; slice thickness, 4 mm; voxel, 1.3×1.3 × 4.0 mm; and acquisition time, 36s, generating 18 frames). During scanning, patients performed the Valsalva maneuver, consisting of deep inspiration followed by simulated defecation straining while holding the breath, gradually increasing intra-abdominal pressure to maximum and maintaining maximum pressure for at least 5 s. A successful Valsalva maneuver was defined by clearly visible relaxation–tension motion of the abdominal wall.15 The Valsalva maneuver was repeated 2–3 times to ensure acquisition of optimal images.
Additionally, using pelvic-floor anatomical information from the acquired T2-weighted imaging (T2WI) and HASTE images for localization, HASTE sequences were obtained across 6–8 slices in the axial plane at the maximum area of the levator hiatus and in the coronal plane at the thickest portion of the iliococcygeus muscle.28 During HASTE scanning, patients were instructed to strain maximumly and then hold for 12–16s.
Finally, patients breathed quietly during T2* mapping acquisition using a multi-echo gradient-echo (GRE) sequence (TR, 791 ms; TE1, 4.52 ms; ΔTE, 2.46 ms; matrix, 128 × 128; FOV, 300 mm × 100 mm; slice thickness, 4 mm; slice gap, 0.8 mm; voxel, 2.3×2.3 × 4.9 mm; flip angle, 40°; average, 1; number of slices, 30; and acquisition time, 3 min 26s). The total duration of the MRI examination was 20–25 min.
Image Analysis
Raw MRI datasets were transferred to a Syngo.via workstation (software version VB60A; Siemens Healthineers, Erlangen, Germany), where T2* values were automatically calculated on a pixel-by-pixel basis using a monoexponential decay equation: S(TE) = S0 × exp(−TE/T2*), where S(TE) is the signal intensity at echo time TE, and S0 is the signal intensity at TE = 0.29 T2* mapping-weighted images were automatically generated. Multiparametric MRI images were analyzed and measured using the RadiAnt DICOM Viewer (64-bit). For anatomical reference, the MRI-based definition of the LAM proposed by DeLancey et al30 was adopted, dividing the LAM into two major components: the pubovisceral and iliococcygeus muscles. The pubovisceral muscles include the pubococcygeus, puborectalis, and puboperineus, all originating from the pubis. Except for LAM-injury severity, which was evaluated only at rest, all other pelvic-floor supportive-structure morphological metrics and B-PCL measurements were obtained at both rest and maximum Valsalva (Table 1). T2* values were measured on T2* mapping-weighted images.
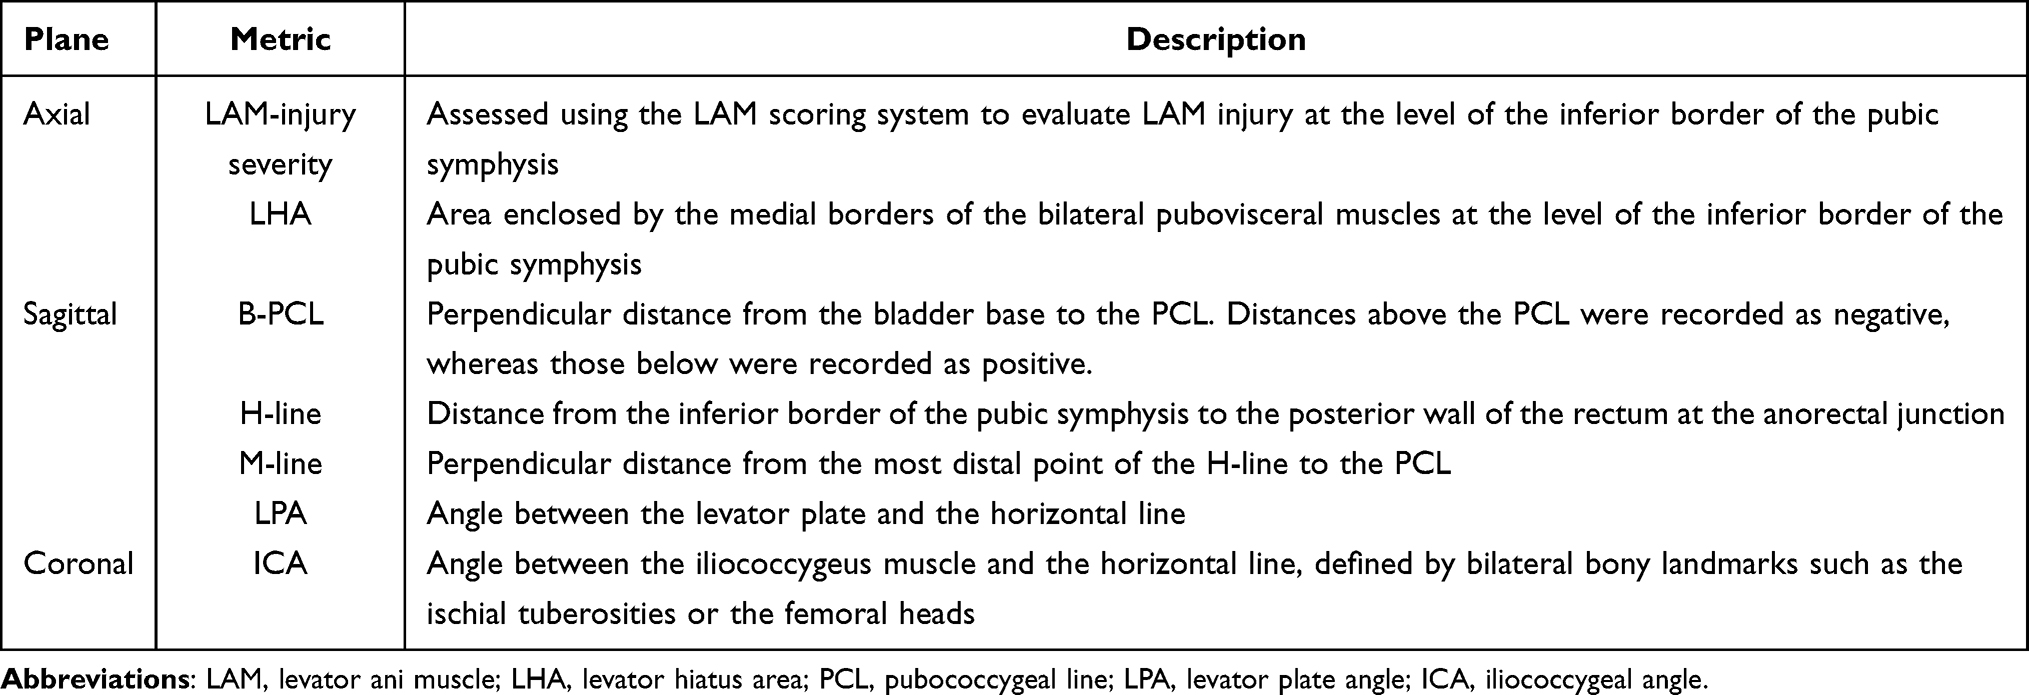 |
Table 1 Measurements of Static–Dynamic MRI Organ Position and Supportive-Structure Morphological Metrics |
Organ Position Assessment and “Rule of Three” Staging
B-PCL was defined as the perpendicular distance from the bladder base to the PCL; when the bladder base was located above the PCL, the value was recorded as negative, whereas positions below the PCL were recorded as positive (Figure 2). POP may be staged using the “rule of three” based on the B-PCL measurement,15 in which normal (B-PCL ≤ +1 cm), mild (+1 cm < B-PCL < +3 cm), moderate (+3 cm ≤ B-PCL ≤ +6 cm), and severe (B-PCL > +6 cm) stages correspond to POP-Q stages 0, I, II, and III–IV, respectively.22,23 Although the normal and mild stages (corresponding to POP-Q stage 0 and I, respectively) typically do not require clinical management, the present study enrolled only patients with clinical POP who required clinical management.
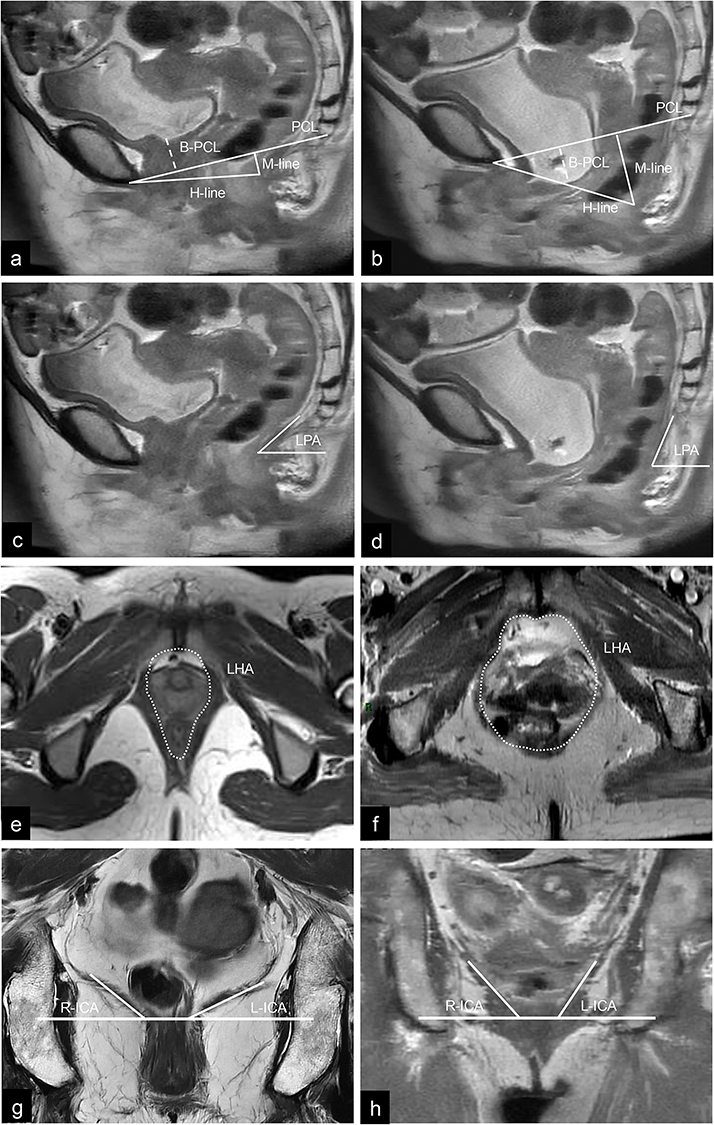 |
Figure 2 Schematic diagrams illustrating static–dynamic pelvic-floor MRI measurements of supportive-structure morphology and organ position. The mid-sagittal plane of the pelvic floor at rest (a) and during maximum Valsalva (b) demonstrates measurements of the H-line, M-line, and B-PCL, with the dotted lines indicating the perpendicular distance from the bladder base to the pubococcygeal line. The mid-sagittal plane at rest (c) and during maximum Valsalva (d) shows measurement of the LPA. The axial plane at rest (e) and during maximum Valsalva (f) illustrates measurement of the LHA, with the dotted lines delineating the medial borders of the bilateral pubovisceral muscles at the level of the inferior border of the pubic symphysis. The coronal plane at rest (g) and maximum Valsalva (h) shows measurement of the ICA. B-PCL is defined as the perpendicular distance from the bladder base to the pubococcygeal line; H-line is defined as the distance from the inferior border of the pubic symphysis to the posterior wall of the rectum at the anorectal junction; M-line is defined as the perpendicular distance from the most distal point of the H-line to the pubococcygeal line; PCL is defined as the line connecting the inferior margin of the pubic symphysis to the last coccygeal joint; LPA is defined as the angle between the levator plate and the horizontal line; LHA is defined as the area enclosed by the medial borders of the bilateral pubovisceral muscles at the level of the inferior border of the pubic symphysis; ICA is defined as the angle between the iliococcygeus muscle and the horizontal line. Abbreviations: PCL, pubococcygeal line; LPA, levator plate angle; LHA, levator hiatus area; ICA, iliococcygeus angle. |
Consequently, all participants required clinical management regardless of their “rule of three” stage. To align with the study objective of improving MRI-based staging to guide clinical decision-making, normal, mild, and moderate stages were collectively classified as non-severe stages, corresponding to clinical POP non-stage III–IV and indicating that non-surgical management should be the primary consideration. By contrast, the severe stage was classified as clinical POP stages III–IV, for which surgical intervention should be the primary management strategy.
Pelvic-Floor Supportive-Structure Morphological Assessment
Assessment of LAM-injury severity: The LAM scoring system proposed by Delancey et al30 was applied. Bilateral muscles were scored independently as follows: 0 = normal, 1 = abnormality involving <50% of the muscle, 2 = abnormality involving >50% of the muscle without complete disruption, 3 = complete muscle disruption (Figure 3). The total bilateral score ranged from 0 to 6, with 0 indicating no injury, 1–3 indicating mild injury, and 4–6 indicating severe injury. In addition, a unilateral score of 3 was classified as severe injury.
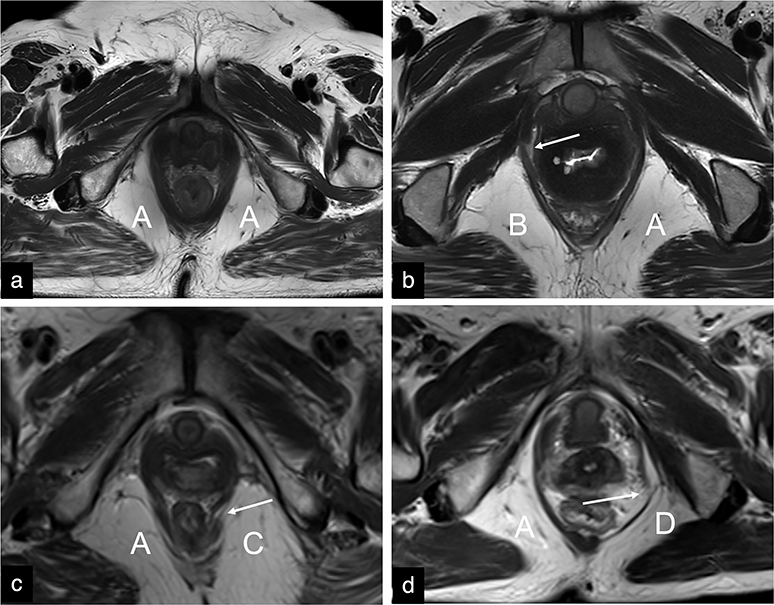 |
Figure 3 Axial T2WI images illustrating LAM-injury scores. (a) A = score 0 (normal), (b) B = score 1 (abnormality involving <50% of the muscle), (c) C = score 2 (abnormality involving >50% of the muscle without complete disruption), (d) D = score 3 (complete muscle disruption). Arrows indicate the injury sites. Abbreviations: T2WI, T2-weighted imaging; LAM, levator ani muscle. |
Pelvic-floor supportive-structure function assessment: As the LAM scoring system primarily reflects the anatomical integrity of the pubovisceral muscle, additional morphological metrics were selected to assess the functional status of the pelvic-floor supportive structures. These metrics included the H-line, M-line, levator hiatus area (LHA), levator plate angle (LPA), and iliococcygeus angle (ICA), allowing a comprehensive evaluation of the pelvic-floor supportive function. The H-line was defined as the distance connecting the inferior margin of the pubic symphysis to the posterior margin of the anorectal junction. The M-line was defined as the perpendicular distance from the most distal point of the H-line to the PCL. The LHA was defined as the area enclosed by the medial borders of the bilateral pubovisceral muscles at the level of the inferior margin of the pubic symphysis. The LPA was defined as the angle between the levator plate and the horizontal line. The ICA was defined as the angle between the iliococcygeus muscle and the horizontal line (a line connecting bilateral bony landmarks such as the ischial tuberosities or femoral heads) measured on the coronal plane. For ICA, the mean of the left and right ICA measurements was used for analysis (Figure 2).
LAM Quantitative Parameter T2* Value Assessment
The T2WI and T2* mapping-weighted images were initially co-registered and fused on the post-processing workstation. Using the anatomical delineation of the pubovisceral and iliococcygeus muscles on T2WI as a reference, the left- and right-sided regions of interest (ROIs) were manually delineated on the T2* mapping–weighted images to encompass the pubovisceral and iliococcygeus muscles at their largest cross-sectional area (Figure 4). Non-muscle pixels were excluded from the analysis. For each muscle, the T2* value was calculated as the mean of the left and right measurements.
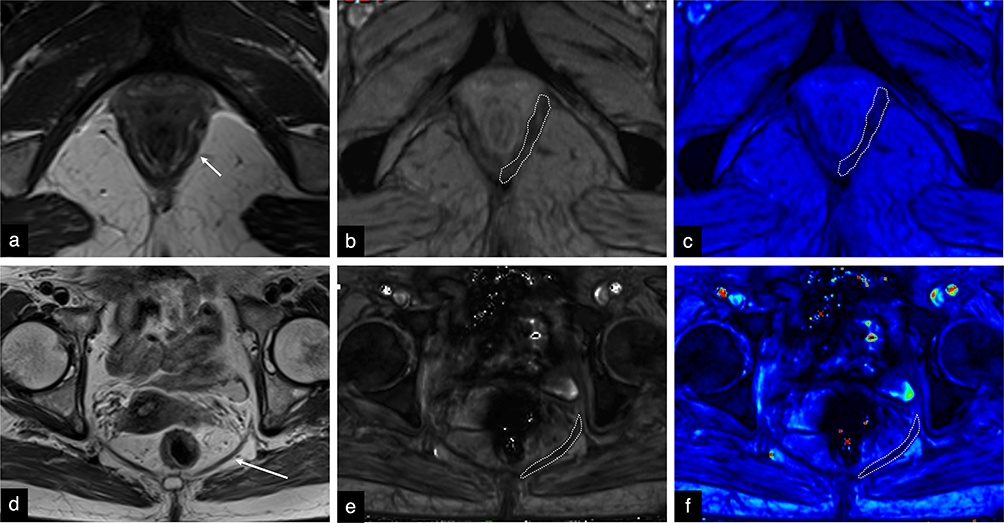 |
Figure 4 (a–f) Axial T2WI and T2* mapping-weighted images illustrating T2* value measurement of the pubovisceral and iliococcygeus muscles. Pubovisceral muscle: (a) T2WI image, (b) T2* mapping grayscale image, (c) T2* mapping pseudocolor image. Iliococcygeus muscle: (d) T2WI image, (e) T2* mapping grayscale image, (f) T2* mapping pseudocolor image. On the T2WI images (a and d), the short arrow indicates the pubovisceral muscle, whereas the long arrow indicates the iliococcygeus muscle. On the T2* mapping grayscale images (b and e), regions of interest were manually delineated and subsequently mapped onto the corresponding pseudocolor images (c and f), with regions of interest indicated by dashed lines. Abbreviations: T2WI, T2-weighted imaging; T2* mapping, T2 star mapping; T2* value, T2 star value. |
Two radiologists (with 5 and 15 years of experience, respectively, in female pelvic MRI) independently assessed and measured these parameters. Both radiologists were blinded to patients’ clinical POP-Q staging. The radiologists also subjectively assessed the quality of the raw datasets to exclude images affected by severe artifacts. After completing the initial assessment and measurements for all patients independently, both radiologists performed a second assessment and measurement after 1 month to minimize recall bias. The results of these assessments and measurements were recorded independently by the two radiologists. If the parameters achieved good intra- and inter-observer reliability, the final results (used for subsequent analyses) were determined based on the first assessment and measurement owing to the potential for recall bias in the second assessment, according to the following principles:
- For categorical variables (LAM-injury severity): If the first assessments of LAM-injury severity by the two radiologists were in agreement, this result was adopted as the final result. If the first assessments were not in agreement, consensus was reached through discussion between the two radiologists, and the consensus result was used as the final result. If consensus could not be reached after thorough discussion, a third senior radiologist (with 20 years of experience in female pelvic MRI, blinded to the patients’ clinical POP-Q staging) was invited to independently arbitrate, and the arbitration result was used as the final result for that case.
- For continuous variables (B-PCL, H-line, M-line, LHA, LPA, ICA, pubovisceral muscle T2* value, and iliococcygeus muscle T2* value): The mean of the first measurements by the two radiologists was used as the final result.
Statistical Analysis
All statistical analyses were performed using SPSS software (version 27.0; IBM Corp., Armonk, NY, USA). As the POP-Q system reports Ba in centimeters, Ba measurements were converted to millimeters for statistical analysis. Data normality was examined using the Shapiro–Wilk test. Normally distributed variables were expressed as means ± standard deviations, whereas non-normally distributed variables were expressed as medians (inter-quartile ranges). For the categorical variable (LAM-injury severity), weighted kappa values were used to evaluate intra- and inter- reliability, with a weighted kappa value of ≥0.75 indicating good reliability. For continuous variables (B-PCL, H-line, M-line, LHA, LPA, ICA, pubovisceral muscle T2* value, and iliococcygeus muscle T2* value), intraclass correlation coefficients (ICCs) were used to assess intra- and inter-observer reliability, with an ICC of ≥0.75 indicating good reliability. For univariable comparisons, the χ2-test was used to compare LAM-injury severity between the groups. Baseline characteristics and imaging metrics—including B-PCL, H-line, M-line, LHA, LPA, ICA, and T2* values—were compared using the independent samples t-test or Mann–Whitney U-test, as appropriate. Spearman correlation analysis was performed to evaluate the associations between Ba and imaging metrics that demonstrated significant between-group differences.31,32 Correlation strength was categorized as strong (|r| ≥ 0.70), moderate (0.40 ≤ |r| < 0.70), weak (0.10 ≤ |r| < 0.40), or negligible (|r| < 0.10).33 For multivariable analysis, imaging metrics showing significant between-group differences were entered as independent variables into a binary logistic regression model to predict anterior-compartment clinical POP stage III–IV. Receiver operating characteristic (ROC) analysis was performed, and areas under the curve (AUCs) were compared using DeLong test to identify the optimal model. The sensitivity, specificity, and overall accuracy of the “rule of three” for diagnosing anterior-compartment clinical POP stage III–IV were calculated. McNemar’s test was used to compare sensitivity, specificity, and overall accuracy between the optimal model and the “rule of three”. Statistical significance was set at a P value of < 0.05.
Results
Patient’s Baseline Characteristics
In total, 123 patients with anterior-compartment clinical POP were included in the final analysis and classified into the non-stage III–IV group (n = 60) and stage III–IV group (n = 63) according to the POP-Q staging. Compared with the non-stage III–IV group, the stage III–IV group were significantly older and exhibited higher PFDI-20 scores and Ba levels (all P < 0.05). No significant differences were observed in body mass index (BMI) or parity between the two groups (P > 0.05) (Table 2).
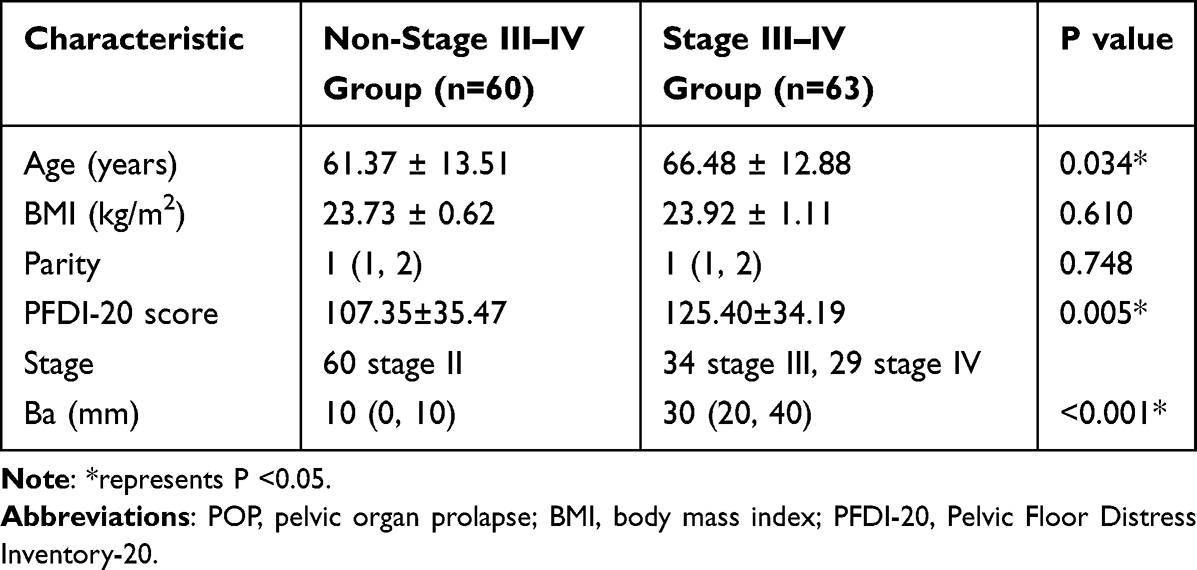 |
Table 2 Comparison of Baseline Characteristics Between Patients with Anterior-Compartment Clinical POP |
Performance of the “Rule of Three”
The performance of the “rule of three” in diagnosing anterior-compartment clinical POP stage III–IV is presented in Table 3. Among the patients, 38 (30.89%) were underestimated, whereas 5 (4.07%) were overestimated. The sensitivity, specificity, and overall accuracy of the “rule of three” for identifying anterior-compartment POP stage III–IV were 0.397, 0.917, and 0.650, respectively.
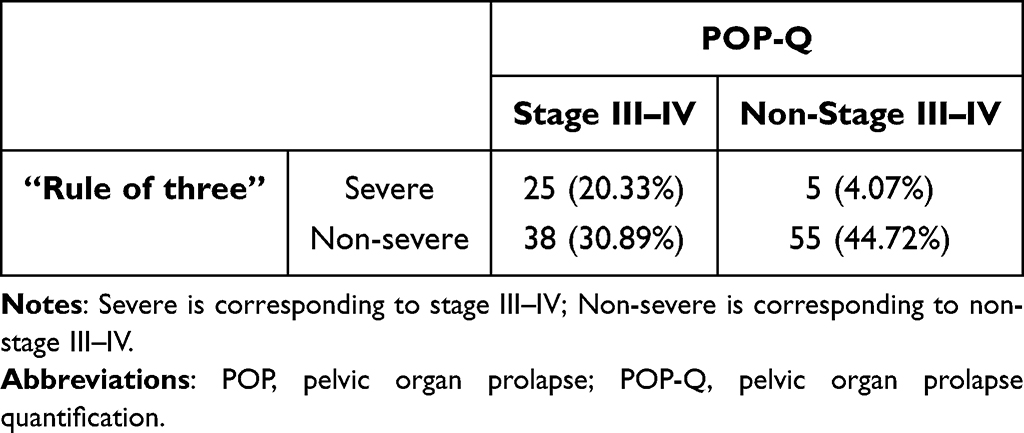 |
Table 3 Performance of the “Rule of Three” in Diagnosing Anterior-Compartment Clinical POP Stage III–IV |
Measurement Reliability for Each Metric
Weighted kappa values for LAM-injury severity were >0.75, indicating good intra- and inter-observer reliability. ICCs for B-PCL, H-line, M-line, LHA, LPA, ICA, pubovisceral muscle T2* value, and iliococcygeus muscle T2* value were >0.75, indicating good intra- and inter-observer reliability (Table 4).
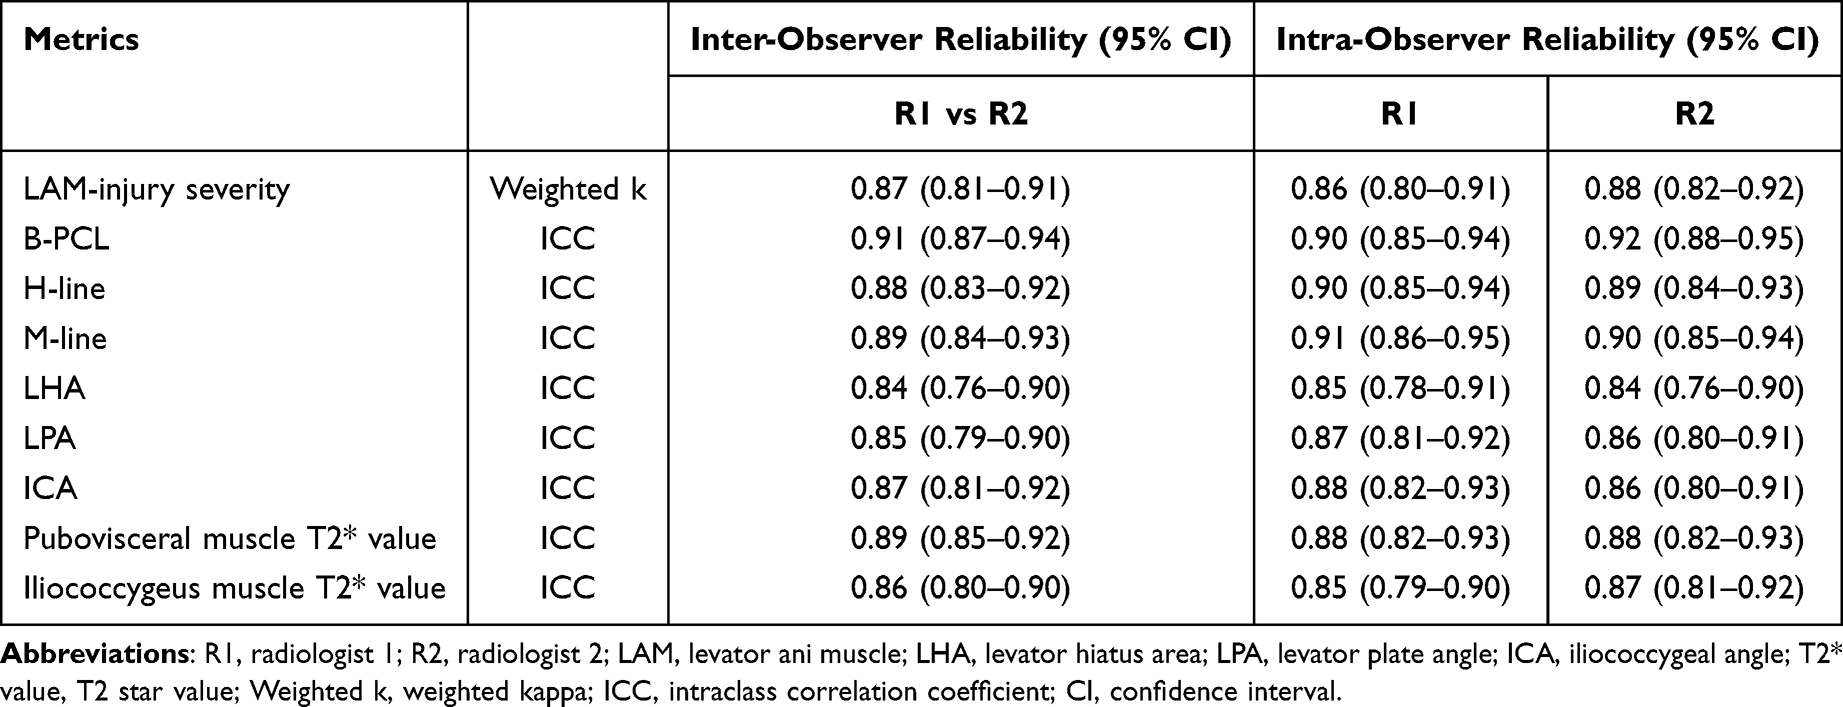 |
Table 4 Inter- and Intra-Observer Reliability for Each Metric |
Organ Position Assessment
The B-PCL measured during the maximum Valsalva maneuver was significantly greater in the stage III–IV group compared with the non-stage III–IV group (P < 0.05). By contrast, the B-PCL at rest did not differ significantly between the two groups (Table 5).
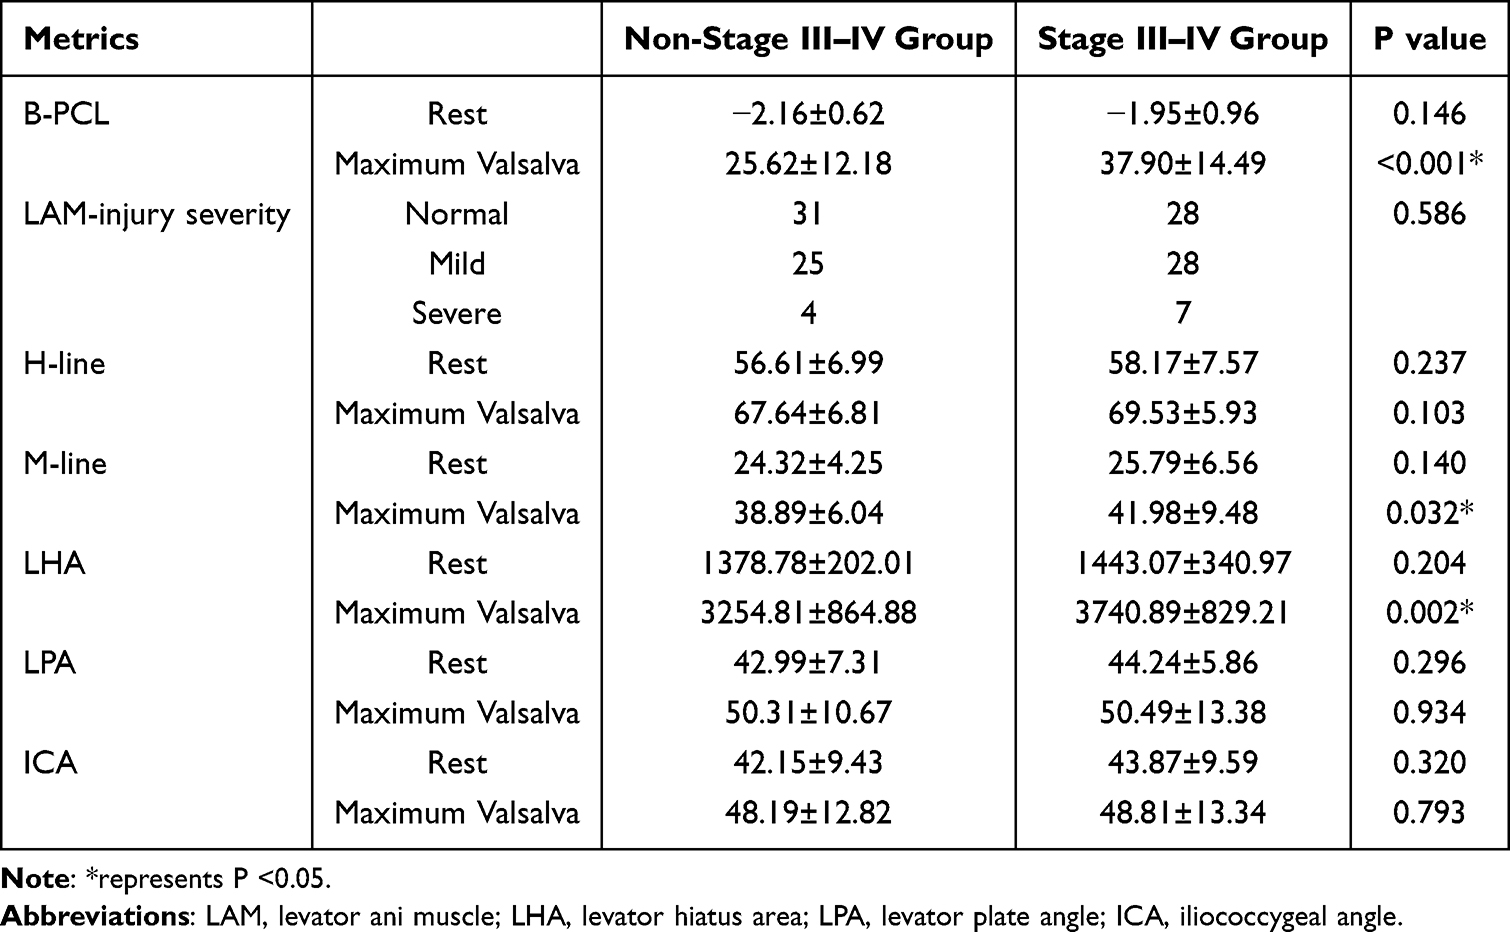 |
Table 5 Comparison of Organ Position and Pelvic-Floor Supportive-Structure Morphological Metrics Between the Non-Stage III–IV and Stage III–IV Groups |
Pelvic-Floor Supportive-Structure Morphological Assessment
Assessment of LAM-injury severity: No significant difference in the severity of LAM injury was found between the two groups (P > 0.05) (Table 5).
Pelvic-floor supportive-structure function assessment: During the maximum Valsalva maneuver, the M-line and LHA were significantly greater in the stage III–IV group compared with the non-stage III–IV group (P < 0.05). No significant differences were observed between the two groups in terms of the H-line, M-line, LHA, LPA, or ICA at rest or the H-line, LPA, or ICA at maximum Valsalva (P > 0.05) (Table 5).
Quantitative Assessment if LAM T2* Values
The T2* value of the pubovisceral muscle was significantly lower in the stage III–IV group compared with the non-stage III–IV group (P < 0.05). By contrast, no significant difference was noted in the iliococcygeus T2* value between the two groups (P > 0.05) (Table 6).
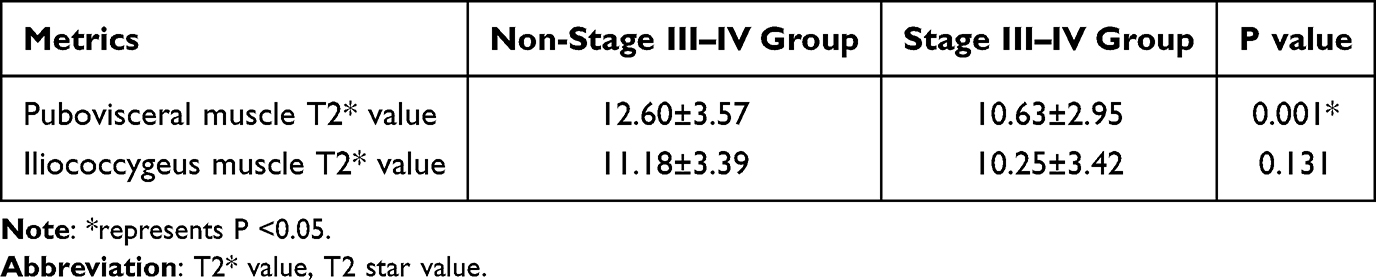 |
Table 6 Comparison of T2* Values Between the Pubovisceral and Iliococcygeus Muscles |
Correlation Between Metrics with Statistically Significant Inter-Group Differences and Ba
Spearman correlation analysis demonstrated that age, M-line at maximum Valsalva, and LHA at maximum Valsalva were weakly positively correlated with Ba (r = 0.188, 0.201, and 0.276, respectively; P < 0.05). The B-PCL measured during maximum Valsalva exhibited a moderate positive correlation with Ba (r = 0.564, P < 0.001). Pubovisceral muscle T2* value was weakly negatively correlated with Ba (r = –0.269, P < 0.05). No significant correlation was observed between the PFDI-20 score and Ba (r = 0.072, P = 0.426) (Table 7).
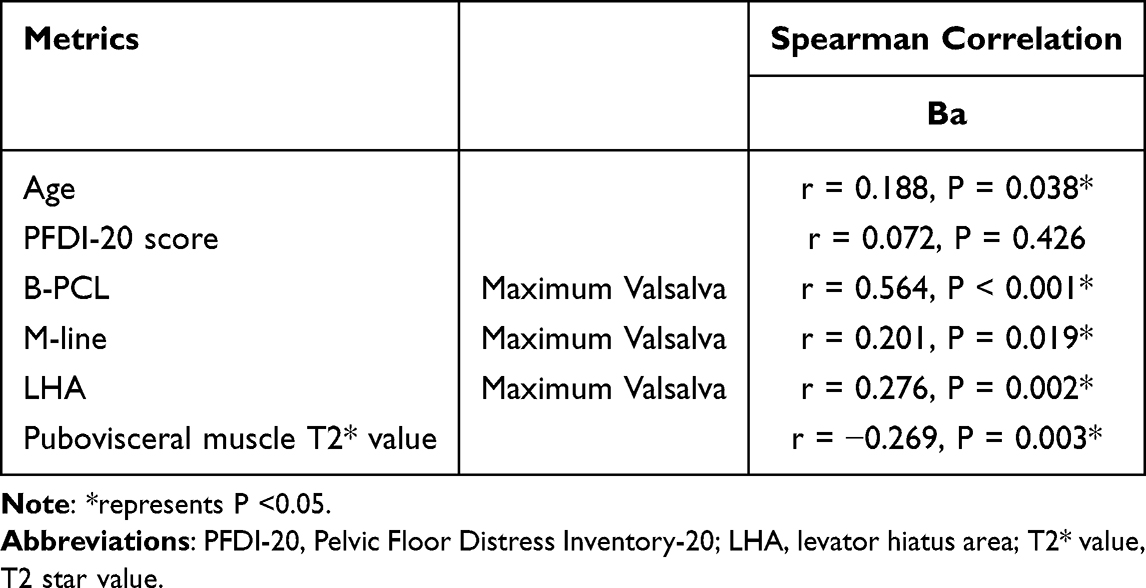 |
Table 7 Spearman Correlations of Age, PFDI-20 Score, and B-PCL Pelvic-Floor Measurements, Pubovisceral Muscle T2* Value with ba |
ROC Curve Analysis of Predictive Models
Logistic regression models were constructed to evaluate the diagnostic performance for anterior-compartment clinical POP stages III–IV. A baseline characteristic–based model was developed using age and PFDI-20 score as independent variables. A static–dynamic MRI–based model incorporated M-line, LHA, and B-PCL measured at maximum Valsalva, whereas a T2* mapping–based model included only the pubovisceral muscle T2* value. Age, PFDI-20 score, M-line, LHA, and B-PCL at maximum Valsalva were used to construct a model combining baseline characteristics with a static–dynamic MRI parameters, whereas age, PFDI-20 score, and pubovisceral muscle T2* value were used to construct a model combining baseline characteristics with T2* mapping. A multiparametric MRI–based model, integrating M-line, LHA, B-PCL at maximum Valsalva, and T2* values, was also developed, and a final model combined baseline characteristics with the multiparametric MRI parameters (age, PFDI-20 score, M-line, LHA, B-PCL, and T2* values). ROC curve analysis and AUC comparison demonstrated that the model combining baseline characteristics with multiparametric MRI parameters achieved the highest AUC (0.811) (Figure 5 and Table 8). However, the DeLong test indicated no significant difference between this AUC and that of the multiparametric MRI-based model (AUC = 0.802; P = 0.370) (Table 9). Given that the multiparametric MRI-based model included fewer variables and adhered to the principle of model parsimony, it was regarded as the optimal model.
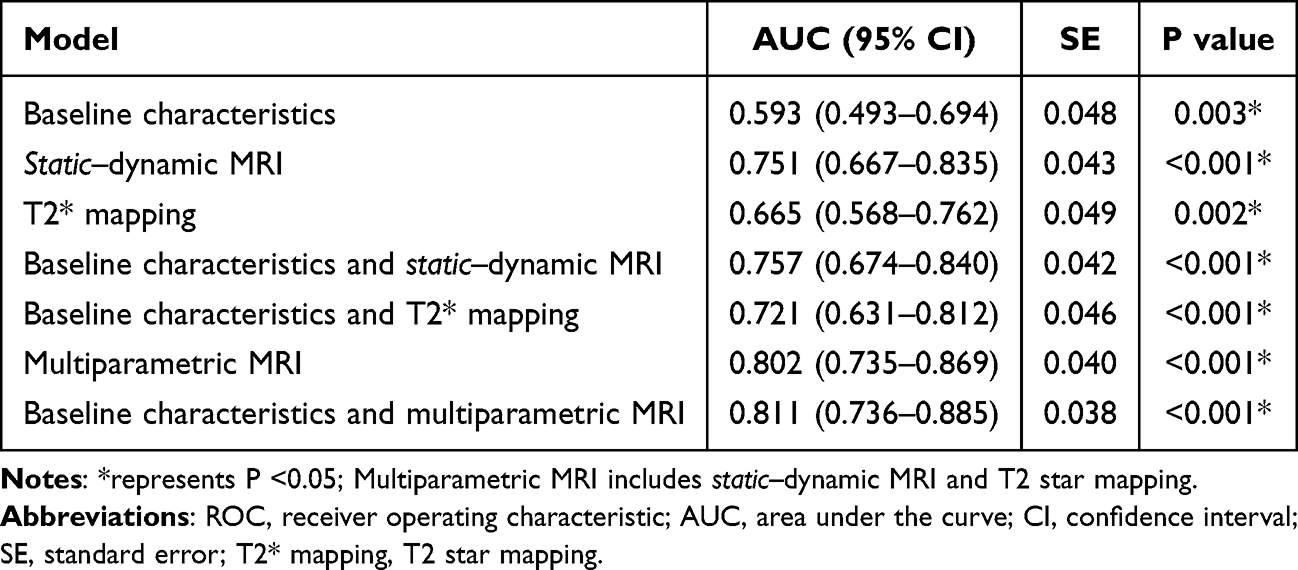 |
Table 8 ROC Curve Analysis of Predictive Models |
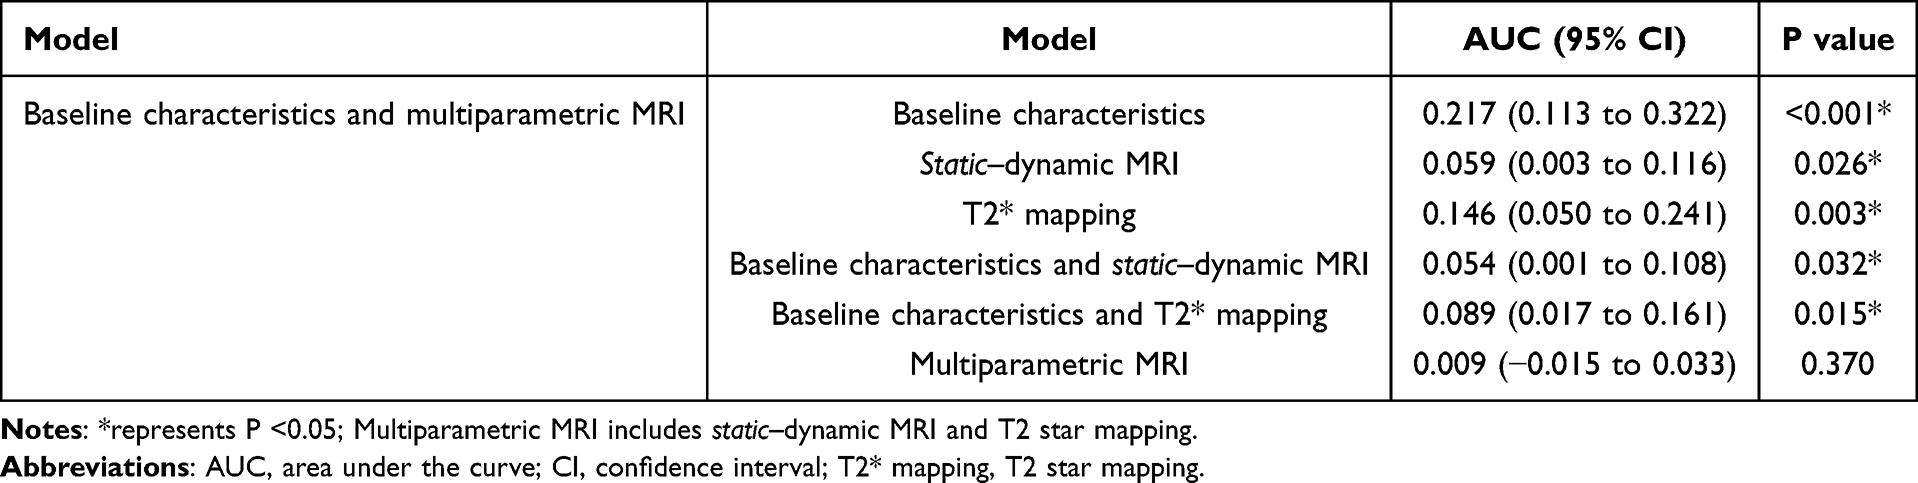 |
Table 9 DeLong Test Comparison of AUC Between Baseline Characteristics and Multiparametric MRI-Based Model and Other Predictive Models |
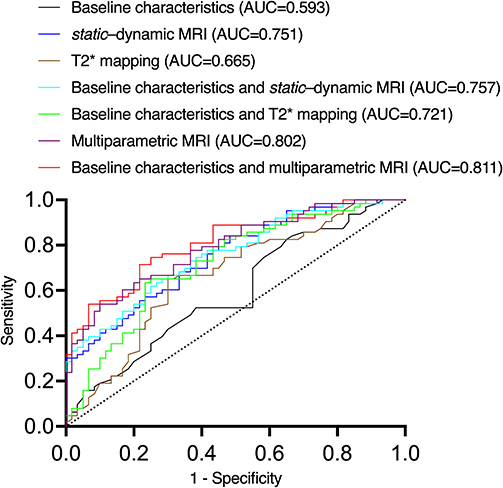 |
Figure 5 ROC curves and AUC for each predictive model. Multiparametric MRI includes static–dynamic MRI and T2 star mapping. Abbreviations: ROC, receiver operating characteristic; AUC, area under the curve; T2* mapping, T2 star mapping. |
Comparison of Performance Between the Optimal Model and the “Rule of Three”
The multiparametric MRI-based model demonstrated a sensitivity of 0.714, representing an increase of 0.317 compared with the “rule of three” (P < 0.001). Its specificity was 0.783, reflecting a decrease of 0.134 compared with the “rule of three” (P < 0.001). The overall accuracy of the multiparametric MRI-based model was 0.748, an increase of 0.098 compared with the “rule of three” (P = 0.012) (Table 10).
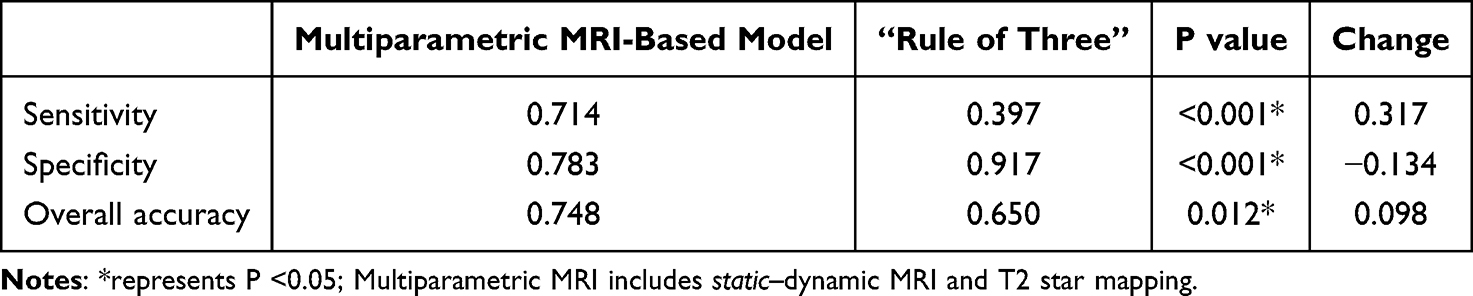 |
Table 10 Performance Comparison Between the Multiparametric MRI-Based Model and the “Rule of Three” |
Discussion
Our study demonstrated that, compared with the non-stage III–IV group, the anterior-compartment clinical POP stage III–IV group were older; had higher PFDI-20 scores; larger B-PCL, M-line, and LHA at maximum Valsalva; and lower pubovisceral muscle T2* value (all P < 0.05). Age, B-PCL, M-line, and LHA at maximum Valsalva were positively correlated with Ba, whereas the pubovisceral muscle T2* value was negatively correlated with Ba (all P < 0.05). The conventional “rule of three” demonstrated limited diagnostic performance for anterior-compartment clinical POP stage III–IV. A predictive model based on multiparametric pelvic-floor MRI was constructed, achieving an AUC of 0.802, and demonstrated superior performance compared with the “rule of three”.
Regarding baseline characteristics, Kırat et al34 conducted an observational study on a cohort of 1506 women attending gynecology outpatient clinics at two tertiary university hospitals and found that patients with higher POP-Q stages were older than those with lower stages. Multivariable logistic regression indicated a weak positive association between age and POP-Q stage (odds ratio = 1.18). Our findings are consistent with theirs, showing that the anterior-compartment clinical POP stage III–IV group was older than the non-stage III–IV group and that age was weakly positively correlated with Ba. This association may reflect the contribution of advancing age to the development and progression of POP; with aging, estrogen levels decline, and the degeneration of pelvic-floor muscles and connective tissue weaken pelvic-floor support, leading to progressive organ displacement.35 Additionally, our results demonstrated that the stage III–IV group had higher PFDI-20 scores compared with the non-stage III–IV group, which is consistent with the findings of Barber,36 indicating a greater symptom burden in patients with stage III–IV POP.
Our results demonstrated that the stage III–IV group exhibited a larger B-PCL at maximum Valsalva than the non-stage III–IV group, consistent with the reports of previous studies.31,32 Swamy et al31 retrospectively analyzed the imaging and clinical data of 68 patients who underwent both pelvic-floor MRI and POP-Q physical examination and found an almost exact point-to-point correspondence between Ba and the bladder based on midsagittal MRI, allowing for consistent visualization and measurement. Based on these findings, a larger Ba in the stage III–IV group compared with the non-stage III–IV group corresponds to a greater descent of the bladder base at maximum Valsalva on pelvic-floor MRI, resulting in a larger B-PCL measured on midsagittal images. The moderate positive correlation between B-PCL at maximum Valsalva and Ba, consistent with the report by Zhang et al,32 indicates that despite the limitations of supine positioning during pelvic-floor MRI, the bladder base descent measured at maximum intra-abdominal pressure can partially reflect the degree of anterior-compartment organ prolapse assessed by POP-Q physical examination.
Regarding LAM-injury severity, DeLancey et al37 reported a case-control study including 151 women with POP and 135 women without POP. They observed a higher prevalence of severe LAM injury in women with POP. The LAM, a unique striated muscle, plays a crucial role in maintaining pelvic-organ stability by reducing the load on connective tissues that connect the organs to the pelvis, thereby effectively supporting the pelvic organs. Injury to the LAM compromises pelvic-floor support, making organs more susceptible to prolapse.38 However, in the comparison of LAM injury between the non-stage III–IV and stage III–IV groups of anterior-compartment clinical POP, no significant difference was observed. This may indicate that once POP reaches clinical stages, the anatomical integrity of the LAM remains relatively stable, and pelvic-floor support is affected primarily through functional weakening rather than further structural impairment.
The LHA reflects the ability of the LAM to close the levator hiatus; an increased LHA indicates impaired LAM function. The M-line represents the degree of pelvic-floor relaxation, with increased M-line indicating weakened pelvic-floor supportive-structure function. Zhao et al38 reported that primiparous women with postpartum POP exhibited larger LHA and M-line measurements at maximum Valsalva compared with normal primiparous women. In the present study, anterior-compartment clinical POP was categorized into non-stage III–IV and stage III–IV groups. The stage III–IV group demonstrated significantly larger LHA and M-line values at maximum Valsalva than the non-stage III–IV group. This finding likely reflects more pronounced LAM functional impairment in patients with stage III–IV POP.18 At maximum Valsalva, when intra-abdominal pressure is greatest, impaired LAM function limits effective closure of the levator hiatus, resulting in enlargement of the LHA. In addition, the pelvic floor in patients with stage III–IV POP is likely more relaxed than in those with non-stage III–IV disease. During maximum Valsalva, the increased intra-abdominal pressure accentuates pelvic-floor descent, leading to a greater downward displacement of the pelvic floor and a larger M-line. Correlation analysis revealed weak positive correlations between LHA and M-line at maximum Valsalva maneuver and Ba, indicating that these parameters, when measured under maximum intra-abdominal pressure on pelvic-floor MRI, cannot independently or precisely reflect the severity of anterior-compartment organ prolapse as assessed by POP-Q physical examination.
T2* mapping imaging is particularly sensitive to paramagnetic substances generated by intramuscular hemorrhage in non-acute muscle injury and to collagen-fiber hyperplasia associated with muscle fibrosis.19,20 Accordingly, the T2* value primarily reflects intramuscular hemosiderin content and the extent of fibrosis. To our knowledge, Li et al21 were the first to report, in 2023, that T2* mapping could serve as an effective imaging modality for assessing LAM injury in primiparous women following vaginal delivery. Their study demonstrated that primiparous women with reduced LAM strength at 6 weeks postpartum exhibited lower iliococcygeus T2* values than nulliparous women, suggesting the occurrence of LAM hematoma during delivery. During the final stage of hematoma evolution, soluble methemoglobin is phagocytosed by macrophages and converted into hemosiderin, which persists for an extended period and leads to a reduction in T2* values due to strong local magnetic susceptibility effects. Based on these observations, anterior-compartment clinical POP was stratified into non-stage III–IV and stage III–IV groups, revealing lower pubovisceral muscle T2* values in the stage III–IV group. This finding may indicate increased hemosiderin deposition or more advanced fibrosis within the pubovisceral muscle in patients with stage III–IV; however, confirmation through ex vivo histological and biochemical analyses is required. Correlation analysis demonstrated a weak negative correlation between pubovisceral muscle T2* values and Ba, suggesting that T2* values alone cannot independently or accurately reflect the severity of anterior-compartment organ prolapse as assessed by POP-Q examination.
The model integrating baseline characteristics with multiparametric MRI achieved the highest AUC (0.811); however, DeLong test demonstrated no significant difference between this AUC and that of the multiparametric MRI-based model (AUC = 0.802). Given that the multiparametric MRI-based model included fewer variables and adhered to principle of model parsimony, it was selected as the optimal model. The “rule of three” demonstrated a sensitivity of 0.397, a specificity of 0.917, and an overall accuracy of 0.650 for diagnosing anterior-compartment POP stages III–IV. The low sensitivity was primarily attributable to staging underestimation (30.89% of patients), which is presumably related to the inherent limitations of patient positioning during pelvic-floor MRI. Although the specificity of the multiparametric MRI-based model was lower than that of the “rule of three” (0.783 vs 0.917; decrease of 0.134), its sensitivity was substantially higher (0.714 vs 0.397; increase of 0.317), and its overall accuracy improved to 0.748 (increase of 0.098). These findings indicate that the multiparametric MRI-based model effectively reduces staging underestimation associated with the “rule of three” and demonstrates superior overall diagnostic performance.
Apart from the “rule of three”, previous studies have proposed pelvic-floor MRI-based models for diagnosing clinical POP.24,25 To our knowledge, the present study is the first modelling investigation to further stratify confirmed clinical POP into non-stage III–IV and stage III–IV categories and the first to incorporate T2* mapping into pelvic-floor MRI-based modeling. A multiparametric MRI-based, multi-metric diagnostic model was developed and demonstrated superior performance compared with the “rule of three”. Owing to its complexity and the substantial clinical experience required for mastery, POP-Q utilization rates in Chinese primary and secondary hospitals are reported to be only 20.0% and 35.4%, respectively.13 Therefore, this model may serve as a potential imaging tool for more precise staging of anterior-compartment clinical POP in primary and secondary hospitals. Furthermore, future studies could extend the application of T2* mapping to other clinically relevant issues, such as investigating correlations among imaging metrics derived from T2* mapping and POP symptoms, treatment decisions, and prognostic outcomes, thereby providing more comprehensive imaging-based references for the precision diagnosis and treatment of POP.
This study has some limitations. First, although the sample size met the basic requirement for binary logistic regression modelling (≥ 10 events per independent variable), it remained relatively small and was derived from a single center. Consequently, the statistical power and generalizability of the model may be limited, and large, multicenter studies are required for further validation and optimization. Second, there was a significant age difference between non-stage III–IV and stage III–IV groups. Because the stage III–IV group comprised older patients, the potential for increased muscle atrophy must be acknowledged, because this may have influenced the results and the overall assessment of muscle damage. Third, the cross-sectional study design allowed only for the assessment of associations between variables showing intergroup differences and Ba; causal relationships could not be established, thereby limiting further interpretation of the model.
Conclusion
In summary, the conventional “rule of three” demonstrates limited performance in diagnosing clinical stage III–IV anterior-compartment POP. A multi-metric diagnostic model based on multiparametric pelvic-floor MRI was developed and showed superior performance compared with single-metric “rule of three”. This model may provide an objective and clinically valuable imaging-based reference to support more precise staging and management decisions for anterior-compartment clinical POP, particularly in primary and secondary hospitals. However, external validation and optimization are still required before clinical application.
Institutional Review Board Statement
The study was conducted in accordance with the Declaration of Helsinki, and approved by the Institutional Ethics Committee of Jingzhou Hospital Affiliated to Yangtze University (reference number: 2025-111-01). Written informed consent was obtained before patients’ participation.
Data Sharing Statement
The data for this study are available from the corresponding author Furong Lv upon reasonable request.
Acknowledgments
We would like to thank Editage (www.editage.cn) for English language editing.
Funding
This work was supported by the Science and Technology Bureau of Jingzhou City (grant number 2024HD51), and the Open Fund of Hubei Key Laboratory of Tumor Microenvironment and Immunotherapy (grant number 2025ZLKF2-10).
Disclosure
The authors report no conflicts of interest in this work.
References
1. Haylen BT, Maher CF, Barber MD, et al. An international urogynecological association (IUGA) / international continence society (ICS) joint report on the terminology for female pelvic organ prolapse (POP). Neurourol Urodyn. 2016;35(2):137–16. doi:10.1002/nau.22922
2. Barber MD, Maher C. Epidemiology and outcome assessment of pelvic organ prolapse. Int Urogynecol J. 2013;24(11):1783–1790. doi:10.1007/s00192-013-2169-9
3. Yuk JS, Lee JH, Hur JY, Shin JH. The prevalence and treatment pattern of clinically diagnosed pelvic organ prolapse: a Korean national health insurance database-based cross-sectional study 2009-2015. Sci Rep. 2018;8(1):1334. doi:10.1038/s41598-018-19692-5
4. Dieter AA, Halder GE, Pennycuff JF, et al. Patient-reported outcome measures for use in women with pelvic organ prolapse: a systematic review. Obstet Gynecol. 2023;141(6):1098–1114. doi:10.1097/AOG.0000000000005212
5. Pang H, Zhang L, Han S, et al. A nationwide population-based survey on the prevalence and risk factors of symptomatic pelvic organ prolapse in adult women in China - a pelvic organ prolapse quantification system-based study. BJOG. 2021;128(8):1313–1323. doi:10.1111/1471-0528.16675
6. Fatton B, de Tayrac R, Letouzey V, Huberlant S. Pelvic organ prolapse and sexual function. Nat Rev Urol. 2020;17(7):373–390. doi:10.1038/s41585-020-0334-8
7. Collins SA, O’Shea M, Dykes N, et al. International urogynecological consultation: clinical definition of pelvic organ prolapse. Int Urogynecol J. 2021;32(8):2011–2019. doi:10.1007/s00192-021-04875-y
8. National institute for health and care excellence: guidelines (National institute for health and care excellence (NICE) Copyright © NICE 2019. 2019.
9. Ko KJ, Lee KS. Current surgical management of pelvic organ prolapse: strategies for the improvement of surgical outcomes. Investig Clin Urol. 2019;60(6):413–424. doi:10.4111/icu.2019.60.6.413
10. Liang L, Ao S, Wang S, et al. Efficacy and safety of Le Fort colpocleisis in the treatment of stage III-IV pelvic organ prolapse. BMC Womens Health. 2024;24(1):618. doi:10.1186/s12905-024-03459-4
11. Muir TW, Stepp KJ, Barber MD. Adoption of the pelvic organ prolapse quantification system in peer-reviewed literature. Am J Obstet Gynecol. 2003;189(6):1632–1635. discussion 1635-6. doi:10.1016/j.ajog.2003.09.010
12. Bump RC, Mattiasson A, Bo K, et al. The standardization of terminology of female pelvic organ prolapse and pelvic floor dysfunction. Am J Obstet Gynecol. 1996;175(1):10–17. doi:10.1016/s0002-9378(96)70243-0
13. Wang YT, Jiang JY, Han JS. A review of the pelvic organ prolapse quantification system in China. Int Urogynecol J. 2016;27(2):287–290. doi:10.1007/s00192-015-2830-6
14. Riss P, Dwyer PL. The POP-Q classification system: looking back and looking forward. Int Urogynecol J. 2014;25(4):439–440. doi:10.1007/s00192-013-2311-8
15. El Sayed RF, Alt CD, Maccioni F, et al. Magnetic resonance imaging of pelvic floor dysfunction - joint recommendations of the ESUR and ESGAR pelvic floor working group. Eur Radiol. 2017;27(5):2067–2085. doi:10.1007/s00330-016-4471-7
16. Lipetskaia L, Gupta A, Cheung RYK, et al. International urogynecological consultation chapter 2.2: imaging in the diagnosis of pelvic organ prolapse. Int Urogynecol J. 2025;36(4):759–781. doi:10.1007/s00192-024-05948-4
17. Zhang C, Ma L, Li X, et al. Levator ani muscle assessment and its correlation with recurrence of pelvic organ prolapse: a pelvic floor MRI study. Clin Radiol. 2025;85:106870. doi:10.1016/j.crad.2025.106870
18. Rostaminia G, White D, Hegde A, Quiroz LH, Davila GW, Shobeiri SA. Levator ani deficiency and pelvic organ prolapse severity. Obstet Gynecol. 2013;121(5):1017–1024. doi:10.1097/AOG.0b013e31828ce97d
19. van Oorschot JW, Gho JM, van Hout GP, et al. Endogenous contrast MRI of cardiac fibrosis: beyond late gadolinium enhancement. J Magn Reson Imag. 2015;41(5):1181–1189. doi:10.1002/jmri.24715
20. Lee YS, Kwon ST, Kim JO, Choi ES. Serial MR imaging of intramuscular hematoma: experimental study in a rat model with the pathologic correlation. Korean J Radiol. 2011;12(1):66–77. doi:10.3348/kjr.2011.12.1.66
21. Li Y, Gong T, Lin X, et al. Evaluating changes in the strength of the levator ani muscle after vaginal delivery using T2-parameter mapping. Eur J Radiol. 2023;168:111137. doi:10.1016/j.ejrad.2023.111137
22. Woodfield CA, Hampton BS, Sung V, Brody JM. Magnetic resonance imaging of pelvic organ prolapse: comparing pubococcygeal and midpubic lines with clinical staging. Int Urogynecol J Pelvic Floor Dysfunct. 2009;20(6):695–701. doi:10.1007/s00192-009-0865-2
23. Rechi-Sierra K, Sanchez-Ballester F, Garcia-Ibanez J, et al. Magnetic resonance imaging to evaluate anterior pelvic prolapse: h line is the key. Neurourol Urodyn. 2021;40(4):1042–1047. doi:10.1002/nau.24665
24. Yang J, Zhang K, Han J, Wang Y, Yao Y, Zhou Y. Comparison of the anterior pelvis and levator ani muscle on MRI in women with and without anterior pelvic organ prolapse. Int Urogynecol J. 2023;34(8):1885–1890. doi:10.1007/s00192-023-05464-x
25. Ghafoor S, Beintner-Skawran S, Betschart C, Winklehner T, Reiner CS. Assessment of pelvic organ prolapse with the pelvic inclination correction system: defining the normal range and threshold to pathology. Abdom Radiol. 2024;49(6):1996–2007. doi:10.1007/s00261-024-04222-x
26. Ma Y, Xu T, Zhang Y, Mao M, Kang J, Zhu L. Validation of the Chinese version of the pelvic floor distress inventory-20 (PFDI-20) according to the COSMIN checklist. Int Urogynecol J. 2019;30(7):1127–1139. doi:10.1007/s00192-018-3847-4
27. You C, Zhao Y, Zhang C, Chen M, Shen W. Pelvic floor parameters predict postpartum stress urinary incontinence: a prospective MRI study. Insights Imag. 2023;14(1):160. doi:10.1186/s13244-023-01488-5
28. Li N, Cui C, Cheng Y, Wu Y, Yin J, Shen W. Association between magnetic resonance imaging findings of the pelvic floor and de novo stress urinary incontinence after vaginal delivery. Korean J Radiol. 2018;19(4):715–723. doi:10.3348/kjr.2018.19.4.715
29. Triadyaksa P, Oudkerk M, Sijens PE. Cardiac T2* mapping: techniques and clinical applications. J Magn Reson Imag. 2020;52(5):1340–1351. doi:10.1002/jmri.27023
30. DeLancey JO, Kearney R, Chou Q, Speights S, Binno S. The appearance of levator ani muscle abnormalities in magnetic resonance images after vaginal delivery. Obstet Gynecol. 2003;101(1):46–53. doi:10.1016/s0029-7844(02)02465-1
31. Swamy N, Bajaj G, Olliphant SS, et al. Pelvic floor imaging with MR defecography: correlation with gynecologic pelvic organ prolapse quantification. Abdom Radiol. 2021;46(4):1381–1389. doi:10.1007/s00261-020-02476-9
32. Zhang C, Li X, Xie B, et al. A novel pelvic magnetic resonance imaging measurement for pelvic organ prolapse evaluation. Am J Obstet Gynecol. 2025;232(4):383e1–383e8. doi:10.1016/j.ajog.2024.10.007
33. Schober P, Boer C, Schwarte LA. Correlation coefficients: appropriate use and interpretation. Anesth Analg. 2018;126(5):1763–1768. doi:10.1213/ANE.0000000000002864
34. Kırat S, Tasın C, Bilekdemir AM, Tok D, Tok CE. From anatomy to emotion: how pelvic organ prolapse reshapes women’s quality of life. Clin Exp Obstet Gynecol. 2025;52(5). doi:10.31083/CEOG37796
35. Ron NJ, Dolbinski SC, Hodonicky EG, et al. Associations between running mechanics, functional lower extremity strength, and stress urinary incontinence in parous female runners. J Womens Pelvic Health Phys Ther. 2024;48(3):147–153. doi:10.1097/jwh.0000000000000302
36. Barber MD. Measuring pelvic organ prolapse: an evolution. Int Urogynecol J. 2024;35(5):967–976. doi:10.1007/s00192-024-05798-0
37. DeLancey JO, Morgan DM, Fenner DE, et al. Comparison of levator ani muscle defects and function in women with and without pelvic organ prolapse. Obstet Gynecol. 2007;109(2 Pt 1):295–302. doi:10.1097/01.AOG.0000250901.57095.ba
38. Zhao Y, Zhang C, Cui C, Zhang X, Zhao Q, Shen W. Longitudinal changes in pelvic organ support among primiparas with postpartum pelvic organ prolapse: a follow-up magnetic resonance imaging study. Int J Gynaecol Obstet. 2023;162(2):514–524. doi:10.1002/ijgo.14718
 © 2026 The Author(s). This work is published and licensed by Dove Medical Press Limited. The
full terms of this license are available at https://www.dovepress.com/terms
and incorporate the Creative Commons Attribution
- Non Commercial (unported, 4.0) License.
By accessing the work you hereby accept the Terms. Non-commercial uses of the work are permitted
without any further permission from Dove Medical Press Limited, provided the work is properly
attributed. For permission for commercial use of this work, please see paragraphs 4.2 and 5 of our Terms.
© 2026 The Author(s). This work is published and licensed by Dove Medical Press Limited. The
full terms of this license are available at https://www.dovepress.com/terms
and incorporate the Creative Commons Attribution
- Non Commercial (unported, 4.0) License.
By accessing the work you hereby accept the Terms. Non-commercial uses of the work are permitted
without any further permission from Dove Medical Press Limited, provided the work is properly
attributed. For permission for commercial use of this work, please see paragraphs 4.2 and 5 of our Terms.
Recommended articles
Preliminary Retrospective Analysis of X-Ray, CT, and MRI Imaging Features of Brucellar Spondylodiscitis Diagnosis
Pu Y, Fu XW, Qi M, Wei JL, Shan QL, Gan W, Cun XH, Li X
Journal of Inflammation Research 2025, 18:16891-16905
Published Date: 3 December 2025