Back to Journals » International Journal of Nanomedicine » Volume 21
Multifunctional Graphene Oxide Quantum Dot Nanoformulation with Key Immunomodulation for Effective Anticancer Therapy in Mice Model
Authors Premji TP ![]() , Lu YJ
, Lu YJ ![]() , Dash BS
, Dash BS ![]() , Das S, Chen JP
, Das S, Chen JP ![]()
Received 12 January 2026
Accepted for publication 10 March 2026
Published 25 March 2026 Volume 2026:21 584361
DOI https://doi.org/10.2147/IJN.S584361
Checked for plagiarism Yes
Review by Single anonymous peer review
Peer reviewer comments 2
Editor who approved publication: Professor Farooq A. Shiekh
Thejas P Premji,1,* Yu-Jen Lu,2,3,* Banendu Sunder Dash,1,* Suprava Das,1 Jyh-Ping Chen1,2,4,5
1Department of Chemical and Materials Engineering, Chang Gung University, Taoyuan, Taiwan; 2Department of Neurosurgery, Chang Gung Memorial Hospital at Linkou, Taoyuan, Taiwan; 3School of Traditional Chinese Medicine, College of Medicine, Chang Gung University, Taoyuan, Taiwan; 4Research Center for Food and Cosmetic Safety, College of Human Ecology, Chang Gung University of Science and Technology, Taoyuan, Taiwan; 5Department of Materials Engineering, Ming Chi University of Technology, New Taipei City, Taiwan
*These authors contributed equally to this work
Correspondence: Jyh-Ping Chen, Department of Chemical and Materials Engineering, Chang Gung University, Taoyuan, Taiwan, Email [email protected]
Introduction: To overcome limitations in melanoma therapy by developing a targeted nanoplatform based on reduced graphene oxide quantum dot (rGOQD) that integrates photothermal therapy (PTT), chemodynamic therapy (CDT), and immune modulation.
Methods: The multifunctional rGOQD/MnO2/CpG/Q/FA system combines rGOQD for efficient near-infrared (NIR) photothermal conversion efficiency, MnO2 as a Fenton-like catalyst for hydroxyl radical (•OH) generation, quercetin (Q) to inhibit heat shock protein 70 (HSP70) and enhance PTT sensitivity, and CpG-ODN as a TLR9 agonist for immune activation. Folic acid (FA) enables targeted delivery to folate receptor-overexpressing B16F10 melanoma cells. Comprehensive in vitro and in vivo studies assessed photothermal performance, reactive oxygen species (ROS) generation, macrophage polarization, cytokine release, and anti-tumor efficacy.
Results: The nanoplatform exhibited strong PTT/CDT effects, efficient glutathione (GSH) depletion, and enhanced intracellular uptake via FA targeting. It induced apoptosis and immunogenic cell death (ICD) characterized by calreticulin (CRT) exposure and high mobility group protein B1 (HMGB1) release, while promoting macrophage repolarization to the M1 phenotype. In vivo, rGOQD/MnO2/CpG/Q/FA combined with near infrared (NIR) irradiation significantly inhibits tumor growth, prolongs survival, and activates systemic immunity without systemic toxicity in mice model.
Conclusion: This targeted nanoplatform offers a promising strategy to integrate localized PTT/CDT with systemic immune modulation, addressing key limitations of current melanoma therapies.
Keywords: cancer therapy, near infrared, nanoparticle, immunoadjuvant, photothermal, chemodynamic
Graphical Abstract:

Introduction
Cancer arises from uncontrolled cell growth and immune evasion, and recent advancements in understanding the immune system have shed light on cancer treatment methods.1 Cancer Immunotherapy harnesses the body’s immune system and has transformed cancer treatment, albeit still facing challenges. Cancer immunotherapy aims to stimulate the immune response against tumors and address cancer cell escape mechanisms, where immune-resistant cancer cells evade immune editing and dysfunction of the recognition and attack.2 As immunotherapy rapidly evolves, various methods have emerged to combat tumor growth, such as cancer vaccines, chimeric antigen receptor T cells, and immune checkpoint inhibitors (ICI).3 Nonetheless, vaccines often show low immunogenicity, inconsistent stability, and considerable degradation inside the body. They tend to trigger only a brief immune response and fail to produce an effective therapeutic outcome.4 Eliminating tumors with a single antigen-limited immune response seems unlikely due to the heterogeneity of cancer cell subtypes. Furthermore, due to the diverse and complex behavior of tumors, checkpoint inhibitors for solid tumors have a response rate of only 20–30%, making many tumors insensitive to ICI therapy.5 This highlights a significant clinical gap where a nanomedicine approach using multifunctional nanoplatforms can fill by offering a versatile solution capable of overcoming these limitations.6
Tumor-associated macrophages (TAMs) are key immune cells in the tumor microenvironment (TME), significantly influencing the progression, metastasis, and resistance of tumors.7 Macrophages are specialized phagocytes that capture large particles, including debris, pathogens, and apoptotic cells, to maintain homeostasis. TAMs are classified into two major subsets: M1 and M2 phenotypes.8 M1 macrophages secrete proinflammatory cytokines such as TNF-α, IL-6, and IL-12 to facilitate direct tumor attack. Conversely, M2 macrophages promote tumor growth and immunosuppression by secreting anti-inflammatory cytokines. The resident TAMs in the TME primarily exhibit the M2 phenotype. Therefore, strategies aimed at repolarizing these macrophages to the M1 phenotype or depleting M2 TAMs represent promising therapeutic approaches in cancer treatment.9 TAMs can be reprogrammed using a variety of cytokines, immunological agonists, and inhibitors.10
Immunoadjuvants, which enhance immune responses, are vital in stimulating and activating immune cells effectively.11 Toll-like receptors (TLRs) present in the endosomes of human immune cells can detect bacterial DNA and viral RNA.12 Synthetic oligodeoxynucleotides (ODN) containing cytosine-phosphorothioate-guanine (CpG) can replicate the immune-stimulating effects of bacterial DNA. The CpG-ODN is internalized by cells through the process of adsorptive endocytosis. The binding of CpG-ODN to the endosomal TLR-9 within the intracellular compartment of the macrophage can induce an innate immunostimulatory response and lead to the generation of proinflammatory cytokines.13 In addition, the interaction of TLR-9 with CpG-ODN can also lead to the subsequent activation of antigen-presenting cells, thereby activating innate immune responses.14 This pathway considerably boosts CD8+ T-cell infiltration, potentially leading to a 2- to 3-fold increase after CpG-ODN delivery. Activated macrophages trigger the adaptive immune response by presenting antigens to T cells, leading to the proliferation of cytotoxic T lymphocytes (CTLs) in the lymph node draining the tumor.15 The CD8+ CTLs are a key part of cell-mediated immunity against tumors, while CD4+ helper T cells are crucial in supporting CD8+ CTLs, which in some cases become cytotoxic themselves.16 After leaving the lymph node, activated cytotoxic T cells can travel through the bloodstream and reach the tumor site to kill the cancer cells by releasing cytokines, stimulating CTLs, and preventing tumor metastasis.17
Tumors can evade and inhibit the immune system, but combination therapies can target various signaling pathways and boost patient response rates. Therefore, combining immunotherapy with alternative therapeutic approaches can augment the effectiveness of cancer treatment by minimizing immunosuppression, activating various pathways, and providing sustained treatment efficacy to modulate the tumor microenvironment.18 When cancer cells experience cellular stress, apoptosis, necrosis, or cellular damage, they tend to induce immunogenic cell death (ICD). The ICD triggers the release of signaling molecules, damage-associated molecular patterns (DAMPs), and tumor-associated antigens, which are recognizable by the immune system.19 This leads to the exposure of calreticulin (CRT) on the cell surface and the release of high mobility group box 1 (HMGB1), as well as the secretion of adenosine triphosphate (ATP) as a “find-me” signal.20 Moreover, these DAMPs activate the macrophage, further stimulating CTLs to eliminate cancer cells systematically.21
The ICD can be triggered by several therapies, including chemotherapy, photothermal therapy, and therapies based on excessive reactive oxygen species (ROS) generation (photodynamic, chemodynamic, sonodynamic, and radiotherapy).22 Chemodynamic therapy (CDT), unlike the other ROS-based treatments, does not require any external stimulation, like photodynamic therapy (laser) and sonodynamic therapy (ultrasound). In CDT, the Fenton/Fenton-like agents (iron, manganese, copper, and cobalt) catalyze the intracellular decomposition of high levels of endogenous H2O2 in cancer cells to produce the highly cytotoxic hydroxyl radical (•OH).23 This •OH can create severe oxidative damage to vital cellular components such as mitochondria and nucleus, thus inducing cell apoptosis.24 Consequently, producing cytotoxic ROS during cancer therapy can potentially boost ICD. Furthermore, studies showed that ROS generation and the resulting endoplasmic reticulum stress can jointly activate DAMPs.25
Near-infrared (NIR) light can induce hyperthermia through a photothermal agent, forming the basis of photothermal therapy (PTT).26 The hyperthermia generated can suppress tumor progression and induce apoptosis by disrupting the cytoskeleton, causing protein denaturation and DNA damage in cancer cells.27 The heat generated during PTT also creates a physical stimulus, ultimately leading to ICD. On the other hand, heat generation within the tumor region is considered to be an effective approach to enhance hydroxyl radical production, as the PTT-induced temperature rise can speed up the reaction kinetics of the Fenton-like reaction in producing more •OH.28 Therefore, PTT can elevate the efficiency of CDT. Even though mild PTT can damage cells, cancer cells frequently recover through the overexpression of heat shock proteins (HSP).29 In contrast, high temperatures may impair anti-tumor immunity. Therefore, incorporating a small molecule HSP inhibitor with mild PTT is preferred.30 Employing a heat shock protein 70 (HSP70) inhibitor can boost the efficacy of mild PTT to effectively amplify ICD, which can be synergistically combined with CDT.31
Taken together, we aim to engineer a nanoplatform based on reduced graphene oxide quantum dots (rGOQD), which serves as a photothermal agent. This nanoplatform is integrated with the chemodynamic agent MnO2, the immunoadjuvant CpG-ODN, and quercetin, a small molecule inhibitor of HSP70, for the treatment of melanoma. This approach combines PTT, CDT, and immunotherapy. The rGOQD is synthesized through the PEI-mediated reduction of GOQD and subsequently undergoes surface modification with DSPE-PEG-MAL via its hydrophobic tail end. This is followed by the binding of the synthesized BSA-MnO2 to form rGOQD/MnO2. The CpG-ODN is immobilized onto the as-synthesized nanoparticle through electrostatic interactions with PEI in rGOQD. Finally, quercetin (Q) is incorporated onto the surface of the rGOQD through π-π stacking interactions, thereby resulting in the formation of the nanoparticle rGOQD/MnO2/CpG/Q. Previously, a different strategy was employed to construct a multifunctional PTT/CDT-based immunotherapeutic nanoplatform by integration of polymer dot-metal ion coordination and immune adjuvants.32 By self-assembly of NIR-responsive semiconducting polymer dots and TLR-7/8 agonist resiquimod (R848) using Mn2+ as a coordination agent, the nanoadjuvants was used for diagnosis and anti-tumor immunotherapy against deep-seated tumors.
The development of lysosome-targeted cancer therapy stands at the forefront of precision oncology.33 To improve intracellular uptake of drug-loaded nanocarriers into cancer cells, targeting ligands specific to tumor cell receptors can be attached to the surface of the nanocarriers for active targeting of tumor cells. This process facilitates internalization through receptor-mediated endocytosis mechanisms. Various human cancer cells commonly express a folate-binding surface receptor with a strong affinity for folic acid (FA). This glycosylphosphatidylinositol-anchored receptor is known to be overexpressed in numerous human tumors, including ovarian, breast, and skin cancers, while being significantly limited in normal tissues.34 To enhance intracellular uptake, FA can be linked via its carboxyl group to a nanocarrier to enhance receptor-mediated endocytosis. Therefore, we activate carboxylic groups in FA and bind it covalently with the amino group in bovine serum albumin (BSA) to form FA-BSA-MnO2 and synthesize rGOQD/MnO2/CpG/Q/FA for active targeting of B16F10 melanoma cells. The rGOQD is used as a photothermal agent for NIR-driven PTT while MnO2 is used for CDT by generating abundant •OH. With Q to enhance PTT by minimizing cellular thermotolerance, the PTT/CDT leads to cell apoptosis and ICD. The released DAMPs triggering M1 polarization of macrophage and stimulate pro-inflammatory cytokine secretion. CpG-ODN acts as an immunoadjuvant can also bind to TLR-9 in macrophages and result in effective immune responses by activating macrophages and releasing cytokines such as IL-6 and TNF-α. The cytokine-mediated T-cell recruitment will stimulate the adaptive immune response by activating CD8+ T cells, leading to amplified immune response and anticancer effects. This nanoplatform can unify PTT/CDT with ICD and CpG-ODN delivery for systemic immune stimulation for better tumor killing and fewer side effects.
Materials and Methods
Graphene oxide quantum dots (GOQD) were procured from XF Nano Co. (China). Branched polyethyleneimine (PEI) (800 Da), cytosine-phosphorothioate-guanine oligodeoxynucleotides (CpG-ODN) (sequence 5’TCCATgACgTTCCTgACgTT3’), quercetin (Q), 5,5’-dithiobis(2-nitrobenzoic acid) (DTNB), folic acid, L-glutathione reduced (GSH), bovine serum albumin (BSA), and methylene blue (MB) were sourced from Sigma-Aldrich. Hydroxyphenyl fluorescein (HPF) (HY-111330) and lipopolysaccharides (HY-D1056) were obtained from MedChem Express. CRT (ab92516), HMGB1 (ab79823), HSP70 ELISA Kit (ab133060), mouse IL-6 ELISA Kit (ab222503), mouse TNF-α ELISA Kit (ab208348), interleukin-4 (IL-4) (ab259406), anti-CD-80 antibody (ab62636), anti-F4/80 antibody (ab16911), goat anti-rat IgG H&L Alexa Fluor 488 (ab150157), and donkey anti-rabbit IgG H&L (Alexa Fluor 647) (ab150075) were obtained from Abcam. Dulbecco’s Modified Eagle Medium (DMEM) was sourced from Life Technologies, and fetal bovine serum (FBS) was provided by Thermo Fisher Scientific for cell culture.
The Synthesis of BSA-MnO2 and FA-BSA-MnO2
To synthesize bovine serum albumin (BSA)-reduced and stabilized MnO2 (BSA-MnO2), 64 mg of KMnO4 in 6 mL water was dropwise added to 500 mg of BSA in 14 mL water, with stirring for 2 h at 37 °C. The color changed from colorless to dark brown, indicating BSA-MnO2 formation. The mixture was dialyzed against deionized (DI) water for three days using a 12–14 kDa molecular weight cut-off (MWCO) dialysis tube. To prepare folic acid-conjugated BSA-MnO2 (FA-BSA-MnO2), the C-terminal of folic acid was first activated by 1-ethyl-3-(3-dimethylaminopropyl)carbodiimide (EDC)/N-hydroxysuccinimide (NHS).35 Briefly, 1 mg of FA in DI water was reacted with 15 mg of EDC and 15 mg of NHS in the dark for 1 h. Thereafter, the FA-NHS intermediate ester was added in the dark to BSA-MnO2 and allowed to react with continuous stirring for 24 h. The prepared FA-BSA-MnO2 solution was dialyzed in DI water using a 12–14 kDa MWCO tube and followed by storage at 4 °C.
The Synthesis of rGOQD, rGOQD/MnO2, rGOQD/MnO2/CpG/Q, and rGOQD/MnO2/CpG/Q/FA
The synthesis of reduced graphene oxide quantum dot (rGOQD) were performed according to our previous study and BSA-MnO2 was conjugated to rGOQD to prepare rGOQD/MnO2.36 Briefly, 1 mg/mL of GOQD was reacted with 1% (v/v) PEI in DI water under a nitrogen atmosphere at 100 °C with continuous stirring for 3 h. The rGOQD obtained was stored at 4 °C, after dialyzing (3kDa MWCO) for three days against water. rGOQD was PEGylated by reacting with 1,2-distearoyl-sn-glycero-3-phosphoethanolamine-N-[maleimide(polyethylene glycol) (DSPE-PEG2000-MAL) in phosphate buffered saline (PBS) at a 2:1 mass ratio for 2 h. The PEGylated rGOQD was then coupled with BSA-MnO2 in a 2:1 mass ratio at 4 °C for 1 h to form rGOQD/MnO2 by reaction between the cysteinyl-thiol present in the BSA protein chain and the maleimide end group of DSPE-PEG2000-MAL. The GOQD/MnO2/CpG was prepared by adsorbing CpG-ODN to rGOQD/MnO2 electrostatically. CpG-ODN dissolved in PBS buffer was allowed to interact with rGOQD/MnO2 for 4 h at 4 °C. Finally, rGOQD/MnO2/CpG/Q was prepared by mixing a quercetin (Q) solution prepared in ethanol with rGOQD/MnO2/CpG for 24 h at 4 °C.37 To prepare the FA-conjugated rGOQD/MnO2/CpG/Q/FA nanoparticle, a similar strategy was followed except that FA-BSA-MnO2 was used to replace BSA-MnO2 during all preparation steps. Specifically, PEGylated rGOQD was reacted with FA-BSA-MnO2 in a 2:1 mass ratio at 4 °C for 1 h, followed by loading CpG-ODN and Q as described previously.
The Characterization of Nanoparticles
Drug Loading and Release
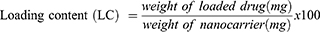
A rGOQD aqueous solution containing 1 mg rGOQD was sonicated for 1 h and mixed with a Q solution prepared in ethanol containing 0.05, 0.1, 0.2, or 0.3 mg Q at 4 °C for 24 h. The nanocarrier was collected by centrifugation, and free Q in the supernatant was quantified via UV–Vis spectroscopy at 373 nm. The loading content (LC) and loading efficiency (LE) of Q were calculated from equations (1) and (2).

Similarly, the LE and LC of CpG-ODN onto rGOQD were calculated by mixing 1 mg rGOQD with varying amounts of CpG-ODN (from 0.05 mg to 0.3 mg) in pH 7.4 PBS buffer for 4 h. After centrifugation, the absorbance (260 nm) of the supernatant was analyzed using UV–Vis spectroscopy.
The drug-release profiles of rGOQD were systematically investigated at pH 5, representative of the pH value in endosomes, and at pH 7.4, indicative of physiological pH. In this context, 1 mL of Q-loaded rGOQD was incubated at 37 °C in pH 5 or pH 7.4 PBS. At predetermined time intervals, the suspension underwent centrifugation, and the supernatant was completely removed to observe the Q release by measuring solution absorbance at 373 nm. The pellet was suspended in a fresh PBS solution of the same pH value as before to continue the experiment, and the cumulative release percentage of Q was calculated from equation (3).

For CpG-ODN release, similar steps were followed by measuring the CpG-ODN concentration at 260 nm.
Physico-Chemical Characterization
The morphologies of nanoparticles were characterized through high-resolution transmission electron microscopy (HR-TEM) using JEOL JEM-2000EII. The energy dispersive X-ray spectroscopy (EDS) was performed using Oxford INCA X-Max to analyze the composition of carbon, oxygen, nitrogen, manganese, and phosphorus elements from TEM/EDS. A dynamic light scattering (DLS) analyzer (Zeta sizer, Nano ZS 90) was used to determine the particle size and zeta potential. The X-ray diffraction (XRD) analysis was conducted with a Bruker D2 Phaser XRD machine at a 2θ angle from 10 to 60°. The ultraviolet–visible (UV–Vis) (Thermo Scientific Genesys 150), Fourier transform infrared (FTIR) (Bruker Tensor 27), and Raman spectroscopy (UniNanoTech UniDRON) analyses were also performed.38
NIR-Induced Photothermal Effect
The photothermal performance of the nanoparticles was assessed using an 808 nm near-infrared (NIR) laser. Briefly, 100 μL of nanoparticle dispersion was transferred into an Eppendorf tube and irradiated for 3 min at 2 W/cm2. Thermal images were recorded in real-time at designated time intervals using an infrared thermal camera. Following the 3-min irradiation, the laser was turned off to initiate the cooling phase, and the samples were allowed to return to room temperature. The photothermal conversion efficiency (ƞ) was calculated from equation (4).

Where h and S are the heat transfer coefficient and surface area of the sample tube, respectively. Tmax and Tsurr indicate the solution maximum temperature and the surrounding temperature, respectively. Qdis denotes the dissipated heat, while I and A808 represent the laser intensity and absorbance at 808 nm, respectively. A dimensionless parameter  was defined in equation (5).

A cooling time constant (τs) can be obtained from linear regression of the temperature (T) changes during the cooling cycle as a function of time (t) from equation (6).

The  value can be used to calculate the value of hS as shown in equation (7).

Where  represents the mass of water, and CD represents the heat capacity of water.
Stability of Nanoparticles
To validate the stability of the rGOQD/MnO2/CpG/Q/FA, 0.2 mg nanoparticle was suspended in 1 mL of PBS or medium (10% FBS + 90% DMEM). The particle size, polydispersity index (PDI), and zeta potential were measured at different times by incubation at 37 °C.
Hydroxyl Radical (•OH) Generation
The generation of hydroxyl radicals (•OH) in the presence of hydrogen peroxide (H2O2) was evaluated using methylene blue (MB) as an indicator. rGOQD/MnO2 (200 µg/mL) was incubated with varying concentrations of H2O2 in the presence of 25 mM sodium bicarbonate (NaHCO3), 1 mM glutathione (GSH), and 10 µg/mL MB for 30 min at room temperature. The extent of MB degradation, resulting from •OH-mediated oxidation, was determined by monitoring the solution absorbance at 665 nm.
Glutathione (GSH) Depletion
The glutathione (GSH) depletion assay was conducted utilizing DTNB (Ellman’s reagent).39 To ascertain the GSH consumption, 200 µg/mL of rGOQD/MnO2/CpG/Q/FA was incubated with 1 mM GSH in a total volume of 2 mL. After 30 min of incubation, 100 µL of the reaction mixture was withdrawn and treated with 50 µM 5,5’-dithiobis(2-nitrobenzoic acid) (DTNB) for 10 min. The residual GSH concentration was then calculated from the solution absorbance at 405 nm.
Hemocompatibility
Blood obtained from mice was utilized to assess potential hemolysis induced by rGOQD/MnO2/CpG/Q/FA. The red blood cells (RBC) underwent washing and subsequent dilution in PBS. Various concentrations of rGOQD/MnO2/CpG/Q/FA were mixed with the diluted RBC and incubated at 37 °C for 1 h. The RBC incubated in PBS or distilled water served as the negative control (nc) and positive control (pc), respectively. Following low-speed centrifugation, the absorbance of the supernatants was determined at 540 nm (OD540sample), and the hemolysis ratio (HR) was assessed and calculated.

The in vitro Studies
Intracellular Uptake and Apoptosis
The intracellular uptake of the nanoparticle was examined utilizing confocal microscopy and flow cytometry. For confocal microscopy, 2 × 10⁴ B16F10 melanoma cells were seeded onto confocal µ-dishes and cultured overnight. The culture medium was replaced with DMEM containing Cy5.5-labeled-rGOQD/MnO2/CpG/Q or Cy5.5-labeled-rGOQD/MnO2/CpG/Q/FA (red fluorescence, λex/λem = 675 nm/695 nm) and incubated for 24 h. After washing, cells were stained with LysoTracker Green DND-26 (green fluorescence, λex/λem = 504 nm/511nm) to label lysosomes, followed by Hoechst 33342 (blue fluorescence, λex/λem = 405 nm/460 nm) nuclear staining. After washing, cells were fixed using paraformaldehyde and imaged using a confocal laser scanning microscope (Zeiss LSM780). Intracellular uptake was also examined by flow cytometry with 5 × 10⁵ B16F10 cells in a 6-well plate using an Attune NxT flow cytometer (Life Technologies). To assess the apoptosis and necrosis, 5 × 10⁵ B16F10 melanoma cells were incubated with different nanoparticles for 24 h in a 6-well plate with or without NIR laser irradiation. For the laser-treated (L+) groups, cells were irradiated with NIR laser at 2 W/cm2 for 3 min. After 2 h, cells were stained with Annexin V–FITC/PI to determine apoptotic and necrotic cell populations via flow cytometry.
In vitro Cytotoxicity
The MTT assay was conducted to evaluate the cytotoxicity of the nanoparticles with or without laser. B16F10 cells seeded in 96-well plates (5 × 10³ cells/well) were cultured overnight and treated with different nanoparticles for 24 h and exposed to NIR laser irradiation (808 nm, 2 W/cm2) for 3 min for the groups exposed to laser (L+). After treatment, the medium was replaced with MTT solution per well and incubated for 3 h. with PBS. The relative cell viability (%) was quantified by measuring the absorbance of formazan crystals in DMSO at 570 nm (OD570), with the OD570 of untreated cells being taken as 100%.
Intracellular Reactive Oxygen Species (ROS) and •OH Generation
To evaluate intracellular reactive oxygen species (ROS) production, B16F10 cells (2 × 10⁴) were exposed to different nanoparticles. After 4 h of incubation, cells were washed and treated with 20 µM 2′,7′-dichlorodihydrofluorescein diacetate (DCFH-DA) in DMEM for 20 min in the dark. The cells were then rinsed with PBS and subjected to NIR laser irradiation (808 nm, 2 W/cm2) for 3 min when needed before being imaged using an inverted fluorescence microscope. ROS levels were also quantified using flow cytometry, following an identical staining protocol. For detection of •OH, cells were similarly treated with nanoparticles, then incubated with 10 µM hydroxyphenyl fluorescein (HPF) for 30 min, and fluorescence images were captured under an inverted fluorescence microscope.
Intracellular GSH Depletion
B16F10 melanoma cells were cultured in a 6-well plate at 5 × 10⁵ cells/well and subjected to different treatments at 37 °C. Following this, the cells underwent trypsinization and were lysed with Triton X-100 for 20 min. The resultant cell lysates were centrifuged at 15000 g to isolate the supernatant. An aliquot of 50 µL of DTNB (0.5 mM) was combined with 10 µL supernatant. The absorbance (OD405) was used to calculate the residual GSH levels within the cells.
In vitro HSP70 Expression
B16F10 melanoma cells (1 × 10⁵ cells/well) were seeded in 6-well plates and treated with PBS (control), rGOQD/MnO2, or rGOQD/MnO2/CpG/Q/FA for 24 h. For the laser-treated (L+) groups, NIR irradiation (808 nm, 3 min) was applied. Cells were incubated for 2 h, lysed with lysis buffer, and centrifuged to collect the supernatant. Following the manufacturer’s protocols, HSP70 levels were quantified using an ELISA kit (Abcam, ab133060).
In vitro Immunogenic Cell Death (ICD) Assessment
To assess the ICD in B16F10 melanoma cells, CRT and HMGB1 were examined utilizing confocal microscopy and flow cytometry. For flow cytometry, 2 × 10⁵ cells per well were cultured in a 6-well plate and exposed to various nanoparticles for 24 h, and irradiated with NIR laser when needed in the L+ groups (2 W/cm2 for 3 min). Subsequently, the cells were harvested, fixed with paraformaldehyde, and permeabilized with 0.2% Triton X-100 for 5 min. The fixed cells were washed and incubated in an anti-CRT or an anti-HMGB1 primary antibody solution for 1 h. After washing, cells were labelled with a secondary antibody conjugated with Alexa Fluor 488 for 30 min before flow cytometry analysis.40 The ICD-induced CRT and HMGB1 expression was also analyzed by confocal microscopy. Briefly, 2 × 10⁵ B16F10 cells cultured overnight in confocal dishes were treated for 24 h with various nanoparticles and with 808 nm NIR laser (2 W/cm2 for 3 min) in the L+ groups. After fixing with paraformaldehyde for 20 min, permeabilizing with 1% Triton X-100 for 10 min, and blocking with 5% BSA, cells were incubated overnight with primary anti-CRT or anti-HMGB1 antibody. After rinsing, they were stained for 1 h with Alexa Fluor 488-conjugated secondary antibody, and cell nuclei were stained with Hoechst for 10 min. Finally, after rinsing with PBS, the cells were observed under a confocal microscope (Leica Stellaris 8).
In vitro Macrophage Polarization
Macrophage polarization experiments were conducted in a 6-well Transwell system (723121, NEST scientific). B16F10 cells were seeded in the upper chamber of a 6-well plate (7 × 10⁴ cells/well) while RAW264.7 murine macrophage cells were seeded (2 × 10⁵ cells/well) in the lower chamber. The RAW264.7 cells were treated with 20 ng/mL of IL-4 to induce M2 macrophage polarization. As a positive control for M1 polarization, RAW264.7 cells were treated with 100 ng/mL lipopolysaccharide (LPS). After 24 h, the B16F10 melanoma cells were exposed to various treatments. Macrophages resulting from this process were subsequently washed with PBS, scraped using a cell scrapper (710011, NEST Scientific), and collected via centrifugation. The RAW264.7 cells were then stained for 30 min using anti-CD80 (Abcam, ab62636) and anti-F4/80 (Abcam, ab16911) antibodies at a dilution of 1:500, followed by washing and staining with Alexa Fluor 647 or Alexa Fluor 488-conjugated secondary antibody. The cells were centrifuged to remove unbound antibodies, and flow cytometry analysis was performed. Detection of CD206 (FNab01442, Fine Test) and F4/80 was conducted in a separate batch, following a protocol similar to that used for CD80.
In vitro Cytokine Production
The lower and upper chambers of the 24-well Transwell system were seeded with 1.5 × 10⁴ RAW264.7 and 0.5 × 10⁴ B16F10 cells/well in the upper and lower chambers, respectively. After polarizing to M2 macrophages using IL-4 (20 ng/mL), cells in the upper chamber were treated with PBS or nanoparticles for 24 h, and cells in the laser groups (L+) were exposed to 808 nm NIR laser for 3 min at 2 W/cm2 for 3 min. After 2 h of incubation, the medium in the lower chamber was centrifuged to remove the nanoparticles and cytokine concentration in the supernatant was determined by ELISA. The ELISA assay was performed following the manufacturer’s protocol to quantify the concentration of released IL-6 and TNF-α.
The in vivo Studies Using Mice Model
All animal experiments were conducted in accordance with the guidelines approved by the Institutional Animal Care and Use Committee (IACUC) of Chang Gung University (IACUC Approval No.: CGU111-099). Four-week-old female C57BL/6 mice from the National Laboratory of Animal Center (Taipei, Taiwan) were used to establish an allogeneic mouse melanoma model by subcutaneous injection of 1 × 10⁶ B16F10 cells into the right flank of each mouse. All in vivo procedures were carried out under isoflurane inhalation anesthesia. C57BL/6 mice were put to sleep in an induction chamber with 3–4% isoflurane in 100% oxygen at a flow rate of 1.0–1.5 L/min. Following induction, the mice were moved to a heated surgical platform, and to maintain consistent sedation throughout the procedure. Anesthesia was maintained at 1.5–2% isoflurane administered via nose cone. The pedal withdrawal reflex was used to evaluate the level of anesthesia. To keep the body temperature at 37 °C, a heating pad was utilized. The mice were euthanized with inhalation of CO2 and followed by decapitation. Only mice with a tumor volume exceeding 30 mm3 were used in the study.
In vivo Photothermal Response
The mice were intratumorally administered with PBS or nanoparticles. One hour following the injection, NIR laser was applied to the tumor area at 2 W/cm2 for 3 min. The tumor temperature was monitored at different laser irradiation times using an infrared thermal camera.
In vivo Antitumor Efficacy
On day 6, mice were randomly assigned to five groups (n = 6, each group) and received intratumoral injections of PBS or nanoparticles on the PBS (control), rGOQD (nanocarrier), rGOQD/MnO2 (L+), rGOQD/MnO2/CpG (L+), and rGOQD/MnO2/CpG/Q/FA (L+) groups. Mice in the L+ groups were irradiated with an 808 nm NIR laser for 3 min (2 W/cm2) after injection of samples. Three additional treatments were given on days 8, 10, and 12 with dosages of rGOQD at 5.5 mg/kg and CpG at 0.5 mg/kg. Tumor volumes and body weights were monitored on days 7, 9, 11, and 13. Tumor volume was calculated using the formula V = (L × W2)/2, with V representing tumor volume, L denoting tumor length, and W indicating tumor width. On day 13, two mice from each group were euthanized, and blood and tumors, along with organs, were collected for hematological analysis and histopathological analysis via H&E staining. Additionally, tumor tissues underwent immunohistochemistry (IHC). To establish the animal survival curve, the tumor volume was continuously monitored, and the animals were sacrificed when the tumor volume exceeded 1000 mm3.
In vivo Immunomodulatory Evaluation
To assess immune activation within the TME after treatment, macrophage polarization (M1 and M2) and related T cell activation (CD4+ and CD8+) were evaluated using flow cytometry. Tumor tissues were excised from mice on day 13. The tissues were mechanically minced, and cell suspensions were prepared following enzymatic digestion, filtration (70-µm cell strainer), and RBC-lysis buffer treatment. The cells were stained with anti-CD80 antibodies for M1 macrophages and anti-CD206 antibodies for M2 macrophages, and fluorescently labeled antibodies against CD4 and CD8 for identifying CD4+ and CD8+ T cells.
Hematological Analysis and Histological Staining
To evaluate systemic safety in vivo, hematological analyses were conducted, complemented by hematoxylin and eosin (H&E) staining of major organs. Blood samples were collected for a comprehensive blood panel assessment. The excised tumor tissues were subjected to H&E staining and immunohistochemistry (IHC) to evaluate the expression of Ki-67, cleaved caspase 3 (CC3), HSP70, IL-6, and TNF-α. In addition, the CD4 and CD8 expression in tumor tissues was assessed by immunofluorescence (IF) staining using Alexa Fluor 488-labelled anti-CD4 and Alexa Fluor 647-labelled anti-CD8 antibodies, and nuclei were counterstained with DAPI.
Statistical Analysis
All data are expressed as mean ± standard deviation (SD). Statistical comparisons between groups were performed using one-way analysis of variance (ANOVA), and differences were considered statistically significant at p < 0.05.
Results and Discussion
The rGOQD was synthesized by the hydrothermal reduction of GOQD using branched polyethyleneimine (PEI) at 100 °C.36 The reduction process restored the π-conjugated graphene network, thereby enhancing its photothermal conversion capability over GOQD. The rGOQD was PEGylated by conjugation with DSPE-PEG2000-MAL to improve colloidal stability and introduce terminal maleimide groups. The thiol group from the cysteine residue of BSA in BSA-MnO2 can react maleimide groups spontaneously to form rGOQD/MnO2. CpG-ODN was electrostatically bound to cationic PEI in rGOQD/MnO2 to synthesize rGOQD/MnO2/CpG. PEI can enhance the delivery of CpG-ODN while preventing its breakdown, as it can protect DNA from degradation by nucleases and help it to bypass the endo/lysosome without undergoing degradation in lysosomes.41 Quercetin (Q) was loaded onto rGOQD/MnO2/CpG by π-π stacking onto the rGOQD surface to form rGOQD/MnO2/CpG/Q. For targeted delivery, BSA-MnO2 was replaced by FA-BSA-MnO2 during the preparation steps to obtain rGOQD/MnO2/CpG/Q/FA (Scheme 1).
 |
Scheme 1 The schematic representation of the preparation of rGOQD/MnO2/CpG/Q/FA. |
FA-BSA-MnO2 was synthesized by amide bond formation between the EDC/NHS-activated γ-COOH groups of FA with the amino group of BSA. The synthesis was confirmed through UV–Vis spectroscopy. The BSA-MnO2 shows its corresponding absorption peak within 260–290 nm. In FA-BSA-MnO2, an absorbance peak within 340–370 nm was observed in addition to the absorption peak from BSA-MnO2, which is a minor peak in the characteristic peaks of FA (Figure S1a).42 From the particle size distribution curves with dynamic light scattering analysis, the average hydrodynamic size of BSA-MnO2 is 10.1 ± 0.2 nm (PDI = 0.233), which shifted to 13.3 ± 0.7 nm (PDI = 0.258) for FA-BSA-MnO2 (Figure S1b). The zeta potential shifted from –12.3 ± 1.5 mV to –15.6 ± 1.8 mV as FA has two carboxylic acid groups with pKa values at 4.7 and 6.8 (Figure S1c). From the FTIR spectrum, a strong C=O stretching band around 1710 cm−1 from FA and a peak at 668 cm−1 from Mn-O in MnO2 confirm the successful synthesis of FA-BSA-MnO2 (Figure S1d).43
 |
Figure 1 The high-resolution transmission electron microscopy (HR-TEM)/energy-dispersive X-ray spectroscopy (EDS) analysis of synthesized nanoparticles (bar = 100 nm). |
From HR-TEM analysis, all nanoparticles show round morphology with an apparent change of particle size during the successive preparation steps (Figure 1). The EDS analysis confirms the presence of the element N from PEI in rGOQD, while MnO2 introduces the element Mn, and CpG-ODN leads to the presence of the element P (Figure 1). From the particle size distribution curves (Figure 2a), after binding of PEI to GOQD during the reduction process, the average particle size changes from 14.3 ± 5.7 nm (PDI = 0.163) to 47.0 ± 18.6 nm (PDI = 0.170). Subsequently, BSA-MnO2 conjugation significantly increases the average particle size to 101.4 ± 27.6 nm (PDI = 0.194). The average particle size increases to 144.8 ± 33.3 nm (PDI = 0.157) and 167.6 ± 36.7 nm (PDI = 0.217), respectively, after binding the immunoadjuvant CpG-ODN and the HSP70 inhibitor Q. Finally, using FA-BSA-MnO2 for modification of rGOQD, the particle size increases to 182.2 ± 49.7 nm (PDI = 0.250) for rGOQD/MnO2/CpG/Q/FA. The zeta potential of GOQD (37.0 ± 2.8 mV) changes to 26.5 ± 0.5 mV after binding the amine-rich PEI to rGOQD (Figure 2b). The conjugation of BSA-MnO2 changes the zeta potential to a negative value (–3.4 ± 0.3 mV) for rGOQD/MnO2, as the isoelectric point value of BSA is 4.7. Upon binding CpG-ODN, the zeta potential shifts to an even negative value, –15.4 ± 0.5 mV, as the phosphate backbone in the short DNA sequence provides negative charges. The subsequent addition of Q caused a slight increase in negative surface charge to –19.4 ± 3.9 mV from its hydroxyl groups. Finally, in rGOQD/MnO2/CpG/Q/FA (–23.3 mV ± 1.0 mV), a significant change was observed from that of rGOQD/MnO2/CpG/Q due to the negative charge of FA-BSA-MnO2, although there are chances that BSA can potentially mask the charge of FA.44
 |
Figure 2 The particle size distribution (a), zeta potential (b), X-ray diffraction (XRD) (c), Fourier transform infrared (FTIR) spectroscopy (d), and Raman spectroscopy (e) analysis of synthesized nanoparticles. |
The successful synthesis of rGOQD/MnO2/CpG/Q/FA was also confirmed based on XRD (Figure 2c). The rGOQD shows a broad diffraction peak (002) at 2θ = 23.4°. The MnO2 possesses a peak neighboring the (002) plane in rGOQD, as observed in FA-BSA-MnO2 at 2θ = 21.4°. Together, a much stronger (002) plane peak at 2θ = 22.9° is observed for rGOQD/MnO2/CpG/Q/FA due to the overlapping of diffraction peaks of rGOQD with MnO2.45 The FTIR spectroscopy analysis indicates strong bands in the range 3300–3500 cm−1, ~1612 cm−1, ~1400 cm−1, and ~1100 cm−1 represent the O-H stretching vibrations, C=C, C-O, and C-O-C stretching vibrations, respectively (Figure 2d). In rGOQD, bands at 2925 cm−1 and 2856 cm−1 belong to the -CH2 symmetric and asymmetric stretching vibrations in the PEI chain. In rGOQD/MnO2, the prominent band at 624 cm−1 is characteristic of the Mn-O stretching vibrations, confirming the formation of rGOQD/MnO2. In case of rGOQD/MnO2/CpG/Q/FA, a new peak appears at 1269 cm−1 attributed to the P-O bonds, and another at 526 cm−1 is assigned to the P=S bond (which appears red-shifted from the expected 650 cm−1 due to overlapping with Mn-O signals), confirming the incorporation of CpG-ODN into rGOQD/MnO2/CpG/Q/FA.46 As shown from the Raman spectra of GOQD, rGOQD, and rGOQD/MnO2/CpG/Q/FA, two peaks representing the D and G bands at 1354 cm−1 and 1599 cm−1 emerge (Figure 2e). The ratio between the intensities of D (ID) and G (IG) bands is used to determine the degree of disorder and defect in the carbon materials. The D-band represents the defect sites, and the G-band is attributed to the sp2 hybridization of the carbon–carbon bond. The ID/IG value of GOQD increased from 097 to 1.01 for rGOQD after the reduction of GOQD with PEI. This increase is anticipated as a result of the newly generated defects during the reduction process, thereby confirming the synthesis of rGOQD.47 For rGOQD/MnO2/CpG/Q/FA, the ratio of ID/IG is similar to that of rGOQD, indicating the degree of disorder is maintained after successive modification with different moieties.
Drug loading assessment was carried out by varying the amount of Q (0.05, 0.1, 0.2, 0.3 mg) loaded to 1 mg rGOQD. An increase in Q concentration decreases loading efficiency (LE) from 67.9% to 51.9%. Concurrently, the loading content (LC) reaches a maximum of 0.19 mg/mg with 0.3 mg of Q, which was selected as the nanoparticle formulation (Figure 3a). The quercetin release behavior from rGOQD was studied at pH 7.4 (physiological pH) and pH 5 (endosomal pH) (Figure 3c). It is observed that the Q release rate during the initial period was similar at both pH values. However, the drug release is ~42% at pH 7.4 vs ~82% at pH 5 within 24 h. An initial burst release of the drug is undesirable for cancer treatment, as the drug will be cleared immediately from the reticuloendothelial system macrophages before it can reach the tumor site.48 Thus, avoiding the initial burst release before reaching the acidic tumor microenvironment, which is followed by intracellular uptake into acidic endosomes for prolonged drug release, represents an advantage using rGOQD for Q delivery.
 |
Figure 3 The Loading efficiency (LE) and loading content (LC) of quercetin (a) and CpG-ODN (b). The release profiles of quercetin (c) and CPG-ODN (d) at pH 5.0 and pH 7.4. The values are reported as mean ± SD from five experiments (n = 5). |
To load CpG-ODN to rGOQD, rGOQD was mixed with different amounts of CpG-ODN. Similar loading curves were found as in Q, and 0.3 mg of CpG-ODN was chosen as the best formulation to give ~40% LE (Figure 3b). The release of CpG-ODN from rGOQD is also pH-sensitive and similar to Q, with acidic environment (pH 5) leading to a higher release rate (Figure 3d). This implies that a physiological environment (pH 7.4) reduces the risk of premature loss of CpG-ODN adjuvant. There is ~65% CpG-ODN release at pH 5, implying rGOQD can promote the release of CpG-ODN in acidic endosomes after endocytosis.49
To assess the stability of rGOQD/MnO2/CpG/Q/FA, the UV–vis spectra, average particle size, PDI, and zeta potentials were monitored at intervals in both PBS and medium (DMEM +10% FBS). As illustrated in Figure S2a, the average nanoparticle size shows no significant change from 0 to 48 h. However, the PDI values showed an increase over time, but they were still below 0.3 in 48 h (Figure S2b). The rise in PDI in PBS may potentially signal the beginning of aggregation. The increased PDI in medium may be due to the strong protein adsorption capacity of GOQD from the formation of a protein corona in FBS, which can significantly alter its physicochemical properties.50 This can be supported by Figure S2c, where rGOQD/MnO2/CpG/Q/FA exhibited minimal zeta potential variation in PBS but displayed significantly reduced negative charge due to the masking of the surface charge by adsorbed proteins in FBS.51
The photothermal action from rGOQD/MnO2/CpG/Q/FA, which is driven by the photothermal agent rGOQD, after exposure to NIR light, was evaluated up to 3 min with real-time images acquired from a thermal camera (Figure 4a). Similar temperature rise with no significant differences was noted across all nanoparticles based on rGOQD, which is much higher than that of GOQD (Figure 4b). The temperature changes during the heating and cooling curves (Figure 4c) and calculated time constant τs from linear regression (Figure 4d) were used to calculate the photothermal conversion efficiency (η). As shown in Table 1, the η of rGOQD (33.0%) increases two times from that of GOQD (16.5%) after reduction with PEI and stays constant regardless of successive modification with different moieties.
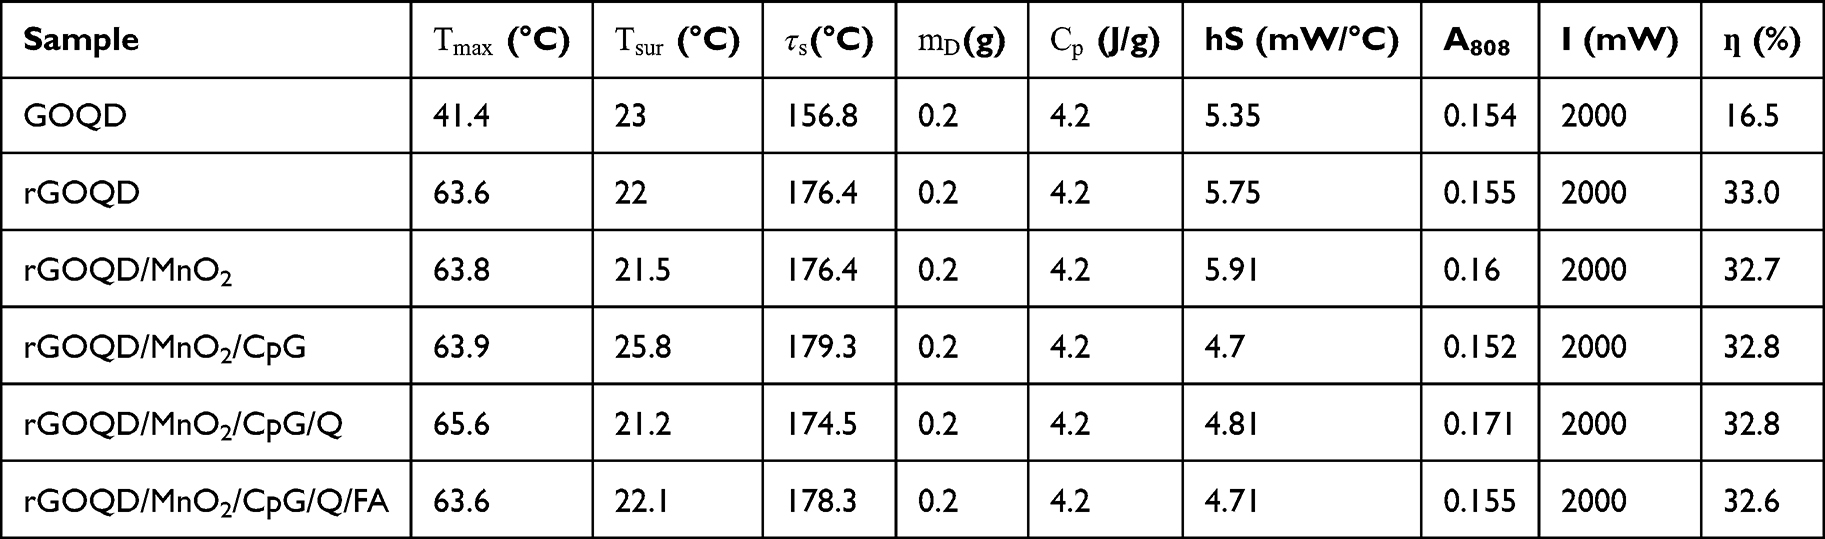 |
Table 1 Photothermal Conversion Efficiency (Ƞ) of GOQD, rGOQD, rGOQD/MnO2, rGOQD/MnO2/CpG, rGOQD/MnO2/CpG/Q, and rGOQD/MnO2/CpG/Q/FA |


The generation of highly cytotoxic •OH through a Fenton-like reaction was verified by employing methylene blue (MB), whose absorbance at 665 nm diminishes upon the generation of •OH. As illustrated in Figure S3a, an increase in the concentration of H2O2 corresponded with an increase in MB degradation to substantiate the production of cytotoxic •OH by rGOQD/MnO2/CpG/Q. The 90% MB degradation after reacting with 10 mM H2O2 represents the approximate maximum concentration of H2O2 present in the tumor microenvironment (TME).52 The glutathione (GSH)/glutathione disulfide (GSSG) constitutes the principal redox pair in animal cells, influencing their anti-oxidative capacity. In comparison to normal tissues, malignant tissues exhibit a significantly elevated concentration of GSH, which may range from 2 to 10 mM within tumor cells. This excessive concentration of GSH affects the therapeutic efficacy of ROS-based therapy (eg, PDT, CDT, and sonodynamic therapy), ferroptosis, and chemotherapy. Therefore, it is necessary to deplete the GSH level in cancer cells, which helps to increase the accumulation of ROS in the TME for better anti-cancer efficacy.53 To evaluate the GSH scavenging effect of MnO2 present in rGOQD/MnO2/CpG/Q, a colorimetric probe, DTNB, was employed, which can react with free thiol groups (-SH) in GSH to form a yellow product. As shown in Figure S3b, around 20% of the GSH was depleted in 1 h, and only 18% GSH was left after 7 h. This validates the ability of rGOQD/MnO2/CpG/Q to serve as a GSH-scavenging agent. This will help to remove the crucial antioxidant GSH with ROS buildup and redox imbalance in the TME, making cancer cells vulnerable to cell death by synergizing with other treatments.54
The folate receptor is a tumor marker overexpressed on the surface of B16F10 melanoma.55 The active targeting of rGOQD/MnO2/CpG/Q/FA to B16F10 melanoma was studied by confocal microscopy, where the extent of cellular internalization was observed from the red fluorescence of Cy5.5-labeled nanoparticles. The cell nuclei and lysosomes were counterstained with Hoechst and LysoTracker Green, respectively. As shown in Figure 5a, Cy5.5-labeled rGOQD/MnO2/CpG/Q/FA showed a much higher cellular uptake than Cy5.5-labeled rGOQD/MnO2/CpG/Q. Furthermore, the introduction of free FA into the medium, which blocked the folate receptors, inhibited the uptake of Cy5.5-labeled rGOQD/MnO2/CpG/Q/FA through competitive binding to the folate receptors located on the cell surface. Quantification of cellular uptake through flow cytometry analysis indicates that Cy5.5-labeled rGOQD/MnO2/CpG/Q/FA can enhance the folate receptor-mediated endocytosis through active targeting in B16F10 melanoma cells, where the mean fluorescence intensity (MFI) of the targeted nanoparticle is 4.6 times that of the non-targeted one (Figure 5b). The uptake rate also increases from 77.1% to 99.4% (Figure 5c).
 |
Figure 5 The intracellular uptake of Cy5.5-labeled rGOQD/MnO2/CpG/Q and rGOQD/MnO2/CpG/Q/FA using confocal laser microscopy (a) and flow cytometry analysis (b). (c) The uptake ratio from flow cytometry analysis. Bar = 20 µm. |
The cytotoxic effects of various nanoparticles on B16F10 cells were evaluated at 10 µg/mL concentration. Figure 6a indicates that rGOQD (L+) significantly reduces cell viability from rGOQD, demonstrating the effect of rGOQD as a photothermal agent. Cells treated with rGOQD/MnO2 (L+) further lead to significantly higher cytotoxicity. This increase is linked to CDT together with PTT, where temperature increase in the tumor area results in enhanced •OH production.56 The rGOQD/MnO2/CpG (L+) yielded results comparable to rGOQD/MnO2 (L+), validating the biocompatibility of CpG-ODN. However, rGOQD/MnO2/CpG/Q/FA (L+) presented the lowest cell viability (48.4%) among all groups, highlighting the role of Q as an HSP70 inhibitor to boost the efficiency of PTT and FA as a targeting ligand. Additionally, we investigated the cell death pathways from flow cytometry by co-labeling with Annexin V and PI (Figure 6b). The results from three separate experiments are shown and compared in Table 2. Under NIR irradiation, the rGOQD (L+) group has fewer live cells than the rGOQD group (84.3% vs 95.4%) with a higher apoptotic rate (Q4+Q2). Likewise, results from other groups align with those obtained from the cell viability assay. Both rGOQD/MnO2 (L+) and rGOQD/MnO2/CpG (L+) treatments exhibited similar apoptotic rate (31.3% and 32.0%), which is higher than PTT single therapy shown by rGOQD (L+) (16.3%). This endorses PTT/CDT dual therapy. In contrast, in the case of rGOQD/MnO2/CpG/Q/FA (L+), Q effectively inhibits the overexpression of HSP70, along with the FA-mediated targeting, thereby increasing cell apoptosis rare to 51.3% and resulting in the lowest live cells (48%). This confirms the efficiency of rGOQD/MnO2/CpG/Q/FA as a multimodal anti-cancer nanoplatform that can function as an effective PTT/CDT agent.
 |
Table 2 Quantitative Representation of Apoptosis/Necrosis of B16F10 Melanoma Cells After Different Treatments |
 |
Figure 6 (a) The cytotoxicity assessment in B16F10 melanoma cells among rGOQD, rGOQD (L+), rGOQD/MnO2 (L+), rGOQD/MnO2/CpG (L+), and rGOQD/MnO2/CpG/Q/FA (L+) groups. The L+ group is with NIR laser irradiation. αp < 0.05 compared with rGOQD, βp < 0.05 compared with rGOQD (L+), γp < 0.05 compared with rGOQD/MnO2 (L+), and δp < 0.05 compared with rGOQD/MnO2/CpG (L+). The values are reported as mean ± SD from five experiments (n = 5). (b) In vitro analysis of cell apoptosis and necrosis using Annexin-V FITC/PI staining of B16F10 melanoma cells among PBS, rGOQD, rGOQD (L+), rGOQD/MnO2 (L+), rGOQD/MnO2/CpG (L+), and rGOQD/MnO2/CpG/Q/FA (L+) groups. Q3 represents live cells, Q4 represents early apoptosis cells, Q2 represents late apoptosis cells, and Q1 represents necrosis cells. |
To detect intracellular ROS, B16F10 cells were treated with different nanoparticles with or without laser irradiation using DCFH-DA as a fluorescent probe for quantification by flow cytometry. Cells in rGOQD/MnO2 (L+) and rGOQD/MnO2/CpG (L+) groups showed similar mean fluorescence intensity (MFI), which is ~5 times that of PBS control and rGOQD (Figure 7a and b). These results confirm the Fenton-like catalytic activity of Mn2+ in generating •OH radicals, which can be enhanced by the photothermal-induced elevation in local temperature. Notably, the rGOQD/MnO2/CpG/Q/FA (L+) group demonstrated the highest MFI among all groups, attributed to the enhanced tumor-targeting efficiency mediated by FA. The intracellular ROS production from different nanoparticles was also confirmed by fluorescence microscopic observation (Figure 7c). The results were in agreement with those measured through flow cytometry, with a strong green fluorescence signal found in response to rGOQD/MnO2/CpG/Q/FA (L+) treatment, whereas the other treatment groups presented a low fluorescence signal, which was mainly due to insufficient •OH generation. To specifically differentiate the production of •OH as the most cytotoxic form of ROS, a fluorescent probe HPF was utilized, which reacts with the •OH to form a fluorescein compound. The green fluorescence intensity from produced •OH showed a similar trend as observed for ROS (Figure 7d). It should be noted that ROS and •OH show “double-edged sword” natures in cancer therapy, with low levels promoting tumor growth with cancer cells having higher baseline ROS, and excessive levels inducing cancer cell death. Therefore, only CDT with rGOQD/MnO2 (L+) can overload tumor cells with ROS to disrupt the redox balance and cause oxidative stress in cancer for triggering apoptosis and inhibiting survival pathways. This anti-cancer effect could be best exhibited by rGOQD/MnO2/CpG/Q/FA (L+), which generates the highest level of ROS and •OH for the most effective melanoma therapy.
 |
Figure 7 The intracellular reactive oxygen species (ROS) generation measurement by flow cytometry using DCFH-DA (a) and the average mean fluorescence intensity (MFI) (b) after different treatments. The values are reported as mean ± SD from five experiments (n = 5). The L+ group is with NIR laser irradiation. αp < 0.05 compared with PBS, βp < 0.05 compared with rGOQD, γp < 0.05 compared with rGOQD/MnO2 (L+), δp < 0.05 compared with rGOQD/MnO2/CpG (L+). The detection of ROS by DCFH-DA (c) and the detection of •OH by HPF (d) from fluorescence microscopy (bar = 100 µm). |
The in vitro assessment of GSH level in B16F10 melanoma cells was performed using DTNB. As shown in Figure S4a, rGOQD does not exhibit any statistical difference from the control group, indicating that the nanoparticle does not play a role in GSH depletion. However, the overexpressed endogenous cellular antioxidant GSH in cancer cells reacted with the chemodynamic agent MnO2 after intracellular uptake of rGOQD/MnO2 and rGOQD/MnO2/CpG, oxidizing GSH to GSSG and resulting in comparable GSH depletion.57 Still, due to an increased efficiency in targeting, rGOQD/MnO2/CpG/Q/FA provided the highest percentage of GSH depletion among all groups, to 28% of the initial GSH level, confirming it as the most efficient GSH-depleting agent for boosting cancer-killing ability of generated ROS. HSP70 will be overexpressed when cancer cells experience hyperthermia during PTT as a self-defense mechanism of cancer cells to prevent protein denaturation.58 The effects of different treatments on HSP70 production in B16F10 melanoma were studied and presented in Figure S4b. A basal level of HSP70 was observed in the control group from the constitutive production of this protein, as this protein exists in both constitutive and inducible forms and plays a key role in regulating many cellular processes.59 The treatment with rGOQD/MnO2/CpG or rGOQD/MnO2/CpG/Q/FA induced an increase in HSP70 production from that of the control group due to the oxidative stress generated by the chemodynamic effect. The NIR light-induced heat generation results in the highest HSP70 production in rGOQD/MnO2/CpG (L+) group to 7 ng/mL. This elevated HSP70 induction can be reduced more than 60% in rGOQD/MnO2/CpG/Q/FA (L+) to 2.5 ng/mL. This validates the controlled delivery of Q as a small molecule inhibitor of HSP70 by rGOQD/MnO2/CpG/Q/FA, which is expected to enhance the efficacy of PTT as well as the extent of ICD.
Hemocompatibility assay assessed the blood compatibility of nanoparticles with cellular blood components. Figure S5a shows the solution absorbance spectra when red blood cells (RBC) were treated with varying concentrations of rGOQD/MnO2/CpG/Q/FA. Two absorption peaks for oxyhemoglobin appear at ~540 nm and ~580 nm in the full spectra scan of the H2O-treated group, and the solution appears red due to the released hemoglobin, due to the swelling and bursting of RBC. PBS represents a physiologically compatible medium and is a negative control. The absorbance of these absorption peaks is minimum for all rGOQD/MnO2/CpG/FA-treated groups, resulting in a pale solution, which is similar to that in the PBS negative control group. A quantitative assessment using the absorbance at 540 nm (OD540) was used to calculate the hemolysis ratio, which is set as 100% for water (Figure S5b). PBS shows negligible absorbance, indicating no hemolysis. rGOQD/MnO2/CpG/FA demonstrates very low absorbance values from 0.1 to 0.4 mg/mL and near the PBS baseline, with hemolysis ratios all below 1%. However, by continuously increasing the nanoparticle concentration to 0.8 mg/mL, the hemolysis ratio increases to 2% and should be taken as an upper limit for administration.
Tumor cells are capable of producing endogenous DAMPs that initiate an antitumor immune response. Cells undergoing apoptosis exhibit increased membrane permeability, resulting in cell swelling and lysis, which facilitates the release of the DAMPs.60 The typical DAMPs that act as key biochemical indicators of ICD include the endoplasmic reticulum-residing protein CRT, which is prompted by stress induced by chemotherapy, NIR irradiation, and ROS production, leading to their translocation to the cell surface. Additionally, the cell nucleus-residing protein HMGB1 can be released into the cytoplasm under similar cell stress.61 These surrogate markers for ICD can stimulate antigen-presenting cells and further recruit cytotoxic T lymphocytes to activate the immune system. As illustrated from the flow cytometry analysis (Figure 8a), PBS (control) and rGOQD did not induce CRT exposure. Cells treated with rGOQD (L+) exhibited an MFI around 1.1-fold higher than that of the control groups, indicating PTT can induce DAMPs release through ICD. Nevertheless, rGOQD/MnO2 (L+) and rGOQD/MnO2/CpG (L+) groups demonstrated more than 4.5 times higher CRT externalization due to PTT and CDT. However, no statistical difference was found between them, suggesting that the presence of CpG-ODN did not affect CRT translocation. The highest MFI for CRT exposure was observed in the rGOQD/MnO2/CpG/Q/FA (L+) group, implying that increased cellular uptake facilitated by FA modification and Q-mediated enhanced PTT can stimulate CRT translocation to the cell surface. Similarly, in the case of flow cytometry analysis of HMGB1 (Figure 8b), the untreated PBS and rGOQD group exhibited the highest MFI, indicating strong nuclear retention of HMGB1 under basal conditions. In contrast, cells showed a progressive reduction in intracellular HMGB1 on the order of rGOQD/MnO2/CpG (L+) < rGOQD/MnO2 (L+) < rGOQD (L+), suggesting translocation and release of HMGB1 from the nucleus, which confirms the ICD-induced DAMP release. Most importantly, rGOQD/MnO2/CpG/Q/FA (L+) showed the lowest MFI, indicating the most pronounced HMGB1 release, which is due to FA-mediated enhanced PTT/CDT.
 |
Figure 8 In vitro ICD-mediated DAMPs exposure in B16F10 melanoma cells in PBS, rGOQD, rGOQD (L+), rGOQD/MnO2 (L+), rGOQD/MnO2/CpG (L+), and rGOQD/MnO2/CpG/Q/FA (L+) groups. Cells were subject to flow cytometry quantification of CRT expression (a) and HMGB1 release (b). The values are reported as mean ± SD from five experiments (n = 5). The L+ group is with NIR laser irradiation. αp < 0.05 compared with control, βp < 0.05 compared with rGOQD, γp < 0.05 compared with rGOQD (L+), δp < 0.05 compared with rGOQD/MnO2 (L+), and εp < 0.05 compared with rGOQD/MnO2/CpG (L+). The confocal microscopy images of CRT surface exposure (c) and HMGB1 release from the nucleus (d) (bar = 20 µm). |
CRT exposure and HMGB1 release were confirmed through confocal microscopy observation. The results from confocal microscopy reveal that the extent of CRT surface exposure associated with the green fluorescence intensity follows the same order as observed from flow cytometry (Figure 8c). For HMGB1 release validated through confocal microscopy, abundant HMGB1 protein was localized in the cell nuclei and co-localized with Hoechst 33342 in the control group treated with PBS. The fluorescence intensity (green) among the treatment groups follows a reverse order as observed for CRT, with the release of HMGB1 from ICD, and the lowest level of HMGB1 in the cells was found for rGOQD/MnO2/CpG/Q/FA (L+), with migration of HMGB1 from cell nuclei to cytoplasm (Figure 8d). Overall, the combination of FA targeting and enhanced PTT/CDT is a powerful strategy to enhance DAMP release and induce ICD.
CpG-ODN functions as a TLR9 agonist and is capable of activating macrophages towards the M1 phenotype, thereby inducing the production of IL-6 and TNF-α as proinflammatory cytokines.62 Additionally, ICD also influences the polarization of macrophages from the M2 to the M1 phenotype, thus assisting in reversing the immunosuppressive TME.63 Therefore, to validate ICD-induced macrophage polarization and the immunomodulatory effects of CpG-ODN, RAW264.7 cells in the M2 state were incubated with various nanoparticles and subject to NIR laser irradiation. The phenotype of RAW264.7 cells was identified by gating on F4/80+ cells, followed by incubation with CD80-targeting antibody for the M1 phenotype and CD206-targeting antibody for the M2 phenotype. All treatment groups demonstrated an increase in M1 (F4/80+, CD80+) and a decrease in M2 (F4/80+, CD206+) phenotype compared to the control groups from flow cytometric analysis (Figure 9a and b). The rGOQD/MnO2/CpG/Q/FA (L+) group demonstrated the highest M1 polarization (89.3%) and the lowest M2 polarization (42.8%). In comparison to control groups, cells treated with rGOQD (L+) exhibited DAMP-induced M1 polarization with reduced M2 polarization, with the effect being more pronounced in rGOQD/MnO2 (L+), attributable to the combined influence of PTT and CDT. However, due to the influence of CpG-ODN, the rGOQD/MnO2/CpG (L+) treatment resulted in an even higher percentage of M1 (67.1%), concomitant with a reduction in M2 (63.3%), thereby confirming the synergistic effect of CpG-ODN as a TLR9 agonist alongside DAMP-induced polarization. The inclusion of Q and FA in rGOQD/MnO2/CpG/Q/FA (L+) further enhanced M1 activation, with an observable increase in M1 and decrease in M2 polarization. Overall, the M1/M2 ratio significantly increased in the rGOQD/MnO2/CpG/Q/FA (L+) group compared to all other groups, indicating effective macrophage repolarization from an immunosuppressive (M2) phenotype to a pro-inflammatory (M1) phenotype (Figure 9C). This suggests that the synergistic combination of photothermal, chemodynamic, and CpG-ODN induced immunoadjuvant therapy successfully activated macrophage-mediated antitumor immunity.
 |
Figure 9 In vitro flow cytometry analysis of macrophage polarization and corresponding M1/M2 ratio in a co-culture system of B16F10 melanoma and RAW264.7 macrophage cells. The study groups include control (PBS), rGOQD, rGOQD (L+), rGOQD/MnO2 (L+), rGOQD/MnO2/CpG (L+), and rGOQD/MnO2/CpG/Q/FA (L+) for analysis of M1 macrophages (CD80+/F4/80+) (a), M2 macrophages (CD206+/F4/80+) (b), and M1/M2 ratio (c). The values are reported as mean ± SD from three experiments (n = 3). The L+ group is with NIR laser irradiation. αp < 0.05 compared with control, βp < 0.05 compared with rGOQD, γp < 0.05 compared with rGOQD (L+), δp < 0.05 compared with rGOQD/MnO2 (L+), and εp < 0.05 compared with rGOQD/MnO2/CpG (L+). |
To corroborate the polarization effect, the released IL-6 and TNF-α were quantified using an ELISA assay. The rGOQD (L+), rGOQD/MnO2 (L+), rGOQD/MnO2/CpG (L+), and rGOQD/MnO2/CpG/Q/FA (L+) treatments significantly enhanced the secretion of IL-6 (Figure 10a) and TNF-α (Figure 10b), compared to the control group treated with PBS. rGOQD shows background cytokine release similar to the control. Free CpG-ODN treatment can stimulate the secretion of these cytokines, albeit less effectively than other laser-treated groups. Conversely, DAMP release influenced polarization, inducing IL-6 and TNF-α secretion in the sequence rGOQD (L+) < rGOQD/MnO2 (L+). Notably, cells treated with rGOQD/MnO2/CpG (L+) exhibited 3.9-fold and 10-fold increases in IL-6 and TNF-α, respectively, relative to the CpG-ODN group. Among all groups, rGOQD/MnO2/CpG/Q/FA (L+) showed the utmost IL-6 and TNF-α cytokine release, thus demonstrating the highest degree of polarization. These findings further substantiate effective macrophage polarization from M2 to M1 phenotype with rGOQD/MnO2/CpG/Q/FA + NIR laser for secreting IL-6 and TNF-α to kill cancer cells directly or to activate immune cells.
 |
Figure 10 In vitro quantification of IL-6 (a) and TNF-α (b) secretion by B16F10 melanoma cells in control (PBS), CpG-ODN, rGOQD, rGOQD (L+), rGOQD/MnO2 (L+), rGOQD/MnO2/CpG (L+), and rGOQD/MnO2/CpG/Q/FA (L+) groups by ELISA assay. The values are reported as mean ± SD from five experiments (n = 5). The L+ group is with NIR laser irradiation. αp < 0.05 compared with control, βp < 0.05 compared with CpG-ODN, γp < 0.05 compared with rGOQD, δp < 0.05 compared with rGOQD (L+), εp < 0.05 compared with rGOQD/MnO2 (L+), and ζp < 0.05 compared with rGOQD/MnO2/CpG (L+). |
The rGOQD-based nanoparticles can satisfactorily induce photothermal response in vivo after irradiating with NIR laser in 3 min (Figure S6a). In the PBS (L+) group, where mice were administered PBS, the temperature rose to ~40 °C during the NIR laser-induced heating of tissues (Figure S6b). In contrast, in the mice administered with rGOQD/MnO2 or rGOQD/MnO2/CpG, the temperature rose to ~53 °C in 3 min, whereas rGOQD/MnO2/CpG/Q/FA (L+) showed the most pronounced hyperthermia effect with temperature rise to ~59 °C, as Q may enhance the photothermal response and FA can mediate nanoparticle accumulation in cancer cells.
The therapeutic efficacy was assessed in vivo by dividing B16F10 tumor-bearing C57BL/6 mice into five groups (n = 6): PBS (control), rGOQD (nanovehicle), rGOQD/MnO2 (L+), rGOQD/MnO2/CpG (L+), and rGOQD/MnO2/CpG/Q/FA (L+). The (L+) groups were irradiated with NIR laser at the tumor area 2 h post-injection. The tumor volume measured on days 7, 9, 11, and 13 indicates rapid tumor growth in mice injected with PBS or rGOQD compared with other groups (Figure 11a–d). The tumor growth rate in the rGOQD/MnO2 (L+) group was significantly retarded due to PTT/CDT. The rGOQD/MnO2/CpG (L+) group showed improved antitumor activity from PTT/CDT and the immunomodulatory effect of CpG-ODN. Most importantly, the rGOQD/MnO2/CpG/Q/FA (L+) group showed the best performance in inhibiting tumor growth among all groups. The comparison of tumor growth rate supports that rGOQD/MnO2 (L+) significantly suppresses tumor growth from PTT/CDT, which can be fortified with CpG in rGOQD/MnO2/CpG (L+) group (Figure 11e). However, rGOQD/MnO2/CpG/Q/FA (L+) provides the most significant efficacy against melanoma growth in the aggressive B16F10 syngeneic mouse model, which can be attributed to Q-enhanced PTT and a better tumor targeting ability of FA. This can be supported by the image of the excised tumor on day 13 (Figure 11f). In addition, the animal survival curves give the median survival times as PBS = rGOQD (9.5 days) < rGOQD/MnO2 (L+) (13.5 days) < rGOQD/MnO2/CpG (L+) (18 days) < rGOQD/MnO2/CpG/Q/FA (L+) (25.5 days) (Figure 11g). The rGOQD/MnO2/CpG/Q/FA (L+) group shows significantly longer survival times (25.3 ± 3.5 days, mean ± SD) than all other groups (Figure 11h).
 |
Figure 11 In vivo antitumor efficacy in B16F10 tumor-bearing mice after treatment with PBS, rGOQD, rGOQD/MnO2 (L+), rGOQD/MnO2/CpG (L+), and rGOQD/MnO2/CpG/Q/FA (L+) from tumor volume (a–d), representative excised tumor images on day 13 (e), tumor growth curve (f), survival curve (g), survival time (h), and body weight change (i). The values are reported as mean ± SD from six mice (n = 6). The L+ group is with NIR laser irradiation. αp < 0.05 compared with PBS, βp < 0.05 compared with rGOQD, γp < 0.05 compared with rGOQD/MnO2 (L+), and δp < 0.05 compared with rGOQD/MnO2/CpG (L+). |
Safety evaluation of the treatments by monitoring animal body weights during the treatments indicates no significant changes among all groups (Figure 11i). Furthermore, the H&E staining images of major organs in sacrificed animals indicate no obvious damage to any of the major organs after treatment (Figure S7). Additionally, blood samples reveal no significant changes in the hematologic parameters across the five groups (Table 3).
 |
Table 3 Hematological Analysis of Blood Samples Collected From Tumor-Bearing Mice After PBS, rGOQD, rGOQD/MnO2 (L+), rGOQD/MnO2/CpG (L+), and rGOQD/MnO2/CpG/Q/FA (L+) Treatments |
To investigate the impact of ICD and TLR9 agonist-induced macrophage polarization in vivo, single-cell suspensions derived from tumor tissues excised on day 13 were subjected to flow cytometric analysis. Macrophages were initially gated based on F4/80 expression with Alexa Fluor 488-conjugated secondary antibody for distinguishing the subtypes of M1 and M2 macrophages from the expression of CD80 and CD206, respectively, using Alexa Fluor 647-conjugated secondary antibody across two separate experimental sets. As illustrated in Figure 12a and b, there was an increase in CD80+ macrophages and a reduction in CD206+ clusters in the group treated with rGOQD/MnO2 (L+), which is attributable to ICD from rGOQD-induced tumor ablation and MnO2-induced •OH generation. This promoted the re-polarization of M2 macrophages to the M1 phenotype. For mice in the rGOQD/MnO2/CpG (L+) group, the presence of CpG-ODN effectively facilitated the polarization of TAMs towards an antitumor phenotype, showing a 41.1 ± 0.3% M1 subtype. This effect is further elevated in mice treated with rGOQD/MnO2/CpG/Q/FA (L+), with M1 macrophages constituting 45.7 ± 2.5% and a reduction in M2 macrophages to 13.0 ± 1.1%. Consequently, the administration of rGOQD/MnO2/CpG/Q/FA plus NIR laser irradiation significantly increased the M1/M2 ratio to be the highest among all groups at 3.6 ± 0.5 (Figure 12c).
 |
Figure 12 In vivo macrophage polarization analysis in B16F10 melanoma tumors after PBS, rGOQD, rGOQD/MnO2 (L+), rGOQD/MnO2/CpG (L+), and rGOQD/MnO2/CpG/Q/FA (L+) treatments. Flow cytometry plots showing M1 macrophages (CD80+/F4/80+) (a), M2 macrophages (CD206+/F4/80+) (b), and quantification of the M1/M2 ratios (c) from the corresponding populations. The values are reported as mean ± SD from three experiments (n = 3). αp < 0.05 compared with PBS, βp < 0.05 compared with rGOQD, γp < 0.05 compared with rGOQD/MnO2 (L+), and δp < 0.05 compared with rGOQD/MnO2/CpG (L+). |
To ascertain whether macrophage activation by DAMP release and TLR9 agonist can promote the activation and tumor infiltration of CD8+ T cells, tumor-infiltrating immune cells were analyzed using flow cytometry with the help of markers for cytotoxic helper T cells (CD4+) and T lymphocytes (CD8+).64 Flow cytometry of tumor single-cell suspensions revealed treatment-dependent changes in CD4 and CD8-expressing populations. The rGOQD control showed negligible CD8+ events (0.07% and 0.05%, respectively), whereas other treatment groups exhibited a substantial increase in CD8+ frequencies with rGOQD/MnO2/CpG (L+), higher than rGOQD/MnO2 (L+) (Figure S8). The rGOQD/MnO2/CpG/Q/FA (L+) group shows the highest CD4+/CD8+ T cells, with the CD8+:CD4+ ratio increased markedly to ~1, indicating a shift toward a cytotoxic phenotype, and is in line with the best M1 polarization effect of TAMs from this group.
The intratumoral infiltration of CD8+ and CD4+ T cells was also revealed from IF staining. Minimal T-cell infiltration was found in the PBS and rGOQD groups, while laser-activated rGOQD/MnO2 (L+) increased CD4+ and CD8+ populations due to ICD-mediated immune activation (Figure 13a).65 The incorporation of CpG-ODN further elevated T-cell recruitment in rGOQD/MnO2/CpG (L+) group, and the best rGOQD/MnO2/CpG/Q/FA (L+) treatment induced the strongest infiltration owing to enhanced targeting, HSP70 suppression, and synergistic PTT/CDT-driven immunomodulation. Semi-quantification of IF staining results showed that CD4+ and CD8+ T-cell fluorescence intensities were markedly higher in the rGOQD/MnO2/CpG/Q/FA (L+) group compared to other treatments, confirming enhanced intratumoral T-cell infiltration (Figure 13b). It should be noted that hypoxia in the TME may suppresses T cell infiltration, which can be alleviated by using MnO2 to decompose overexpressed acidic H2O2 within TME to produce O2 in situ.66
 |
Figure 13 (a) Immunofluorescence analysis of CD4+ and CD8+ T-cell infiltration in tumor tissues following PBS, rGOQD, rGOQD/MnO2 (L+), rGOQD/MnO2/CpG (L+), and rGOQD/MnO2/CpG/Q/FA (L+) treatments (bar = 150 µm). (b) The semi-quantitative analysis of CD4+ and CD8+ T-cell infiltration in tumor sections. The values are reported as mean ± SD from three replicates (n = 3). αp < 0.05 compared with PBS, βp < 0.05 compared with rGOQD, γp < 0.05 compared with rGOQD/MnO2 (L+), and δp < 0.05 compared with rGOQD/MnO2/CpG (L+). Abbreviations: DAPI, 4’,6-diamidino-2-phenylindole; CD4, cluster of differentiation 4; CD8, cluster of differentiation 8. |
The H&E staining of tumors reveals that the PBS and rGOQD groups caused the least cellular apoptotic damage, while the GOQD/MnO2 (L+) group exhibited increased apoptotic cells from PTT/CDT (Figure 14a). The combination of PTT/CDT, along with the immunoadjuvant CpG in rGOQD/MnO2/CpG (L+), results in further decreased cellular density. Nonetheless, the synergistic effect of enhanced PTT/CDT in addition to TLR9 agonist targeted therapy from rGOQD/MnO2/CpG/Q/FA (L+) induced the highest level of cellular apoptosis. From IHC analysis, repolarization of TAMs can promote the release of pro-inflammatory cytokines TNF-α and IL-6 (Figure 14b). TNF-α exhibits pleiotropic pro-inflammatory properties, and it can directly kill cancer cells through the death receptor signaling pathway.67 IL-6 orchestrates the development of immune response, and promotes T cell proliferation following T cell receptor stimulation.68 rGOQD/MnO2/CpG/Q/FA (L+) shows more positive regions of both cytokines compared to the other groups, and the trend is in agreement with the in vivo anti-tumor study. The increase in cytokine release is owing to the phenotypic conversion to M1 and DAMP-induced cytokine release, thus promoting more T infiltration in the tumor tissue, as shown before from flow cytometry and IF staining. Furthermore, Ki-67 and CC3 IHC staining demonstrated that the rGOQD/MnO2/CpG/Q/FA (L+) group exhibited the lowest level of tumor cell proliferation and the highest degree of apoptosis compared to all other treatment groups. Consistently, immunohistochemical (IHC) analysis of HSP70 revealed negligible expression in both PBS and rGOQD control groups. In contrast, rGOQD/MnO2 (L+) and rGOQD/MnO2/CpG (L+) treatments lead to upregulation of HSP70 expression, attributed to laser-induced hyperthermic stress. Notably, rGOQD/MnO2/CpG/Q/FA (L+) demonstrated significant suppression of HSP70 expression, owing to the presence of Q as a small molecule HSP70 inhibitor. This reconfirms the nanoparticle’s ability to effectively modulate heat shock response and overcome thermotolerance, thereby enhancing photothermal therapeutic efficacy. The semi-quantitative analysis of IHC results shown in Figure 14b is in line with the above discussion.
 |
Figure 14 (a) H&E and immunohistochemical (IHC) analysis of cell proliferation marker protein Ki-67, pro-inflammatory cytokine IL-6 and TNF-α, cellular apoptosis marker protein cleaved caspase 3 (CC3), and heat shock protein 70 (HSP70) after PBS, rGOQD, rGOQD/MnO2 (L+), rGOQD/MnO2/CpG (L+), and rGOQD/MnO2/CpG/Q/FA (L+) treatment. (b) Semiquantitative IHC analysis. The values are reported as mean ± SD from three replicates (n = 3). αp < 0.05 compared with PBS, βp < 0.05 compared with rGOQD, γp < 0.05 compared with rGOQD/MnO2 (L+), and δp < 0.05 compared with rGOQD/MnO2/CpG (L+). |
Conclusion
In summary, the rGOQD/MnO2/CpG/Q/FA nanoplatform successfully integrates the photothermal and chemodynamic effects with immunostimulatory mechanisms for advanced melanoma treatment. The NIR-driven heat generation and MnO2-mediated Fenton-like reactions induced excessive ROS production for tumor cell apoptosis. The ICD-mediated DAMP release and CpG-ODN binding to TLR9 can promote M1 polarization of TAMs. This subsequently stimulates cytokine secretion for T-cell activation, leading to amplified immune response. With quercetin minimizing cellular thermotolerance and folic acid active targeting melanoma cells, the localized PTT/CDT can be unified with ICD and CpG-ODN delivery for systemic immune stimulation with excellent tumor killing and fewer side effects in mice model. Overall, this work demonstrates the potential of rGOQD-based nanomaterials as next-generation therapeutic nanoplatforms, which can combine PTT/CDT with immune modulation for effective cancer treatment. Future research could explore the application of this nanoplatform to other solid tumors with immunosuppressive microenvironments. What’s more, a deeper understanding of how tumor-associated immune cells influence the response to this nanomedicine approach would be crucial for refining its effectiveness.
Acknowledgments
The authors thank the technical support provided by the Instrumentation Center and the Microscopy Center at Chang Gung University.
Funding
This research was supported by grants from the Ministry of Science and Technology (NSTC112-2314-B-182-046-MY2 and NSTC114-2314-B-182A-082-MY3) and Chang Gung Memorial Hospital (CMRPG3N0502 and CMRPD2N0091).
Disclosure
The authors report no conflicts of interest in this work.
References
1. Duan LJ, Wang Q, Zhang C, Yang DX, Zhang XY. Potentialities and challenges of mRNA vaccine in cancer immunotherapy. Front Immunol. 2022;13:923647. doi:10.3389/fimmu.2022.923647
2. Kennedy LB, Salama AKS. A review of cancer immunotherapy toxicity. CA Cancer J Clin. 2020;70(2):86–26. doi:10.3322/caac.21596
3. Huang J, Yang B, Peng Y, et al. Nanomedicine-boosting tumor immunogenicity for enhanced immunotherapy. Adv Funct Mater. 2021;31(21):2011171. doi:10.1002/adfm.202011171
4. Chen W, Jiang M, Yu W, et al. CpG-based nanovaccines for cancer immunotherapy. Int J Nanomed. 2021;16:5281–5299. doi:10.2147/IJN.S317626
5. Ma W, Gilligan BM, Yuan J, Li T. Current status and perspectives in translational biomarker research for PD-1/PD-L1 immune checkpoint blockade therapy. J Hematol Oncol. 2016;9(1):47. doi:10.1186/s13045-016-0277-y
6. Ma G, Du S, Li X, et al. pH-responsive neutrophil membrane camouflage Ga–Mn bimetallic nanodecoy triggers apoptosis-immunity-metastasis suppression for tumor therapy. Biomaterials. 2026;327:123794. doi:10.1016/j.biomaterials.2025.123794
7. Qian B-Z, Pollard JW. Macrophage diversity enhances tumor progression and metastasis. Cell. 2010;141(1):39–51. doi:10.1016/j.cell.2010.03.014
8. Rodell CB, Arlauckas SP, Cuccarese MF, et al. TLR7/8-agonist-loaded nanoparticles promote the polarization of tumour-associated macrophages to enhance cancer immunotherapy. Nat Biomed Eng. 2018;2(8):578–588. doi:10.1038/s41551-018-0236-8
9. Shan H, Dou W, Zhang Y, Qi M. Targeted ferritin nanoparticle encapsulating CpG oligodeoxynucleotides induces tumor-associated macrophage M2 phenotype polarization into M1 phenotype and inhibits tumor growth. Nanoscale. 2020;12(43):22268–22280. doi:10.1039/D0NR04520A
10. Xia Y, Rao L, Yao H, Wang Z, Ning P, Chen X. Engineering macrophages for cancer immunotherapy and drug delivery. Adv Mater. 2020;32(40):e2002054. doi:10.1002/adma.202002054
11. Dongye Z, Li J, Wu Y. Toll-like receptor 9 agonists and combination therapies: strategies to modulate the tumour immune microenvironment for systemic anti-tumour immunity. Br J Cancer. 2022;127(9):1584–1594. doi:10.1038/s41416-022-01876-6
12. Krieg AM. Toll-like receptor 9 (TLR9) agonists in the treatment of cancer. Oncogene. 2008;27(2):161–167. doi:10.1038/sj.onc.1210911
13. Kim SY, Heo MB, Hwang GS, et al. Multivalent polymer nanocomplex targeting endosomal receptor of immune cells for enhanced antitumor and systemic memory response. Angew Chem Int Ed Engl. 2015;54(28):8139–8143. doi:10.1002/anie.201501380
14. Klinman DM. Immunotherapeutic uses of CpG oligodeoxynucleotides. Nat Rev Immunol. 2004;4(4):249–259. doi:10.1038/nri1329
15. Weeratna RD, Davis HL, Medynski L, Krieg AM. Potential use of CpG ODN for cancer immunotherapy. Update Cancer Therapeutics. 2006;1(1):49–58. doi:10.1016/j.uct.2006.04.002
16. Zhang Z, Lu Y, Liu W, Huang Y. Nanomaterial-assisted delivery of CpG oligodeoxynucleotides for boosting cancer immunotherapy. J Control Release. 2024;376:184–199. doi:10.1016/j.jconrel.2024.09.044
17. Huang X, Lu Y, Guo M, Du S, Han N. Recent strategies for nano-based PTT combined with immunotherapy: from a biomaterial point of view. Theranostics. 2021;11(15):7546–7569. doi:10.7150/thno.56482
18. Liu H, Xu C, Meng M, et al. Metal-organic framework-mediated multifunctional nanoparticles for combined chemo-photothermal therapy and enhanced immunotherapy against colorectal cancer. Acta Biomater. 2022;144:132–141. doi:10.1016/j.actbio.2022.03.023
19. Green DR, Ferguson T, Zitvogel L, Kroemer G. Immunogenic and tolerogenic cell death. Nat Rev Immunol. 2009;9(5):353–363. doi:10.1038/nri2545
20. Yun WS, Park JH, Lim DK, Ahn CH, Sun IC, Kim K. How did conventional nanoparticle-mediated photothermal therapy become “hot” in combination with cancer immunotherapy? Cancers. 2022;14(8):2044. doi:10.3390/cancers14082044
21. Ahmad W, Sajjad W, Zhou Q, Ge Z. Nanomedicine for combination of chemodynamic therapy and immunotherapy of cancers. Biomater Sci. 2024;12(18):4607–4629. doi:10.1039/D3BM02133E
22. Gao J, Wang WQ, Pei Q, Lord MS, Yu HJ. Engineering nanomedicines through boosting immunogenic cell death for improved cancer immunotherapy. Acta Pharmacol Sin. 2020;41(7):986–994. doi:10.1038/s41401-020-0400-z
23. Xiao Z, Zuo W, Chen L, et al. H(2)O(2) self-supplying and GSH-depleting nanoplatform for chemodynamic therapy synergetic photothermal/chemotherapy. ACS Appl Mater Interfaces. 2021;13(37):43925–43936. doi:10.1021/acsami.1c10341
24. Li B, Hao G, Sun B, Gu Z, Xu ZP. Engineering a therapy-induced “immunogenic cancer cell death” amplifier to boost systemic tumor elimination. Adv Funct Mater. 2020;30(22):1909745. doi:10.1002/adfm.201909745
25. Li Z, Chu Z, Yang J, et al. Immunogenic cell death augmented by manganese zinc sulfide nanoparticles for metastatic melanoma immunotherapy. ACS Nano. 2022;16(9):15471–15483. doi:10.1021/acsnano.2c08013
26. Nam J, Son S, Ochyl LJ, Kuai R, Schwendeman A, Moon JJ. Chemo-photothermal therapy combination elicits anti-tumor immunity against advanced metastatic cancer. Nat Commun. 2018;9(1):1074. doi:10.1038/s41467-018-03473-9
27. Roti Roti JL. Cellular responses to hyperthermia (40–46°C): cell killing and molecular events. Int J Hyperthermia. 2008;24(1):3–15. doi:10.1080/02656730701769841
28. Wang X, Zhong X, Liu Z, Cheng L. Recent progress of chemodynamic therapy-induced combination cancer therapy. Nano Today. 2020;35:100946. doi:10.1016/j.nantod.2020.100946
29. Yang GG, Zhou DJ, Pan ZY, et al. Multifunctional low-temperature photothermal nanodrug with in vivo clearance, ROS-Scavenging and anti-inflammatory abilities. Biomaterials. 2019;216:119280. doi:10.1016/j.biomaterials.2019.119280
30. Ye Y, Wang C, Zhang X, et al. A melanin-mediated cancer immunotherapy patch. Sci Immunol. 2017;2(17). doi:10.1126/sciimmunol.aan5692
31. Zhang R, Qin X, Lu J, et al. Chemodynamic/photothermal synergistic cancer immunotherapy based on yeast microcapsule-derived Au/Pt nanoparticles. ACS Appl Mater Interfaces. 2023;15(20):24134–24148. doi:10.1021/acsami.3c02646
32. Dai Y, Li X, Xue Y, et al. Self-delivery of metal-coordinated NIR-II nanoadjuvants for multimodal imaging-guided photothermal-chemodynamic amplified immunotherapy. Acta Biomater. 2023;166:496–511. doi:10.1016/j.actbio.2023.05.032
33. Lai X, Lu T, Zhang F, et al. Lysosome-targeted theranostics: integration of real-time fluorescence imaging and controlled drug delivery via Zn(II)-Schiff Base complexes. J Inorganic Biochemistry. 2025;272:113015. doi:10.1016/j.jinorgbio.2025.113015
34. Lu Y, Low PS. Folate targeting of haptens to cancer cell surfaces mediates immunotherapy of syngeneic murine tumors. Cancer Immunol Immunother. 2002;51(3):153–162. doi:10.1007/s00262-002-0266-6
35. Yoo HS, Park TG. Folate-receptor-targeted delivery of doxorubicin nano-aggregates stabilized by doxorubicin-PEG-folate conjugate. J Control Release. 2004;100(2):247–256. doi:10.1016/j.jconrel.2004.08.017
36. Premji TP, Dash BS, Lu Y-J, Govindaraju DT, Chen J-P. Reduced graphene oxide quantum dots/manganese dioxide/glucose oxidase nanoparticles for cascade catalytic cancer treatment in multimodal starvation therapy-augmented chemodynamic/photothermal therapy. Colloids Surf B. 2025;253:114713. doi:10.1016/j.colsurfb.2025.114713
37. Islami M, Zarrabi A, Tada S, Kawamoto M, Isoshima T, Ito Y. Controlled quercetin release from high-capacity-loading hyperbranched polyglycerol-functionalized graphene oxide. Int J Nanomed. 2018;13:6059–6071. doi:10.2147/IJN.S178374
38. Huang L, Qiu S, Liu Z, et al. Proximity hybridization induced DNA assembly for label-free surface-enhanced Raman spectroscopic detection of carcinoembryonic antigen. Anal Chim Acta. 2022;1191:339314. doi:10.1016/j.aca.2021.339314
39. Zhang L, Yang Z, He W, Ren J, Wong CY. One-pot synthesis of a self-reinforcing cascade bioreactor for combined photodynamic/chemodynamic/starvation therapy. J Colloid Interface Sci. 2021;599:543–555. doi:10.1016/j.jcis.2021.03.173
40. Ito N, DeMarco RA, Mailliard RB, et al. Cytolytic cells induce HMGB1 release from melanoma cell lines. J Leukoc Biol. 2007;81(1):75–83. doi:10.1189/jlb.0306169
41. Cheng T, Miao J, Kai D, Zhang H. Polyethylenimine-mediated CpG oligodeoxynucleotide delivery stimulates bifurcated cytokine induction. ACS Biomater Sci Eng. 2018;4(3):1013–1018. doi:10.1021/acsbiomaterials.8b00049
42. Baral A, Satish L, Das DP, Sahoo H, Ghosh MK. Construing the interactions between MnO2 nanoparticle and bovine serum albumin: insight into the structure and stability of a protein–nanoparticle complex. New J Chem. 2017;41(16):8130–8139. doi:10.1039/C7NJ01227F
43. Ma N, Liu J, He W, et al. Folic acid-grafted bovine serum albumin decorated graphene oxide: an efficient drug carrier for targeted cancer therapy. J Colloid Interface Sci. 2017;490:598–607. doi:10.1016/j.jcis.2016.11.097
44. Tartari APS, Peczek SH, Fin MT, Ziebarth J, Machado CS, Mainardes RM. Bovine serum albumin nanoparticles enhanced the intranasal bioavailability of silybin in rats. Pharmaceutics. 2023;15(12):2648. doi:10.3390/pharmaceutics15122648
45. Chen Q, Meng Y, Hu C, et al. MnO2-modified hierarchical graphene fiber electrochemical supercapacitor. J Power Sources. 2014;247:32–39. doi:10.1016/j.jpowsour.2013.08.045
46. White AP, Reeves KK, Snyder E, et al. Hydration of single-stranded phosphodiester and phosphorothioate oligodeoxyribonucleotides. Nucleic Acids Res. 1996;24(16):3261–3266. doi:10.1093/nar/24.16.3261
47. Kim S-G, Park O-K, Lee J, Ku B-C. Layer-by-layer assembled graphene oxide films and barrier properties of thermally reduced graphene oxide membranes. Carbon Lett. 2013;14(4):247–250. doi:10.5714/CL.2013.14.4.247
48. Li Z, Zhu Y, Zeng H, et al. Mechano-boosting nanomedicine antitumour efficacy by blocking the reticuloendothelial system with stiff nanogels. Nat Commun. 2023;14(1):1437. doi:10.1038/s41467-023-37150-3
49. Lin SY, Yao BY, Hu CJ, Chen HW. Induction of robust immune responses by CpG-ODN-loaded hollow polymeric nanoparticles for antiviral and vaccine applications in chickens. Int J Nanomed. 2020;15:3303–3318. doi:10.2147/IJN.S241492
50. Hu W, Peng C, Lv M, et al. Protein corona-mediated mitigation of cytotoxicity of graphene oxide. ACS Nano. 2011;5(5):3693–3700. doi:10.1021/nn200021j
51. Pérez-Piñeiro J, Sánchez-Cea F, Arce MP, et al. Stability study of graphene oxide-bovine serum albumin dispersions. J Xenobiot. 2023;13(1):90–101. doi:10.3390/jox13010008
52. Lin LS, Song J, Song L, et al. Simultaneous fenton-like ion delivery and glutathione depletion by MnO(2) -based nanoagent to enhance chemodynamic therapy. Angew Chem Int Ed Engl. 2018;57(18):4902–4906. doi:10.1002/anie.201712027
53. Niu B, Liao K, Zhou Y, et al. Application of glutathione depletion in cancer therapy: enhanced ROS-based therapy, ferroptosis, and chemotherapy. Biomaterials. 2021;277:121110. doi:10.1016/j.biomaterials.2021.121110
54. Wang N, Zeng Q, Zhang R, Xing D, Zhang T. Eradication of solid tumors by chemodynamic theranostics with H2O2-catalyzed hydroxyl radical burst. Theranostics. 2021;11(5):2334–2348. doi:10.7150/thno.49277
55. Kazi J, Mukhopadhyay R, Sen R, Jha T, Ganguly S, Debnath MC. Design of 5-fluorouracil (5-FU) loaded, folate conjugated peptide linked nanoparticles, a potential new drug carrier for selective targeting of tumor cells. Medchemcomm. 2019;10(4):559–572. doi:10.1039/C8MD00565F
56. Manivasagan P, Joe A, Han H-W, et al. Recent advances in multifunctional nanomaterials for photothermal-enhanced Fenton-based chemodynamic tumor therapy. Mater Today Bio. 2022;13:100197. doi:10.1016/j.mtbio.2021.100197
57. Wolny D, Stojko M, Zajdel A. Novel strategies of glutathione depletion in photodynamic and chemodynamic therapy: a review. Adv Clin Exp Med. 2024;34(7):1213–1221. doi:10.17219/acem/191025
58. Sherman MY, Gabai VL. Hsp70 in cancer: back to the future. Oncogene. 2015;34(32):4153–4161. doi:10.1038/onc.2014.349
59. Shevtsov M, Huile G, Multhoff G. Membrane heat shock protein 70: a theranostic target for cancer therapy. Philos Trans R Soc Lond B Biol Sci. 2018;373(1738):20160526. doi:10.1098/rstb.2016.0526
60. Ahmed A, Tait SWG. Targeting immunogenic cell death in cancer. Mol Oncol. 2020;14(12):2994–3006. doi:10.1002/1878-0261.12851
61. Li W, Yang J, Luo L, et al. Targeting photodynamic and photothermal therapy to the endoplasmic reticulum enhances immunogenic cancer cell death. Nat Commun. 2019;10(1):3349. doi:10.1038/s41467-019-11269-8
62. Qu Y, Jiang Z, Chen Z, et al. CpG-oligodeoxynucleotides challenged macrophages ameliorate Acetaminophen induced liver injury by activating TLR9/IRG1/itaconate metabolic pathway. Mol Med. 2025;31(1):282. doi:10.1186/s10020-025-01324-0
63. Geng S, Fang B, Wang K, et al. Polydopamine nanoformulations induced ICD and M1 phenotype macrophage polarization for enhanced TNBC synergistic photothermal immunotherapy. ACS Appl Mater Interfaces. 2024;16(44):59814–59832. doi:10.1021/acsami.4c11594
64. Li P, Gao M, Hu Z, et al. Synergistic ferroptosis and macrophage re-polarization using engineering exosome-mimic M1 nanovesicles for cancer metastasis suppression. Chem Eng J. 2021;409:128217. doi:10.1016/j.cej.2020.128217
65. Li T, Guo L, Li J, et al. Precision USPIO-PEG-SLe(x) nanotheranostic agent targeted photothermal therapy for enhanced Anti-PD-L1 immunotherapy to treat immunotherapy resistance. Int J Nanomed. 2024;19:1249–1272. doi:10.2147/IJN.S445879
66. Xiang S, Zhan H, Zhan J, Li X, Lin X, Sun W. Breaking hypoxic barrier: oxygen-supplied nanomaterials for enhanced T cell-mediated tumor immunotherapy. Int J Pharm X. 2025;10:100400. doi:10.1016/j.ijpx.2025.100400
67. Liu L, Wang Y, Guo X, Zhao J, Zhou S. A biomimetic polymer magnetic nanocarrier polarizing tumor-associated macrophages for potentiating immunotherapy. Small. 2020;16(38):e2003543. doi:10.1002/smll.202003543
68. Fisher DT, Appenheimer MM, Evans SS. The two faces of IL-6 in the tumor microenvironment. Semin Immunopathol. 2014;26(1):38–47. doi:10.1016/j.smim.2014.01.008
 © 2026 The Author(s). This work is published and licensed by Dove Medical Press Limited. The
full terms of this license are available at https://www.dovepress.com/terms
and incorporate the Creative Commons Attribution
- Non Commercial (unported, 4.0) License.
By accessing the work you hereby accept the Terms. Non-commercial uses of the work are permitted
without any further permission from Dove Medical Press Limited, provided the work is properly
attributed. For permission for commercial use of this work, please see paragraphs 4.2 and 5 of our Terms.
© 2026 The Author(s). This work is published and licensed by Dove Medical Press Limited. The
full terms of this license are available at https://www.dovepress.com/terms
and incorporate the Creative Commons Attribution
- Non Commercial (unported, 4.0) License.
By accessing the work you hereby accept the Terms. Non-commercial uses of the work are permitted
without any further permission from Dove Medical Press Limited, provided the work is properly
attributed. For permission for commercial use of this work, please see paragraphs 4.2 and 5 of our Terms.
Recommended articles
Mitochondrial Reactive Oxygen Species (mROS) Generation and Cancer: Emerging Nanoparticle Therapeutic Approaches

Wang X, Xiong X
International Journal of Nanomedicine 2025, 20:6085-6119
Published Date: 13 May 2025