Back to Journals » Journal of Inflammation Research » Volume 18
Multi-Omics Integration Identifies FGF1 as a Diagnostic Biomarker and RAS-MAPK-Driven Pathogenic Factor in Osteoarthritis
Authors Yan Y, Wang C ![]() , Zhang M, Jiang X, Cheng W
, Zhang M, Jiang X, Cheng W ![]()
Received 13 July 2025
Accepted for publication 15 December 2025
Published 20 December 2025 Volume 2025:18 Pages 17803—17824
DOI https://doi.org/10.2147/JIR.S553461
Checked for plagiarism Yes
Review by Single anonymous peer review
Peer reviewer comments 4
Editor who approved publication: Dr Ujjwol Risal
Yiqun Yan,1,2 Chen Wang,1,2 Mingjun Zhang,1,2 Xuemei Jiang,3 Wendan Cheng1,2
1Department of Orthopaedics, The Second Affiliated Hospital of Anhui Medical University, Hefei, Anhui, 230601, People’s Republic of China; 2Institute of Orthopaedics, Research Center for Translational Medicine, The Second Affiliated Hospital of Anhui Medical University, Hefei, Anhui, 230601, People’s Republic of China; 3Department of Orthopaedics, Huoqiu County First People’s Hospital, Luan, Anhui, 237400, People’s Republic of China
Correspondence: Wendan Cheng, Email [email protected]
Background: Osteoarthritis (OA) is a chronic inflammatory disease characterized by cartilage damage, but its pathogenesis remains unclear.
Objective: This study aims to identify potential therapeutic targets for OA and explore associated mechanistic pathways.
Methods: OA-related data from GWAS, eQTLGen, and GEO databases were analyzed. Differential expression analysis, WGCNA, and PPI network analysis identified OA-associated genes. Machine learning algorithms determined diagnostic markers, validated by ROC curve analysis. Mendelian randomization assessed causal relationships, and single-cell sequencing explored gene dynamics in OA cartilage. In vitro and in vivo experiments validated the findings.
Results: We identified 282 differentially expressed genes (DEGs) associated with OA, with 52 hub genes, including FGF1, as a key candidate. Machine learning identified FGF1 as a diagnostic biomarker, validated by ROC curve analysis (AUCs up to 1.000 in the training set, and 0.790 and 0.761 in validation sets). Mendelian randomization suggested a potential causal relationship between FGF1 expression and OA risk (95% CI = 1.002– 1.081, p = 0.041). Single-cell sequencing explored the dynamics of diagnostic marker genes in OA cartilage progression. In vitro and in vivo experiments confirmed FGF1’s role in inflammation and matrix degradation via the RAS-MAPK pathway.
Conclusion: This study confirms FGF1 as a diagnostic biomarker for OA, with a key role in pathogenesis through RAS-MAPK pathway activation. MR analysis provides suggestive causal evidence. FGF1 induces a pro-inflammatory and catabolic state in chondrocytes by upregulating MMP13 and TNFα, while inhibiting Aggrecan synthesis, driving irreversible cartilage matrix destruction. These findings support targeting FGF1 as a novel therapeutic strategy for OA.
Keywords: mendelian randomization, eQTL, osteoarthritis, WGCNA, RF, LASSO, single-cell sequencing
Introduction
Osteoarthritis (OA) is a chronic disease that is characterized by cartilage damage and involves the entire joint tissue.1,2 Its common clinical manifestations include gradually worsening articular discomfort, stiffness, inflammation, restricted movement, and structural abnormalities.3 As the most prevalent joint disorder globally, OA impacts the health of over 500 million individuals worldwide. Particularly among the elderly population, it ranks as one of the primary causes of chronic disability.4 OA is influenced by a variety of factors, including age, gender, genetics, and body weight.5 Notably, low-grade, chronic inflammation driven by innate immune responses has emerged as a central mechanism in OA pathogenesis. This inflammatory environment is marked by the predominance of pro-inflammatory M1 macrophages and the release of key cytokines, such as IL-1β, TNF-α, and IL-6. These mediators activate critical signaling pathways, including NF-κB and MAPK (particularly the RAS-MAPK cascade involving sequential activation of RAS, RAF, MEK, and ERK kinases), thereby fueling a vicious cycle of cartilage degradation and joint destruction.6,7 However, due to the lack of a clearly defined pathogenesis, current clinical treatments primarily focus on delaying or mitigating joint cartilage damage. This is typically achieved through oral medications, such as NSAIDs and acetaminophen, or intra-articular injections, including corticosteroids and hyaluronic acid. Despite these interventions, they fail to effectively halt disease progression.8 The only way for OA patients to restore joint function in the latter stages of the illness is through joint replacement surgery. This not only inflicts significant physical and psychological distress on individuals but also imposes a substantial economic burden on healthcare systems and patients’ families.9 Even more regrettably, it must be acknowledged that OA is a silent disease prior to the onset of characteristic clinical manifestations and radiographic alterations. The joint cartilage may have sustained irreversible damage and alterations throughout the extended subclinical phase.10,11 Thus, the identification of sensitive and effective diagnostic biomarkers for early detection and the investigation of their linked molecular processes are crucial for improving OA management.12 Current research and clinical practice employ various biomarkers, such as collagen type II cleavage products (eg, CTX-II), cartilage oligomeric matrix protein (COMP), and inflammatory cytokines like IL-6.13,14 However, their diagnostic utility is often limited by low specificity, poor correlation with early disease stages, and insufficient insight into core pathogenic mechanisms.15 Therefore, there is a pressing need to discover novel biomarkers that can overcome these limitations.
Among the fibroblast growth factor (FGF) family, FGF1 has emerged as a promising yet underexplored candidate.16 FGF1 plays a multifaceted role in synovial angiogenesis, fibroblast proliferation, and chondrocyte metabolism. Increasing evidence suggests that FGF1 may contribute to the inflammatory milieu in OA by modulating cytokine secretion and influencing immune cell activity, potentially linking metabolic processes to immune-mediated cartilage degradation.17,18 However, the precise mechanisms underlying FGF1’s involvement in OA-related inflammation, as well as its diagnostic potential, remain insufficiently understood, warranting further investigation. To address this gap and to systematically identify diagnostic biomarkers for complex diseases like OA, we employed an integrative approach combining multi-omics analyses with Mendelian randomization (MR). Multi-omics approaches, including transcriptomics, proteomics, and genomics, provide a comprehensive view of disease-related molecular changes from complementary perspectives. Compared to single-method analyses, this multi-layered approach significantly enhances the likelihood of identifying functionally important candidate biomarkers. Furthermore, to transcend mere association and infer causality, MR leverages genetic variants as instrumental variables. Since genotypes are randomly allocated at conception and remain fixed throughout life, this method effectively mitigates reverse causation and confounding by environmental factors, providing more robust evidence for a potential causal role of the biomarker in disease.19
Building on this foundation, Figure 1 provides an overview of the overall design of our investigation. The primary objective of this study was to identify and validate potential diagnostic biomarkers for OA. To this end, we first performed differential expression analysis and Weighted Gene Co-expression Network Analysis (WGCNA) on relevant OA datasets to identify genes significantly associated with OA traits. Subsequently, a protein–protein interaction (PPI) network was constructed to pinpoint hub genes. Based on these candidates, two machine learning algorithms were applied to screen for robust diagnostic markers, ultimately identifying FGF1 as a highly sensitive and specific biomarker for OA. The diagnostic performance of FGF1 was then evaluated using Receiver Operating Characteristic (ROC) curve analysis, and its potential causal relationship with OA was further assessed through MR. Beyond its diagnostic implications, we further conducted exploratory analyses to gain preliminary insight into the biological mechanisms through which FGF1 may participate in OA pathogenesis. Single-cell RNA sequencing was employed to delineate the cellular distribution and dynamic expression pattern of FGF1 in OA cartilage, while complementary in vitro and in vivo experiments validated its functional relevance. Together, these findings emphasize the dual significance of FGF1 as both a sensitive diagnostic biomarker and a promising therapeutic target for OA.
 |
Figure 1 Flow chart of this study design. |
Materials and Methods
Data Sources and Preprocessing
OA microarray datasets were acquired from Gene Expression Omnibus (GEO) database, including GSE169077, GSE114007, and GSE117999, with a total of 69 samples (including 33 normal control and 36 OA samples). GSE169077 was used as the training set, and GSE114007 and GSE117999 were used as the validation sets. Data preprocessing and differential expression analysis were performed in R (version 4.3.2) using the limma package.20 Expression data were log2-transformed (log2(x+1)) when maximum intensity values exceeded 50 to better approximate a normal distribution. The normalizeBetweenArrays function was then applied to perform quantile normalization, ensuring comparability across all samples. For studies involving multiple datasets, batch effects were corrected using the ComBat function from the SVA package.21 The resulting log2-transformed and normalized intensities were used for all downstream differential expression and network analyses.
Obtaining Genes with Differential Expression and Building the WGCNA Network
Through the application of the “limma” package, differentially expressed genes between HC and OA samples were determined, with the parameters set at adj.p < 0.05 and |logFC| > 1. The results were subsequently visualized using the “pheatmap” function.
We used the WGCNA package22 in R to construct a gene co-expression network. We selected genes with a standard deviation > 0.5 to ensure that genes with low variation across samples were excluded. To ensure high-quality data, the goodSampleGenes function was used to filter out genes with missing values or abnormal patterns. The pickSoftThreshold function was employed to determine the optimal soft threshold (β = 5) for network construction. This threshold was selected based on the scale-free topology criterion (R2 ≥ 0.9). The gene expression data matrix was then transformed into an adjacency matrix using this threshold, and topological overlap clustering was used to identify gene modules. The module eigengenes (ME) were calculated to merge highly correlated modules, and a hierarchical clustering dendrogram was generated to visualize the gene modules. Gene significance (GS) and module significance (MS) were evaluated by integrating relevant phenotypic data, allowing us to assess the correlation between gene modules and clinical information.
Analysis of Functional Enrichment and Chromosomal Localization
Utilizing the “clusterProfiler” and “enrichplot” packages,23 Gene Ontology (GO) and Kyoto Encyclopedia of Genes and Genomes (KEGG) functional enrichment analyses were conducted on the selected genes, with the criteria set at adj.p < 0.05 and q < 0.05. The GO terms encompassed Biological Process (BP), Molecular Function (MF), and Cellular Component (CC). The “circlize” package was employed to visualize the chromosomal locations of the core genes, with the resulting figure randomly displaying 10 genes.
Protein-Protein Interaction Networks
The “STRINGdb” package24 was used to construct the PPI network, version 11.5, with the standard settings: species as human (9606) and a confidence threshold of 200. Nodes (genes) with interaction frequencies ≤ 25 were filtered out. The betweenness value of each node was calculated, and nodes were classified based on their betweenness centrality. Genes with betweenness values greater than the average of all nodes in the network were identified as hub genes. The PPI network was visualized using the “ggraph” package.
Screening of Disease Characterization Genes and Construction of ROC Curve Models
The “randomForest” package,25 was employed to further refine the selection of hub genes using the Random Forest (RF) method. This machine learning methodology, which amalgamates several decision trees and mitigates excessive fitting, is particularly effective for processing high-dimensional and imbalanced data, thereby enhancing the identification and screening of feature genes. Out-of-bag (OOB) error estimation was used to evaluate the model’s performance, ensuring reproducibility of the results. A fixed random seed (set to 1534167) was used to ensure consistency in model training. Additionally, the “glmnet” package,26 was utilized to apply the LASSO regression method for further screening of hub genes. This technique, which employs regularization for variable selection, demonstrates unique advantages in evaluating high-dimensional data, making it a powerful tool for identifying critical feature genes. 10-fold cross-validation was used to optimize the regularization parameter in the LASSO model, and a fixed random seed (set to 1534167) was used to ensure reproducibility of the results.
The results from the two algorithms were intersected to identify diagnostic marker genes for OA. Utilizing the “pROC” package, a ROC curve model was constructed for these diagnostic genes. The AUC value was computed to initially evaluate the diagnostic effectiveness of the marker genes for OA.
Mendelian Randomization Analysis of Diagnostic Marker Genes
This part of the analysis was carried out using R (version 4.3.2) throughout, and the process did not capture new data, but rather utilized publicly available GWAS statistical abstracts, so no additional ethical approval was required. eQTL data were obtained from the eQTLGen Consortium, comprising 31,684 samples from blood and PBMCs, and encompassing 19,942 genes.27 Using this dataset as the exposure data, cis-eQTLs with P < 5 × 10⁻⁸ were selected for subsequent unidirectional Mendelian randomization analysis.19,28 In this process, the cis-region was defined as the 10,000 kb range flanking the coding sequence, with linkage disequilibrium clustering set at R2 < 0.001. Additionally, only SNPs with an EAF > 0.01 and an F-statistic > 10 were retained, while palindromic SNPs were excluded to mitigate confounding factors and weak instrumental variable bias. The OA dataset ebi-a-GCST007090 was retrieved from the GWAS database, comprising a total of 403,124 samples (including 24,955 cases and 378,169 controls). This dataset was utilized as the outcome data. Suitable SNPs were selected as IVs to explore the causal relationship between the exposure data (eQTL data) and the outcome data. Qualified IVs must satisfy the following three assumptions: (1) The SNPs must exhibit a strong association with the exposure (eQTL data). (2) The IVs must be independent of any unmeasured confounders related to OA. (3) The IVs must influence OA solely through the eQTL data, without any direct association with the outcome via alternative pathways. These criteria ensure the robustness and validity of the Mendelian randomization analysis in establishing causal effects. Subsequently, the IVs were harmonized with the outcome data. Utilizing the “TwoSampleMR” package in R software, causal effects were evaluated through five methods: MR Egger, weighted median, inverse variance weighted (IVW), simple mode, and weighted mode. The Wald ratio method was employed to estimate the effect size of each SNP. Heterogeneity among SNP instruments was assessed using Cochrane’s Q test. Sensitivity analyses encompassed MR Egger regression and the leave-one-out method. The former was employed to assess pleiotropy, while the latter was utilized to reveal the contribution of individual SNPs to significant results.
Analysis of Single-Cell RNA Sequencing Data
ScRNA-seq data of cartilage were retrieved from the GEO database, specifically from dataset GSE220243. A total of six samples were selected, comprising three normal samples (GSM6797149, GSM6797150, GSM6797151) and three OA samples (GSM6797155, GSM6797156, GSM6797157). The “Seurat” package29,30 was employed to analyze the scRNA-seq data, beginning with quality control measures. Genes expressed in less than three individual cells, as well as cells expressing fewer than 1000 genes or exhibiting mitochondrial gene content above 20%, were removed. Subsequently, four key functions were utilized: IntegrateData for batch effect correction, NormalizeData for normalization, FindClusters for unsupervised clustering of cell subtypes, and FindAllMarkers for the analysis and annotation of marker genes across cell clusters. The “Monocle” package31 was utilized for pseudotemporal analysis and the construction of cell trajectories. The orderCells function was employed to arrange cells along a temporal axis, revealing their positions within the differentiation trajectory. The identified trajectories were color-coded based on cell types or clusters, illustrating the developmental pathways during chondrocyte differentiation.32 Furthermore, to elucidate intercellular interactions, we conducted CellChat analysis on the OA group samples following standard protocols. The visualization of the number and strength of cell-cell interactions, as well as ligand-receptor pairs, was performed with thresholds set at p-value ≤ 0.05 and log2 mean (molecule 1, molecule 2) ≥ 0.1.
Preparation of Clinical Samples and Laboratory Animals
The clinical specimen collection plan for HC and OA cartilage was approved by the Ethics Committee of the Second Affiliated Hospital of Anhui Medical University (Approval No: YX2025-030) and conducted in accordance with relevant guidelines and regulations, including the Declaration of Helsinki. HC cartilage specimens were obtained from two patients who underwent amputations due to traumatic injuries, while OA cartilage specimens were collected from four patients undergoing surgical treatment for severe OA. Written informed consent was obtained from each patient. Following collection, a portion of the specimens was immediately used for primary chondrocyte isolation and culture, while the remaining samples were fixed in 4% paraformaldehyde solution for subsequent immunohistochemical evaluation.
The animal protocol used in this study was reviewed and approved by the Experimental Animal Ethics Committee of Anhui Medical University (Approval No.: LLSC20231140). All methods were performed in accordance with relevant guidelines and regulations, including the Guidelines for the Care and Use of Laboratory Animals (eg, National Standard of the People’s Republic of China GB/T 35892-2018). This study is reported in accordance with the ARRIVE guidelines. Wild-type (WT) rats were purchased from Cyagen Biosciences Inc. (Jiangsu, China) and housed in animal facilities with a 12-hour light/dark cycle, temperature maintained at 22°C ± 2°C, and relative humidity at 50% ± 10%. The animals were randomly divided into two groups: the WT group (n=6), serving as the healthy control; and the WT+DMM group (n=6), modeling OA through surgical induction. Adult rats aged 8 weeks with an average body weight of 220 g were used. OA was induced via the DMM surgery. Briefly, rats were anesthetized using 0.3% sodium pentobarbital (40 mg/kg) combined with 1% lidocaine. A medial joint incision was made to expose the right knee joint, and the medial meniscus ligament was transected, followed by gentle separation of the medial meniscus. Finally, the medial joint capsule incision was sutured, and the skin was closed. Postoperative analgesia was maintained with subcutaneous buprenorphine (0.05 mg/kg) every 8–12 hours for 48 hours. At 10 weeks post-surgery, rats were euthanized with an overdose of pentobarbital sodium under deep anesthesia, and knee joints were harvested. A portion of the samples was immediately used for primary chondrocyte isolation and culture, while the remaining tissue was fixed in 4% paraformaldehyde solution for subsequent immunohistochemical evaluation.
Culturing of Cells
Human or rat cartilage was digested using 0.25% Collagenase II (USA, Sigma-Aldrich, Cat# C6885) in DMEM medium (USA, Gibco, Cat# 11995065), with the enzyme volume ten times that of the cartilage tissue. The digestion process was carried out at 37°C for 4 to 6 hours, with the tissue digestion monitored and gently agitated every 30 minutes. The resulting mix was filtered via a 70 μm mesh, and the resultant filtrate went through a centrifuge at 1245 rpm for 5 minutes, following which the supernatant was thrown. The pelleted cells were resuspended in DMEM, centrifuged again for 5 minutes, and this washing step was repeated twice. Finally, the cells were cultured in DMEM medium supplemented with 10% fetal bovine serum (FBS, Gibco, Cat# 10099141) in a humidified incubator maintained at 37°C with 5% CO2. All experiments used primary chondrocytes at passages 3–5, maintained in a humidified incubator at 37°C with 5% CO2.
Transient Transfection Technology
The shRNA plasmids targeting FGF1 were designed and constructed by GenePharma Co, Ltd. in Shanghai, China, and included the following sequences: human sequence, 5′-GCCCTGACCGAGAAGTTTAAT-3′, and rat sequence, 5′- CGCAGACACCAAATGAGGAAT-3′. Following the manufacturer’s protocol, chondrocytes were cultured in serum-free medium in six-well plates and transfected with FGF1 using Lipofectamine 2000 (Invitrogen, Cat#11668027). Cell status was observed 6 hours post-transfection, and the cells were further cultured for 72 hours. The knockdown efficiency of the target gene was subsequently evaluated through immunoblot analysis.
Immunohistochemical Analysis
Conduct immunohistochemical staining for FGF1, MMP13, TNFα, and Aggrecan on the tissue sections. Cartilage samples were obtained from both HC and OA patients, fixed overnight in a 4% paraformaldehyde solution, dehydrated through an ethanol series, washed, embedded in paraffin, and sectioned at 7μm. Following the extraction of rat knee joints, the tissues were fixed in 4% paraformaldehyde for 48 hours and decalcified in 10% EDTA for 4 weeks. The joints were subsequently embedded in paraffin and sectioned at 5μm.
Following deparaffinization, the tissue sections were immersed in a 4% H2O2 solution for 10 minutes, followed by antigen retrieval using a citrate buffer solution. After blocking non-specific binding sites, the sections were incubated in appropriately diluted primary antibody solutions at 4°C overnight to ensure optimal antigen-antibody interaction. The next day, the secondary antibody was added and incubated for 30 minutes. The color was developed using diaminobenzidine and counterstained using hematoxylin. Finally, the slides were dehydrated in ethanol and clarified in xylene. After microscopic observation and photographs, positive cells were quantified using Image J software.
Immunofluorescence Analysis
Twenty-four hours prior to staining, primary human/rat chondrocytes were seeded onto coverslips within 24-well plates. After washing the cells with PBS, they were fixed in 4% paraformaldehyde for 30 minutes. Following permeabilization, bovine serum albumin (BSA) was used for blocking. Add the antibody solution with the corresponding primary antibody dilution and incubate at 4°C overnight. On the next day, the secondary antibody was added and incubated for 30 minutes away from light. Finally, DAPI was added to the well plates as a cell nuclear dye, and the staining was restained for 5 min away from light, and the images were obtained by fluorescence microscopy. Fluorescence intensity was quantified using ImageJ software.
Western Blotting Analysis
Cells were lysed using RIPA lysis buffer (Beyotime Biotech #P0013B) supplemented with protease inhibitors. Proteins were separated via SDS-PAGE and transferred onto PVDF membranes. After blocking with 5% skim milk, the membranes were incubated overnight at 4°C with primary antibodies against FGF1 (1:1500, AB_2838091,#DF6124), MMP13 (1:1500, AB_2837840,#AF5355), TNFα (1:1500, AB_2835319,#AF7014), Aggrecan (1:1500, AB_2841055,#DF7561), Ras (1:1500, AB_2840563,#AF8059), P-c-Raf (1:1500, AB_2834492,#AF3065), pMEK1/2 (1:1500, AB_2840098,#AF8035), ERK1/2 (1:1500, AB_2833336,#AF0155), p-ERK1/2 (1:1500, AB_2834432,#AF1015), and GAPDH (1:3000, AB_2107311,#PA1-987). All antibodies were rabbit-derived polyclonal antibodies sourced from Affinity Bioreagents, USA. Subsequently, the membranes were incubated with secondary antibodies at 37°C for 2 hours, and protein bands were visualized using a microplate electrochemiluminescence system (Share-BIO, SB-WB012). Subsequently, the bands were normalized and analyzed for each purpose using Image J, 1.80v software, using GAPDH bands as the standard.
Results
Identification of DEGs with Key WGCNA Modules
To minimize technical bias and ensure comparability across different sample datasets on the same scale, batch effect removal and standardization were performed (Figure 2A and B). Significant differences between the HC and OA samples were then found by differential analysis (Figure 2C and D). 194 strongly downregulated genes and 151 significantly upregulated genes made up the 345 DEGs that were found.
 |
Figure 2 DEGs and WGCNA Analysis. (A and B) Batch effect removal and normalization pre- and post-integration. (C and D) Heatmap and volcano plot of DEGs. (E) Sample clustering trait diagram. (F) Hierarchical clustering dendrogram, with branches representing genes and colors indicating co-expression modules. (G) Scatter plot of module-trait relationships and gene significance. (H) Scale-free topology fit index and mean connectivity under varying soft-thresholding powers. (I) Heatmap of module-clinical trait correlations and significance. |
To examine the relationship between genes and traits, we performed a WGCNA. The sample clustering trait diagram distinctly illustrates the relationships between individual samples and their corresponding traits (Figure 2E). By selecting an optimal soft threshold β = 5 (scale-free R2 = 0.9), We created a network of co-expression between the OA and HC samples (Figure 2H). A total of twelve color-coded modules were found using dynamic hybrid cutting (Figure 2F). A heatmap (Figure 2I) displays the results of our calculations of the Pearson correlation coefficients and significance levels between each module and clinical trait features. Notably, the turquoise module, encompassing 1649 genes, exhibited a remarkably high correlation of 0.98 with clinical traits, accompanied by a P-value of 2e-07, thus being designated as the pivotal module. Within this module, 388 genes with both gene significance and module membership values exceeding 0.8 were identified as key genes (Figure 2G).
Functional Enrichment Analysis of Core Genes
We got 282 differentially expressed genes that show significant relationships with OA characteristics by intersecting the 345 DEGs with the 388 critical module genes found using WGCNA. These genes are considered core genes.
To elucidate the biological functions of the core genes, we conducted GO and KEGG enrichment analyses. The GO enrichment results (Figure 3A, B and E) revealed the following: Biological Processes (BP): These genes were significantly enriched in processes such as extracellular structure organization and positive regulation of MAP kinase activity. Cellular Components (CC): They were associated with the synthesis of collagen-containing extracellular matrix, endoplasmic reticulum, lumenal basolateral membrane, and collagen trimer. Molecular Functions (MF): These genes were closely linked to extracellular matrix structural constituents and glycosaminoglycan binding. The KEGG analysis (Figure 3C and D) indicated that these genes are primarily involved in the MAPK signaling pathway, PI3K-Akt signaling pathway and protein digestion and absorption. Additionally, we constructed a chromosomal localization circos plot (Figure 3F), currently displaying 10 randomly selected core genes for illustrative purposes.
 |
Figure 3 GO and KEGG Enrichment Results. (A, B and E) GO bar plot, bubble plot, and circos plot. (C and D) KEGG bar plot and bubble plot. (F) Gene chromosomal localization circos plot. In all panels, red highlights/annotations represent biological functions and signaling pathways potentially associated with FGF1. |
Acquisition of Disease Characterization Genes
In the PPI network constructed using the 282 core genes, a total of 271 nodes and 2551 edges were identified. The nodes were color-coded and sized based on their betweenness values, with larger and darker nodes indicating higher betweenness values. From this analysis, 52 hub genes were detected (Supplementary Figure S1).
Two machine learning algorithms, RF and LASSO, were employed to further refine the selection of the 52 hub genes. Using the RF algorithm, six feature genes—FGF1, PLOD2, PDK4, ANGPTL2, SERPINF1 and COL6A1—were found to have relative importance scores greater than 0.5 (Figure 4A and B). Meanwhile, the LASSO algorithm, selected eighteen feature genes based on the minimum cross-validation error (Figure 4C and D): ITGB4, FAP, MMP2, GADD45B, CDKN1B, MMP13, FOSL2, PLOD2, ANGPTL4, FBN1, BNIP3, BCL6, LTBP1, CEBPD, TGFBI, TXNIP, VEGFA and FGF1. Subsequently, the intersection of the feature genes obtained from both algorithms revealed FGF1 and PLOD2 as a diagnostic biomarker for the disease (Figure 4E). ROC curve models for FGF1 and PLOD2 were constructed using both training and validation datasets (Figure 4F–H). An AUC > 0.7 indicates high predictive accuracy. The specificity and sensitivity of FGF1 and PLOD2 in diagnosing OA were assessed using the AUC. In the overall model (Supplementary Figure S2), the training dataset achieved an AUC of 1.000 (95% CI: 1.000–1.000). When tested in two independent validation datasets, the AUCs were 0.972 and 0.930, with 95% confidence intervals of 0.622–0.931 and 0.790–1.000, respectively, demonstrating strong predictive performance and good generalizability across datasets. To further assess the diagnostic performance at the gene level, single-gene AUC evaluations were conducted. In the dataset GSE169077, the AUC for FGF1 and PLOD2 was 1 (Figure 4F). In the datasets GSE114007 and GSE117999, the AUC values for FGF1 were 0.761 and 0.790, respectively (Figure 4G and H). The AUC values for PLOD2 were 0.681 and 0.660, respectively, indicating significantly lower diagnostic efficacy compared to FGF1. Consequently, we conclude that PLOD2 holds substantially less diagnostic value than FGF1, and subsequent investigations will prioritize FGF1 as the primary focus. Furthermore, the differential expression of FGF1 was validated across three datasets (Figure 4I–K). FGF1 exhibited significantly elevated expression in OA samples, with P-values of 0.0043 in the training dataset and 0.0053 and 0.029 in the two validation datasets, respectively.
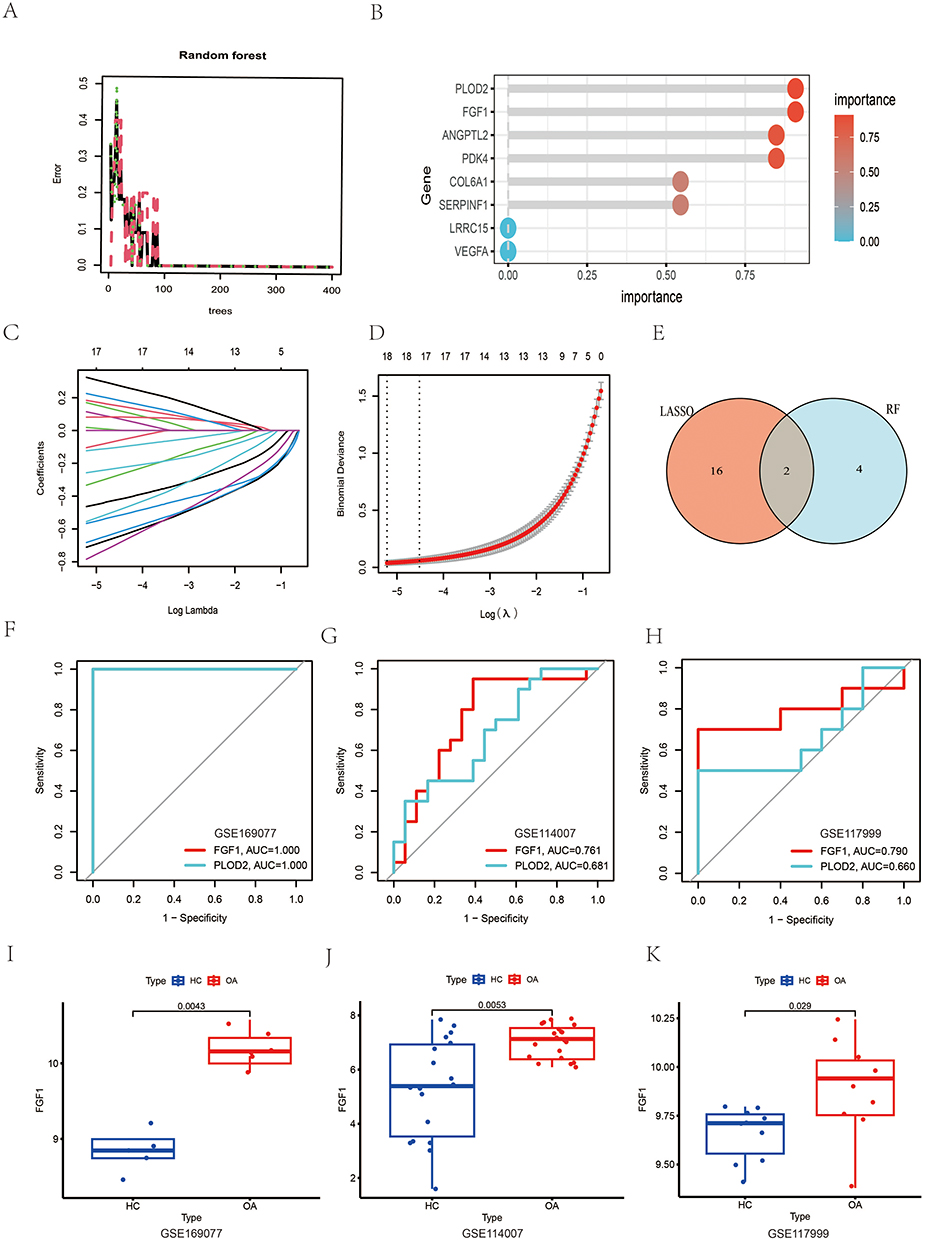 |
Figure 4 Feature Gene Screening Using RF and LASSO Algorithms. (A) Relationship between the number of trees and the error rate. (B) Ranking of gene importance, highlighting the top feature genes. (C and D) Ten-fold cross-validation of the LASSO model and its coefficient curves. The vertical dashed line indicates the optimal lambda value. (E) Venn diagram illustrating the overlap between the feature genes identified by RF and LASSO. (F–H) ROC curve models for FGF1 and PLOD2 in the training and validation datasets, demonstrating diagnostic performance. (I–K) Box plots showing the differential expression of FGF1 in the training and validation datasets, with significant upregulation in OA samples. |
FGF1 is Considered to Be a High-Risk Gene for OA
After doing association analysis and eliminating linkage disequilibrium, we discovered 5430 genes linked with 26,152 highly correlated SNPs (F-value > 10, Supplementary Table S1). By extracting outcomes from the OA GWAS summary data using instrumental variables (SNPs) from the exposure dataset, We acquired summary data for 25,490 SNPs associated with OA (Supplementary Table S2). There was no evidence of heterogeneity (Supplementary Table S3) or pleiotropy (Supplementary Table S4) among these instrumental variables. After aligning the reference allele directions, Mendelian randomization analysis was conducted, and the corresponding odds ratios (ORs) were calculated (Supplementary Table S5). Subsequently, based on predefined criteria, we further refined the results of the Mendelian randomization analysis, ultimately identifying 307 genes causally associated with the development and progression of OA (Supplementary Table S6). This encompasses 169 low-risk genes and 138 high-risk genes, with high/low-risk genes indicating the augmented or diminished probability of OA incidence associated with heightened expression levels of the corresponding genes. Based on these data, we illustrated the causal link between FGF1 and OA (Figure 5A). Using the IVW method, we demonstrated a correlation between FGF1 expression levels and OA risk, indicating that elevated FGF1 expression correlates with an increased risk of osteoarthritis. The IVW analysis yielded an OR of 1.041 for FGF1 (95% CI = 1.002–1.081, p = 0.041). Furthermore, we evaluated the impact of each SNP on OA outcomes (Figure 5B). The funnel plot demonstrated near symmetry vertically, and no substantial horizontal pleiotropy was seen in the MR Egger regression intercept (Figure 5C). In conclusion, we performed a one-at-a-time sensitivity assessment by methodically removing each single nucleotide polymorphism and reimplementing the Mendelian randomization analysis on the retained SNPs. The results corresponded with the preliminary findings (Figure 5D). Indicating that the overall causal relationship is driven by the collective influence of all SNPs rather than being dominated by any specific SNP.
 |
Figure 5 MR Analysis of FGF1 and OA. (A) Scatter Plot: Shows causal link between FGF1 levels and OA risk. (B) Forest Plot: Displays individual SNPs’ impact on OA risk. (C) Funnel Plot: Assesses reliability of FGF1-OA causal relationship. (D) Leave-One-Out Analysis: Visualizes FGF1’s causal effect by sequentially excluding SNPs. |
The Expression of FGF1 is Subject to a Progressive Increase During the Development of OA Cartilage Cells
Following stringent quality control and batch effect removal, we successfully obtained single-cell transcriptomic data from 32,766 cells. Utilizing t-distributed Stochastic Neighbor Embedding (t-SNE) and Single Cell type annotation (SCSA), HC chondrocytes were clustered into 11 distinct groups (Figure 6A and B), while OA chondrocytes were grouped into 12 clusters (Figure 6D and E). The expression of FGF1 was validated in both HC and OA single-cell samples (Figure 6C and F). Differential expression analysis indicated a significant increase of FGF1 in OA chondrocytes relative to HC (Supplementary Figure S3A). To further investigate the expression patterns of FGF1 across various stages of cell differentiation and uncover its dynamic changes during this process, we conducted pseudotime trajectory analysis. In HC chondrocytes, 9 differentiation trajectories were identified (Figure 6G and H). Trajectory 1 represented the initial stage of cell differentiation, while Trajectory 7 marked the terminal phase (Figure 6I). Differential analysis between Trajectory 1 and Trajectory 7 (Supplementary Figure S3B) demonstrated a significant reduction in FGF1 expression in Trajectory 7 cells. In OA chondrocytes, 7 differentiation trajectories were observed (Figure 6J and K). Trajectory 1 indicated the onset of differentiation, and Trajectory 5 signified the conclusion of the process (Figure 6L). Differential analysis between Trajectory 1 and Trajectory 5 (Supplementary Figure S2C) revealed a notable increase in FGF1 expression in Trajectory 5 cells.
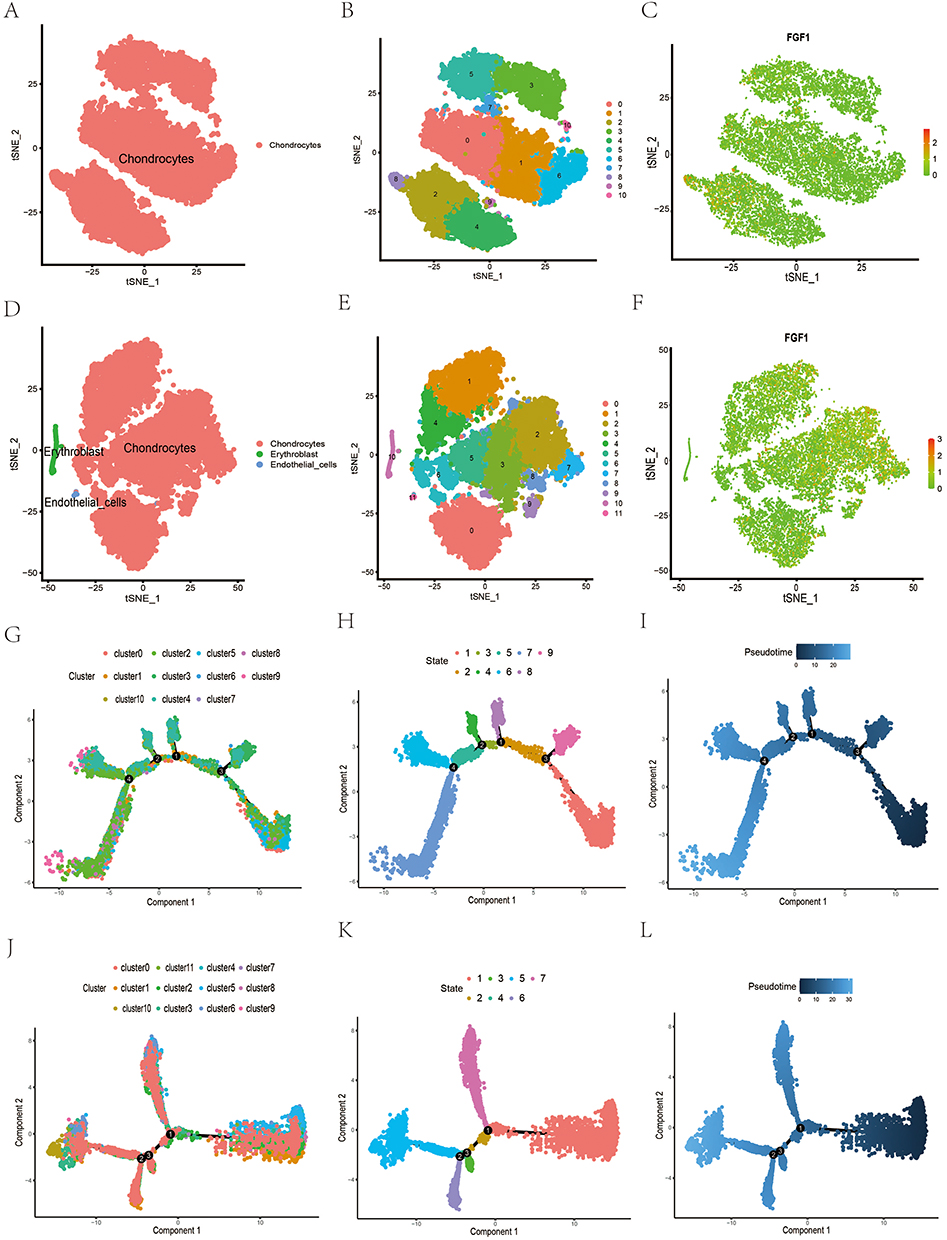 |
Figure 6 Single-cell transcriptomic analysis of human HC versus OA cartilage. (A and B) t-SNE plots of HC chondrocytes clustered into 11 clusters. (C) FGF1 expression in individual cell clusters of HC cartilage. (D and E) t-SNE plots of OA chondrocytes clustered into 12 clusters. (F) FGF1 expression in individual cell clusters of OA cartilage. (G–I) Proposed temporal trajectory plots of HC chondrocyte clusters. (J–L) Proposed temporal trajectory plots of OA chondrocyte clusters. |
FGF1 Drives OA Chondrocyte Communication Through FGFR1-Mediated Signaling
To delve deeper into the cellular communication among OA chondrocytes, we employed CellChat to analyze ligand-receptor (L-R) interactions. Initially, the types and origins of these ligand-receptor pairs were identified (Figure 7A). Subsequently, we discovered that the diagnostic marker gene FGF1 predominantly participates in the FGF signaling pathway, with the corresponding ligand-receptor interactions exclusively observed among chondrocytes (Figure 7B–D). Finally, we elucidated the cellular communication patterns mediated by FGF1 in OA chondrocytes (Figure 7E and F). As a ligand gene, FGF1 can bind to three receptor genes: FGFR1, FGFR2, and FGFR3. Among these, the interaction between FGF1 and FGFR1 exhibited the highest contribution, with a P-value of 0.0075. These findings suggest that in OA chondrocytes, FGF1 primarily binds to FGFR1, thereby activating downstream signaling pathways.
 |
Figure 7 Analysis of cellular communication between OA chondrocytes. (A) Types and sources of ligand-receptor pairs. (B–D) Likelihood and importance of different cluster interactions in the FGF signaling pathway. (E and F) Likelihood of FGF1 interaction with its receptor binding in OA chondrocytes and the percentage of contribution. |
FGF1 Expression is Upregulated in Human OA and Experimental OA Rat Models
To validate the expression patterns of FGF1 in human and rat chondrocytes, we conducted Western blot analyses on HC and OA samples (Figures 8A and 9A). Consistent with our previous findings, FGF1 expression levels were significantly higher in OA chondrocytes compared to HC chondrocytes in both human and rat models, as confirmed by quantitative analysis with statistical significance (P < 0.05). Additionally, immunofluorescence quantitative analysis (Figures 8B and 9B) revealed a markedly higher fluorescence intensity of FGF1 in OA chondrocytes than in HC chondrocytes (P < 0.05). Immunohistochemical analysis (Figures 8C and 9C) further corroborated these results, demonstrating abundant FGF1 expression in OA cartilage tissues and minimal presence in HC cartilage tissues, with corresponding quantitative analysis confirming this upregulation (P < 0.05).
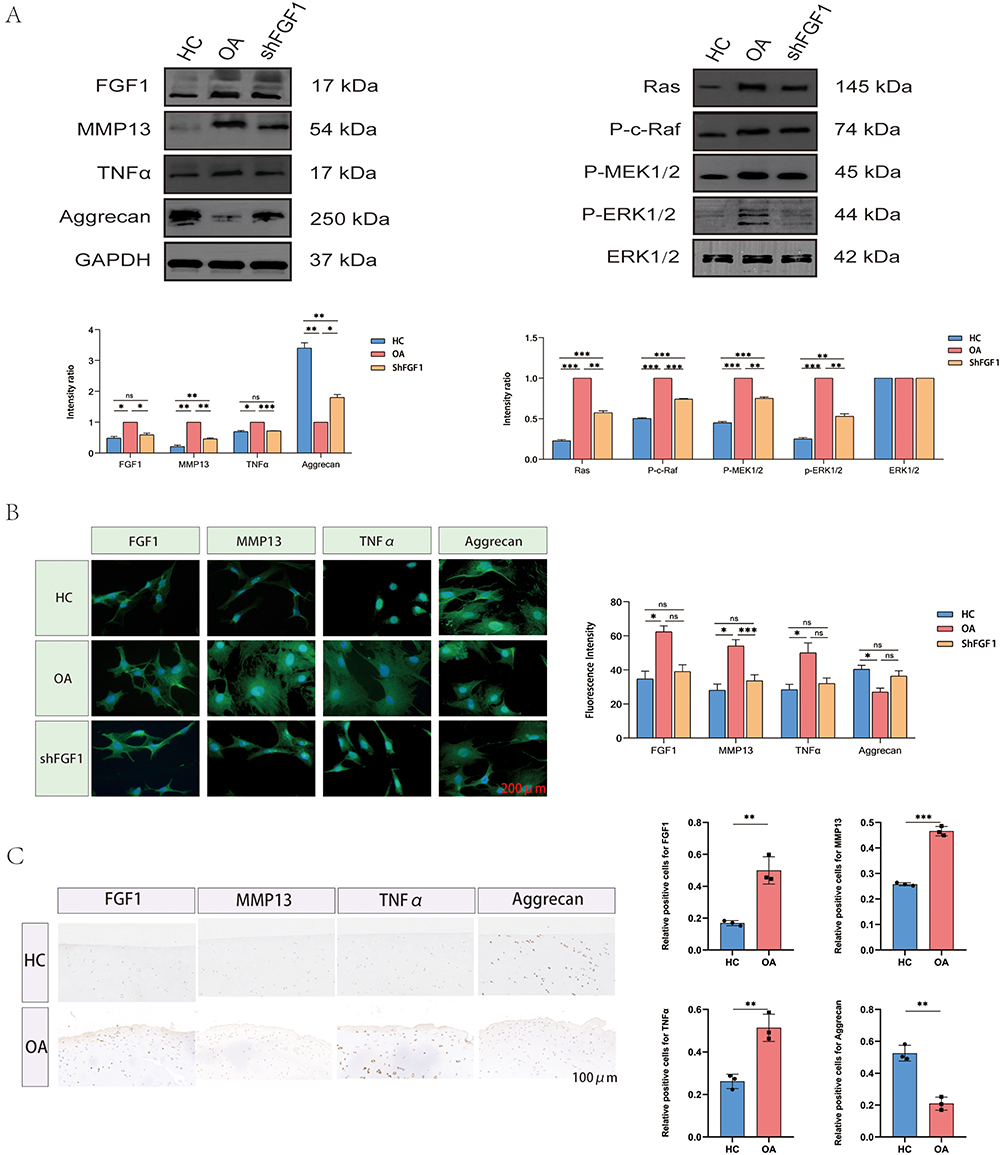 |
Figure 8 Expression pattern of FGF1 in human chondrocytes. (A) Western blot analysis of human chondrocytes. (B) Immunofluorescence analysis of human chondrocytes. (C) Immunohistochemical analysis of human chondrocytes. Statistical significance is indicated as *p < 0.05, **p < 0.01, ***p < 0.001, and ns = not significant. Colored bars represent different groups (blue = HC, Orange = OA, pink = shFGF1). The black square box in the legend represents the color indicator for each group. |
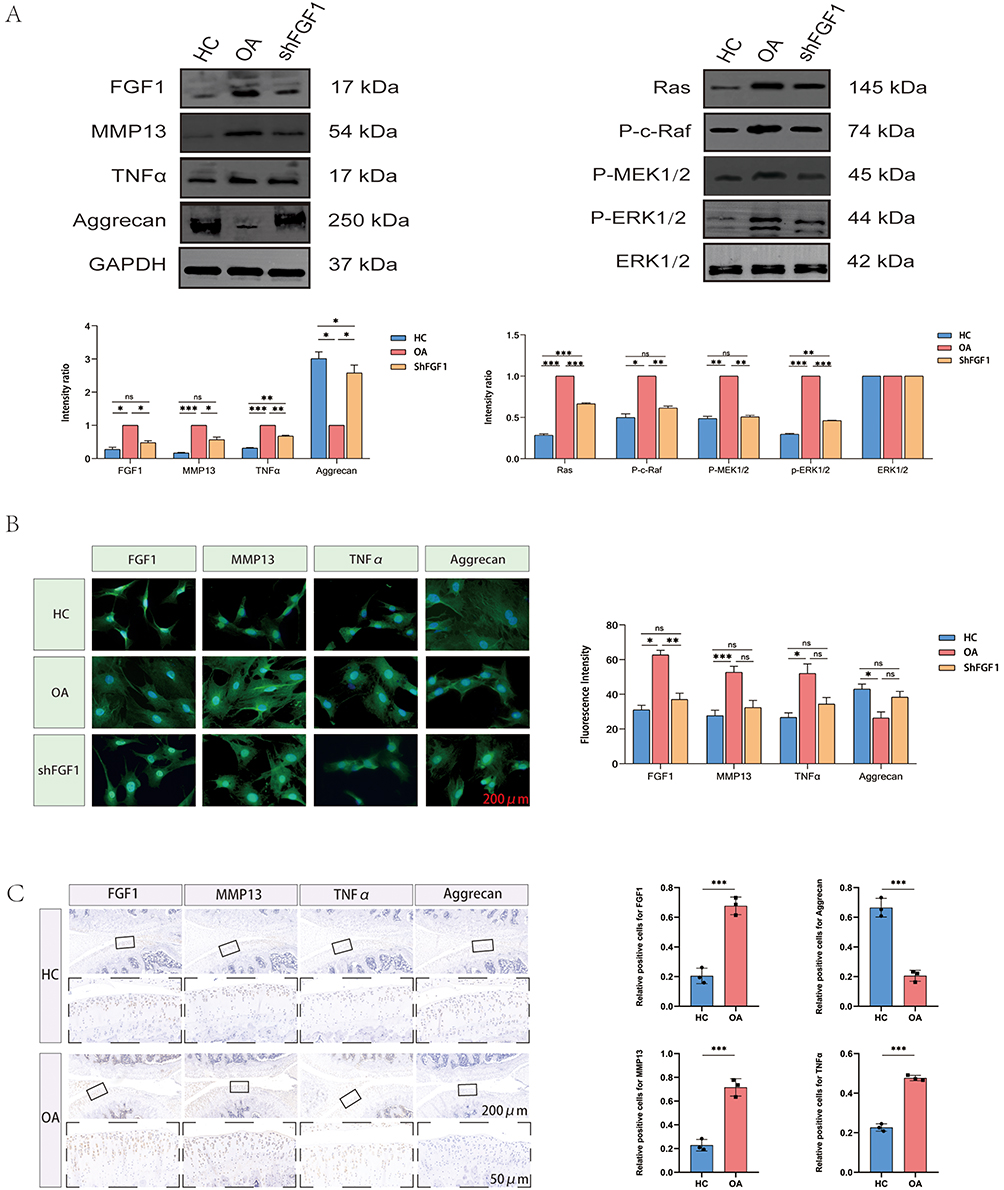 |
Figure 9 Expression pattern of FGF1 in rat chondrocytes. (A) Western blot analysis of rat chondrocytes. (B) Immunofluorescence analysis of rat chondrocytes. (C) Immunohistochemical analysis of rat chondrocytes. Statistical significance is indicated as *p < 0.05, **p < 0.01, ***p < 0.001, and ns = not significant. Colored bars represent different groups (blue = control, red = OA, green = shFGF1). The black square box in the legend represents the color indicator for each group. |
Moreover, to further elucidate OA-associated molecular alterations, we first evaluated the expression levels of key markers—MMP13, TNFα, and Aggrecan—in human and rat chondrocytes. Notably, MMP13 and TNFα were significantly upregulated in OA chondrocytes compared to HC, while Aggrecan was significantly downregulated, as confirmed by quantitative analysis with statistical significance. Subsequent immunohistochemical staining further validated these findings, showing abundant expression of MMP13 and TNFα in OA cartilage tissues, with minimal presence in HC cartilage. Conversely, Aggrecan exhibited strong expression in HC cartilage but was significantly reduced in OA cartilage. This inversely proportional expression pattern underscores the remodeling of the extracellular matrix and inflammatory signaling in the pathogenesis of OA.
Targeted Inhibition of FGF1 Delays OA Progression by Regulating the RAS-MAPK Signaling Pathway
By integrating previous enrichment analysis and cellular communication results, we hypothesized that the high expression of FGF1 in chondrocytes, upon binding to its receptor FGFR1, may drive the onset and progression of OA by activating the RAS-MAPK signaling pathway. To test this hypothesis, we selectively knocked down FGF1 expression in human and rat OA chondrocytes. Western blot analysis (Figures 8A and 9A) revealed that, In comparison to the OA group, the expression levels of MMP13 and TNFα were markedly reduced in the shFGF1 group, while Aggrecan expression markedly increased. These findings suggest that targeted inhibition of FGF1 expression may help delay OA progression.
Subsequently, we further investigated the impact of FGF1 on the RAS-MAPK signaling pathway (Figures 8A and 9A). Western blot analysis demonstrated that, compared to the HC group, the expression of key signaling components—Ras, P-c-Raf, P-MEK1/2 and P-ERK1/2—was significantly elevated in the OA group, indicating enhanced activity of the RAS-MAPK pathway in human and rat OA chondrocytes. Correspondingly, targeted inhibition of FGF1 resulted in a significant reduction in the expression of Ras, P-c-Raf, P-MEK1/2 and P-ERK1/2 in the shFGF1 group compared to the OA group. This reversal of RAS-MAPK pathway activity underscores the critical role of FGF1 in activating this pathway during OA progression.
These collective findings unequivocally demonstrate that FGF1 serves as a pivotal upstream regulator of the RAS-MAPK signaling pathway in OA chondrocytes, underscoring its potential as a therapeutic target for modulating this pathway and addressing the progression of the disease.
Discussion
The progressive and often “silent” nature of OA prior to the onset of overt clinical symptoms underscores a critical unmet need: the lack of sensitive biomarkers for early diagnosis and effective therapeutic targets to halt disease progression.1,33 This study was therefore designed to address this dual challenge.34,35 While OA is influenced by a variety of factors,5 including age, gender, genetics, and body weight, low-grade, chronic inflammation driven by innate immune responses has emerged as a central mechanism in its pathogenesis, exacerbating the “silent” progression highlighted above. This inflammatory microenvironment is characterized by the predominance of pro-inflammatory M1 macrophages and the sustained release of key cytokines, such as IL-1β, TNF-α, and IL-6. These mediators, in turn, activate pivotal signaling pathways—including NF-κB and MAPK—thereby perpetuating a vicious cycle of cartilage degradation and joint destruction.6,7 It is precisely within this immunometabolic framework that we present FGF1 and, through an integrative multi-omics strategy, demonstrate its role not only as a robust diagnostic marker but also as a pathogenic driver and a potential therapeutic target in OA.
Our analytical approach began with steps to ensure data robustness. To minimize technical bias and ensure that different sample data were compared on the same scale, we applied batch effect removal and standardization to the dataset. Building upon this, we first performed differential expression analysis on the training set GSE169077, revealing significant differences between HC and OA samples. A total of 345 DEGs were discovered, comprising 194 substantially downregulated genes and 151 significantly increased genes. We performed WGCNA to investigate the relationship between genes and OA characteristics. Among the modules identified, the turquoise module, comprising 1649 genes, exhibited the highest correlation with clinical traits (r = 0.98, P = 2e-07), and was thus determined to be the key module. Within this module, 388 genes with both gene significance and module membership greater than 0.8 were considered key genes. Subsequently, we intersected the 345 DEGs with the 388 key genes from the WGCNA turquoise module, yielding 282 overlapping genes that exhibited significant associations with OA traits. These genes were identified as the central genes. The GO enrichment analysis revealed the following: (1) BP: These genes exhibited considerable enrichment in processes such as extracellular structure organization and the positive regulation of MAP kinase activity. (2) CC: They were potentially involved in the synthesis of collagen-containing extracellular matrix, lumenal basement membrane, and collagen trimers. (3) MF: They were closely associated with extracellular matrix structural constituents and glycosaminoglycan binding. Notably, FGF1 was primarily enriched in the positive regulation of MAP kinase activity and glycosaminoglycan binding. The KEGG analysis indicated that these genes were predominantly involved in the PI3K-Akt signaling pathway, MAPK signaling pathway, and protein digestion and absorption. Specifically, FGF1 was mainly enriched in the MAPK signaling pathway. Subsequently, to identify key molecules regulating OA traits, we performed PPI network analysis. Utilizing the 282 core genes, a PPI network was constructed, comprising 271 nodes and 2551 edges. The size and color of nodes were depending on betweenness values, with larger and darker nodes signifying higher betweenness values. From this analysis, a total of 52 hub genes were identified. Then, we used two machine learning methods, RF and LASSO, to reassess the 52 central genes. Through combining the outcomes of the two approaches, we pinpointed diagnostic biomarker gene: FGF1 and PLOD2. Subsequently, we constructed ROC curve models based on FGF1 and PLOD2 expression in the training dataset (GSE169077) and validation datasets (GSE114007, GSE117999). An AUC value > 0.7 indicates reliable predictive performance. The results demonstrated that FGF1 exhibited excellent diagnostic efficacy for OA across both the training and validation datasets. Furthermore, we validated the expression levels of FGF1 in all three datasets. Consistently, FGF1 expression was significantly elevated in OA samples compared to controls, reinforcing its potential as a reliable diagnostic biomarker. Furthermore, we preliminarily assessed the causal relationship between FGF1 and OA, revealing that FGF1 is a high-risk gene for OA. Using the IVW method, it was observed that as FGF1 expression increased, the risk of OA progressively rose, with an OR of 1.041 (95% CI = 1.002–1.081, p = 0.041). To evaluate the robustness of this causal inference, we implemented several rigorous measures. First, we restricted our analysis to cis-eQTLs, as the genetic regulation of gene expression in cis is more likely to be conserved across tissues compared to trans effects. Furthermore, all SNPs used as instrumental variables were stringently screened to ensure an F-statistic greater than 10, which guarantees strong instrument strength and effectively mitigates weak instrument bias. We also employed a comprehensive sensitivity analysis framework, including MR-Egger regression and the weighted median method. These approaches yielded consistent effect directions and detected no significant horizontal pleiotropy (MR-Egger intercept p-value > 0.05). The absence of significant heterogeneity (Cochran’s Q p-value > 0.05), coupled with the stability of the causal estimate in the leave-one-out analysis, further reinforces the reliability of our finding. However, these results provide only preliminary, suggestive evidence of a causal relationship. To explore the evolutionary role of FGF1 in chondrocyte development, we conducted single-cell sequencing analysis using data from GSE220243. Initially, we validated FGF1 expression in both HC and OA single-cell samples. The results revealed a significant upregulation of FGF1 in OA chondrocytes compared to HC, consistent with our prior findings. Subsequently, we performed pseudo-temporal trajectory analysis on HC and OA single-cell samples. In HC chondrocytes, nine distinct differentiation trajectories were identified. Based on inferred differentiation time, Trajectory 1 represented the initial stage of cell differentiation, while Trajectory 7 marked the terminal stage. Differential analysis of these trajectories demonstrated a notable decrease in FGF1 expression in cells along Trajectory 7. In contrast, OA chondrocytes exhibited seven differentiation trajectories, with Trajectory 1 indicating the onset of differentiation and Trajectory 5 signifying its conclusion. Differential trajectory analysis revealed a significant increase in FGF1 expression in cells along Trajectory 5. These findings collectively suggest that FGF1 expression progressively escalates in chondrocytes during the progression of OA, highlighting its potential role in disease pathogenesis. Subsequently, to further explore intercellular communication in OA chondrocytes, we conducted ligand-receptor (L-R) interaction analysis using CellChat. The results revealed that the diagnostic marker gene FGF1 primarily participates in the FGF signaling pathway, and the ligand-receptor interactions associated with this pathway are exclusively present among chondrocytes. Additionally, we identified the specific cell communication patterns involving FGF1 in OA chondrocytes. FGF1, functioning as a ligand gene, interacts with three receptor genes: FGFR1, FGFR2, and FGFR3. Among these, the communication contribution of the FGF1-FGFR1 interaction was the most significant, with a p-value of 0.0075. The above evidence suggests that in OA chondrocytes FGF1 may bind primarily to FGFR1, which further activates downstream signaling pathways. To validate the expression patterns of FGF1 in human and rat chondrocytes, we conducted Western blot analysis on both HC and OA samples. The results demonstrated that FGF1 expression levels were significantly higher in OA chondrocytes compared to HC chondrocytes in both species. Furthermore, immunofluorescence quantitative analysis revealed a markedly higher fluorescence intensity of FGF1 in OA chondrocytes than in HC chondrocytes (P < 0.05). These findings were further corroborated by immunohistochemical analysis, which showed abundant FGF1 expression in human and rat OA cartilage tissues, whereas its presence was minimal in HC cartilage tissues. Additionally, In addition, characteristic osteoarthritic changes, including surface irregularities and prominent osteophyte formation, were observed on the articular cartilage surface of rats in the OA group, whereas these features were absent in the sham-operated controls, indirectly confirming the successful establishment of the DMM model. To elucidate molecular alterations associated with OA, we assessed the expression levels of key markers—MMP13, TNFα, and Aggrecan—in human and rat chondrocytes. Compared to HC, OA chondrocytes exhibited significant upregulation of MMP13 and TNFα, alongside a notable downregulation of Aggrecan. Immunohistochemical staining confirmed that MMP13 and TNFα were abundantly expressed in OA cartilage tissues but scarcely present in HC cartilage. Conversely, Aggrecan displayed strong expression in HC cartilage but was significantly reduced in OA cartilage.
This inverse expression pattern underscores the remodeling of the extracellular matrix and the activation of inflammatory signaling pathways in the pathogenesis of OA. Subsequently, by integrating the results of prior enrichment analyses and cell communication studies, we hypothesized that the high expression of FGF1 in chondrocytes, upon binding to its receptor FGFR1, may drive the onset and progression of OA through the activation of the RAS-MAPK signaling pathway. To test this hypothesis, we selectively knocked down FGF1 expression in human and rat OA chondrocytes. In contrast to the OA group, the shFGF1 group showed a notable decrease in MMP13 and TNFα levels, coupled with a substantial rise in Aggrecan expression. These results indicate that targeted inhibition of FGF1 expression could be play a pivotal role in mitigating the progression of OA. Subsequently, we further investigated the impact of FGF1 on the RAS-MAPK signaling pathway. Compared to the HC group, the expression of key signaling components—Ras, P-c-Raf, P-MEK1/2 and P-ERK1/2—was significantly elevated in the OA group, indicating a marked enhancement of RAS-MAPK pathway activity in human and rat OA chondrocytes. Correspondingly, targeted inhibition of FGF1 resulted in a significant reduction in the expression of Ras, P-c-Raf, P-MEK1/2 and P-ERK1/2 in the shFGF1 group compared to the OA group. This reversal of RAS-MAPK pathway activity underscores the pivotal role of FGF1 in activating this pathway during OA progression. These findings collectively suggest that FGF1 may act as a critical upstream regulator of the RAS-MAPK signaling pathway in OA chondrocytes, highlighting it as a promising candidate for therapeutic targeting. FGF1 acts as a diagnostic biomarker and a potential target, offering advantages when compared to other biomarkers currently under research or clinical use. Current research and clinical practice have explored various biomarkers for OA, such as type II collagen cleavage products (eg, CTX-II), cartilage oligomeric matrix protein (COMP), and inflammatory cytokine IL-6.13,15 However, their widespread clinical application is often limited, including low specificity, poor correlation with early disease stages, and a lack of in-depth understanding of the core pathogenic mechanisms driving the progression of OA. In contrast, our comprehensive approach not only identifies FGF1 as a biomarker with strong diagnostic performance but also preliminarily elucidates its specific pathogenic effects through the RAS-MAPK pathway, thereby establishing a direct link between diagnosis and mechanistic-based therapeutic interventions. Therefore, the discovery of FGF1 addresses the dual challenge in OA management by providing a candidate biomarker for early diagnosis and a promising therapeutic target to halt disease progression.
Notwithstanding the compelling evidence gathered through our integrated approach—encompassing Mendelian randomization, single-cell trajectory analysis, and functional inhibition—which collectively underscores a contributory role of FGF1 in OA, several limitations of this study merit consideration. Firstly, while our data strongly suggest the involvement of FGF1 in OA pathogenesis, they do not conclusively establish it as the primary disease trigger. The possibility that FGF1 upregulation constitutes, at least partially, a secondary response to the pre-existing inflammatory milieu cannot be entirely excluded. Secondly, the relatively limited sample sizes of both the GEO datasets and animal experiments may constrain the statistical robustness of our findings. Although our in vivo DMM model confirmed FGF1 upregulation in a pathological context, it does not furnish direct evidence for the therapeutic efficacy of FGF1 inhibition. Future investigations employing FGF1-specific neutralizing antibodies or receptor antagonists within interventional study designs are warranted to rigorously validate its therapeutic potential. Finally, several mechanistic aspects remain incompletely elucidated, including the upstream drivers of FGF1 overexpression in OA, as well as the precise molecular interactions—such as whether FGF1 modulates RAS-MAPK pathway activity predominantly through binding to FGFR1, FGFR2, or FGFR3. Addressing these unresolved questions will be a critical emphasis of our subsequent research endeavors.
Conclusion
This study preliminarily confirms FGF1 as a robust diagnostic biomarker for OA, with a key role in pathogenesis via RAS-MAPK pathway activation. MR analysis provided preliminary suggestive causal evidence. Specifically, FGF1 orchestrates a pro-inflammatory and catabolic state in chondrocytes by upregulating MMP13 and TNFα, while suppressing the synthesis of the crucial matrix component Aggrecan, thereby driving the irreversible destruction of the cartilage extracellular matrix. Our findings provide a rational basis for developing novel therapeutic strategies that target FGF1 to alleviate OA progression. However, further validation in independent cohorts and prospective studies is essential before considering clinical translation of FGF1 as a diagnostic biomarker.
Data Sharing Statement
The datasets generated and/or analyzed in this study can be accessed at the GWAS database (https://gwas.mrcieu.ac.uk/), eQTLGen Consortium (https://www.eqtlgen.org/), and GEO database (https://www.ncbi.nlm.nih.gov/geo).
Ethics Approval and Consent to Participate
The clinical specimen collection plan for HC and OA cartilage was approved by the Ethics Committee of the Second Affiliated Hospital of Anhui Medical University (Approval No: YX2025-030) and conducted in accordance with relevant guidelines and regulations.
Consent for Publication
Not applicable. All authors declare that our research does not involve patient names, images, or other private information, and therefore patient consent for publication is not required.
Author Contributions
All authors made a significant contribution to the work reported, whether that is in the conception, study design, execution, acquisition of data, analysis and interpretation, or in all these areas; took part in drafting, revising or critically reviewing the article; gave final approval of the version to be published; have agreed on the journal to which the article has been submitted; and agree to be accountable for all aspects of the work.
Funding
This study was funded by the Postgraduate Innovation Research and Practice Program of Anhui Medical University (no. YJS20240038).
Disclosure
The authors declare that there are no competing interests associated with the manuscript.
References
1. Hunter DJ, Bierma-Zeinstra S. Osteoarthritis. Lancet. 2019;393(10182):1745–1759. doi:10.1016/S0140-6736(19)30417-9
2. Tang SA, Zhang C, Oo WM, et al. Osteoarthritis. Nat Rev Dis Primers. 2025;11(1):10. doi:10.1038/s41572-025-00594-6
3. Favero M, Belluzzi E, Ortolan A, et al. Erosive hand osteoarthritis: latest findings and outlook. Nat Rev Rheumatol. 2022;18(3):171–183. doi:10.1038/s41584-021-00747-3
4. Motta F, Barone E, Sica A, et al. Inflammaging and osteoarthritis. Clin Rev Allergy Immunol. 2023;64(2):222–238. doi:10.1007/s12016-022-08941-1
5. Usher KM, Zhu S, Mavropalias G, et al. Pathological mechanisms and therapeutic outlooks for arthrofibrosis. Bone Res. 2019;7:9. doi:10.1038/s41413-019-0047-x
6. Sun K, Zhang X, Hou L, et al. TRPM2-mediated feed-forward loop promotes chondrocyte damage in osteoarthritis via calcium-cGAS-STING-NF-κB pathway. J Adv Res. 2024;75:213–227. doi:10.1016/j.jare.2024.11.007
7. Lan W, Chen X, Yu H, et al. UGDH lactylation aggravates osteoarthritis by suppressing glycosaminoglycan synthesis and orchestrating nucleocytoplasmic transport to activate MAPK signaling. Adv Sci. 2025;12(20):e2413709. doi:10.1002/advs.202413709
8. Peat G, Thomas MJ. Osteoarthritis year in review 2020: epidemiology & therapy. Osteoarthritis Cartil. 2021;29(2):180–189. doi:10.1016/j.joca.2020.10.007
9. Glyn-Jones S, Palmer AJR, Agricola R, et al. Osteoarthritis. Lancet. 2015;386(9991):376–387. doi:10.1016/S0140-6736(14)60802-3
10. Charlier E, Deroyer CL, Ciregia F, et al. Chondrocyte dedifferentiation and osteoarthritis (OA). Biochem Pharmacol. 2019;165:49–65. doi:10.1016/j.bcp.2019.02.036
11. Fujii Y, Liu L, Yagasaki L, et al. Cartilage homeostasis and osteoarthritis. Int J Mol Sci. 2022;23(11):6316. doi:10.3390/ijms23116316
12. Kraus VB, Hsueh M-F. Molecular biomarker approaches to prevention of post-traumatic osteoarthritis. Nat Rev Rheumatol. 2024;20(5):272–289. doi:10.1038/s41584-024-01102-y
13. Maly K, Andres Sastre E, Farrell E, et al. COMP and TSP-4: functional roles in articular cartilage and relevance in osteoarthritis. Int J Mol Sci. 2021;22(5):2242. doi:10.3390/ijms22052242
14. Ruan H, Zhu T, Wang T, et al. Quercetin modulates ferroptosis via the SIRT1/Nrf-2/HO-1 pathway and attenuates cartilage destruction in an osteoarthritis rat model. Int J Mol Sci. 2024;25(13):7461. doi:10.3390/ijms25137461
15. Plsikova Matejova J, Spakova T, Harvanova D, et al. A preliminary study of combined detection of COMP, TIMP-1, and MMP-3 in synovial fluid: potential indicators of osteoarthritis progression. Cartilage. 2020;13(2_suppl):1421S–1430S. doi:10.1177/1947603520946385
16. Li H-Z, Zhang J-L, Yuan D-L, et al. Role of signaling pathways in age-related orthopedic diseases: focus on the fibroblast growth factor family. Military Med Res. 2024;11(1):40. doi:10.1186/s40779-024-00544-5
17. El-Seoudi A, Abd El Kader T, Nishida T, et al. Catabolic effects of FGF-1 on chondrocytes and its possible role in osteoarthritis. J Cell Commun Signal. 2017;11(3):255–263. doi:10.1007/s12079-017-0384-8
18. Yingfei S, Feng Y, Haoning M. Environmental high temperature induced cartilage damage through triggering programmed necrosis mediated by producing left-handed DNA. Ecotoxicol Environ Saf. 2025;291:117894. doi:10.1016/j.ecoenv.2025.117894
19. Hemani G, Zheng J, Elsworth B, et al. The MR-Base platform supports systematic causal inference across the human phenome. ELife. 2018;7. doi:10.7554/eLife.34408
20. Ritchie ME, Phipson B, Wu D, et al. limma powers differential expression analyses for RNA-sequencing and microarray studies. Nucleic Acids Res. 2015;43(7):e47. doi:10.1093/nar/gkv007
21. Leek JT, Johnson WE, Parker HS, et al. The sva package for removing batch effects and other unwanted variation in high-throughput experiments. Bioinformatics. 2012;28(6):882–883. doi:10.1093/bioinformatics/bts034
22. Langfelder P, Horvath S. WGCNA: an R package for weighted correlation network analysis. BMC Bioinf. 2008;9(1):559. doi:10.1186/1471-2105-9-559
23. Wu T, Hu E, Xu S, et al. clusterProfiler 4.0: a universal enrichment tool for interpreting omics data. Innovation. 2021;2(3):100141. doi:10.1016/j.xinn.2021.100141
24. Szklarczyk D, Kirsch R, Koutrouli M, et al. The STRING database in 2023: protein-protein association networks and functional enrichment analyses for any sequenced genome of interest. Nucleic Acids Res. 2023;51(D1):D638–D646. doi:10.1093/nar/gkac1000
25. Liaw A, Wiener M. Classification and Regression by randomForest. R News. 2002;2(3):18–22.
26. Friedman J, Tibshirani R, Hastie T. Regularization paths for generalized linear models via coordinate descent. J Stat Softw. 2010;33(1):1–22. doi:10.18637/jss.v033.i01
27. Zhu Z, Zhang F, Hu H, et al. Integration of summary data from GWAS and eQTL studies predicts complex trait gene targets. Nat Genet. 2016;48(5):481–487. doi:10.1038/ng.3538
28. Võsa U, Claringbould A, Westra H-J, et al. Large-scale cis- and trans-eQTL analyses identify thousands of genetic loci and polygenic scores that regulate blood gene expression. Nat Genet. 2021;53(9):1300–1310. doi:10.1038/s41588-021-00913-z
29. Swahn H, Li K, Duffy T, et al. Senescent cell population with ZEB1 transcription factor as its main regulator promotes osteoarthritis in cartilage and meniscus. Ann Rheumatic Dis. 2023;82(3):403–415. doi:10.1136/ard-2022-223227
30. Stuart T, Srivastava A, Madad S, et al. Single-cell chromatin state analysis with Signac. Nat Methods. 2021;18(11):1333–1341. doi:10.1038/s41592-021-01282-5
31. Cao J, Spielmann M, Qiu X, et al. The single-cell transcriptional landscape of mammalian organogenesis. Nature. 2019;566(7745):496–502. doi:10.1038/s41586-019-0969-x
32. Yang J, Li S, Li Z, et al. Targeting YAP1-regulated glycolysis in fibroblast-like synoviocytes impairs macrophage infiltration to ameliorate diabetic osteoarthritis progression. Adv Sci. 2024;11(5):e2304617. doi:10.1002/advs.202304617
33. Whittaker JL, Truong LK, Dhiman K, et al. Osteoarthritis year in review 2020: rehabilitation and outcomes. Osteoarthritis Cartil. 2021;29(2):190–207. doi:10.1016/j.joca.2020.10.005
34. Mobasheri A, Thudium CS, Bay-Jensen A-C, et al. Biomarkers for osteoarthritis: current status and future prospects. Best Pract Res. 2023;37(2):101852. doi:10.1016/j.berh.2023.101852
35. Cho Y, Jeong S, Kim H, et al. Disease-modifying therapeutic strategies in osteoarthritis: current status and future directions. Exp Mol Med. 2021;53(11):1689–1696. doi:10.1038/s12276-021-00710-y
 © 2025 The Author(s). This work is published and licensed by Dove Medical Press Limited. The
full terms of this license are available at https://www.dovepress.com/terms
and incorporate the Creative Commons Attribution
- Non Commercial (unported, 4.0) License.
By accessing the work you hereby accept the Terms. Non-commercial uses of the work are permitted
without any further permission from Dove Medical Press Limited, provided the work is properly
attributed. For permission for commercial use of this work, please see paragraphs 4.2 and 5 of our Terms.
© 2025 The Author(s). This work is published and licensed by Dove Medical Press Limited. The
full terms of this license are available at https://www.dovepress.com/terms
and incorporate the Creative Commons Attribution
- Non Commercial (unported, 4.0) License.
By accessing the work you hereby accept the Terms. Non-commercial uses of the work are permitted
without any further permission from Dove Medical Press Limited, provided the work is properly
attributed. For permission for commercial use of this work, please see paragraphs 4.2 and 5 of our Terms.