Back to Journals » International Journal of General Medicine » Volume 14
Multi-Omics Analysis Identified TMED2 as a Shared Potential Biomarker in Six Subtypes of Human Cancer
Authors Sial N, Saeed S ![]() , Ahmad M, Hameed Y
, Ahmad M, Hameed Y ![]() , Rehman A, Abbas M, Asif R, Ahmed H, Hussain MS, Rehman JU, Atif M, Khan MR
, Rehman A, Abbas M, Asif R, Ahmed H, Hussain MS, Rehman JU, Atif M, Khan MR
Received 17 July 2021
Accepted for publication 27 September 2021
Published 21 October 2021 Volume 2021:14 Pages 7025—7042
DOI https://doi.org/10.2147/IJGM.S327367
Checked for plagiarism Yes
Review by Single anonymous peer review
Peer reviewer comments 2
Editor who approved publication: Dr Scott Fraser
Nuzhat Sial,1 Saba Saeed,2 Mukhtiar Ahmad,3 Yasir Hameed,3 Abdul Rehman,4 Mustansar Abbas,5 Rizwan Asif,6 Hamad Ahmed,5 Muhammad Safdar Hussain,3 Jalil Ur Rehman,7 Muhammad Atif,7 Muhammad Rashid Khan8
1Department of Zoology, The Islamia University of Bahawalpur, Bahawalpur, Pakistan; 2Department of Zoology, University of the Punjab, Lahore, Pakistan; 3Department of Biochemistry and Biotechnology, The Islamia University of Bahawalpur, Bahawalpur, Pakistan; 4Department of Eastern Medicine, Qarshi University, Lahore, Pakistan; 5Department of Eastern Medicine, Government College University Faisalabad, Faisalabad, Pakistan; 6Department of Microbiology, Government College University Faisalabad, Faisalabad, Pakistan; 7University College of Conventional Medicine, The Islamia University of Bahawalpur, Bahawalpur, Pakistan; 8University College of Eastern Medicine, The Islamia University of Bahawalpur, Bahawalpur, Pakistan
Correspondence: Yasir Hameed
Department of Biochemistry and Biotechnology, The Islamia University of Bahawalpur, Bahawalpur, 63100, Pakistan
Email [email protected]
Introduction: Cancer is one of the most common malignancies and the leading cause of death worldwide. As a member of the transmembrane emp24 domain (Tmed)/p24 family of proteins, TMED2 expression variations have been documented earlier in only a few subtypes of human cancers, and the multi-omics profiling of TMED2 as a shared biomarker in different other subtypes of human cancers remains to be uncovered.
Methods: In the current study, TMED2 multi-omics analysis in 24 major subtypes of human cancer was performed using different authentic online databases and bioinformatics analysis including UALCAN, Kaplan–Meier (KM) plotter, Human Protein Atlas (HPA), GENT2, MEXPRESS, cBioportal, STRING, DAVID, TIMER, and CTD.
Results: In general, the TMED2 expression in 24 major subtypes of human cancers was higher relative to normal controls and was also strongly associated with the lower overall survival (OS) and relapse-free survival (RFS) duration of CESC, ESCA, HNSC, KIRC, LIHC, and LUAD patients. This implies that TMED2 plays a significant role in the development and progression of these cancers. Furthermore, the TMED2 overexpression was also correlated with different clinicopathological features of CESC, ESCA, HNSC, KIRC, LIHC, and LUAD patients. TMED2-associated genes network was involved in 3 diverse pathways, and finally, few stronger correlations were also explored between TMED2 expression and its promoter methylation level, genetic alterations, and CD8+ T immune cells level.
Conclusion: In conclusion, via this in silico study, we have elucidated that TMED2 can serve as a shared diagnostic and prognostic biomarker in CESC, ESCA, HNSC, KIRC, LIHC, and LUAD patients of different clinicopathological features but, further in vitro and in vivo research should be carried out to confirm these findings.
Keywords: TMED2, cancer, expression variations, biomarker
Introduction
Among malignancies, cancer has the 2nd highest morbidity and mortality rates after cardiovascular diseases worldwide.1 Metastasis is main characteristic of the malignant tumors which leads to poor prognosis of the cancer patients.2 Currently, chemotherapy is the most widely used treatment approach for cancer patients; however, its efficacy is not up to the mark. On the other hand, immunotherapy is another kind of partially successful cancer treatment method, at present, it is very expensive,3 thus, targeted therapy remains the best treatment option for most cancer patients. Therefore, it is urgent for us to discover the underlying mechanisms of higher cancer incidence and detect some novel shared diagnostic and prognostic biomarkers that could aid in the targeted therapy of cancer patients.
Transmembrane p24 trafficking protein 2 (TMED2) is a member of the transmembrane emp24 domain (Tmed)/p24 family of proteins that are required for the trafficking of proteins among Golgi apparatus and the endoplasmic reticulum (ER).4 TMED2 normally functions during placenta and embryo morphogenesis,5 however, its role in the development and progression of tumorigenesis has been explored rarely. Few earlier studies have revealed the potential role of the TMED2 gene in different cancer subtypes including prostate cancer, colon cancer, and hepatocellular carcinoma.6–8 However, best to our knowledge, the role of TMED2 in different other subtypes of human cancer is yet to uncover.
Recently, the development of advanced cancer expression databases and bioinformatics tools have helped cancer researchers to manipulate and analyze the experimentally obtained multi-omics data. To better understand the TMED2 role in the development and progression of human cancers, we analyzed its expression level variations, prognostic significance, promoter methylation level, genetic alterations, copy number variations (CNVs), pathways, CD8+ T immune cells infiltration, and gene-drug network using a comprehensive in silico approach. The findings of our study have provided some useful information regarding the correlation between TMED2 expression and its prognostic values in Cervical Squamous Cell Carcinoma (CESC), Esophageal Adenocarcinoma (ESCA), Head and Neck Cancer (HNSC), Kidney Renal Clear Cell Carcinoma (KIRC), Liver Hepatocellular Carcinoma (LIHC), and Lung Adenocarcinoma (LUAD), as well as suggested the role of TMED2 as a potential diagnostic and prognostic biomarker in CESC, ESCA, HNSC, KIRC, LIHC, and LUAD.
Methods
Ethics Statement
This study was reviewed and approved by the ethical committee of the Islamia University of Bahawalpur, Bahawalpur, Pakistan.
UALCAN
Transcription expression level variations of TMED2 in different human cancers relative to normal controls were analyzed using UALCAN database (http://ualcan.path.uab.edu). This database is a reliable and easy-to-use platform for performing the multi-omics analysis of TCGA cancer data.9 In UALCAN, the transcription expression level of TMED2 was quantified as transcript per million (TPM) reads, and a Student’s t-test was employed for statistics purpose. A p-value (<0.05) was considered as statistically significant.
Kaplan–Meier Plotter
The Kaplan–Meier plotter (http://kmplot.com//analysis) tool has the capacity to compute prognostic values of more than 54K genes including mRNAs, miRNAs, and proteins in 21 subtypes of human cancer.9 In this study, the primary goal of utilizing this tool was to examine the clinical significance (overall survival [OS] and relapse-free survival [RFS]) of TMED2 in distinct subtypes of human cancer based on GEO, and TCGA datasets. A p-value, 95% confidence interval (CI), and hazard ratio (HR) were also determined and displayed.
GENT2 Database
GENT2 (http://gent2.appex.kr/) web server is developed for the multi-omics analysis of the cancer data acquired from Gene Expression Omnibus (GEO, https://www.ncbi.nlm.nih.gov/geo/) database.10 In our study, we utilized GENT2 for the validation of TMED2 expression using new independent cohorts of distinct cancer patients. For statistics, this tool uses a Student’s t-test, and a p-value of <0.05 was regarded as statistically significant.
Data Mining Through Human Protein Atlas Database
HPA (https:/www.proteinatlas.org/) is a database that aims to quantify and locate all the human proteins in cells, tissues, and organs using the immunohistochemistry (IHC) technique.11 In the current study, HPA was utilized to examine the proteomics expression level of TMED2 in normal tissues and distinct subtypes of cancerous tissues. The observed protein expression level was graded as not detected, low, medium, and high, based on the intensity of staining and fraction of the stained cells.
MEXPRESS Database
MEXPRESS database was utilized to assess the Pearson correlation between TMED2 transcription expression and its promoter methylation levels in 309, 194, 542, 343, 414, and 477 samples of CESC, ESCA, HNSC, KIRC, LIHC, and LUAD, respectively.12 A p-value <0.05 was considered as significant.
The cBioportal Database
In this study, we utilized the cBioPortal database (http://cbioportal.org)13 to examine the TMED2-related genetic alterations and copy number variations (CNVs) across distinct human cancer subtypes using TCGA datasets. The OncoPrint option on the cBioPortal provides an overview of genetic mutations and CNVs in the gene(s) of interest above every sample bar.
TMED2 Protein–Protein Interaction Network Development and Pathway Analysis
A PPI network of TMED2-enriched genes was developed via STRING (https://string-db.org/)14 and visualized through Cytoscape software.15 Then, the pathway analysis of the TMED2-enriched genes was carried out using DAVID (http://david.ncifcrf.gov/summary.jsp)16 and a p value < 0.05 was considered as significant.
TMED2 Expression and Infiltrating Level of CD8+ T Immune Cells in Cancer Patients of Distinct Subtypes
TIMER (http://timer.cistrome.org/)17 is a database that aims to systematically analyze the immune infiltrates in distinct cancer subtypes (www.cistrome.shinyapps.io/timer) (48). TIMER applied the Spearman correlation method to infer the abundance of immune cells in association with gene expression using TCGA datasets. In distinct human cancer subtypes, the Spearman correlation between the TMED2 expression and CD8+ T immune cells was calculated in this study using TIMER. A p-value <0.05 was considered as significant.
Gene–Drug Interaction Network Analysis of TMED2
TMED2 gene–drug interaction network was constructed using the Comparative Toxicogenomics Database (CTD)18 and Cytoscape software. This network includes the information of chemotherapeutic drugs that could reduce or enhance the transcription or translation expression levels of TMED2.
Results
TMED2 Transcription Expression Analysis in Human Cancers and Normal Tissues
The transcription level of TMED2 in 24 major human cancer subtypes was explored via UALCAN database using TCGA datasets. Relative to solid normal tissues, TMED2 transcription level was significantly (p < 0.05) enhanced in all the 24 types of primary cancerous solid tissues (Figure 1) including Cervical Squamous Cell Carcinoma (CESC), Esophageal Cancer (ESCA), Head and Neck Squamous Cell Carcinoma (HNSC), Kidney Renal Clear Cell Carcinoma (KIRC), Liver Hepatocellular Carcinoma (LIHC), and Lung adenocarcinoma (LUAD) (Figure 1).
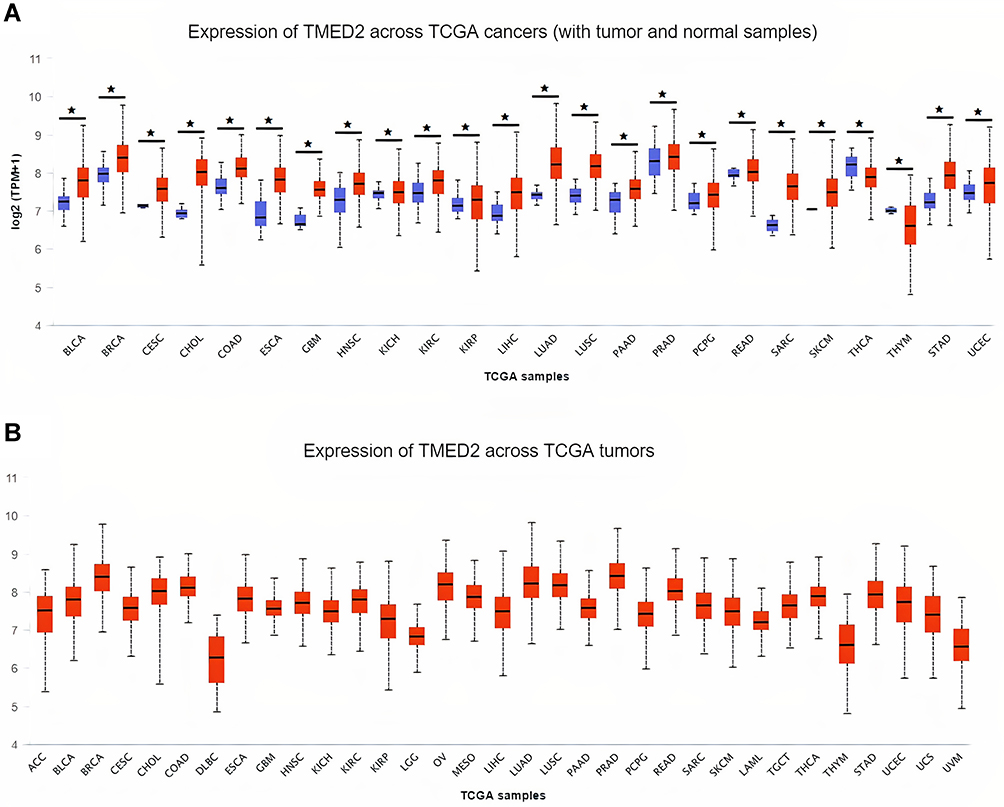 |
Figure 1 The analysis of difference in transcriptional level of TMED2 in different types of cancers tissue paired with normal controls. (A) Transcriptional level analysis of TMED2 across cancerous samples paired with normal controls, and (B) Transcriptional level analysis of TMED2 across cancerous samples only. Blue color represents the normal samples while red color indicates the cancer samples. *p < 0.05. |
The Prognostic Potential of TMED2 in Various Types of Cancers
We further explored the correlation between OS, RFS and TMED2 expression in 24 major types of cancer patients using KM plotter. Elevated TMED2 expression was found to be significantly (p < 0.05) correlated with the reduced OS and RFS duration of the CESC (HR = 2.07, 95% CI: 1.29–3.32, P = 0.0021, HR = 1.79, 95% CI: 10.81–3.95, P = 0.014), ESCA (HR = 3.36, 95% CI: 1.68–6.73, P = 3e-04, HR = 1.6, 95% CI: 0.0–3.19, P = 0.018), HNSC (HR = 2.08, 95% CI: 1.53–2.83, P = 2.2e-06, HR = 2.75, 95% CI: 1.24–6.1, P = 0.0094), KIRC (HR = 1.64, 95% CI: 1.2–2.24, P = 0.0019, HR = 274586506.99, 95% CI: 0–Inf, P = 0.0021), LIHC (HR = 1.69, 95% CI: 1.18–2.43, P = 0.0038, HR = 1.36, 95% CI: 0.95–1.95, P = 0.05), and LUAD (HR = 1.65, 95% CI: 1.19–2.3, P = 0.0027, HR = 1.64, 95% CI: 0.95–2.83, P = 0.057) patients (Figure 2). Furthermore, the TMED2 dysregulation was also found associated with the OS and RFS of patients with distinct other types of cancers but the correlations were insignificant (p>0.05). Taken together, these data suggested that TMED2 might have a significant contribution to the development and progression of CESC, ESCA, HNSC, KIRC, LIHC, and LUAD, thus the next part of our study will mainly focus on the unique role of TMED2 in these six types of human cancers.
 |
Figure 2 Correlational analysis of TMED2 dysregulation with OS and RFS in distinct cancer subtypes. (A) Correlational analysis of TMED2 dysregulation with OS in distinct cancer subtypes, and (B) Correlational analysis of TMED2 dysregulation with RFS in distinct cancer subtypes. A p-value < 0.05 was considered as significant. |
Association Between TMED2 Expression Level and Different Clinicopathological Features in CESC, ESCA, HNSC, KIRC, LIHC, and LUAD
We further analyzed the TMED2 transcription expression levels in CESC, ESCA, HNSC, KIRC, LIHC, and LUAD patients with respect to different clinicopathological features. We noticed that TMED2 transcription expression was also significantly up-regulated in CESC, ESCA, HNSC, KIRC, LIHC, and LUAD patients relative to normal controls irrespective of different clinicopathological features including different cancer stages, races, genders, and age groups (Table 1). Clinicopathological distribution of the CESC, ESCA, HNSC, KIRC, LIHC, and LUAD cohorts are given in Tables 2–4.
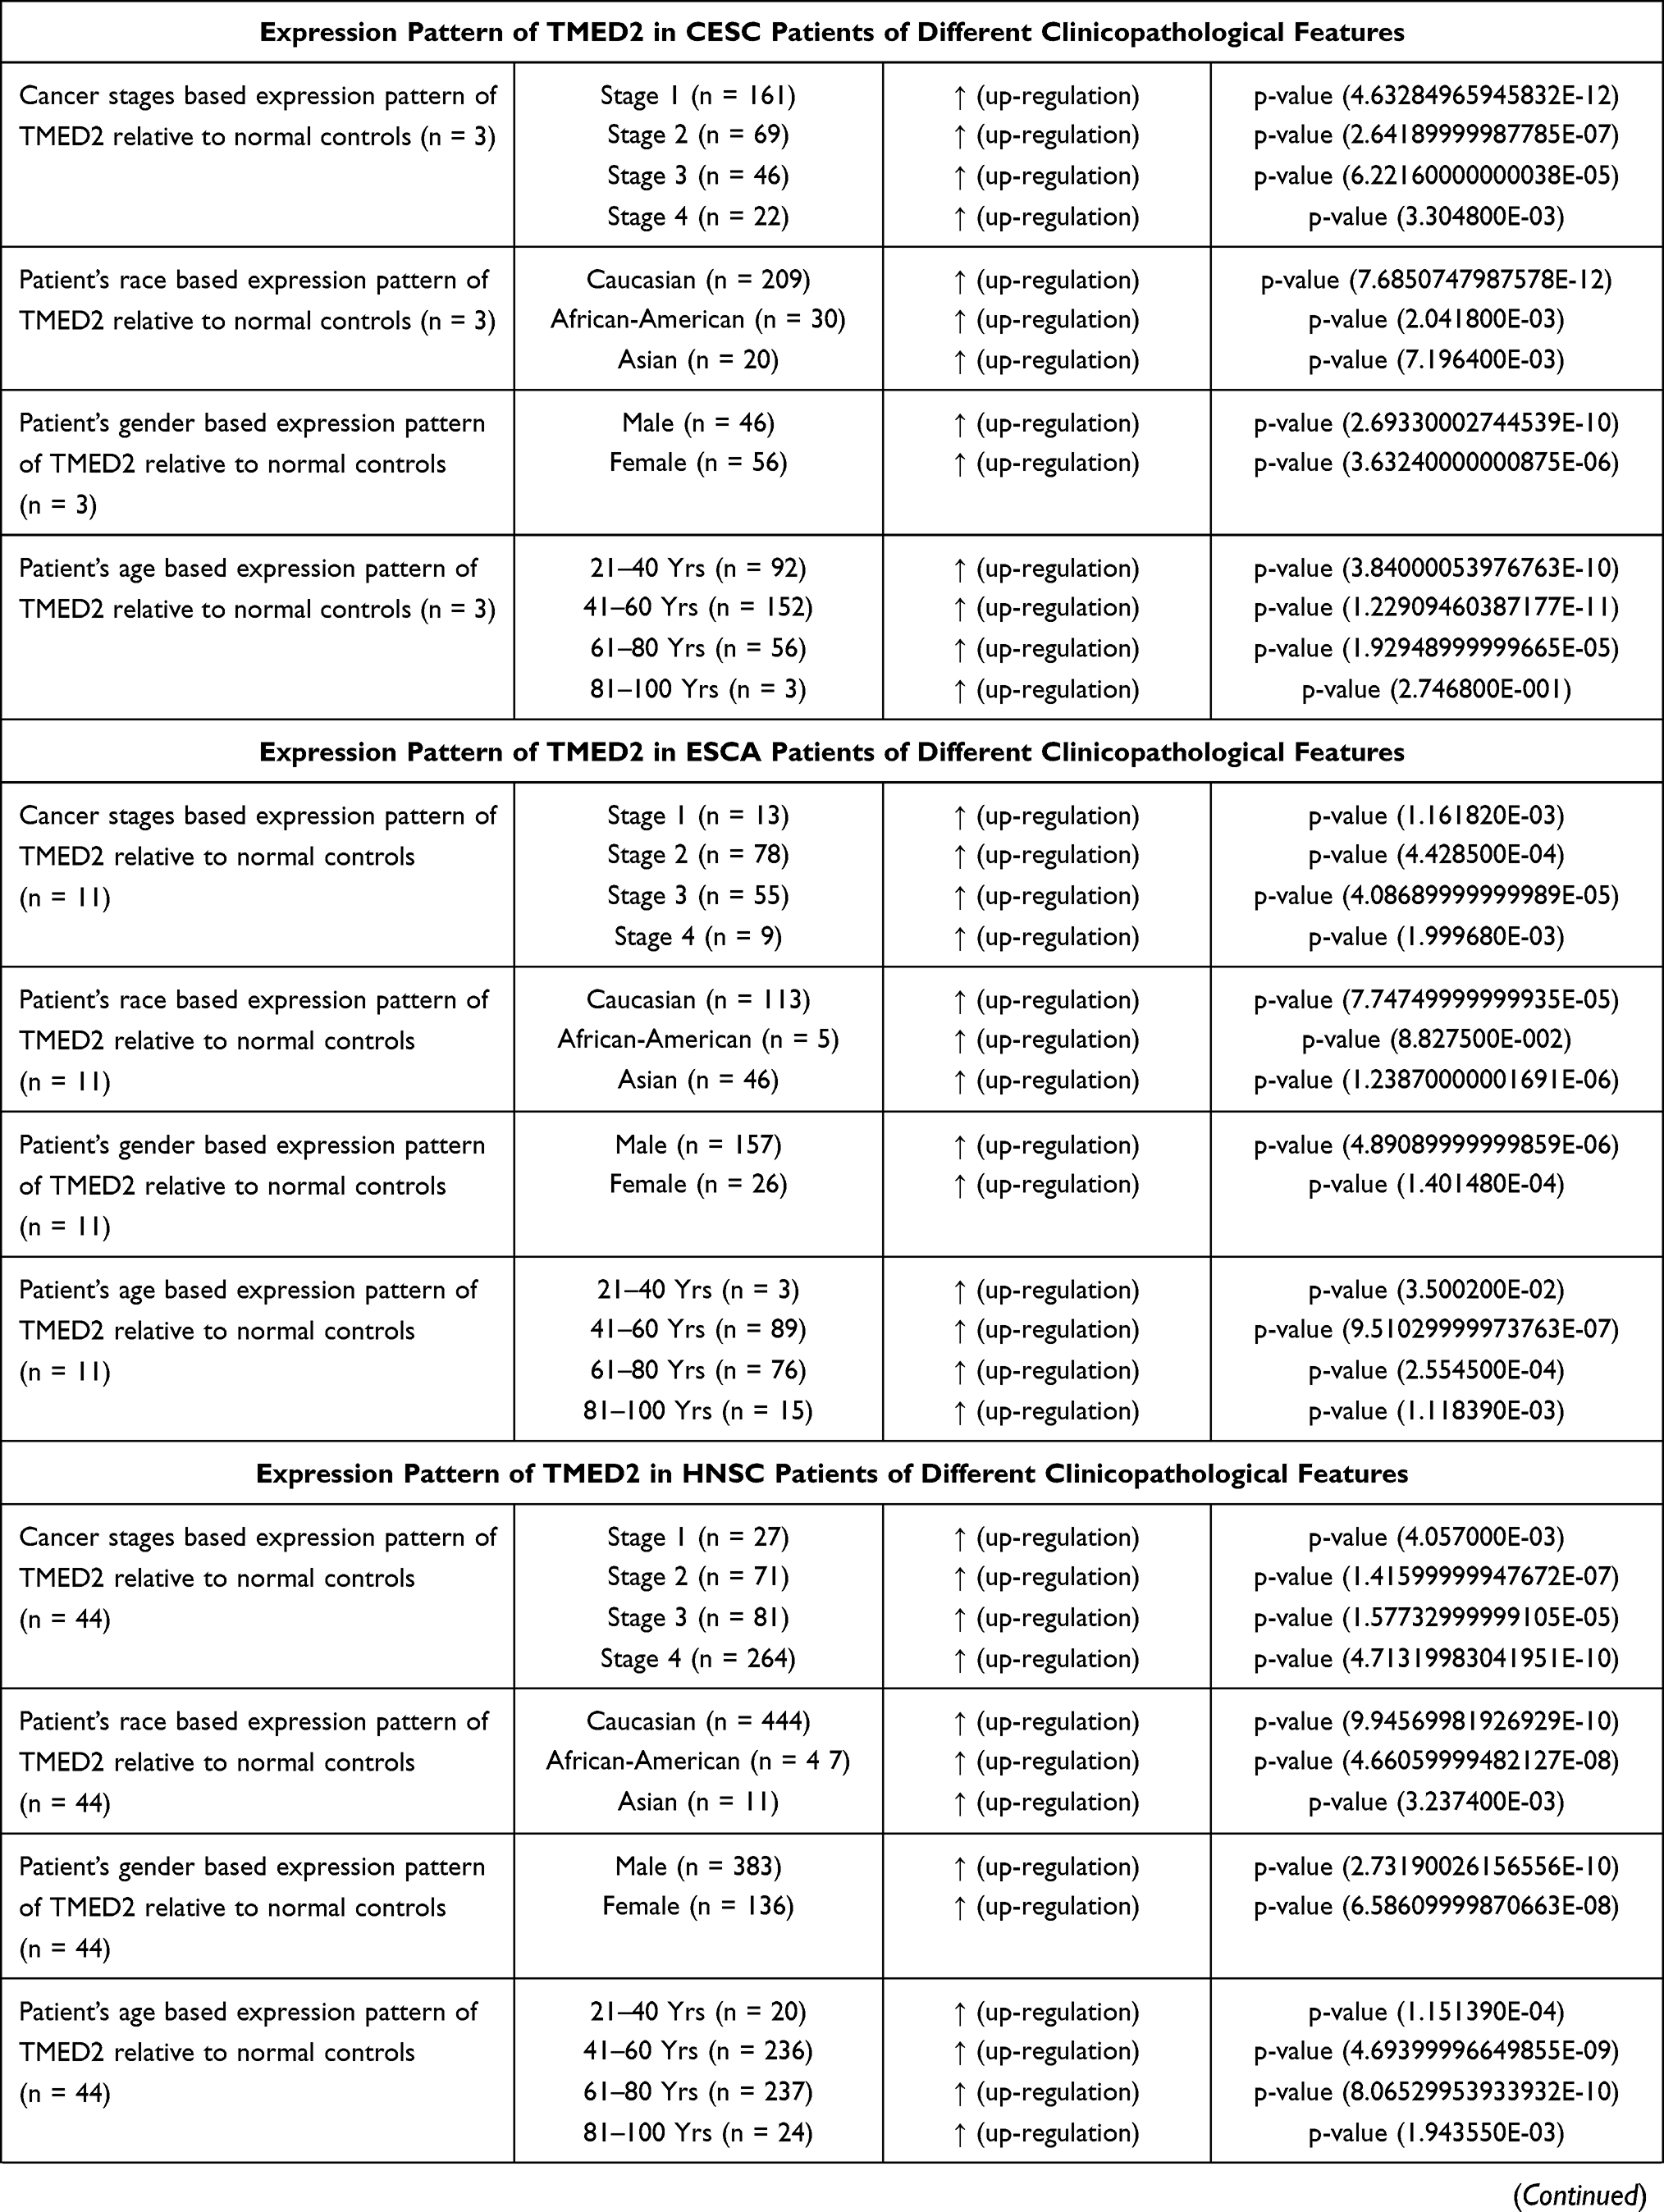 | 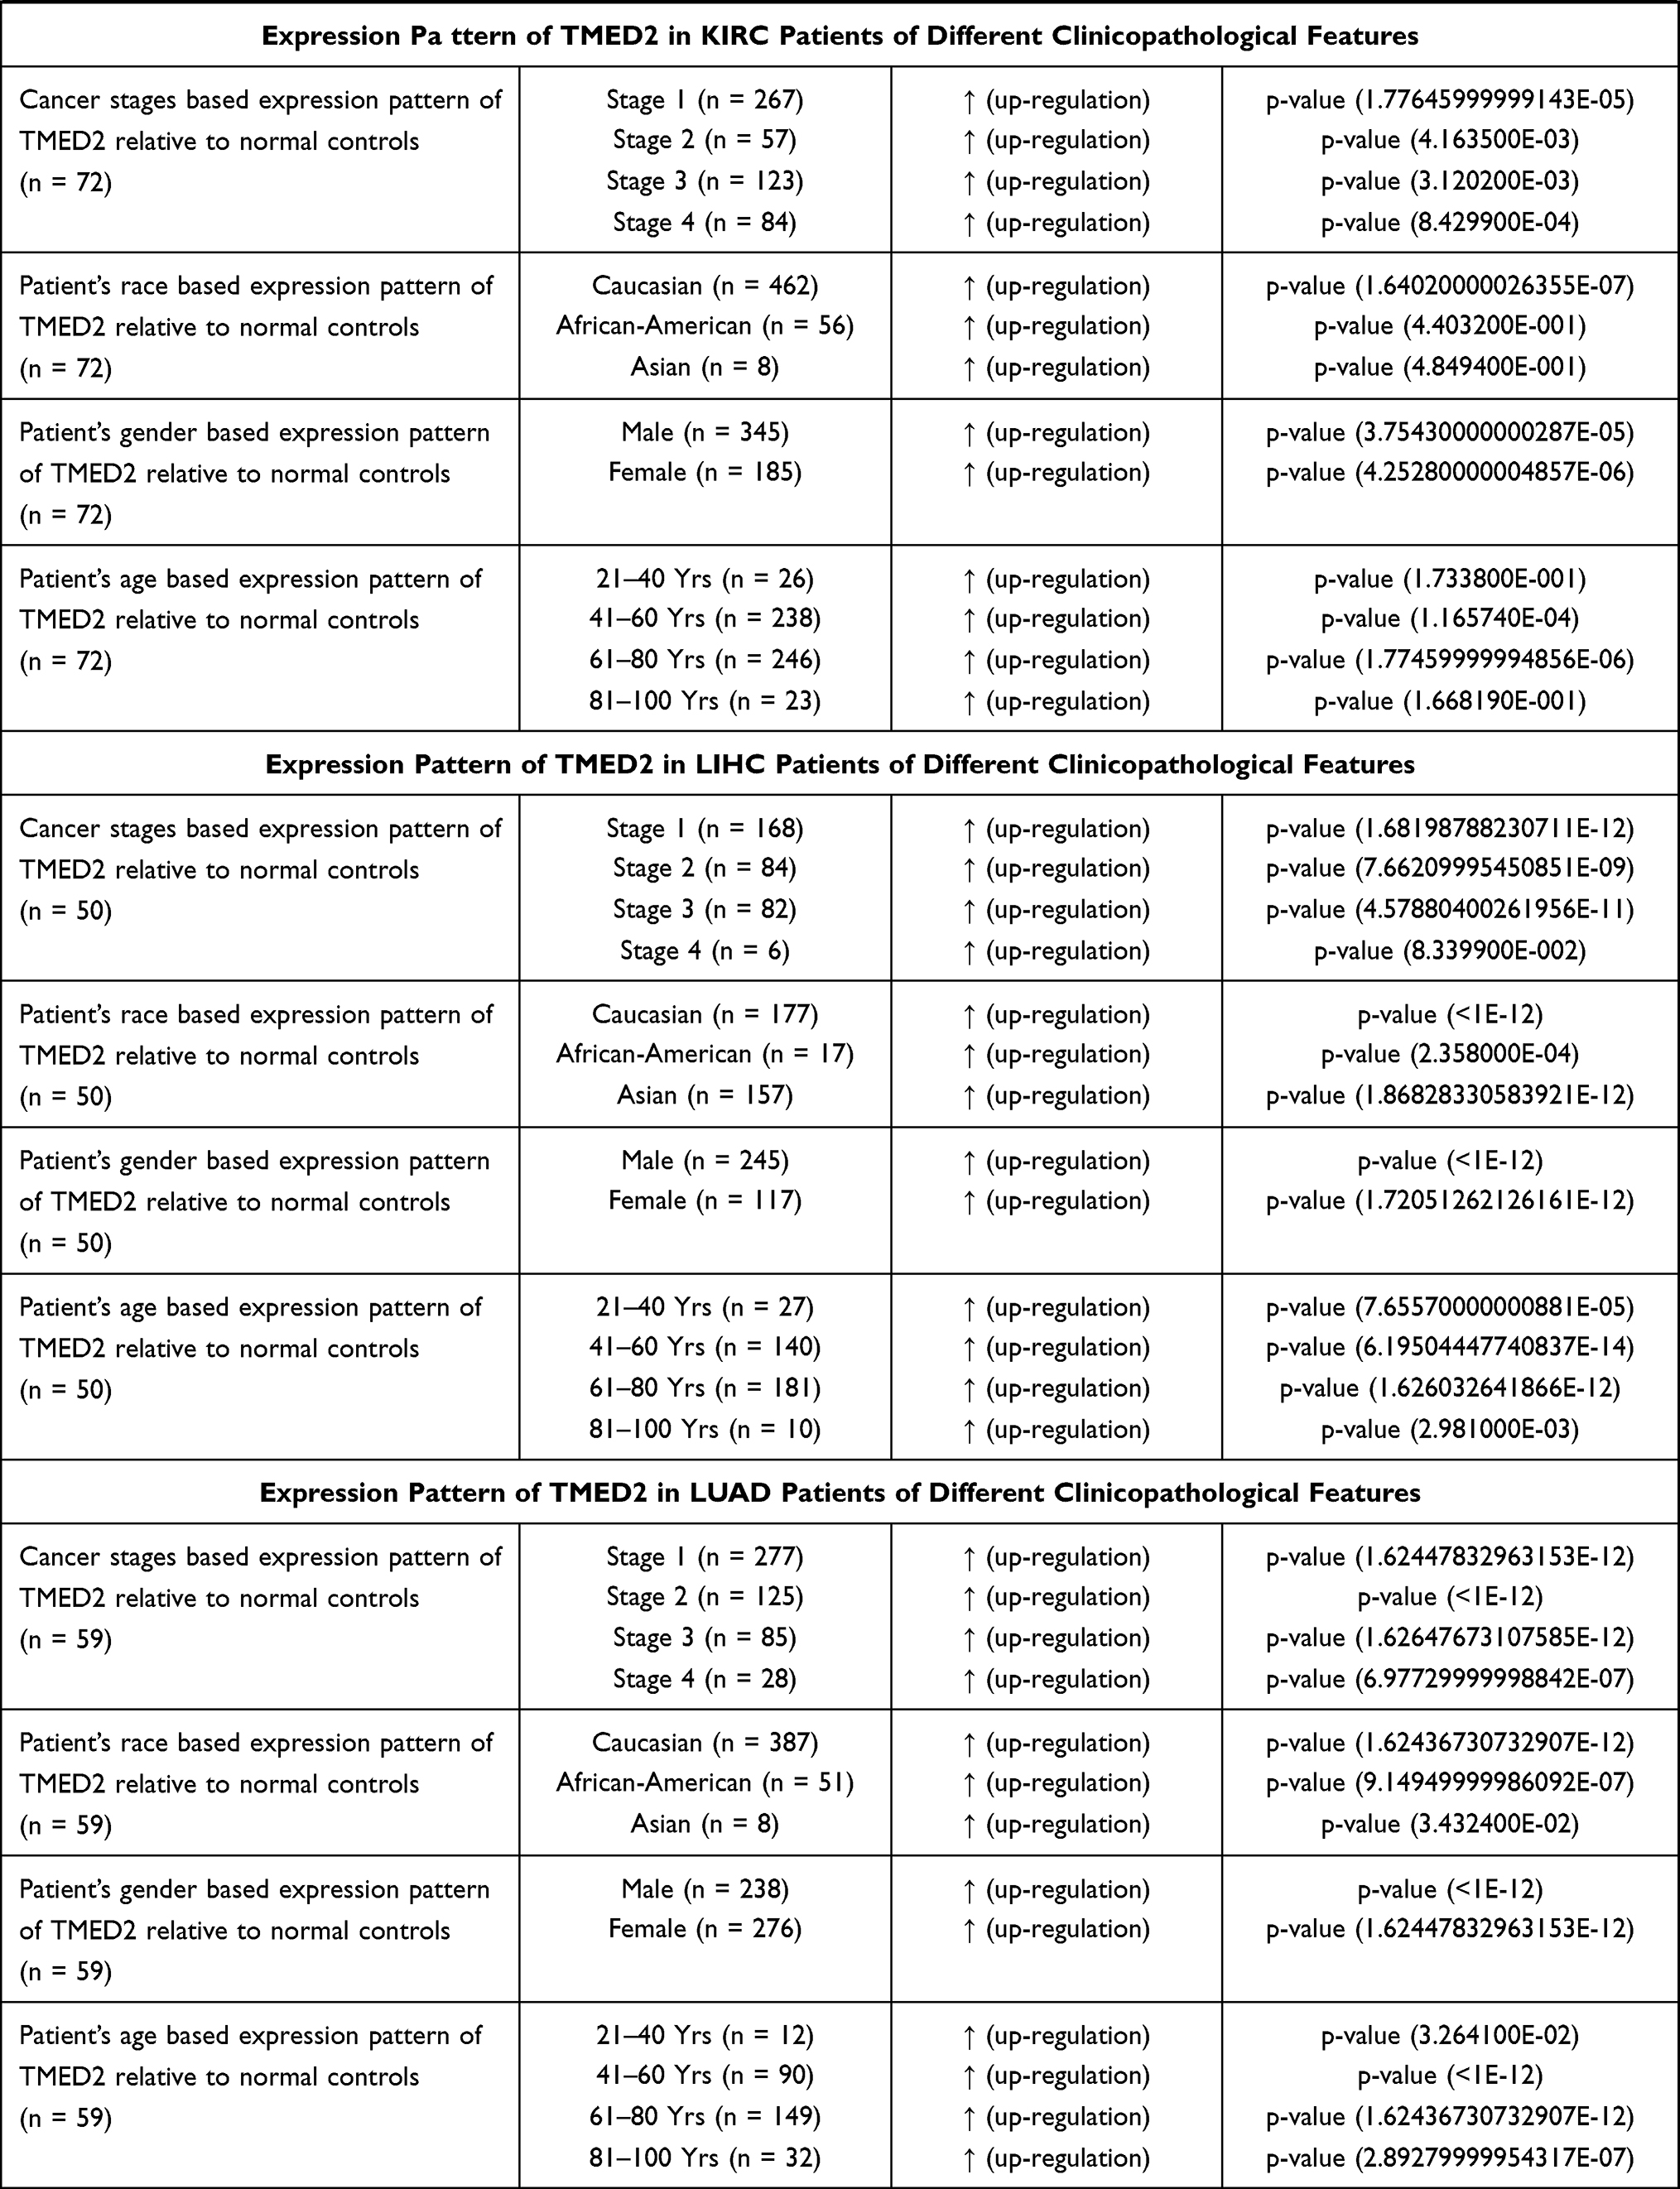 |  |
Table 1 Clinicopathalogical Features-Specific Expression Pattern of TMED2 in CESC, ESCA, HNSC, KIRC, LIHC, and LUAD Patients |
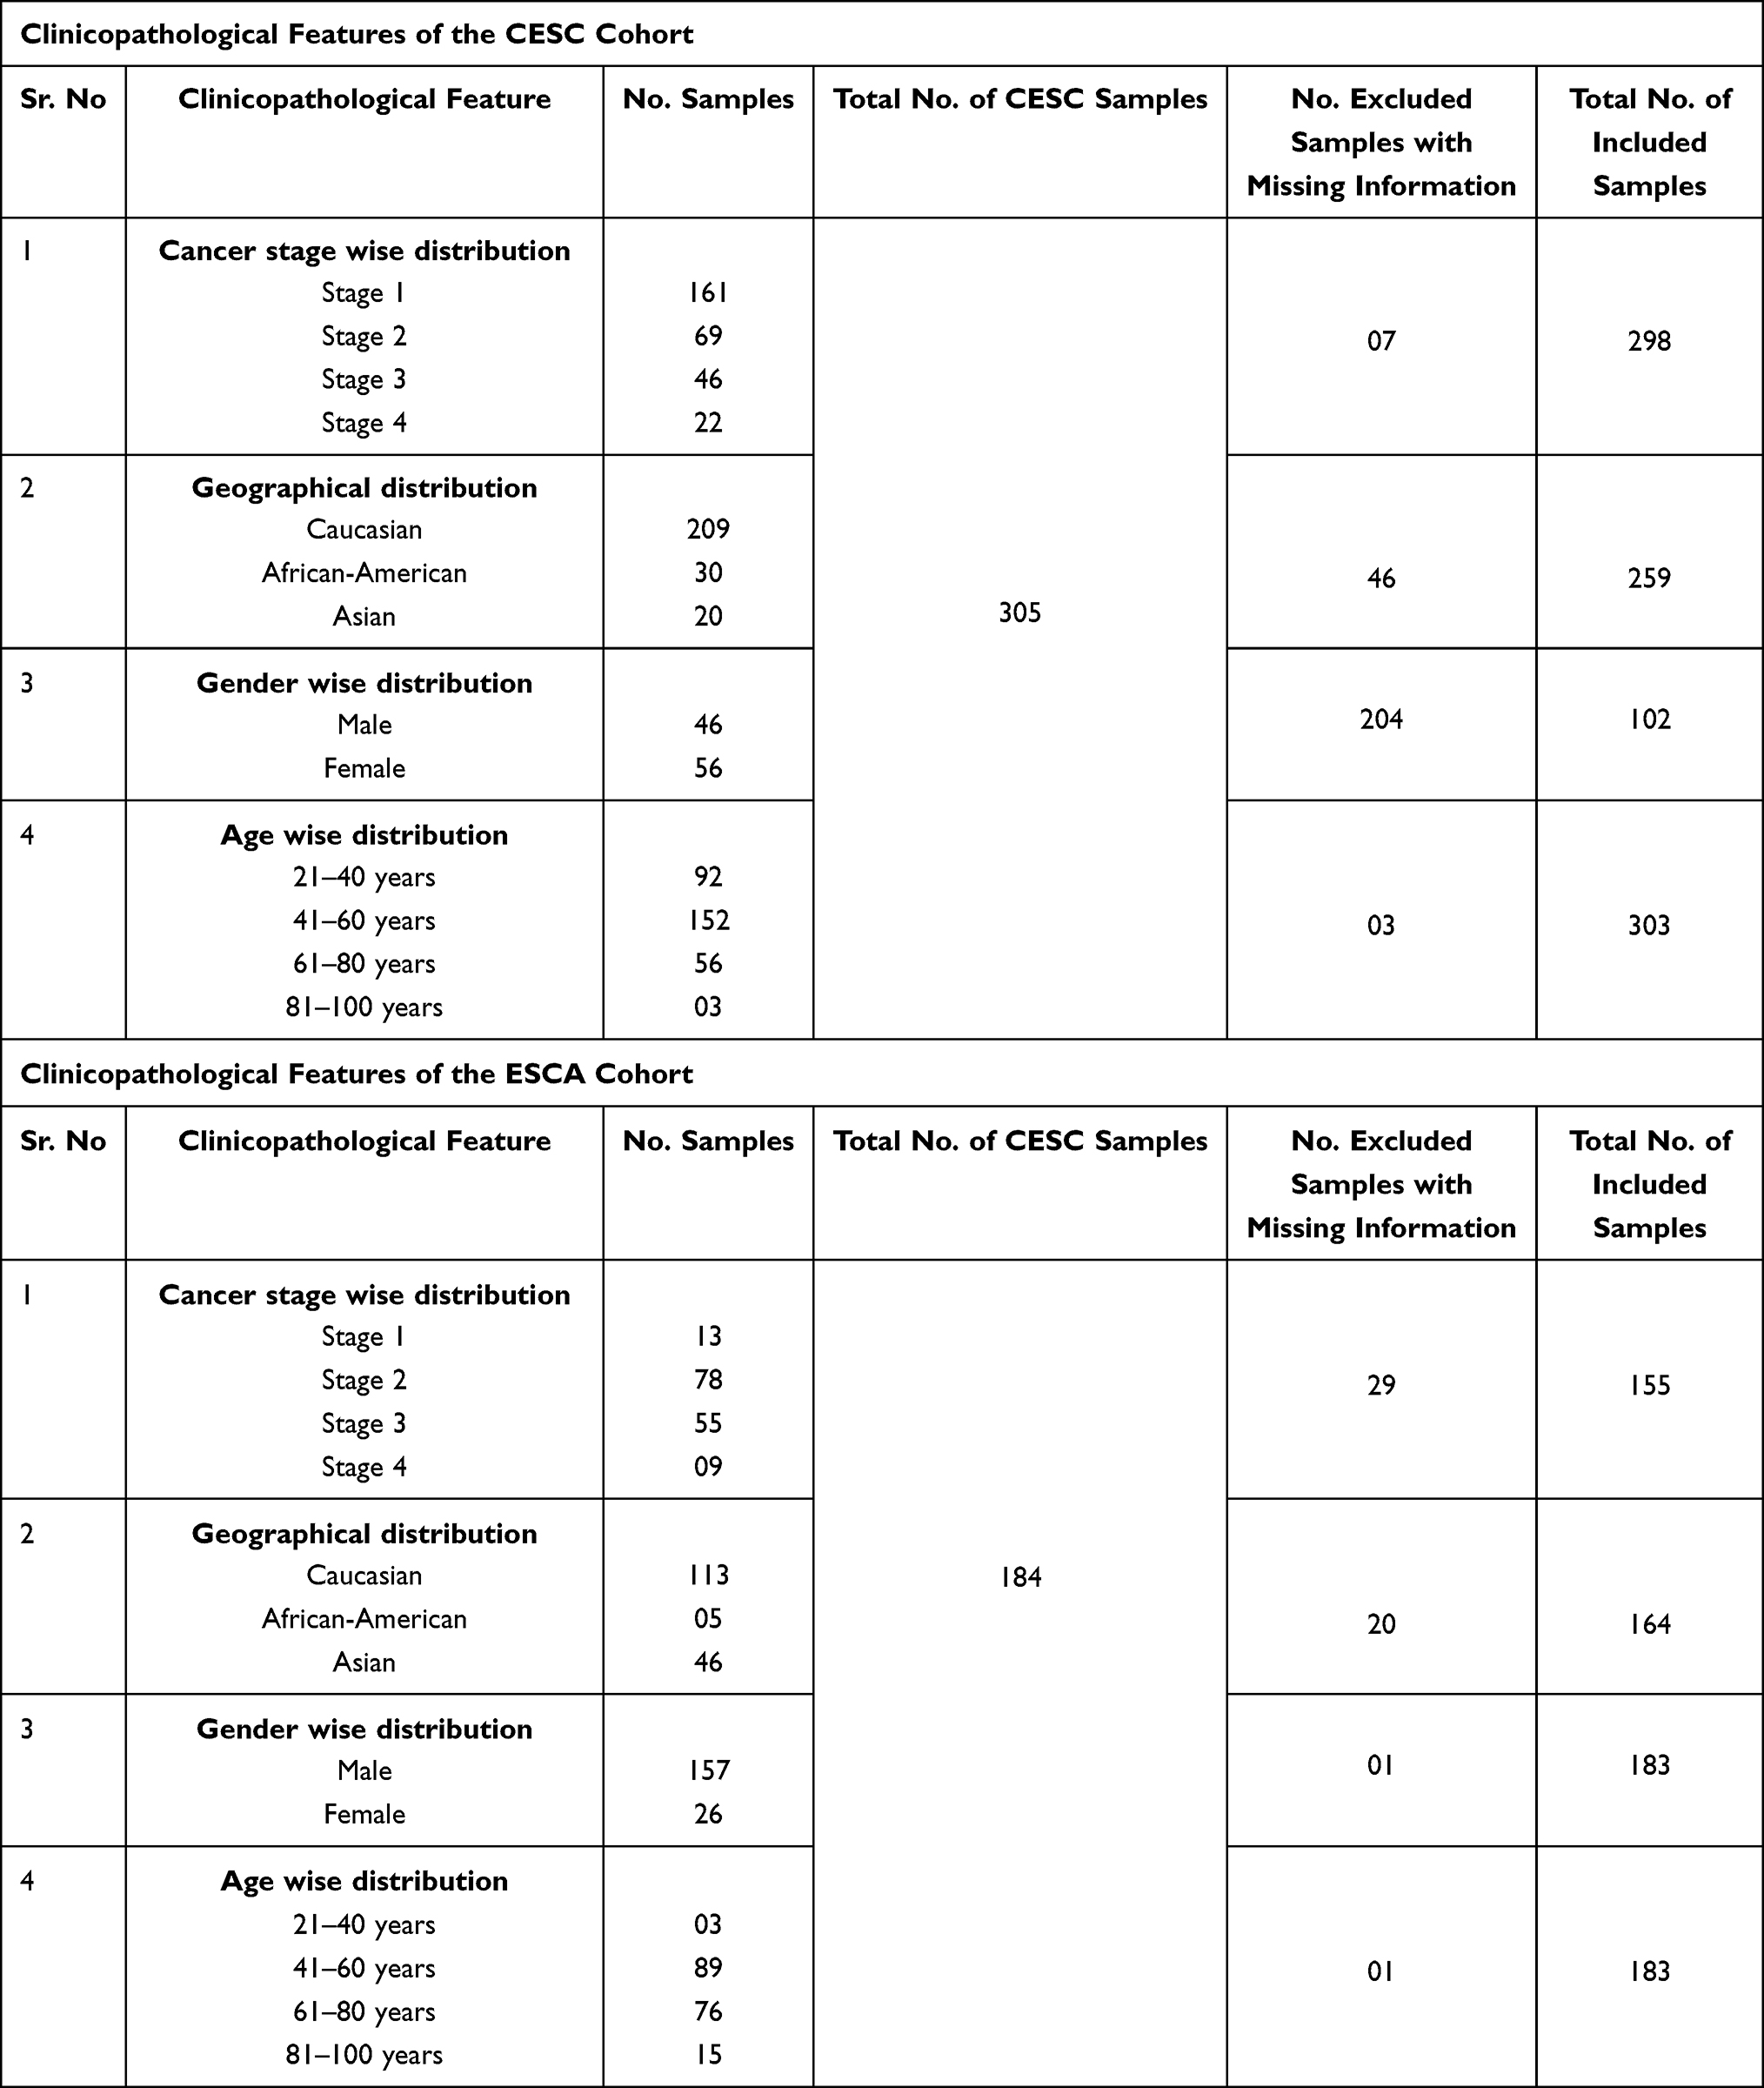 |
Table 2 Clinicopathological Features of the CESC and ESCA Cohorts Included in the Present Study |
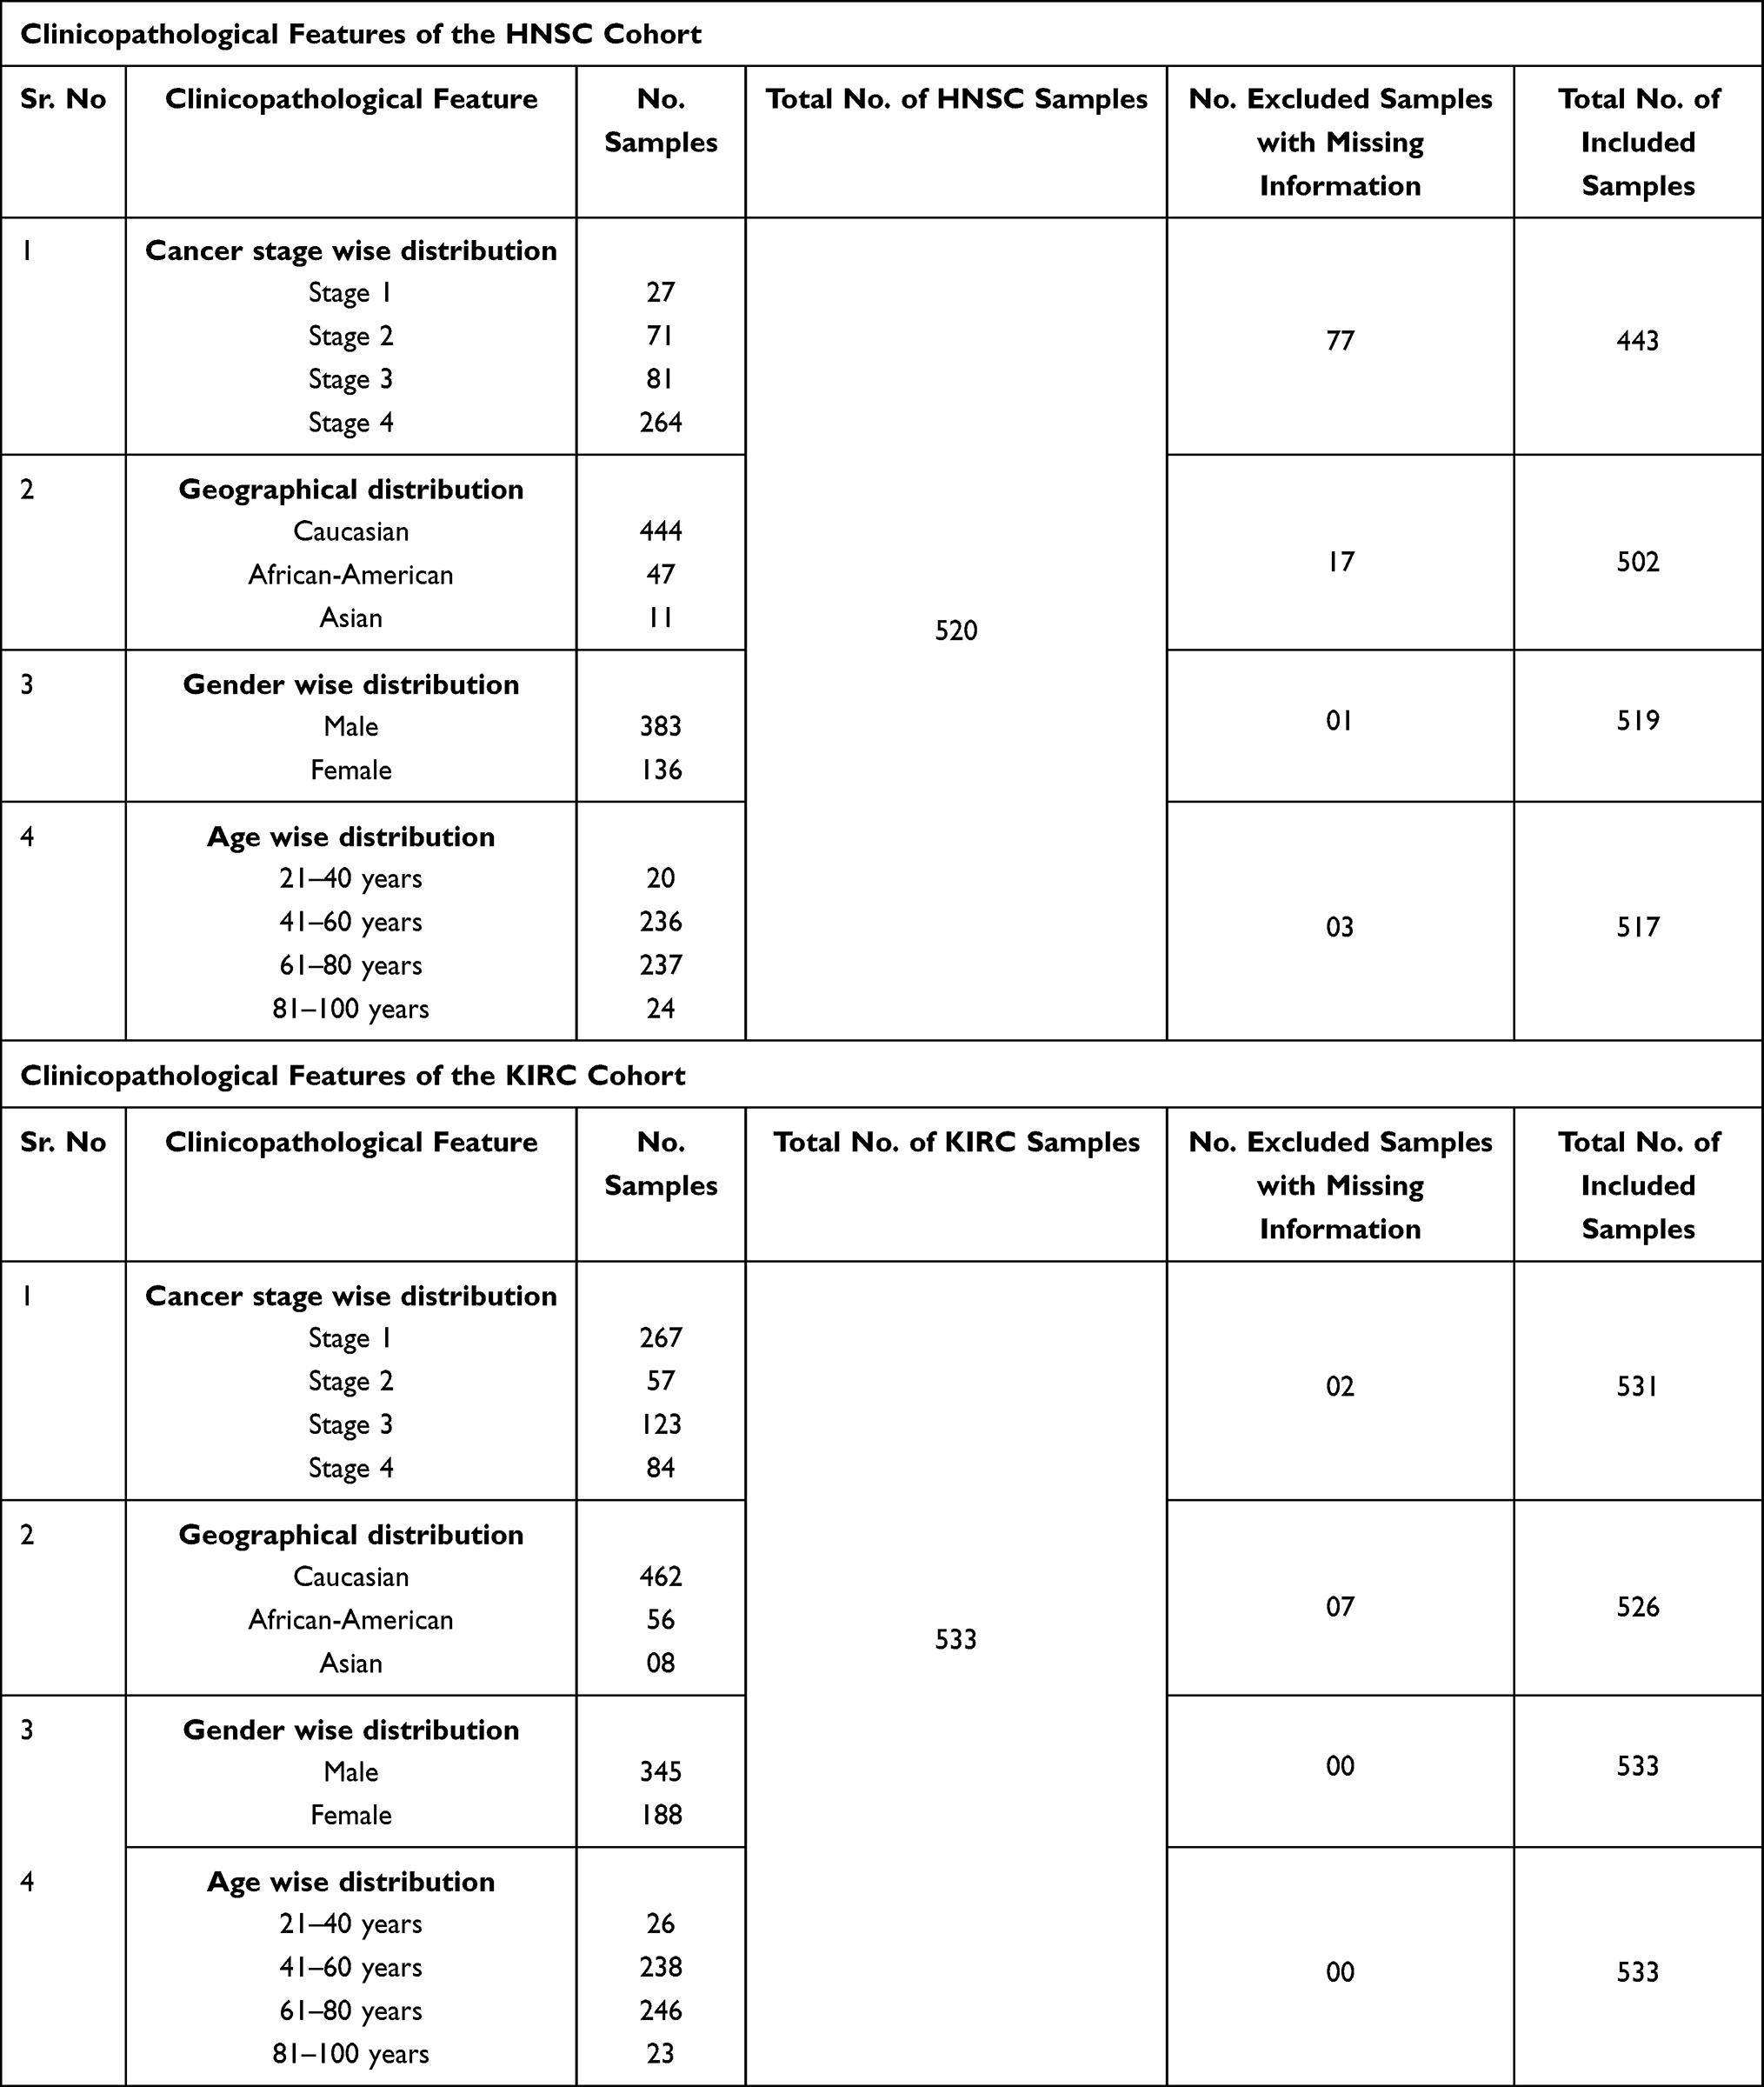 |
Table 3 Clinicopathological Features of the HNSC and KIRC Cohorts Included in the Present Study |
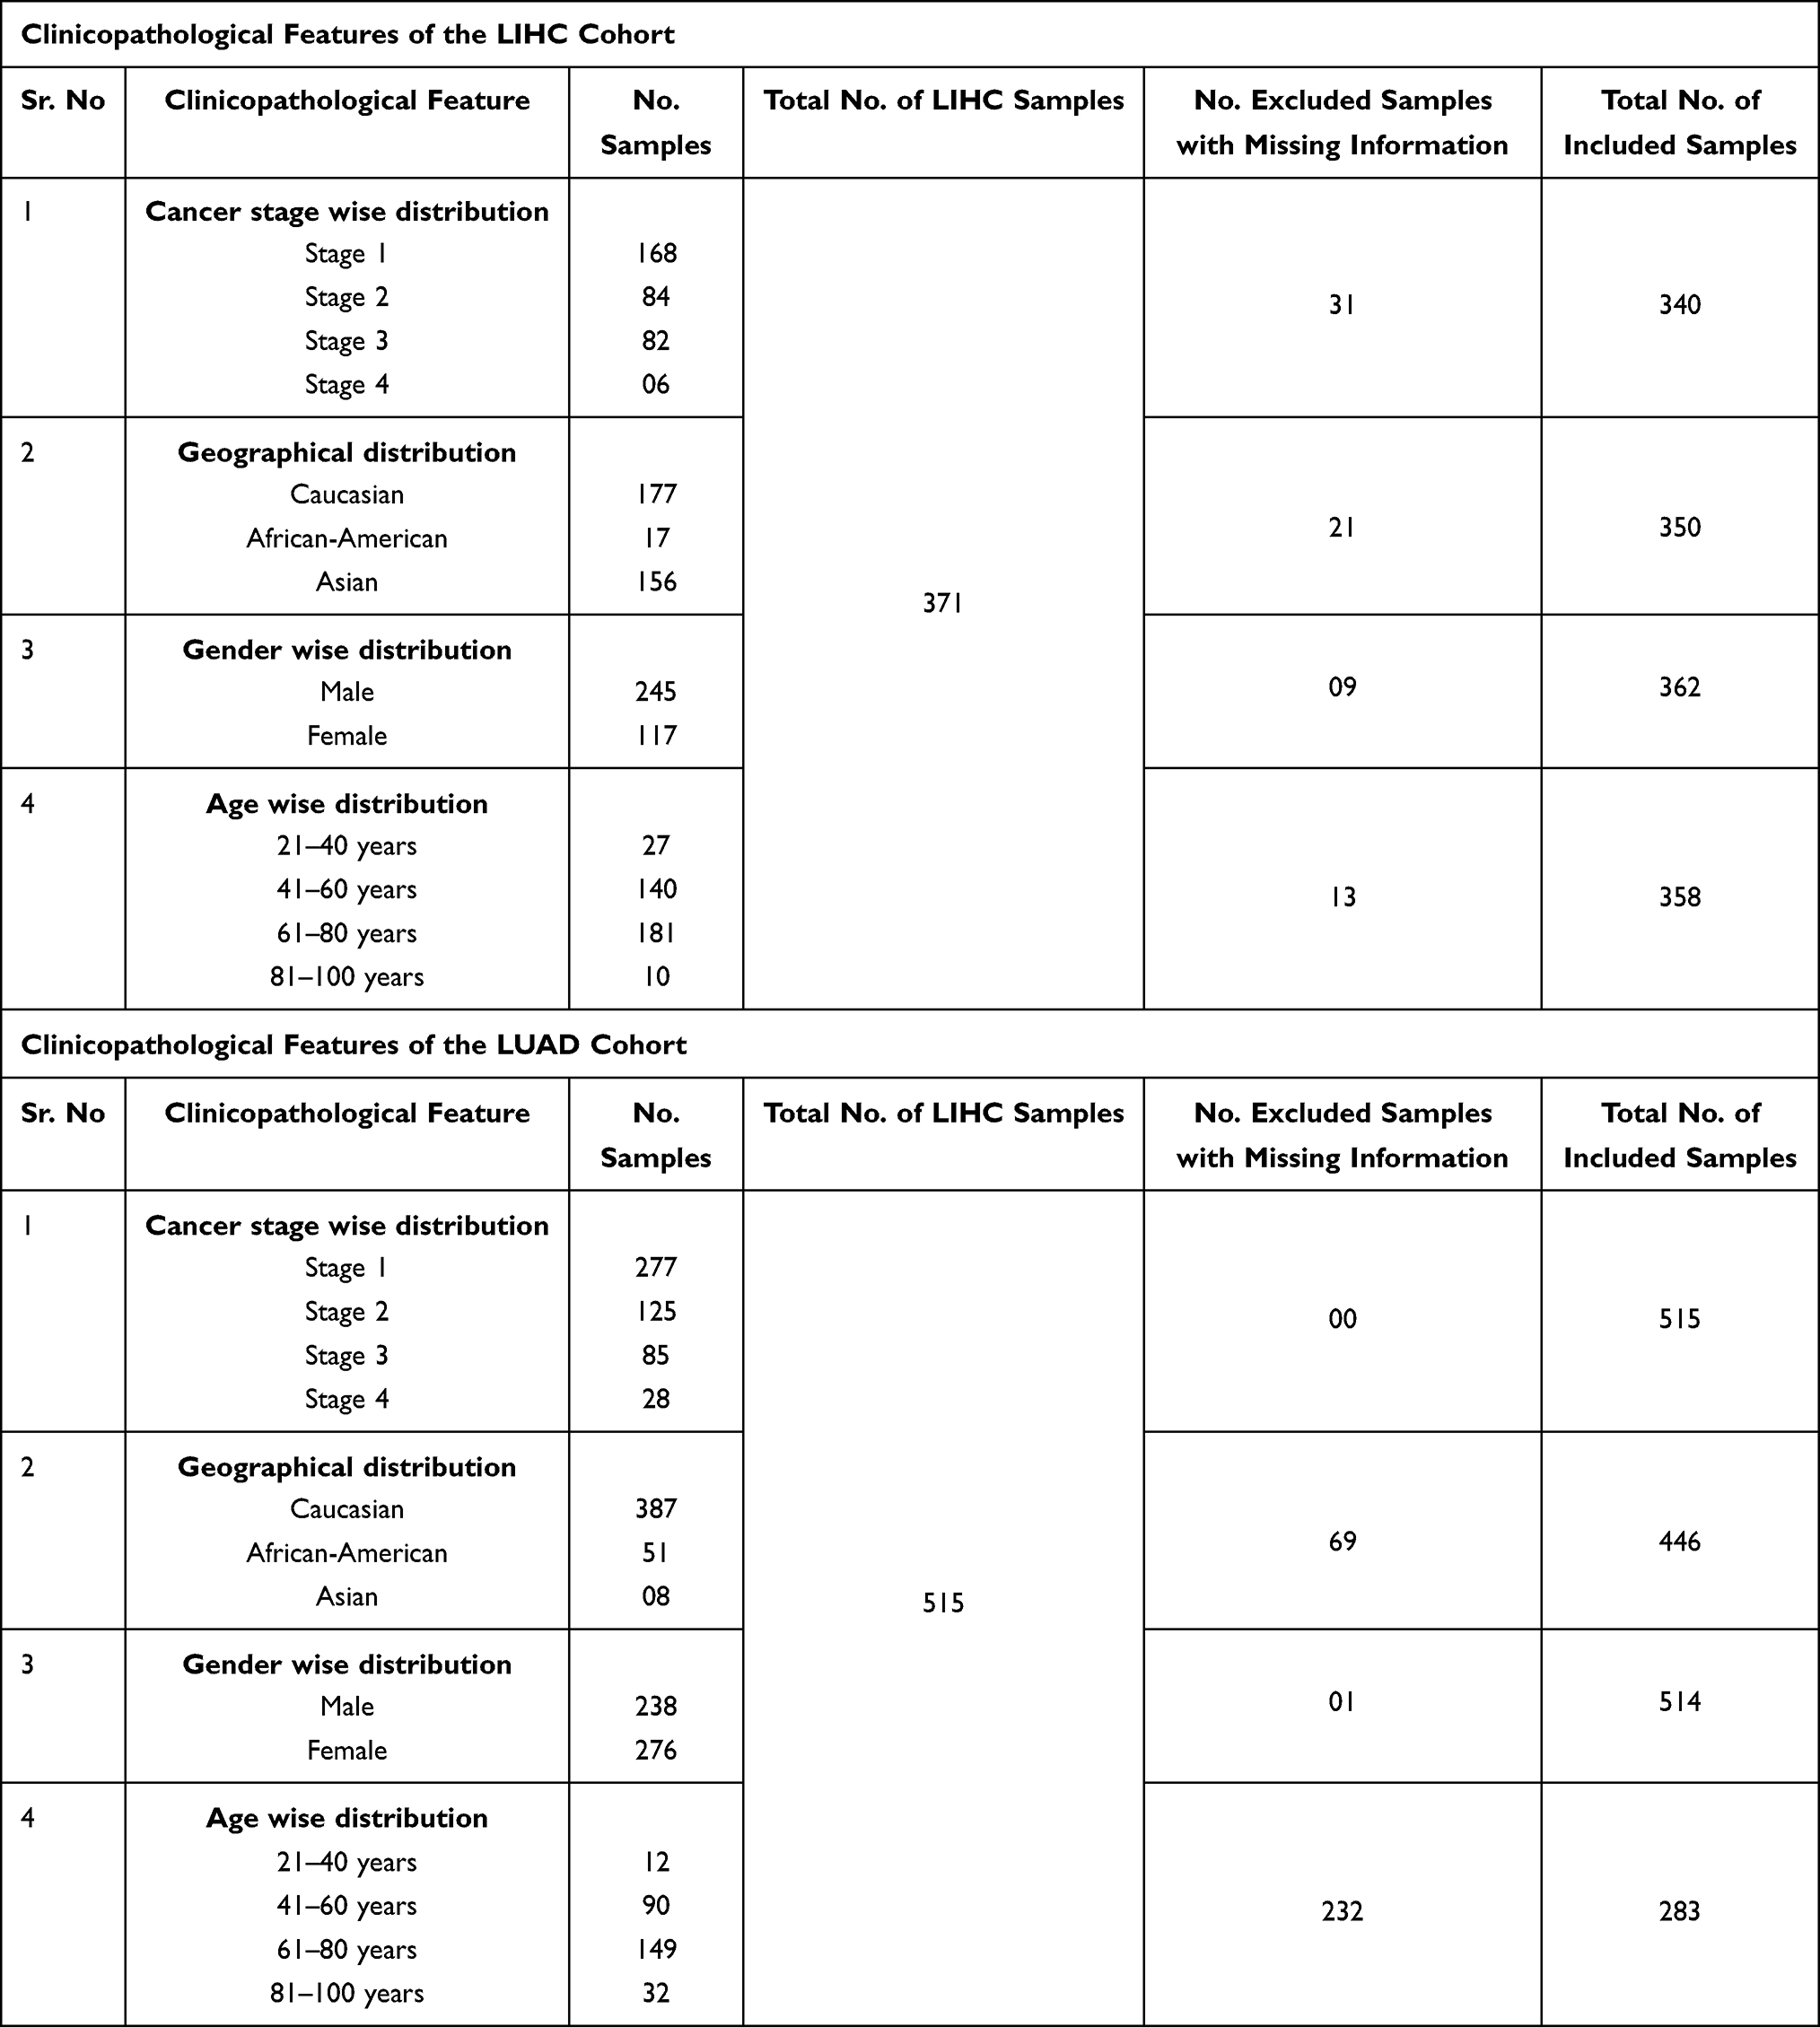 |
Table 4 Clinicopathological Features of the LIHC and LUAD Cohorts Included in the Present Study |
TMED2 Transcription Level Validation Using New Independent Cohorts of CESC, ESCA, HNSC, KIRC, LIHC, and LUAD
TMED2 transcription expression was re-analyzed using new expression data obtained through Affymetrix U133A and U133Plus2 microarray platforms from independent cohorts of CESC, ESCA, HNSC, KIRC, LIHC, and LUAD via GENT2 database. Our results further validated the significant (p>0.05) up-regulation of TMED2 in CESC, ESCA, HNSC, KIRC, LIHC, and LUAD patients relative to normal controls (Figure 3). Details of the new CESC, ESCA, HNSC, KIRC, LIHC, and LUAD datasets that were used for TMED2 transcription expression validation can be seen in Table 5.
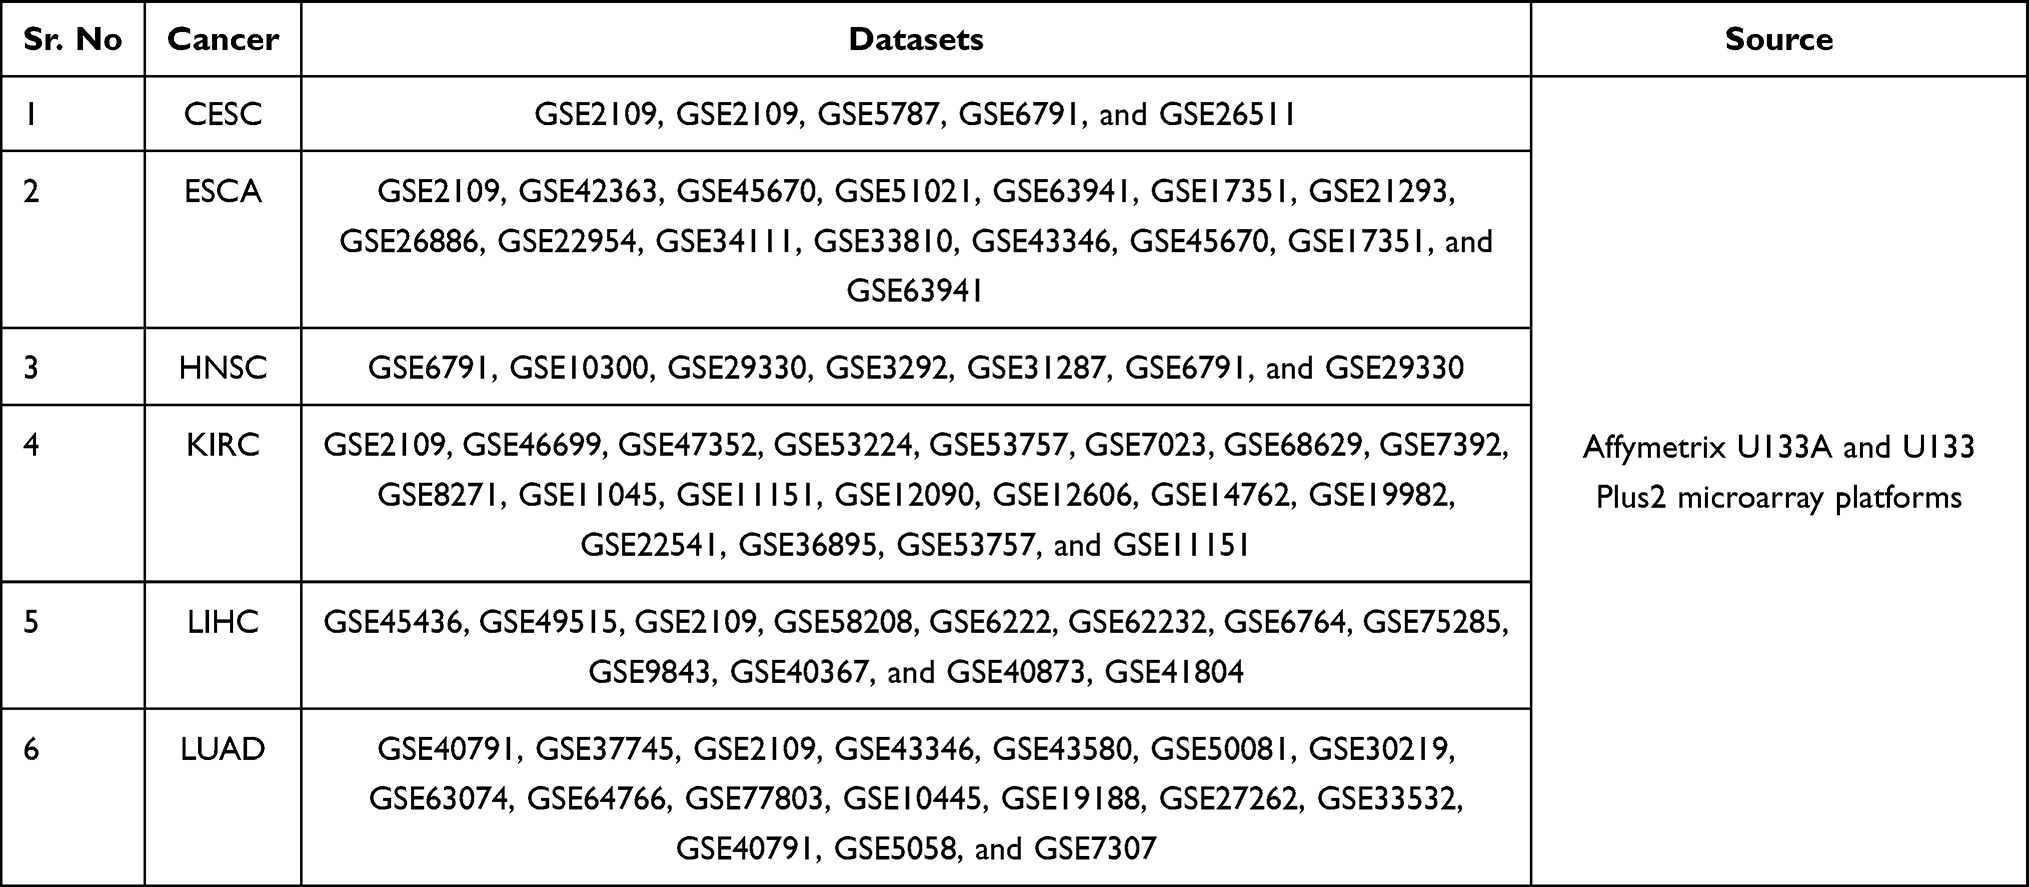 |
Table 5 Details of the CESC, ESCA, HNSC, KIRC, LIHC, and LUAD Datasets Used for the TMED2 Expression Validation via GENT2 Web Server |
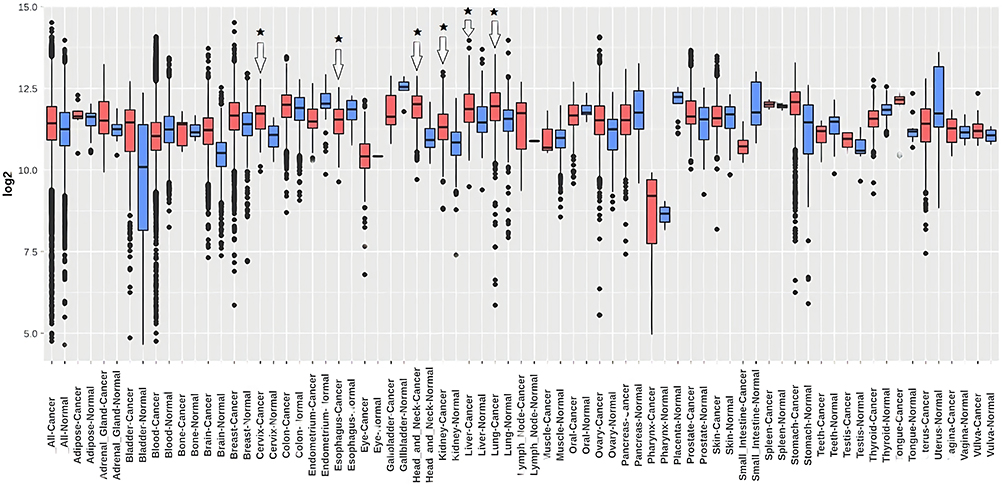 |
Figure 3 Transcription expression level validation of TMED2 using independent CESC, ESCA, HNSC, KIRC, LIHC, and LUAD cohorts via GENT2 database. Blue color represents the normal samples while red color indicates the cancer samples. *p < 0.05. |
Protein Expression Level Analysis of TMED2 in CESC, ESCA, HNSC, KIRC, LIHC, and LUAD
TMED2 protein expression levels in CESC, ESCA, HNSC, KIRC, LIHC, and LUAD and normal tissues were analyzed via the HPA database. As shown in Figure 4, an enhanced TMED2 protein expression was found in CESC (high), ESCA (high), HNSC (high), KIRC (high), LIHC (high), and LUAD (high) specimens relative to the paired normal CESC (medium), ESCA (medium), HNSC (medium), KIRC (low), LIHC (medium), and LUAD (medium). Taken together, our results have shown that TMED2 was also overexpressed at the translational level in cancer tissues of CESC, ESCA, HNSC, KIRC, LIHC, and LUAD relative to the normal controls.
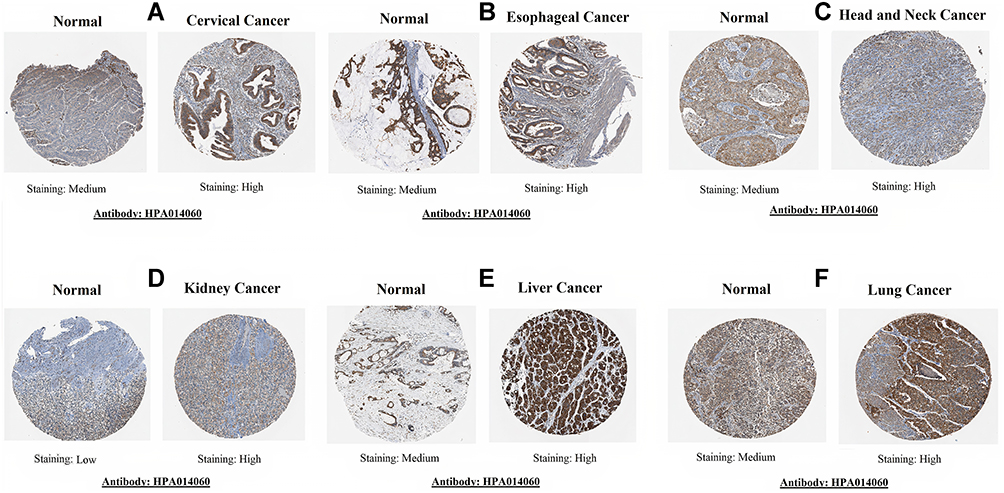 |
Figure 4 TMED2 translational expression analysis across distinct cancer tissues paired with normal controls via Human Protein Atlas (HPA) database (×200). (A) Cervical cancer, (B) Esophageal cancer, (C) Head and neck cancer, (D) Kidney cancer, (E) Liver cancer, and (F) Lung cancer. |
Promoter Methylation Analysis of the TMED2 in CESC, ESCA, HNSC, KIRC, LIHC, and LUAD
Promoter methylation performs the critical function in regulating gene expression, and any abnormality in promoter methylation can cause various genetic abnormalities including cancer.19 Herein, we utilized the MEXPRESS webserver to analyze whether TMED2 up-regulation is associated with its promoter methylation level or not. As per the analysis, we found a significant (p > 0.05) negative correlation between the promoter methylation and up-regulation of TMED2 in CESC, ESCA, HNSC, and KIRC, while a significant (p > 0.05) positive correlation in LIHC and LUAD. Collectively, these data suggested that TMED2 promoter hypomethylation might involve in its up-regulation in CESC, ESCA, HNSC, and KIRC (Figure 5) while hypermethylation of TMED2 in LIHC and LUAD (Figure 6) challenges the classical view of methylation and demand further extensive work for conclusive remarks.
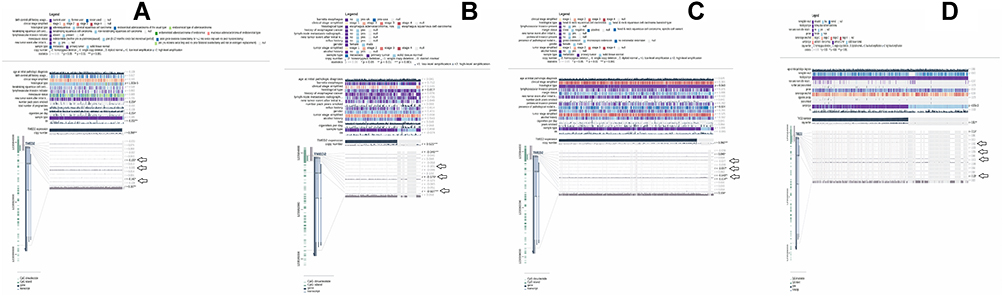 |
Figure 5 A MRXPRESS based correlation analysis between TMED2 expression and its promoter methylation in CESC, ESCA, HNSC, and KIRC. (A) In CESC, (B) In ESCA, (C) In HNSC, and (D) In KIRC. A negative sign indicates the negative correlation between TMED2 expression and its promoter methylation using a specific probe at a specific CpG island while a positive sign indicates the positive correlation between TMED2 expression and its promoter methylation using a specific probe at a specific CpG island. *p < 0.05. |
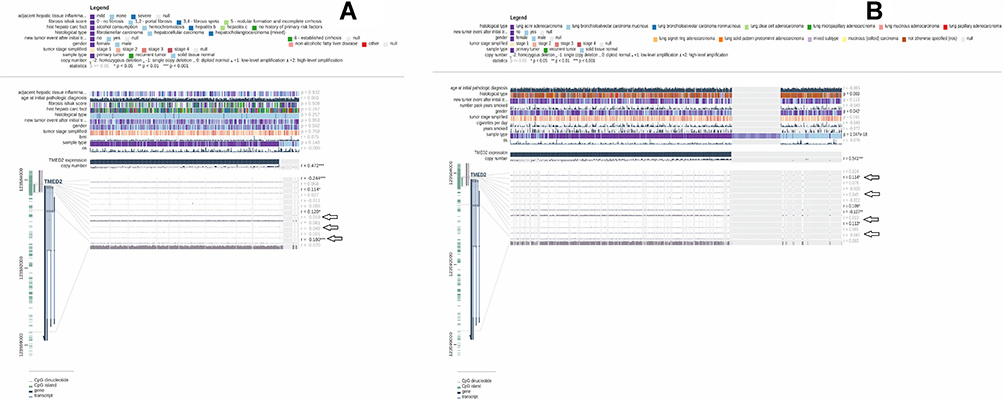 |
Figure 6 A MRXPRESS based correlation analysis between TMED2 expression and its promoter methylation in LIHC, and LUAD. (A) In LIHC, and (B) In LUAD. A negative sign indicates the negative correlation between TMED2 expression and its promoter methylation using a specific probe at a specific CpG island while a positive sign indicates the positive correlation between TMED2 expression and its promoter methylation using a specific probe at a specific CpG island. *p < 0.05. |
Genetic Alteration Analysis of TMED2 in CESC, ESCA, HNSC, KIRC, LIHC, and LUAD
Next, we determined the TMED2 genetic alteration frequencies in CESC, ESCA, HNSC, KIRC, LIHC, and LUAD samples through cBioPortal webserver using TCGA PanCancer Atlas datasets. Missense alterations were more likely to observe in CESC, LIHC, while ESCA, HNSC, KIRC, and LUAD were more likely to harbor deep amplification and deep deletion, respectively (Figure 7). Taken together, it is speculated that low percentages of observed genetic alterations in CESC (0.4%), ESCA (0.5%), HNSC (0.6%), KIRC (0.3%), LIHC (0.3%), and LUAD (0.8%) samples might have a least participation in the expression regulation of TMED2.
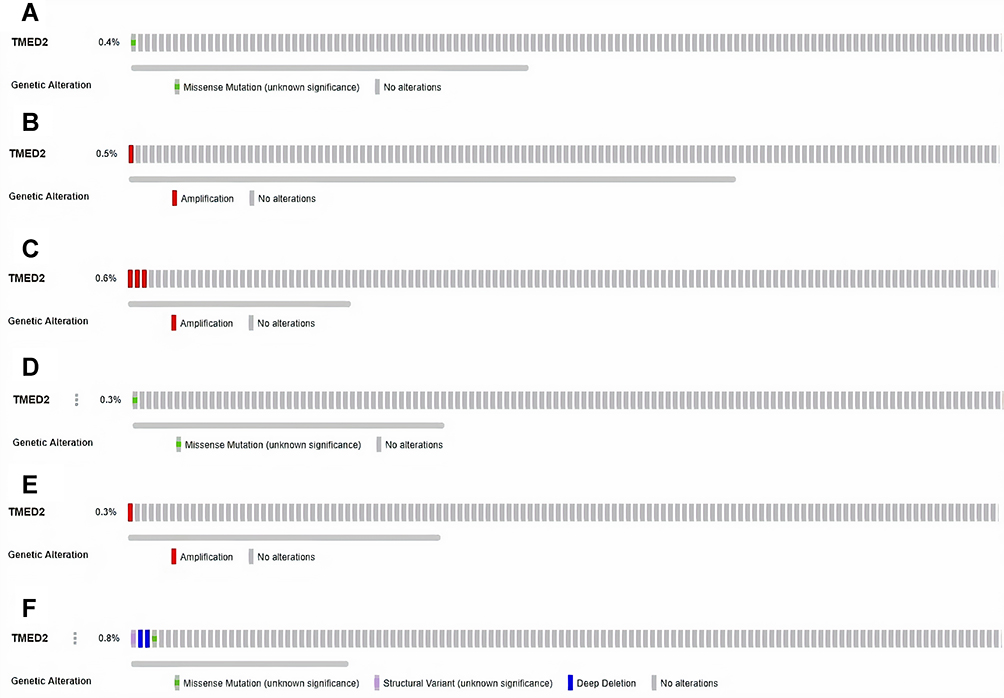 |
Figure 7 TMED2-related genetic alterations and CNVs in TCGA CESC, ESCA, HNSC, KIRC, LIHC, and LUAD datasets. (A) In CESC dataset, (B) In ESCA dataset, (C) In HNSC dataset, (D) In KIRC dataset, (E) In LIHC dataset and, (F) In LUAD dataset. |
PPI Network Construction, Visualization, and Pathway Enrichment Analysis of TMED2
We utilized STRING and Cytoscape resources to identify the TMED2 enriched genes. Functional interaction network analysis showed that TMED2 was closely associated with 16 different other genes (Figure 8A). We next performed the pathway analysis of TMED2 enriched genes using the DAVID tool. The obtained results showed that few TMED2 associated genes were significantly (p > 0.05) involved in 3 diverse pathways including Protein processing in endoplasmic reticulum, Legionellosis, and Endocytosis (Figure 8 and Table 6).
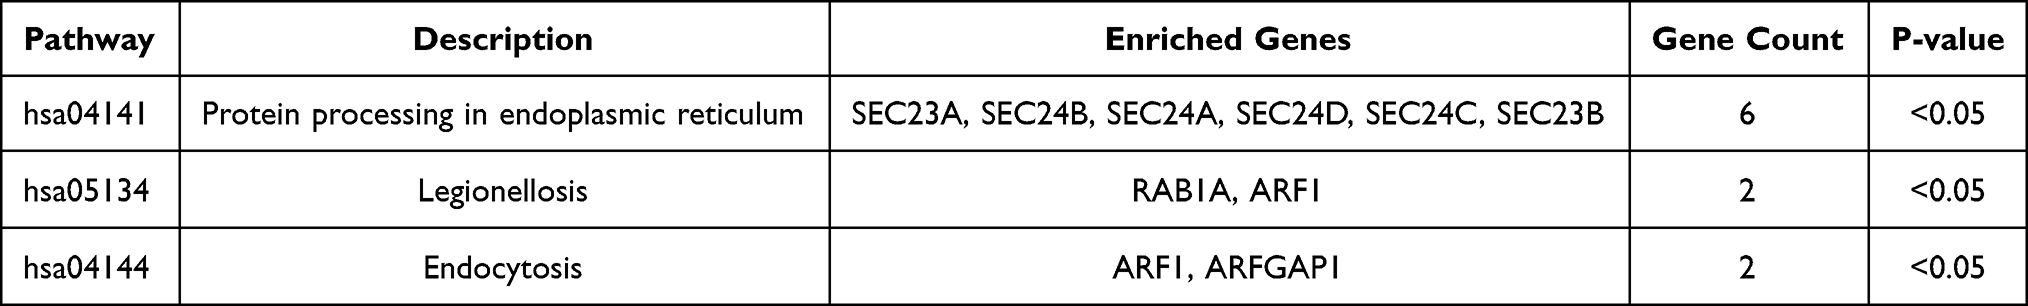 |
Table 6 Detail of Kyoto Encyclopedia of Genes and Genomes Pathway Analysis of the TMED2 Enriched Genes |
 |
Figure 8 A TMED2-enriched genes PPI network and pathway analysis. (A) A PPI network of TMED2 enriched genes, (B) Pathways analysis of the TMED2 enriched genes. |
TMED2 Overexpression and Infiltrating Level of CD8+ T Immune Cells in CESC, ESCA, HNSC, KIRC, LIHC, and LUAD Patients
To further explore whether TMED2 exerts any potential biological roles in CD8+ T immune infiltration or not, we carried out an integrated analysis using the TIMER database to find the association between TMED2 overexpression and CD8+ T immune cell infiltration in CESC, ESCA, HNSC, KIRC, LIHC, and LUAD. As shown in Figure 9, a high level of TMED2 have a significant (p>0.05) negative correlation with CD8+ T immune cells level in CESC, ESCA, HNSC, KIRC, LIHC, and LUAD (Figure 9).
 |
Figure 9 Spearman correlational analysis of TMED2 expression with CD8+ T immune cells level in CESC, ESCA, HNSC, KIRC, LIHC, and LUAD via TIMER. A p-value < 0.05 was considered as significant. |
Gene–Drug Interaction Network Analysis of the TMED2
To find the association of TMED2 expression with different available cancer therapeutic drugs, we developed and analyzed the gene–drug interaction network via CTD database and Cytoscape software. In view of our results, it was observed that TMED2 expression can potentially regulate by a variety of drugs. For example, estradiol and bisphenol A can elevate the expression level of TMED2 while ketolides and glyphosate can reduce TMED2 expression level (Figure 10).
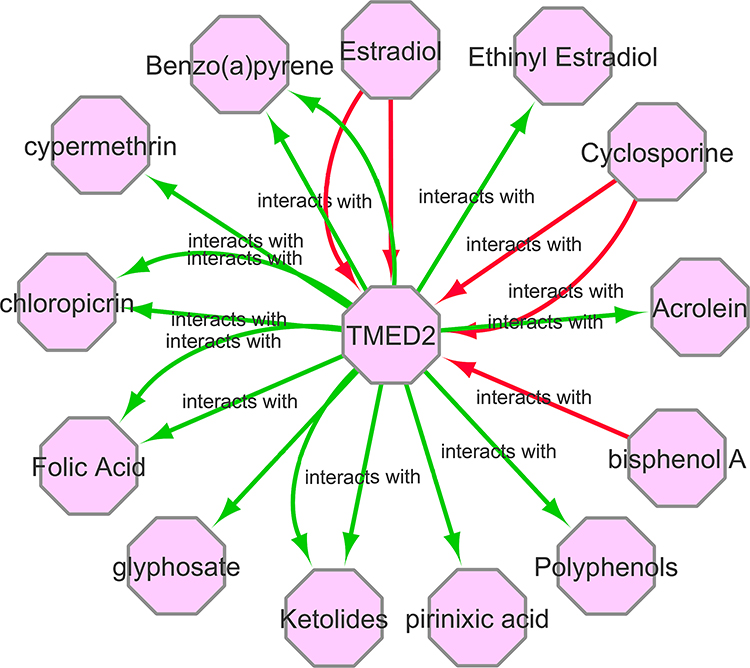 |
Figure 10 A gene–drug interaction network of TMED2 targeted drugs from CTD. Red arrows show chemotherapeutic drugs that can increase TMED2 expression while green arrows highlight chemotherapeutic drugs that can decrease TMED2 expression. The numbers of arrows between each interaction represent the supported numbers of studies. |
Discussion
The TMED gene family was discovered around twenty years ago, its functions and underlying mechanisms are still unclear. Few earlier studies have reported that dysregulation of TMED genes can cause many diseases ranging from cancer to Alzheimer’s.20 Some studies also revealed that TMED3 is a tumor suppressor gene and plays an important role in the initiation and development of colon cancer, prostate cancer, and hepatocellular carcinoma.6–8 However, the role of TMED2 in cancer has been least studied so far. In the present study, we comprehensively analyzed TMED2 expression in 24 major subtypes of the human cancers to identify few TMED2-associated subtypes.
In our study, we observed that TMED2 was significantly (p > 0.05) overexpressed in all 24 major subtypes of human cancers relative to normal controls (Figure 1). Next, we also verified that TMED2 overexpression was significantly (p < 0.05) associated with the significant (p < 0.05) decreased in OS and RFS duration of the CESC, ESCA, HNSC, KIRC, LIHC, and LUAD patients. Taken together, these findings told us that TMED2 might play a crucial role in the initiation and progression of CESC, ESCA, HNSC, KIRC, LIHC, and LUAD, therefore, in the present study, our main focus are these six cancer subtypes. Next, we further re-examined TMED2 expression individually in CESC, ESCA, HNSC, KIRC, LIHC, and LUAD patients of different clinicopathological features. A significant (p < 0.05) up-regulation of TMED2 was also observed in CESC, ESCA, HNSC, KIRC, LIHC, and LUAD patients of various clinicopathological features in comparison to normal controls such as different cancer stages, patients races, patients genders, and patients ages.
The epigenome variations are thought to be linked with numerous types of diseases; however, DNA promoter methylation is the only epigenetic marker that is stable enough to detect in different kinds of diseased samples.21 Any abnormal change in the DNA promoter methylation level either hypo or hypermethylation might result in aberrant gene expression.22 Earlier studies have already identified the role of abnormal DNA promoter methylation in different types of human cancers.23,24 In our study, we noticed that the TMED2 promoter methylation level was lower as per expectations in CESC, ESCA, HNSC, and KIRC samples relative to normal controls. In contrast, we observed that TMED2 promoter methylation level was unexpectedly higher in LIHC and LUAD samples as compared to the normal controls. Such differences in the promoter methylation levels of TMED2 may suggest that the TMED2 gene has different epigenetic regulations among different types of cancers. Taken together, we speculated that TMED2 promoter hypomethylation is closely linked with its overexpression in CESC, ESCA, HNSC, and KIRC, however, the causes of different TMED2 promoter hypermethylation in LIHC and LUAD are needed to be explored by further large-scale studies.
Genetic abnormalities are the molecular biomarker of tumorigenesis, and CNVs are the major types of genetic abnormalities that play a key role in the initiation and development of different human cancers.25,26 In this study, we identified the minor percentages of the TMED2 genetic abnormalities and CNVs (0.4%, 0.5%, 0.6%, 0.%, 0.3%, and 0.8%) in the analyzed CESC, ESCA, HNSC, KIRC, LIHC, and LUAD samples, respectively. Overall, these results suggested that genetic abnormalities may not play any significant role in the expression regulation of TMED2, however, further detailed work is required to confirm it.
Although recent studies have identified several CESC, ESCA, HNSC, KIRC, LIHC, and LUAD associated diagnostic and prognostic biomarkers including different genes, such as RFC4, ADGRF4, ANXA8L1, TOP2A, HCAR3, MCM2, IRF6, and PDE2A in CESC,27,28 COL1A2, DGCR8, COL1A1, POM121, TAF9, UPF3B, ZNF469, BCAP31, and COL3A1 in ESCA,29,30 LAMC2, CCT3/4/5/6/7/8, and FGFR1-4 in HNSC,31–33 PLCB2, TNFSF13B, VAV1, RAC2, and PARVG in KIRC,34,35 CDC20, MTHFD1L, CDCA8, CDCA5, KIF2C, and KIFC1 in LIHC,36,37 CCNB1, SPP1, TOP2A, MKI67, CHEK1, RRM2, and CDK1 in LUAD.38 However, none of these or any other biomarkers have been generalized so far in CESC, ESCA, HNSC, KIRC, LIHC, and LUAD patients of different clinicopathological features. In the current study, we have noticed the significant (p < 0.05) TMED2 up-regulation in CESC, ESCA, HNSC, KIRC, LIHC, and LUAD patients of different clinicopathological features including different cancer stages, patients races, genders, and age groups relative to controls. Additionally, the promoter methylation level, OS, and RFS information of TMED2 have also highlighted its potential as a useful novel potential biomarker in these cancers. Best to our knowledge, this study is the first to report a shared clinicopathological features-specific diagnostic and prognostic role of TMED2 in six different cancers including CESC, ESCA, HNSC, KIRC, LIHC, and LUAD, which may help to design the effective diagnostic and therapeutic strategies for cancer patients.
Recent studies have investigated that some genes regulate the tumor microenvironment by changing the levels of immune cells.39,40 Therefore, we analyzed the association between TMED2 and CD8+ T immune cells infiltration in CESC, ESCA, HNSC, KIRC, LIHC, and LUAD. As a result, TMED2 overexpression has shown a negative correlation with CD8+ T immune cells level in CESC, ESCA, HNSC, KIRC, LIHC, and LUAD. Collectively, this correlation scenario between TMED2 overexpression and CD8+ T immune infiltration indicates that TMED2 may initiate tumor development by changing the level of immune infiltration in the tumor microenvironment, but further work is required to confirm it.
The PPI network of TMED revealed that it directly interacts with the 16 different genes and a few of them were involved in 3 important signaling pathways including Protein processing in endoplasmic reticulum, Legionellosis, and Endocytosis (Table 6). Additionally, we have also identified few potential drugs that could regulate TMED2 expression, suggesting their importance as effective participants in designing the most appropriate therapeutic strategies for CESC, ESCA, HNSC, KIRC, LIHC, and LUAD (Figure 10).
Conclusion
In conclusion, we found that TMED2 is overexpressed in 24 major types of human cancers while it significantly reduced the OS and RFS duration of only CESC, ESCA, HNSC, KIRC, LIHC, and LUAD patients. This implies TMED2 is involved in the oncogenesis of these cancers. In addition, further multi-omics analysis also suggested TMED2 as the novel diagnostic and prognostic biomarker of survival in CESC, ESCA, HNSC, KIRC, LIHC, and LUAD patients of different clinicopathological features. However, additional work needed to be done on a large scale prior to clinical implications.
Disclosure
The authors report no conflicts of interest for this work.
References
1. Nagai H, Kim YH. Cancer prevention from the perspective of global cancer burden patterns. J Thorac Dis. 2017;9(3):448–451. doi:10.21037/jtd.2017.02.75
2. Hunter KW, Crawford NPS, Alsarraj J. Mechanisms of metastasis. Breast Cancer Res. 2008;10(Suppl1):S2. doi:10.1186/bcr1988
3. Ventola CL. Cancer immunotherapy, part 2: efficacy, safety, and other clinical considerations. P T. 2017;42(7):452–463.
4. Aber R, Chan W, Mugisha S, Jerome-Majewska LA. Transmembrane emp24 domain proteins in development and disease. Genet Res. 2019;101:e14–e14. doi:10.1017/S0016672319000090
5. Lin X, Liu J, Hu SF, Hu X. Increased expression of TMED2 is an unfavorable prognostic factor in patients with breast cancer. Cancer Manag Res. 2019;11:2203–2214. doi:10.2147/CMAR.S192949
6. Duquet A, Melotti A, Mishra S, et al. A novel genome-wide in vivo screen for metastatic suppressors in human colon cancer identifies the positive WNT-TCF pathway modulators TMED3 and SOX12. EMBO Mol Med. 2014;6(7):882–901. doi:10.15252/emmm.201303799
7. Vainio P, Mpindi J-P, Kohonen P, et al. High-throughput transcriptomic and RNAi analysis identifies AIM1, ERGIC1, TMED3 and TPX2 as potential drug targets in prostate cancer. PLoS One. 2012;7(6):e39801–e39801. doi:10.1371/journal.pone.0039801
8. Zheng H, Yang Y, Han J, et al. TMED3 promotes hepatocellular carcinoma progression via IL-11/STAT3 signaling. Sci Rep. 2016;6(1):37070. doi:10.1038/srep37070
9. Chandrashekar DS, Bashel B, Balasubramanya SAH, et al. UALCAN: a portal for facilitating tumor subgroup gene expression and survival analyses. Neoplasia. 2017;19(8):649–658. doi:10.1016/j.neo.2017.05.002
10. Park S-J, Yoon B-H, Kim S-K, Kim S-Y. GENT2: an updated gene expression database for normal and tumor tissues. BMC Med Genom. 2019;12(5):101. doi:10.1186/s12920-019-0514-7
11. Uhlén M, Fagerberg L, Hallström BM, et al. Tissue-based map of the human proteome. Science. 2015;347(6220). doi:10.1126/science.1260419
12. Koch A, De Meyer T, Jeschke J, Van Criekinge W. MEXPRESS: visualizing expression, DNA methylation and clinical TCGA data. BMC Genom. 2015;16(1):636. doi:10.1186/s12864-015-1847-z
13. Cerami E, Gao J, Dogrusoz U, et al. The cBio cancer genomics portal: an open platform for exploring multidimensional cancer genomics data. Cancer Discov. 2012;2(5):401–404. doi:10.1158/2159-8290.CD-12-0095
14. von Mering C, Huynen M, Jaeggi D, Schmidt S, Bork P, Snel B. STRING: a database of predicted functional associations between proteins. Nucleic Acids Res. 2003;31(1):258–261. doi:10.1093/nar/gkg034
15. Shannon P, Markiel A, Ozier O, et al. Cytoscape: a software environment for integrated models of biomolecular interaction networks. Genome Res. 2003;13(11):2498–2504. doi:10.1101/gr.1239303
16. Huang DW, Sherman BT, Tan Q, et al. The DAVID gene functional classification tool: a novel biological module-centric algorithm to functionally analyze large gene lists. Genome Biol. 2007;8(9):R183–R183. doi:10.1186/gb-2007-8-9-r183
17. Li T, Fu J, Zeng Z, et al. TIMER2.0 for analysis of tumor-infiltrating immune cells. Nucleic Acids Res. 2020;48(W1):W509–W514. doi:10.1093/nar/gkaa407
18. Mattingly CJ, Colby GT, Forrest JN, Boyer JL. The Comparative Toxicogenomics Database (CTD). Environ Health Perspect. 2003;111(6):793–795. doi:10.1289/ehp.6028
19. Luczak MW, Jagodziński PP. The role of DNA methylation in cancer development. Folia Histochem Cytobiol. 2006;44(3):143–154.
20. Hou W, Gupta S, Beauchamp M-C, Yuan L, Jerome-Majewska LA. Non-alcoholic fatty liver disease in mice with heterozygous mutation in TMED2. PLoS One. 2017;12(8):e0182995–e0182995. doi:10.1371/journal.pone.0182995
21. Teschendorff AE, Relton CL. Statistical and integrative system-level analysis of DNA methylation data. Nat Rev Genet. 2018;19(3):129. doi:10.1038/nrg.2017.86
22. Jung G, Hernández-Illán E, Moreira L, Balaguer F, Goel A. Epigenetics of colorectal cancer: biomarker and therapeutic potential. Nat Rev Gastroenterol Hepatol. 2020;17(2):111–130. doi:10.1038/s41575-019-0230-y
23. Iancu IV, Botezatu A, Plesa A, et al. Alterations of regulatory factors and DNA methylation pattern in thyroid cancer. Cancer Biomark. 2020;28(2):1–14.
24. Gào X, Zhang Y, Burwinkel B, et al. The associations of DNA methylation alterations in oxidative stress-related genes with cancer incidence and mortality outcomes: a population-based cohort study. Clin Epigenetics. 2019;11(1):1–9. doi:10.1186/s13148-018-0604-y
25. Knuutila S, Björkqvist A-M, Autio K, et al. DNA copy number amplifications in human neoplasms: review of comparative genomic hybridization studies. Am J Pathol. 1998;152(5):1107.
26. Brison O. Gene amplification and tumor progression. Biochim Biophys Acta Rev Cancer. 1993;1155(1):25–41. doi:10.1016/0304-419X(93)90020-D
27. He Y, Hu S, Zhong J, Cheng A, Shan N. Identification of significant genes signatures and prognostic biomarkers in cervical squamous carcinoma via bioinformatic data. PeerJ. 2020;8:e10386–e10386. doi:10.7717/peerj.10386
28. Ding H, Xiong -X-X, Fan G-L, et al. The new biomarker for cervical Squamous Cell Carcinoma and Endocervical Adenocarcinoma (CESC) based on public database mining. Biomed Res Int. 2020;2020:5478574. doi:10.1155/2020/5478574
29. Wang Z, Chen M, Qiu Y, et al. Identification of potential biomarkers associated with immune infiltration in the esophageal carcinoma tumor microenvironment. Biosci Rep. 2021;41(2). doi:10.1042/BSR20202439
30. Wang L, Li X, Zhao L, et al. Identification of DNA-repair-related five-gene signature to predict prognosis in patients with esophageal cancer. Pathol Oncol Res. 2021;27:25. doi:10.3389/pore.2021.596899
31. Jiang P, He S, Li Y, Xu Z. Identification of therapeutic and prognostic biomarkers of Lamin C (LAMC) family members in head and neck squamous cell carcinoma. Med Sci Monitor. 2020;26:e925735. doi:10.12659/MSM.925735
32. Dong Y, Lu S, Wang Z, Liu L. CCTs as new biomarkers for the prognosis of head and neck squamous cancer. Open Med. 2020;15(1):672–688. doi:10.1515/med-2020-0114
33. Li Y, Wu L, Tao W, Wu D, Ma F, Li N. Expression atlas of FGF and FGFR genes in pancancer uncovered predictive biomarkers for clinical trials of selective FGFR inhibitors. Biomed Res Int. 2020;2020:5658904.
34. Jiang M, Lin J, Xing H, et al. Microenvironment-related gene TNFSF13B predicts poor prognosis in kidney renal clear cell carcinoma. PeerJ. 2020;8:e9453. doi:10.7717/peerj.9453
35. Chen G, Wang Y, Wang L, Xu W. Identifying prognostic biomarkers based on aberrant DNA methylation in kidney renal clear cell carcinoma. Oncotarget. 2017;8(3):5268. doi:10.18632/oncotarget.14134
36. Deng M, Liang H, Hu K, et al. Novel prognostic markers for liver hepatocellular carcinoma and their roles in Immune infiltration of the tumor microenvironment; 2021.
37. Chen J, Yang J, Xu Q, et al. Integrated bioinformatics analysis identified MTHFD1L as a potential biomarker and correlated with immune infiltrates in hepatocellular carcinoma. Biosci Rep. 2021;41(2):BSR20202063. doi:10.1042/BSR20202063
38. Li J, Liu X, Cui Z, Han G. Comprehensive analysis of candidate diagnostic and prognostic biomarkers associated with lung adenocarcinoma. Med Sci Monitor. 2020;26:e922070–e922070.
39. Casey SC, Baylot V, Felsher DW. The MYC oncogene is a global regulator of the immune response. Blood. 2018;131(18):2007–2015. doi:10.1182/blood-2017-11-742577
40. Ghatalia P, Gordetsky J, Kuo F, et al. Correction to: prognostic impact of immune gene expression signature and tumor infiltrating immune cells in localized clear cell renal cell carcinoma. J Immunother Cancer. 2019;7(1):273.
 © 2021 The Author(s). This work is published and licensed by Dove Medical Press Limited. The
full terms of this license are available at https://www.dovepress.com/terms
and incorporate the Creative Commons Attribution
- Non Commercial (unported, 3.0) License.
By accessing the work you hereby accept the Terms. Non-commercial uses of the work are permitted
without any further permission from Dove Medical Press Limited, provided the work is properly
attributed. For permission for commercial use of this work, please see paragraphs 4.2 and 5 of our Terms.
© 2021 The Author(s). This work is published and licensed by Dove Medical Press Limited. The
full terms of this license are available at https://www.dovepress.com/terms
and incorporate the Creative Commons Attribution
- Non Commercial (unported, 3.0) License.
By accessing the work you hereby accept the Terms. Non-commercial uses of the work are permitted
without any further permission from Dove Medical Press Limited, provided the work is properly
attributed. For permission for commercial use of this work, please see paragraphs 4.2 and 5 of our Terms.