
Back to Journals » Diabetes, Metabolic Syndrome and Obesity » Volume 18
Multi-Omics Analysis and Nephroseq Database of Genes Related to Kidney Function in Diabetic Nephropathy Patients to Predict Potential Target Drugs
Authors Deng L, Yan F  , Feng C , Yang Q
Received 31 May 2025
Accepted for publication 29 August 2025
Published 6 October 2025 Volume 2025:18 Pages 3781—3794
DOI https://doi.org/10.2147/DMSO.S526696
Checked for plagiarism Yes
Review by Single anonymous peer review
Peer reviewer comments 2
Editor who approved publication: Dr Rebecca Baqiyyah Conway
Ling Deng, Feifan Yan, Changmei Feng, Qiong Yang
Department of Endocrinology, Nanxishan Hospital of Guangxi Zhuang Autonomous Region, Guilin, Guangxi, Zhuang Autonomous Region, 541002, People’s Republic of China
Correspondence: Qiong Yang, Department of Endocrinology Nanxishan Hospital of Guangxi Zhuang Autonomous Region, No. 96 Chongxin Road, Guilin, Guangxi Zhuang Autonomous Region, 541002, People’s Republic of China, Email [email protected]
Purpose: Diabetic nephropathy (DN), a major complication of type 2 diabetes and leading cause of end-stage renal disease, lacks complete molecular understanding. To elucidate the mechanisms underlying kidney injury in DN, we analyzed mRNA and protein expression changes in mouse kidney tissue, aiming to provide a theoretical foundation for drug development.
Methods: C57BL/6 mice were divided into two groups: a normal control group and a diabetes model group. The type 2 diabetes model was established using a high-fat diet (HFD) combined with streptozotocin (STZ). Fasting blood glucose levels and glucose tolerance tests were performed to evaluate glucose metabolism. Kidney tissues were collected, with the left kidney rapidly frozen in liquid nitrogen for transcriptomic and proteomic analyses, and the right kidney fixed in paraformaldehyde for subsequent preparation of paraffin-embedded blocks and staining.
Results: Diabetic nephropathy (DN) mice showed significant transcriptomic and proteomic alterations in kidney tissues compared to controls. Transcriptomic analysis revealed 4156 upregulated and 1121 downregulated genes, while proteomic analysis identified 887 differentially expressed proteins (DEPs: 687 upregulated, 200 downregulated). 240 genes were synchronously upregulated and 111 synchronously downregulated at both levels, functionally linked to cellular immunity, autophagy, inflammation, and lipid metabolism. CytoHubba identified 10 hub genes: FN1, TTR, APOA1, ITGB2, APOE, PTPRC, STAT3, VTN, ICAM1, and ANXA2. Nephroseq database analysis of human DN patients showed FN1, STAT3, ICAM1, and ANXA2 were significantly upregulated and APOA1 was significantly downregulated in kidney tissues. Furthermore, FN1, ICAM1, and ANXA2 negatively correlated with eGFR, while APOA1 positively correlated with eGFR.
Conclusion: Diabetic mice exhibited varying degrees of pathological changes in the kidneys. Combined transcriptomic and proteomic analyses highlighted four genes—FN1, ICAM1, ANXA2, and APOA1—as potential therapeutic targets for improving diabetic nephropathy.
Keywords: diabetic nephropathy, multi-omics analysis, transcriptomics, proteomics, kidney function, hub genes
Introduction
Diabetic nephropathy (DN) is a major cause of chronic kidney disease (CKD) and end-stage renal disease (ESRD), with approximately 40% of diabetic patients progressing to CKD or even ESRD.1 CKD is defined as structural or functional abnormalities of the kidney lasting for more than three months, impacting health, and meeting at least one of the following criteria: an estimated glomerular filtration rate (eGFR) < 60 mL/min/1.73 m2 or the presence of kidney damage markers, including proteinuria. Proteinuria is defined as >30 mg/g or persistent albuminuria (>300 mg/24 h) over three months or longer, regardless of eGFR.2 However, some patients progress to ESRD without evident proteinuria,3 accompanied by severe pathological changes such as renal tubular interstitial fibrosis. Thus, early detection and treatment of DN remain significant challenges.
Current treatments for DN primarily focus on strict glycemic and blood pressure control. Among these, glucose-lowering drugs such as glucagon-like peptide-1 receptor agonists (GLP-1RAs) and sodium-glucose cotransporter-2 inhibitors (SGLT2i) have been proven to delay CKD progression.4,5 However, these therapeutic strategies remain limited. Exploring the molecular mechanisms underlying DN can provide new insights into the development of more effective therapeutic strategies.
The pathogenesis of diabetic kidney disease (DKD) involves diverse pathophysiological processes: (1) glomerular hemodynamic disorders leading to hyperfiltration and hyperperfusion;6 (2) chronic low-grade inflammation7 and fibrotic progression;8 (3) metabolic abnormalities and epigenetic modifications;9 (4) gut microbiota dysbiosis and its nephrotoxic metabolites;10 and (5) progressive tubulointerstitial injury.11 These pathological processes are consistently accompanied by significant alterations in gene expression and protein composition within renal tissues.
With advancements in high-throughput technologies, transcriptomics and proteomics have become powerful tools for systematically characterizing molecular signatures in DKD. Recent integrated bioinformatics and machine learning approaches have identified key molecular features during DKD progression, including FN1, C1orf21, CD36, CD48, and SRPX2 as potential biomarkers for renal injury, with their correlation to GFR being validated through the Nephroseq database.12 Additional studies combining single-gene sequencing with Nephroseq analysis have proposed PROM1 and THY1 as fibrosis-related critical genes.13 Nevertheless, current research still faces several unresolved challenges: (1) Most studies rely on single-omics approaches, lacking integrative multi-omics analysis; (2) The predominant dependence on public datasets introduces inherent biases due to variations in sample composition, data acquisition protocols, and experimental conditions. To address these limitations, our study employs combined transcriptomic and proteomic analyses to characterize gene-protein expression profiles in renal tissues from diabetic murine models. Through bioinformatics screening, we aim to identify core differentially expressed molecules, followed by validation of their expression patterns and GFR correlations in human DKD using the Nephroseq database. These findings will provide crucial insights for elucidating DKD’s molecular mechanisms and discovering novel therapeutic targets.
Materials and Methods
Experimental Animals
Six-week-old male C57BL/6J mice (weighing 18–20 g) were purchased from Beijing Vital River Laboratory Animal Technology Co., Ltd. Mice were housed in standard specific pathogen-free (SPF) conditions with a controlled temperature of 26°C, humidity of 60%, and a 12-hour light/dark cycle. To ensure adequate activity space, 4–6 mice were housed per cage, with appropriately sized cages equipped with grid bars for climbing.
After a two-week acclimatization period, the mice were randomly divided into two groups: a normal control group (N=10) and a diabetes model group (N=40). The diabetic nephropathy group was induced by a combination of high-fat diet (HFD, 45% kcal fat, 35% kcal carbohydrate, 0.05% w/w cholesterol) for 12 weeks and intraperitoneal injection of streptozotocin (STZ, 50 mg/kg, freshly prepared in 0.1 mmol/L citrate buffer, pH 5.5) for five consecutive days starting in week 13. Fasting blood glucose levels were monitored twice at different time points one week after STZ injections. A fasting blood glucose level ≥16.7 mmol/L indicated successful diabetes modeling.14
The normal control group (NS, N=10) was fed a standard diet for 12 weeks, followed by intraperitoneal injections of the same volume of citrate buffer for five consecutive days starting in week 13. Fasting blood glucose was measured one week after injections.
All experimental protocols involving mice were approved by the Animal Ethics Committee of Guangxi Medical University, and experiments were performed based on the guidance on the use of laboratory animals from the National Institute of Health. Animal ethics review follows the Guiding Opinions on the Treatment of Laboratory Animals issued by the Ministry of Science and Technology of the People’s Republic of China and the Laboratory Animal-Guideline for Ethical Review of Animal Welfare issued by the National StandardGB/T35892-2018of the People’s Republic of China.
Blood Glucose Measurement
After fasting for six hours, blood glucose levels were measured from the tail vein using an ACCU-CHECK glucometer (Roche Diagnostics, Mannheim, Germany). Blood sampling involved disinfecting the tail with an alcohol swab, clipping approximately 1 mm from the tail tip with sterilized ophthalmic scissors, and discarding the first drop of blood. The second drop was used for measurement. After sampling, bleeding was stopped by pressing the tail with a sterile cotton ball for one minute.
Kidney Tissue Preparation
At the end of the intervention, the mice were anesthetized by intraperitoneal injection of 0.3% pentobarbital sodium.15 Once the mice reached the surgical depth of anesthesia (skin pinch reflex absent), they were dissected, and kidney tissues were collected. The tissues were stored at –80°C for subsequent analyses.
PAS Staining
The 4% paraformaldehyde (80096618, sinoreagent) fixed renal tissues were embedded in paraffin and sectioned at 2∼3 μm of thickness. Then, the sections were dewaxed, hydrated and oxidised by aqueous periodate. Next, the sections were stained with Schiff’s for 30 min and differentiated with 0.5% sodium thiosulfate aqueous solution (20039918, sinoreagent) twice. After washing with tap water, hematoxylin (H9627-25G, Sigma) stained the nuclei for 3 min and 1% hydrochloric acid (10011018, sinoreagent) was used for differentiation. After dehydration and transparency, the slices were sealed using neutral gum for histological analysis.
Masson Staining
The 4% paraformaldehyde (80096618, sinoreagent) fixed renal tissues were embedded in paraffin and sectioned at 2∼3 μm of thickness. Then, the sections were dewaxed, hydrated and stained with Masson Staining Kit (G1006, servicebio) according to the scheme for histological analysis. Collagen fibers were dyed blue, muscle fibers and red blood cells were dyed red, indicating the content of collagen fibers in renal tissue and the degree of fibrosis.
Proteomics Analysis
Sample Preparation
Kidney tissues stored at –80°C were ground into a fine powder under liquid nitrogen and transferred to pre-chilled centrifuge tubes. Sufficient SDT protein lysis buffer (4% SDS, 10 mM DTT, 100 mM TEAB) was added, followed by thorough mixing and ultrasonication in an ice bath for 5 minutes to ensure complete lysis. The samples were then incubated at 95°C for 8 minutes, centrifuged at 12,000 g for 15 minutes at 4°C, and the supernatant was collected. Sufficient IAM was added to the supernatant and incubated in the dark at room temperature for 1 hour. Protein was precipitated by adding 4 volumes of pre-chilled acetone and incubating at –20°C for at least 2 hours. The precipitate was collected by centrifugation at 12,000 g for 15 minutes at 4°C, washed with pre-chilled acetone, and air-dried. The precipitate was then dissolved in a protein dissolution buffer (8 M urea, 100 mM TEAB, pH=8.5).
Proteomic Analysis
For liquid chromatography-mass spectrometry (LC-MS) analysis, mobile phase A (100% water, 0.1% formic acid) and mobile phase B (100% acetonitrile, 0.1% formic acid) were prepared. Protein samples were dissolved in mobile phase A, centrifuged at 14,000 g for 20 minutes at 4°C, and the supernatant was injected into a nanoElute ultra-high-performance liquid chromatography (UHPLC) system. Protein separation was performed on a custom analytical column (15 cm × 100 μm, 1.9 μm), and MS analysis was conducted using a timsTOF pro2 mass spectrometer. Parameters included a spray voltage of 1.5 kV, a mass range of m/z 100–1700, and a ramp time of 100 ms. Raw mass spectrometry data were collected for further analysis.
Data Processing
Protein identification and quantification were performed using MaxQuant software (version 2.0.3.0, Bruker, Tims) against the Mus_musculus_uniprot_2022_9_5.fasta database, which contains 86,436 protein sequences. The protein quantitative results were statistically analyzed using a T-test to identify differentially expressed proteins (DEPs) between the experimental and control groups. DEPs were defined as proteins with significant differences in expression (p < 0.05) and a fold change threshold of |log2FC| > 1. Functional annotation of the identified proteins was performed using the InterProScan software, which includes multiple databases such as Pfam, PRINTS, ProDom, SMART, and ProSite, as well as the PANTHER database. Functional family and pathway analyses of the proteins were conducted using COG and KEGG databases. For the differentially expressed proteins (DEPs), volcano plots, clustering heatmaps, and pathway enrichment analyses (GO, IPR, and KEGG) were performed. Additionally, the STRING database was used to predict potential protein-protein interaction networks.
Data are available via ProteomeXchange with identifier PXD058790 (PRIDE website. Username: [email protected] Password: 7G0ZLO4ypP3H).
Transcriptomic Analysis
RNA Sequencing
Total RNA was isolated from mouse kidney tissues using Trizol reagent (Thermo Fisher Scientific, 15596018) in accordance with the manufacturer’s instructions. The integrity and quantity of RNA were assessed using an Agilent 2100 Bioanalyzer with the RNA 6000 Nano LabChip Kit (Agilent Technologies, 5067–1511). Only samples with RNA integrity number (RIN) > 7.0 were included for further library construction.
Polyadenylated mRNA was selectively captured from 5 μg of total RNA using Dynabeads Oligo(dT) beads (Thermo Fisher Scientific), followed by two rounds of purification. The mRNA was then fragmented at 94 °C for 5–7 minutes using the Magnesium RNA Fragmentation Module (NEB, E6150). Fragmented mRNA was reverse-transcribed into first-strand cDNA using SuperScript™ II Reverse Transcriptase (Invitrogen, 1896649), followed by second-strand synthesis using E. coli DNA Polymerase I (NEB, M0209), RNase H (NEB, M0297), and dUTP (Thermo Fisher, R0133).
The resulting double-stranded cDNA was end-repaired and A-tailed, and ligated with dual-index adapters containing T-overhangs. Size selection (~300 ± 50 bp) was performed using AMPure XP beads (Beckman Coulter). Following UDG (NEB, M0280) digestion to remove dU-containing strands, PCR amplification was carried out under the following conditions: 95 °C for 3 min; 8 cycles of 98 °C for 15s, 60 °C for 15s, and 72 °C for 30s; final extension at 72 °C for 5 min. Paired-end sequencing (2 × 150 bp) was conducted on an Illumina NovaSeq™ 6000 platform (LC-Bio Technology, Hangzhou, China).
Data are available via SRA database with identifier PRJNA1190353 (https://www.ncbi.nlm.nih.gov/sra/PRJNA1190353).
Bioinformatics Analysis
Initial raw reads were subjected to quality control to remove low-quality bases and contaminants. Adapter sequences, poly-A/G tails, reads containing more than 5% ambiguous nucleotides (N), and sequences with >20% of bases having a Q-score ≤20 were filtered using Cutadapt (version 1.9; https://cutadapt.readthedocs.io/). Quality metrics including Q20, Q30, and GC content were assessed using FastQC (version 0.11.9; https://www.bioinformatics.babraham.ac.uk/projects/fastqc/).
Clean reads were aligned to the Mus musculus reference genome using an appropriate aligner (eg, HISAT2 or STAR; tool version and parameters available upon request). Gene-level quantification was performed, and normalized expression data were used for differential gene expression analysis. Genes with |log2 fold change| ≥ 1 and adjusted p-value (FDR) < 0.05 were considered significantly differentially expressed.
Functional annotation of differentially expressed genes (DEGs) was conducted through Gene Ontology (GO) and Kyoto Encyclopedia of Genes and Genomes (KEGG) pathway enrichment analyses to identify relevant biological processes, molecular functions, and signaling pathways associated with diabetic kidney injury.
Statistical Analysis
Data were analyzed using SPSS 25.0 and GraphPad Prism 9. Normally distributed data were presented as mean ± standard deviation, and differences between groups were assessed using independent-sample t-tests or rank-sum tests, depending on distribution. A p-value < 0.05 was considered statistically significant.
Analysis of the Genes Expression in Kidney and Its Relationship with Renal Function in CKD
We extract the expression data of APOE, FN1, TTR, ITGB2, PTPRC from the Woroniecka Glom dataset in the Nephroseq v5 database (NephroSeq V5; http://v5.nephroseq.org), and the renal function data of CKD patients corresponding to GFR; For data that is not normally distributed, the Mann–Whitney test was used to compare the expression of related genes in CKD glomeruli and normal glomeruli; the expression data of ANXA2, ICAM1, APOA1, STAT3, VTN were extracted from the Woroniecka Diabetes TubInt dataset, and the renal function data of CKD patients corresponding to GFR were extracted. For data that is not normally distributed, the Mann-Whitney test was used to compare the expression of related genes in CKD tubulointerstitium and normal tubulointerstitium. Spearman correlation analysis was to analyze the correlation between gene expression and GFR.
Our study is exempt from approval based on national legislation guideline. According to Article 32 of the “Ethical Review Methods for Life Science and Medical Research Involving Human Subjects” issued by China on February 8, 2023, the following research activities can be exempted from ethical review if they do not cause harm to the human body, do not involve sensitive personal information or commercial interests.The use of human information data or biological samples for the following life science and medical research involving humans can be exempted from ethical review to reduce unnecessary burdens on and promote the conduct of life science and medical research involving humans.
Results
Proteomics Analysis
As shown in Figure 1A, after 12 weeks of a high-fat diet and 5 days of streptozotocin intervention, diabetic mice showed no significant difference in body weight compared to the normal control group (DN: 35.53 ± 2.57 g; NC: 28.8 ± 1.72 g, P=0.145). However, fasting blood glucose levels were significantly higher in the diabetic group compared to the control group (DN: 19.41 ± 3.77 mmol/L; NC: 7.13 ± 1.46 mmol/L, P<0.05) (Figure 1B), indicating successful establishment of the diabetic mouse model.
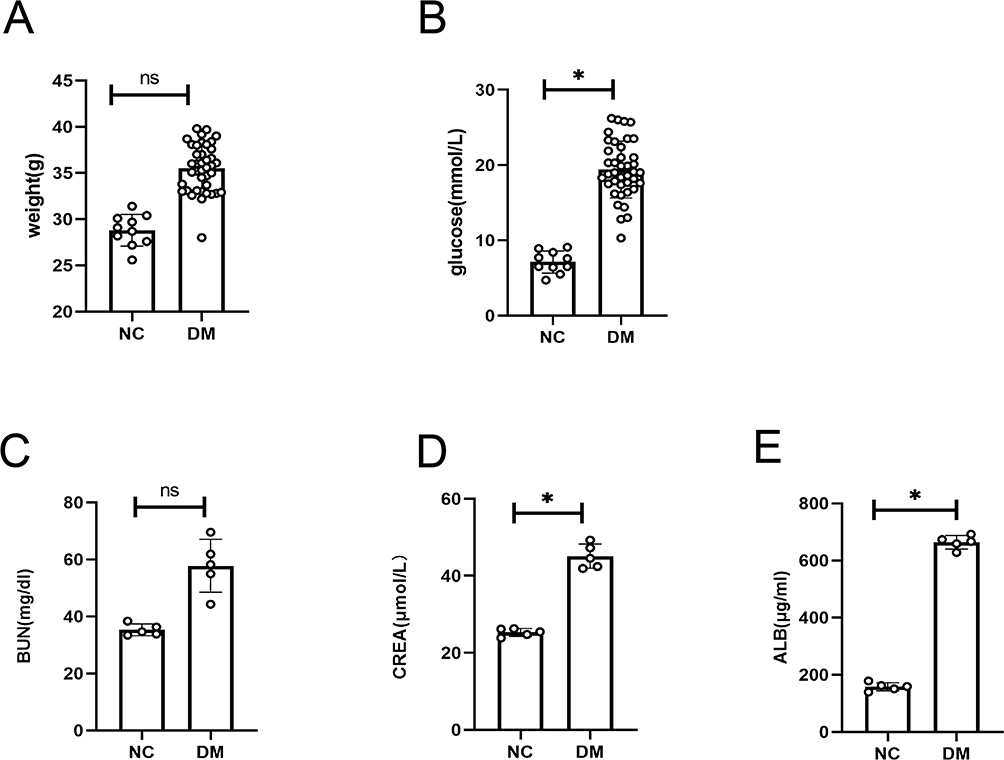 |
Figure 1 Kidney injury in diabetic mice. Notes: (A) Comparison of body weight between the two groups of mice. (B) Comparison of fasting blood glucose levels between the two groups of mice. (C) Serum urea nitrogen levels in the two groups of mice. (D) Serum creatinine levels in the two groups of mice. (E) Urinary albumin levels in the two groups of mice. ns: P>0.05; *P<0.05. |
Furthermore, diabetic mice exhibited elevated levels of serum urea nitrogen, serum creatinine, and urinary albumin compared to the control group, with significant increases in serum creatinine and urinary albumin levels (Figure 1C–E). These findings suggest that kidney injury occurred in diabetic mice following 12 weeks of a high-fat diet and 5 days of streptozotocin intervention.
Pathological Changes in the Kidneys of Diabetic Mice
Histopathological analysis was performed to further confirm kidney injury in the two groups of mice. Periodic acid-Schiff (PAS) staining revealed significant pathological changes in the kidneys of diabetic mice, including tubular dilation (indicated by blue arrows) and glomerular basement membrane (GBM) thickening (indicated by black arrows) (Figure 2A).
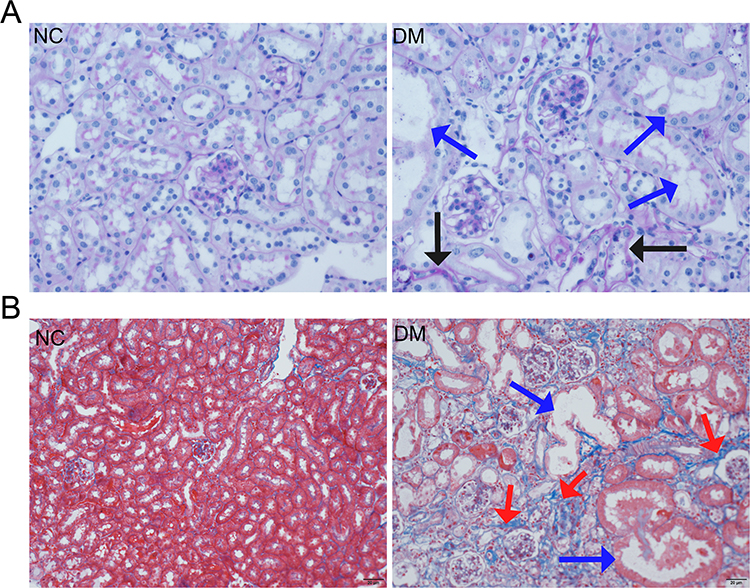 |
Figure 2 Histopathological staining of kidney tissues in mice. Notes: (A) PAS staining of kidney tissues from the two groups. Blue arrows indicate dilated renal tubules, and black arrows indicate thickened basement membranes. (B) Masson staining of kidney tissues from the two groups. Blue arrows indicate dilated renal tubules, and red arrows indicate fibrotic tissue with positive staining in blue, suggesting significant fibrosis in the kidneys of diabetic mice. |
Masson staining demonstrated severe renal fibrosis in the diabetic mice, with positive staining for fibrotic tissue shown in blue (indicated by red arrows) (Figure 2B).
Transcriptomic Changes and Analysis in Kidney Tissues of Diabetic Mice
Compared to the normal control group, 4156 upregulated genes and 1121 downregulated genes were identified in the kidney tissues of diabetic nephropathy mice (Figure 3A). The selection criteria for differentially expressed genes (DEGs) were |log2FC| ≥ 1 and q-value < 0.05.
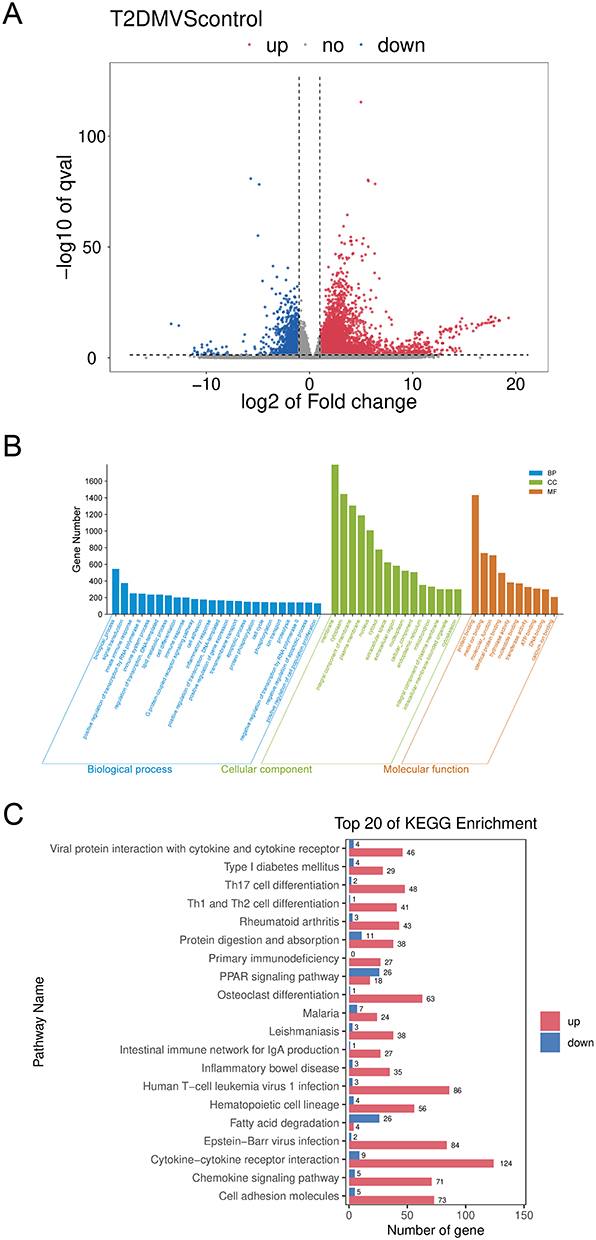 |
Figure 3 Gene expression analysis in kidney tissues of diabetic mice. Notes: (A) Heatmap of differentially expressed genes (DEGs) in kidney tissues. (B) Bar chart of Gene Ontology (GO) enrichment analysis for DEGs. (C) Bar chart showing the top 10 enriched KEGG pathways for DEGs. |
Gene Ontology (GO) analysis revealed that the altered genes were associated with cellular immune responses, autophagy, inflammatory responses, and lipid metabolism (Figure 3B). KEGG pathway analysis indicated significant enrichment of the DEGs in pathways such as cytokine-cytokine receptor interaction, hematopoietic cell lineage, cell adhesion molecules, osteoclast differentiation, inflammatory bowel disease, leishmaniasis, primary immunodeficiency, viral protein interaction with cytokines and cytokine receptors, and rheumatoid arthritis (Figure 3C).
Proteomic Changes in Kidney Tissues of Diabetic Mice
To validate the transcriptomic results and assess protein expression in kidney tissues, label-free quantification (LFQ) proteomics was conducted on six samples (three from each group). A total of 5124 quantifiable proteins were identified, each containing at least one unique peptide and validated with a false discovery rate (FDR) of less than 1%.
Principal component analysis (PCA) indicated clear differences in overall protein expression between the two groups, as well as variation within the groups. Based on the criteria of a fold change greater than 1.5 or less than 0.67 and a p-value < 0.05, 887 differentially expressed proteins (DEPs) were identified, including 687 significantly upregulated proteins and 200 significantly downregulated proteins in the diabetic group (Figure 4A).
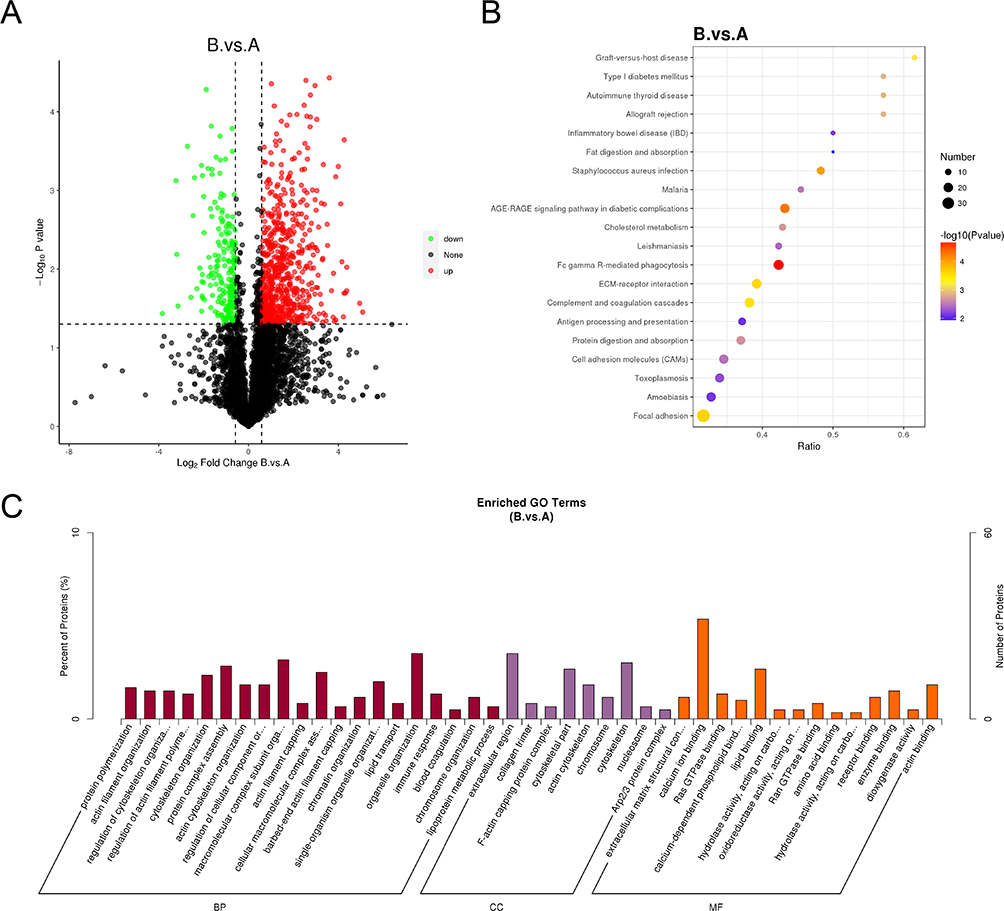 |
Figure 4 Protein expression analysis in kidney tissues of diabetic mice. Notes: (A) Heatmap of differentially expressed proteins (DEPs). (B) Bubble plot of KEGG pathway enrichment analysis for DEPs. (C) Bar chart of Gene Ontology (GO) enrichment analysis for DEPs. (Group (A) control group; Group (B) diabetic group). |
GO and KEGG enrichment analyses revealed that the altered proteins were associated with pathways such as cholesterol metabolism, the SGE-RAGE signaling pathway, and processes related to digestion and absorption of lipids (Figure 4B and C).
Integrated Transcriptomic and Proteomic Analysis
Proteins are the primary executors of cellular functions and serve as the translation products of mRNA, carrying out specific biological roles. Based on the relationship between mRNA and protein translation, we integrated transcriptomic and proteomic data to identify genes with consistent changes at both the mRNA and protein levels, thereby narrowing down potential functional targets.
Venn diagram analysis revealed 240 genes that were synchronously upregulated and 111 genes that were synchronously downregulated in kidney tissues (Figure 5A and B). Using the STRING online tool, a protein-protein interaction network of overlapping genes was constructed, and the CytoHubba plugin in Cytoscape software was applied to identify the top 10 hub genes based on degree centrality (Figure 5C). These hub genes included FN1, TTR, APOA1, ITGB2, APOE, PTPRC, STAT3, VTN, ICAM1, and ANXA2.
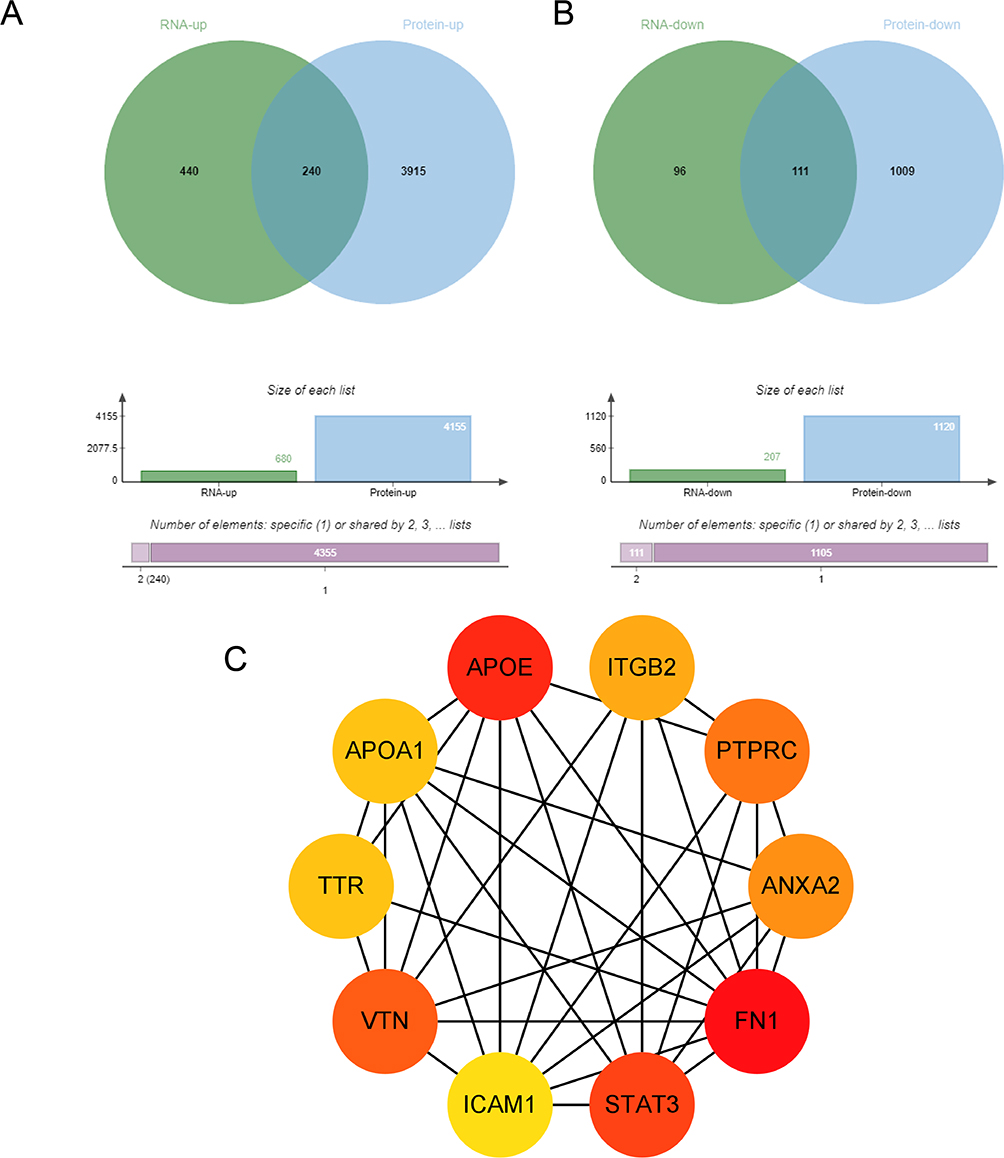 |
Figure 5 Integrated transcriptomic and proteomic analysis of kidney tissues in diabetic mice. Notes: (A) Venn diagram showing synchronously upregulated genes. (B) Venn diagram showing synchronously downregulated genes. (C) Protein-protein interaction network of overlapping genes analyzed using the CytoHubba plugin, highlighting the top 10 hub genes. |
Correlation Analysis of Core Genes and Kidney Function
Compared to the control participants, FN1, STAT3, ICAM1, and ANXA2 were significantly upregulated in the kidney tissues of diabetic nephropathy (DN) patients, while APOA1 was significantly downregulated (Figure 6A). Correlation analysis showed that FN1, ICAM1, and ANXA2 were negatively correlated with eGFR in DN patients, whereas APOA1 was positively correlated with eGFR (Figure 6B). These results were obtained using the Nephroseq v5 database (http://v5.nephroseq.org).
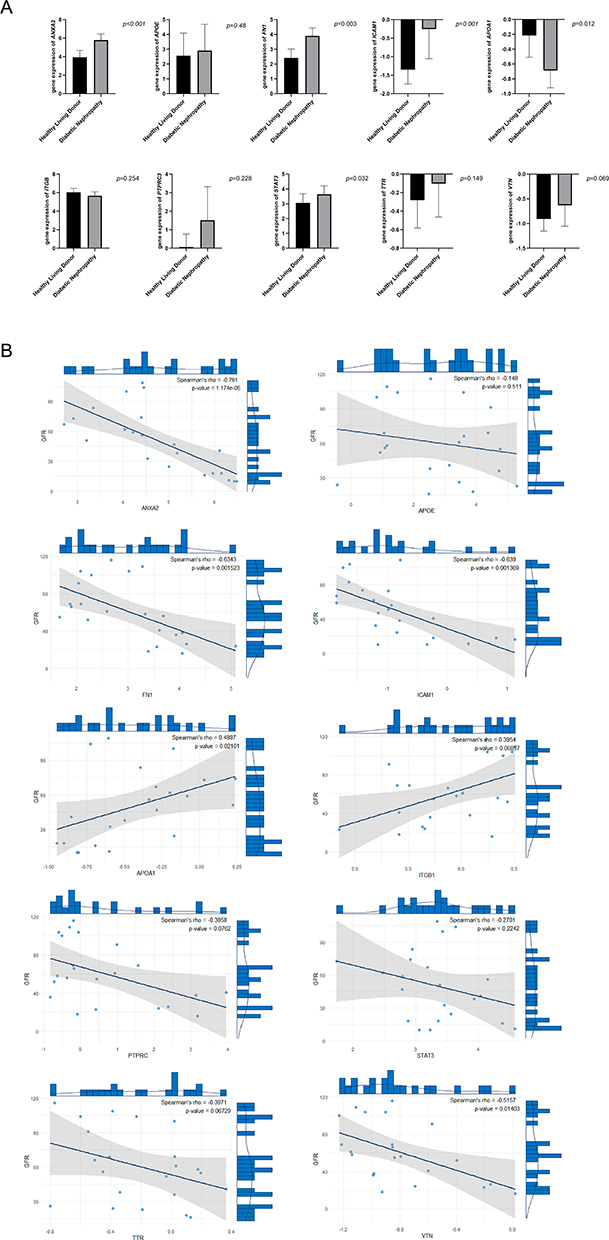 |
Figure 6 Correlation analysis between core genes and eGFR in diabetic nephropathy patients. Notes: (A) Expression levels of core genes in kidney tissues of control participants and diabetic nephropathy (DN) patients. (B) Correlation between core gene expression levels and eGFR in DN patients. |
Discussion
Diabetic nephropathy is one of the common chronic complications in diabetic patients and the leading cause of end-stage renal disease worldwide.16 In this study, by integrating transcriptomics and proteomics analyses, combined with the kidney gene database, four key differentially expressed molecules: FN1, APOA1, ICAM1, ANXA2 were systematically identified. The expression changes of these molecules are closely related to the characteristic changes of diabetic nephropathy, including thickening of glomerular basement membrane expansion of mesangial matrix and obvious tubulointerstitial fibrosis. Combined with the existing research evidence and our new findings, these molecules may promote the occurrence and development of nephropathy through a complex interaction network.
FN1 (Fibronectin 1) is a critical glycoprotein for cell adhesion, migration, and tissue repair, serving as a key component of the glomerular extracellular matrix.17 Our study demonstrates that FN1 expression is significantly upregulated in the renal tissues of diabetic nephropathy (DN) mice, showing a strong positive correlation with the degree of renal fibrosis. This finding aligns with FN1’s established role in the pathogenesis of various fibrotic disorders. In the diabetic milieu, FN1 likely promotes renal fibrosis by activating the TGF-β signaling pathway and stimulating myofibroblast activation.18 These observations suggest that FN1 overexpression not only directly contributes to extracellular matrix (ECM) deposition but may also exacerbate tissue remodeling by altering the biomechanical properties of the kidney.
ICAM1 (Intercellular Adhesion Molecule 1) is a cell surface glycoprotein predominantly expressed in endothelial cells and immune system leukocytes.19 Compared to FN1, ICAM1 has been more extensively studied in the context of diabetic nephropathy (DN). A genome-wide scan and linkage analysis identified the 19p13 chromosomal locus, which harbors ICAM1 among other candidate genes, as being associated with type 1 diabetes mellitus (T1DM), particularly in relation to albumin-to-creatinine ratio (ACR), cholesterol, and triglyceride metabolic pathways.20 Numerous studies have established a strong correlation between ICAM1 gene polymorphisms and DN susceptibility. Functionally, ICAM1 serves as a ligand for integrin receptors, primarily facilitating leukocyte-endothelial cell adhesion and signal transduction.21 Multi-omics analyses further revealed its cell-specific upregulation in endothelial cells and activated proximal tubular epithelial cells.22 These findings suggest that ICAM1 may contribute to DN progression by promoting inflammatory cell infiltration and sustaining a pro-inflammatory microenvironment in renal tissues. Moreover, its synergistic interaction with FN1 likely establishes a self-perpetuating “inflammation-fibrosis vicious cycle”, which could serve as a critical driver of chronic kidney injury in diabetes.
Annexin A2 (ANXA2) is a calcium-dependent phospholipid-binding protein belonging to the annexin family. Predominantly localized at the cell membrane, ANXA2 exists in both heterotetrameric and monomeric forms, and is produced by diverse cell types including trophoblasts, epithelial cells, dendritic cells, tumor cells, macrophages, and monocytes. Beyond its role in maintaining cell surface proteolytic activity, ANXA2 participates in multiple intracellular processes such as membrane repair, exocytosis, endocytosis,23 and the maintenance of adherens-like cell-cell junctions.24 These multifunctional properties enable ANXA2 to contribute to fibrinolysis, modulation of inflammatory and immune responses, as well as tissue damage and repair. Emerging evidence has established ANXA2 as a mediator of fibrotic processes across organs. For instance: A: In hepatocytes, the ANXA2-Notch regulatory axis promotes hepatic fibrosis by upregulating osteopontin expression.25 B: Pharmacological inhibition of ANXA2 attenuates alcohol-induced liver fibrosis.26 C: The ANXA2-EGFR signaling pathway has been identified as a therapeutic target in bleomycin-induced pulmonary fibrosis.27 Our study reveals that ANXA2 interacts closely with multiple fibrosis-associated proteins, positioning it as a hub molecule within renal fibrotic networks. In kidney diseases, ANXA2 may drive pathology through several mechanisms:
1. Proliferative/regenerative responses: Elevated ANXA2 correlates with aberrant cell proliferation and complement system activation.
2. Pro-inflammatory effects: Sustained ANXA2 overexpression exacerbates inflammation and promotes autoantibody-mediated renal injury.
3. Prognostic utility: ANXA2 serves as a potential biomarker for predicting outcomes in chronic glomerulopathies and renal cell carcinoma.
4. Calcification: ANXA2 participates in calcium-dependent pathways linked to nephrolithiasis.
These findings nominate ANXA2 as a promising therapeutic target for chronic kidney disease. Notably, our data suggest that ANXA2 and FN1 may synergistically promote extracellular matrix deposition and renal fibrosis, offering new insights into the molecular drivers of diabetic nephropathy progression.
In terms of metabolic regulation, APOA1 was significantly downregulated in the renal tissue of diabetic nephropathy patients. Combined with NephroSeq data it showed a strong positive correlation with eGFR in diabetic nephropathy patients. As the major structural component of high-density lipoprotein (HDL), APOA1 plays multifaceted roles in lipid metabolism and inflammation regulation. In diabetic mice, reduced APOA1 expression impairs HDL biogenesis, disrupts reverse cholesterol transport, and exacerbates oxidative stress and inflammation, leading to lipid accumulation in mesangial cells and proximal tubules. These metabolic disturbances promote glomerulosclerosis, tubular dysfunction, and increase the risk of atherosclerosis and DN progression.28 Our findings not only reinforce the critical role of dyslipidemia in DN pathogenesis but also suggest that APOA1 deficiency may compromise renal protection by impairing cholesterol efflux and antioxidative capacity. The resultant lipid metabolic dysfunction and heightened oxidative stress likely contribute to progressive kidney injury.
Conclusion
This study provides valuable insights into the molecular mechanisms underlying DN and highlights FN1, ICAM1, ANXA2, and APOA1 as promising therapeutic targets. However, several limitations should be noted. First, our findings are based on transcriptomic and proteomic analyses, which require further validation through functional studies. Second, the cross-sectional nature of the study limits our ability to establish causal relationships between gene expression and DN progression. Third, the sample size of DN patients used for validation was relatively small, necessitating larger cohort studies to confirm our findings.
Acknowledgments
Thank you to the Nephroseq database for providing the glomerular filtration rate data for healthy individuals and diabetic patients.
Disclosure
The authors report no conflicts of interest in this work.
References
1. Umanath K, Lewis JB. Update on diabetic nephropathy: core curriculum 2018. Am J Kidney Dis. 2018;71(6):884–895. doi:10.1053/j.ajkd.2017.10.026
2. Lameire NH, Levin A, Kellum JA, et al. Harmonizing acute and chronic kidney disease definition and classification: report of a kidney disease: improving global outcomes (KDIGO) consensus conference. Kidney Int. 2021;100(3):516–526. doi:10.1016/j.kint.2021.06.028
3. Mottl AK, Kwon KS, Mauer M, Mayer-Davis EJ, Hogan SL, Kshirsagar AV. Normoalbuminuric diabetic kidney disease in the U.S. population. J Diabet Complicat. 2013;27(2):123–127. doi:10.1016/j.jdiacomp.2012.09.010
4. Neuen BL, Heerspink HJL, Vart P, et al. Estimated lifetime cardiovascular, kidney, and mortality benefits of combination treatment with SGLT2 inhibitors, GLP-1 receptor agonists, and nonsteroidal MRA compared with conventional care in patients with type 2 diabetes and albuminuria. Circulation. 2024;149(6):450–462. doi:10.1161/CIRCULATIONAHA.123.067584
5. Li R, She D, Ye Z, et al. Glucagon-like peptide 1 receptor agonist improves renal tubular damage in mice with diabetic kidney disease. Diab Metab Syndrome Obes. 2022;15:1331–1345. doi:10.2147/DMSO.S353717
6. Tonneijck L, Muskiet MH, Smits MM, et al. Glomerular hyperfiltration in diabetes: mechanisms, clinical significance, and treatment. J Am Soc Nephrol. 2017;28(4):1023–1039. doi:10.1681/ASN.2016060666
7. Mitrofanova A, Fontanella AM, Merscher S, Fornoni A. Lipid deposition and metaflammation in diabetic kidney disease. Curr Opin Pharmacol. 2020;55:60–72. doi:10.1016/j.coph.2020.09.004
8. Chen Y, Zou H, Lu H, Xiang H, Chen S. Research progress of endothelial-mesenchymal transition in diabetic kidney disease. J Cell Mol Med. 2022;26(12):3313–3322. doi:10.1111/jcmm.17356
9. Kato M, Natarajan R. Epigenetics and epigenomics in diabetic kidney disease and metabolic memory. Nat Rev Nephrol. 2019;15(6):327–345. doi:10.1038/s41581-019-0135-6
10. Wang Y, Zhao J, Qin Y, et al. The specific alteration of gut microbiota in diabetic kidney diseases-a systematic review and meta-analysis. Front Immunol. 2022;13:908219. doi:10.3389/fimmu.2022.908219
11. Gilbert RE. Proximal tubulopathy: prime mover and key therapeutic target in diabetic kidney disease. Diabetes. 2017;66(4):791–800. doi:10.2337/db16-0796
12. Li L, Tao M, Gao X, et al. Uncovering key markers and therapeutic targets for renal fibrosis in diabetic kidney disease through bulk and single-cell RNA sequencing. J Transl Med. 2025;23(1):742. doi:10.1186/s12967-025-06554-8
13. Zhang L, Sun Z, Yuan Y, Sheng J. Integrating bioinformatics and machine learning to identify glomerular injury genes and predict drug targets in diabetic nephropathy. Sci Rep. 2025;15(1):16868. doi:10.1038/s41598-025-01628-5
14. Sun L, Yang Z, Zhao W, et al. Integrated lipidomics, transcriptomics and network pharmacology analysis to reveal the mechanisms of Danggui Buxue Decoction in the treatment of diabetic nephropathy in type 2 diabetes mellitus. J Ethnopharmacol. 2022;283:114699. doi:10.1016/j.jep.2021.114699
15. Deng L, Mo MQ, Zhong J, Li Z, Li G, Liang Y. Iron overload induces islet β cell ferroptosis by activating ASK1/P-P38/CHOP signaling pathway. PeerJ. 2023;11:e15206. doi:10.7717/peerj.15206
16. Selby NM, Taal MW. An updated overview of diabetic nephropathy: diagnosis, prognosis, treatment goals and latest guidelines. Diab Obes Metab. 2020;22 Suppl 1:3–15. doi:10.1111/dom.14007
17. Adeva-Andany MM, Carneiro-Freire N. Biochemical composition of the glomerular extracellular matrix in patients with diabetic kidney disease. World J Diab. 2022;13(7):498–520. doi:10.4239/wjd.v13.i7.498
18. Tian L, Yu Q, Zhang L, Zhang J. Accelerated fibrosis progression of diabetic nephropathy from high uric acid’s activation of the ROS/NLRP3/SHP2 pathway in renal tubular epithelial cells under high glucose conditions. Alternative Therap Health Med. 2024;3:179.
19. Gu HF, Ma J, Gu KT, Brismar K. Association of intercellular adhesion molecule 1 (ICAM1) with diabetes and diabetic nephropathy. Front Endocrinol. 2012;3:179. doi:10.3389/fendo.2012.00179
20. Kathiresan S, Melander O, Guiducci C, et al. Six new loci associated with blood low-density lipoprotein cholesterol, high-density lipoprotein cholesterol or triglycerides in humans. Nature Genet. 2008;40(2):189–197. doi:10.1038/ng.75
21. Mueller PW, Rogus JJ, Cleary PA, et al. Genetics of kidneys in diabetes (GoKinD) study: a genetics collection available for identifying genetic susceptibility factors for diabetic nephropathy in type 1 diabetes. J Am Soc Nephrol. 2006;17(7):1782–1790. doi:10.1681/ASN.2005080822
22. Reck M, Baird DP, Veizades S, et al. Multiomic analysis of human kidney disease identifies a tractable inflammatory and pro-fibrotic tubular cell phenotype. Nat Commun. 2025;16(1):4745. doi:10.1038/s41467-025-59997-4
23. Luo M, Hajjar KA. Annexin A2 system in human biology: cell surface and beyond. Semin Thromb Hemost. 2013;39(4):338–346. doi:10.1055/s-0033-1334143
24. Luo M, Flood EC, Almeida D, et al. Annexin A2 supports pulmonary microvascular integrity by linking vascular endothelial cadherin and protein tyrosine phosphatases. J Exp Med. 2017;214(9):2535–2545. doi:10.1084/jem.20160652
25. Wang G, Duan J, Pu G, et al. The Annexin A2-Notch regulatory loop in hepatocytes promotes liver fibrosis in NAFLD by increasing osteopontin expression. Biochim Biophys Acta Mol Basis Dis. 2022;1868(8):166413. doi:10.1016/j.bbadis.2022.166413
26. Liu N, Jiang M, Liu M, et al. Isoliquiritigenin alleviates the development of alcoholic liver fibrosis by inhibiting ANXA2. Biomed Pharmacothe. 2023;159:114173. doi:10.1016/j.biopha.2022.114173
27. Sangamesh VC, Alagundagi DB, Jayaswamy PK, Kuriakose N, Shetty P. Targeting AnxA2-EGFR signaling: hydroxychloroquine as a therapeutic strategy for bleomycin-induced pulmonary fibrosis. Naunyn-Schmiedeberg’s Arch Pharmacol. 2024;398:2015–2026. doi:10.1007/s00210-024-03417-9
28. Liu K, Cooper ME, Chai Z, Liu F. High-density lipoprotein in patients with diabetic kidney disease: friend or foe? Int J Mol Sci. 2025;26(4):1683.
 © 2025 The Author(s). This work is published and licensed by Dove Medical Press Limited. The
full terms of this license are available at https://www.dovepress.com/terms
and incorporate the Creative Commons Attribution
- Non Commercial (unported, 4.0) License.
By accessing the work you hereby accept the Terms. Non-commercial uses of the work are permitted
without any further permission from Dove Medical Press Limited, provided the work is properly
attributed. For permission for commercial use of this work, please see paragraphs 4.2 and 5 of our Terms.
© 2025 The Author(s). This work is published and licensed by Dove Medical Press Limited. The
full terms of this license are available at https://www.dovepress.com/terms
and incorporate the Creative Commons Attribution
- Non Commercial (unported, 4.0) License.
By accessing the work you hereby accept the Terms. Non-commercial uses of the work are permitted
without any further permission from Dove Medical Press Limited, provided the work is properly
attributed. For permission for commercial use of this work, please see paragraphs 4.2 and 5 of our Terms.