Back to Journals » International Journal of General Medicine » Volume 9
Multi-ethnic differences in HbA1c, blood pressure, and low-density-lipid cholesterol control among South Africans living with type 2 diabetes after a 4-year follow-up
Authors Pinchevsky Y ![]() , Shukla VJ, Butkow N, Chirwa T
, Shukla VJ, Butkow N, Chirwa T ![]() , Raal F
, Raal F ![]()
Received 17 August 2016
Accepted for publication 17 September 2016
Published 16 November 2016 Volume 2016:9 Pages 419—426
DOI https://doi.org/10.2147/IJGM.S119965
Checked for plagiarism Yes
Review by Single anonymous peer review
Peer reviewer comments 2
Editor who approved publication: Dr Scott Fraser
Yacob Pinchevsky,1 Varada J Shukla,1 Neil Butkow,1 Tobias Chirwa,2 Frederick Raal3
1Department of Pharmacy and Pharmacology, School of Therapeutic Sciences, 2Division of Epidemiology and Biostatistics, School of Public Health, 3Carbohydrate and Lipid Metabolism Research Unit, Division of Endocrinology and Metabolism, Faculty of Health Sciences, University of the Witwatersrand, Johannesburg, South Africa
Purpose: Our study set out to examine if disparities in control of glycated hemoglobin (HbA1c), blood pressure (BP), and low-density-lipoprotein cholesterol (LDL-C) existed among an urban multi-ethnic cohort of South Africans, living with type 2 diabetes mellitus (T2DM).
Patients and methods: This longitudinal, retrospective study consisted of 261 men and women with previously diagnosed T2DM who attended Charlotte Maxeke Johannesburg Academic Hospital, South Africa across two time periods 2009 and 2013. Demographic and clinical data were extracted from consecutive medical records. The primary outcome was to determine achievements in HbA1c, BP, and LDL-C among ethnic groups using evidence-based goals.
Results: The mean age of the cohort was 64 (±10.6) years, females represented 55%, and the self-reported diabetes duration was 16 (±10.6) years as at 2013. Black Africans (42.9%, n=112 of 261) were more likely to reach the HbA1c target (<7%) and less likely to have had retinopathy, nephropathy, or cardiovascular disease. Over two-thirds of mixed-ancestry patients attained the BP target (<140/80 mmHg), while 90.2% of Caucasians achieved LDL-C goals (<2.5 mmol/L). Overall, across the ethnic groups studied, we found that HbA1c control deteriorated over time, although BP levels remained the same and LDL-C levels drastically improved.
Conclusion: There was poor control of HbA1c, BP, and LDL-C across all ethnic groups. Although a minority achieved recommended targets, some ethnic groups appeared to have worse control than others. Timely aggressive actions in particularly high-risk ethnic groups will prevent/delay the complications commonly associated with T2DM.
Keywords: diabetes mellitus, ethnicity, HbA1c, blood pressure, LDL-C
Introduction
Africa was once considered “one of the social environments that is kindest to the human cardiovascular system”.1 Some tribes of South Africa (eg, Xhosa and San tribe Bushmen) lived in the desert as hunter-gatherers where diets consisted of game or wild vegetation, long distances were walked, and blood pressure (BP) remained unaffected by the aging process.2,3 Today, however, urbanization and modern stresses have resulted in diseases of lifestyle, such as type 2 diabetes mellitus (T2DM), in terms of both “prevalence and number of adults affected, has increased faster in low-income or middle-income countries than in high-income countries”.4 Among the estimated 55 million inhabitants living in South Africa in 2015, Black Africans accounted for 80.5%, mixed ancestry 8.8%, Caucasian 8.3%, and Asian/Indian 2.5% of the population, with prevalence rates of T2DM as high as 8%, 28.7%, 3%, and 13%, respectively.5–10
Patients with T2DM have an increased risk of developing cardiovascular disease (CVD), as well as microvascular complications that manifest clinically as retinopathy, neuropathy, and nephropathy.11,12 In order to minimize these diabetes-related micro-and macrovascular complications, guidelines from the Society of Endocrinology, Metabolism and Diabetes of South Africa (SEMDSA) advocate that most adults with T2DM should maintain glycated hemoglobin A1c (HbA1c) <7%, BP <140/80 mmHg and low-density-lipoprotein cholesterol (LDL-C) <2.5 mmol/L.13 However, many patients with T2DM still do not achieve these evidence-based goals, leading to a disproportionate burden of disease.14
In addition, several South African population-based studies have reported ethnicity-related disparities in diabetes-related outcomes.7–9,15 Ethnic groups differ in their risk of developing morbidity and mortality associated with T2DM, which may potentially suggest that further aggressive action of modifiable risk factors in particular ethnic groups may be warranted.
In light of the aforementioned SEMDSA guideline recommendations and the ethnic diabetes differences previously reported,7–9,15 we performed an analysis to understand if a relationship between ethnicity and the disparities of control of three critical risk factors (HbA1c, BP, and LDL-C) exist in an urban multi-ethnic cohort of people with T2DM. We also sought to examine patient characteristics and treatments associated with better or worse control of critical risk factors within a public sector cohort over two time periods (2009 and 2013).
Patients and methods
The present study was based on a previously conducted longitudinal study consisting of 261 men and women with previously diagnosed T2DM across two time periods: 2009 and 2013. Detailed methods of the study have been reported previously.16 Briefly, the study’s inclusion criteria consisted of consecutive patients deemed to have been diagnosed with T2DM and attending the diabetes clinic within the Charlotte Maxeke Johannesburg Academic Hospital (CMJAH), South Africa. Patients were defined as having had T2DM if they were being treated on specific clinic days dedicated to the treatment of T2DM at the hospital’s diabetes clinic, there were physician notes detailing the diagnosis of T2DM, or a prescription with diabetes medication such as oral hypoglycemic agents or insulin (or combinations of both) were found to have been prescribed. Patient records were first reviewed in July 2009, with the follow-up study occurring 4 years later (2013). Descriptive data, such as demographics, clinical characteristics, and pharmacological treatment, were collected from consecutive T2DM patient records over the two time points. As CMJAH is a tertiary-based public sector facility, an estimation of the annual patient attendance at CMJAH’s diabetes clinic was thought to be approximately 3,600 T2DM patients. The self-identified ethnicities of patients were found in records, and as such our study consisted of the following groups: Black African, Caucasian, Asian/Indian, and mixed ancestry. The study’s exclusion criteria consisted of patients <18 years of age, type 1 diabetes mellitus (T1DM), gestational diabetes, steroid-induced diabetes, chronic pancreatitis that had led to secondary diabetes, or patients lost to follow-up.
In the initial 2009 study, a total of 782 records were reviewed. From these, the following exclusions were made: 109 patients with T1DM, one patient with gestational diabetes, one with steroid-induced diabetes, and five patients found to have had anomalous triglyceride levels, which resulted in a final cohort size of 666. There was a 60% patient loss to follow-up after the 4 year period, resulting in 261 T2DM patients in the 2013 study.16 The 261 patients by ethnicity consisted of 112 Black Africans, 66 Caucasians, 68 Asian/Indians, and the unfortunately smaller mixed-ancestry group, which consisted of 15 T2DM patients. For the present study, we included all the patients who were followed-up in the 2013 study,16 in order to analyze their data based on their ethnic groupings. Weight, height, waist circumference, diet details, hypoglycemia rates, and smoking status were not available in patient records. Therefore, neither body mass index calculations nor classification of metabolic syndrome were possible. It is important to note that complications at this low-resource setting are often diagnosed through “bedside” questioning and examination of patients. Neuropathy is not diagnosed through electrophysiological studies, but rather using microfilaments. Retinopathy is not diagnosed using fundus photography, and nephropathy is detected through urine creatinine or microalbuminuria. For the purposes of this study, patients deemed as having nephropathy had any of the following variations in their medical records: chronic kidney disease, chronic renal disease, chronic renal failure, and diabetic nephropathy. Standardized procedures/techniques were implemented to draw patient blood for analysis at CMJAH’s laboratory (for both time points with the same machines). HbA1c was determined using the Tina-Quant hemoglobin A1c II immunological assay. Using a P800 modular analyzer system (Hoffman-La Roche Ltd, Basel, Switzerland), direct and colorimetric enzymatic methods were utilized for determining total cholesterol/high-density-lipoprotein cholesterol and triglycerides, respectively. LDL-C was calculated from the Friedewald equation. Achievement of targets/control of modifiable risk factors was determined by applying the 2012 diabetes guidelines (SEMDSA) to the extracted patient-record data as follows: HbA1c <7%, systolic BP (SBP) cutoff <140 mmHg, diastolic BP (DBP) cutoff <80 mmHg, and LDL-C <2.5 mmol/L (1.8 mmol/L for those [n=65] with existing vascular disease). All captured data were stored securely on the university’s database. Continuous variables, such as age, HbA1c, BP, and fasting lipids, are expressed as mean summary measures and standard deviation. The percentage of patients reaching SEMDSA treatment goals for HbA1c, BP, and LDL-C was calculated based on weightings (by total number of patients) across each ethnic group. To assess differences in control of risk factors between categorical variables (eg, treatment, coronary artery disease, stroke, retinopathy, neuropathy, and nephropathy), the c2 test was employed when appropriate. A significance level of 5% was used for the analysis. Microsoft Office Excel 2009 (Microsoft, Redmond, WA, USA) was used for the management of the study’s databases, and statistical analysis was done using Stata version 13 (64-bit; StataCorp, College Station, TX, USA).
Results
The sample of 261 adults with T2DM attended CMJAH’s diabetes clinic in both 2009 and 2013. Females represented 55% (n=143 of 261) of the cohort, and the self-reported mean duration of diabetes was approximately 16 (±10.6) years in 2013. There were four ethnic groups represented in the study (Table 1). Mean age and sex were similar across the different ethnic groups. The Caucasian group of patients presented with the longest self-reported duration of diabetes, as well as more retinopathy, neuropathy and CVD rates than any other race group in the study. The Asian/Indian group had the highest prevalence of nephropathy, albeit similar to the Caucasian group (29.4% vs 28.7%, P=0.92). In comparison with the other ethnic groups, the Caucasian patients had the second-highest LDL-C level (2.6±0.7 mmol/L, P=0.81) in 2009. By 2013, the aforementioned group had the lowest mean LDL-C in comparison with all other groups (2±0.8 mmol/L, P=0.13). In comparison with the rest of the groups, mixed-ancestry patients maintained the highest mean LDL-C over both time points (2.9±1.2 vs 2.5±0.7 mmol/L, P=0.26).
 | Table 1 Characteristics of study patients by ethnic grouping (2009 and 2013) Abbreviations: ACE, angiotensin converting enzyme; CVD, cardiovascular disease; HbA1c, glycated hemoglobin; SBP, systolic blood pressure; DBP, diastolic blood pressure; LDL, low-density lipoprotein; HDL, high-density lipoprotein; ARBs, angiotensin-receptor blockers. |
Glycemic management
There was a significant decline in the percentage of patients achieving the recommended HbA1c (<7%) across all ethnic groups (Table 2). The same percentage of mixed-ancestry patients achieved this HbA1c target of <7% over the two time points (13.3% in 2009 and 2013). However, this latter group also retained the highest HbA1c levels (9.2%±2.4% vs 9.6%±2.2%, P=0.73) over the two time points (Table 1). In comparison with the total population, the Asian/Indian group had the largest drop in HbA1c target of <7% (19.2% less patients reaching goal; P=0.86), followed closely by the Caucasian group (16.7% less patients at target, P=0.26) (Table 2). There were more Black African patients who achieved HbA1c targets than any other group (19.6%, P=0.55) (Table 2). An increased trend toward further utilization of oral hypoglycemic agents existed across all ethnic subgroups (Table 2). Metformin was utilized by 78.5% of patients (previously 60.5%, P<0.01), with a daily average of 1,755 mg taken during the 2013 time point. More patients were prescribed insulin treatment (83.3%, P<0.05) in 2013 (an increase of 11.5%), except for the Caucasian group, where no change occurred over time (Table 2). In 2013, basal insulin was used an average of 0.66, 0.63, 0.64, and 0.59 units per kg (per day), while 0.85, 0.69, 0.94, and 0.72 units/kg of premeal (bolus) insulin was prescribed in Black African, Caucasian, Asian/Indian, and mixed-ancestry patients, respectively.
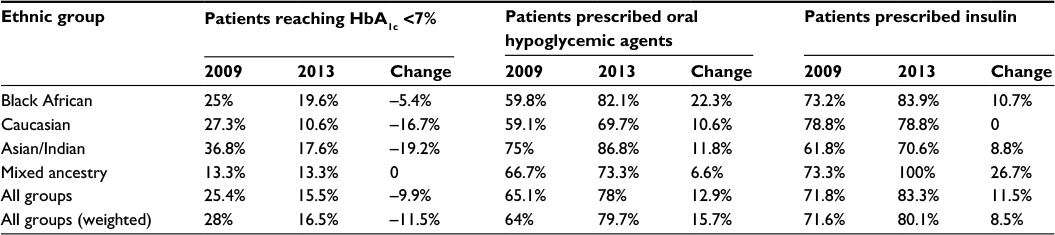 | Table 2 Ethnic differences in HbA1c-target achievement, oral hypoglycemic and insulin usage among study patients Abbreviation: HbA1c, glycated hemoglobin. |
Blood pressure management
There were increased rates of hypertension diagnosis made in both the Black African and mixed-ancestry groups of patients (Table 3). All patients from the mixed-ancestry group were being treated for hypertension in 2013. In contrast, two fewer Asian/Indian patients were treated for hypertension in 2013. An increase of 13.7% more patients across all race groups achieved BP targets in the follow-up study (SBP and DBP <140/80 mmHg, P<0.01) (Table 3). Almost double the percentage of Asian/Indian patients achieved target levels at the follow-up period (33.8% [2009] vs 63.2% [2013], P<0.01), while other race groups also had more patients reach the combined targets, but to a lesser extent (Table 3). Although not statistically significant, use of angiotensin converting enzyme (ACE) inhibitors (mainly enalapril and perindopril) and angiotensin-receptor blockers (ARBs; losartan) increased for all ethnic groups (P=0.82), except for Black Africans (P=0.41) (Table 3). More patients with diabetic nephropathy were prescribed ACE inhibitors or ARBs in 2013 than during the previous time period (data not shown). Patients used an average of 2.4 (2009) and 2.5 (2013) antihypertensive drug classes, with usage increasing over time across all ethnic groups, except for Caucasians (from 2.7 to 2.4).
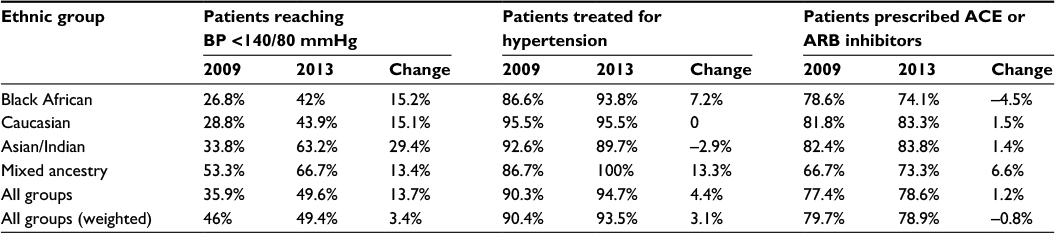 | Table 3 Ethnic differences in BP-target achievement and ACE inhibitor/ARB usage among study patients Abbreviations: BP, blood pressure; ARB, angiotensin-receptor blocker; ACE, angiotensin converting enzyme. |
Lipid management
All patients across every ethnic group had increased LDL-C testing in 2013 (vs 2009, P<0.01) and achieved lower mean LDL-C (vs 2009, P<0.01) (Table 1). In comparison with the other ethnic groups, more Black African patients with CVD/stroke achieved the LDL-C target (<1.8 mmol/L), although this was not statistically significant (P=0.75) (Table 4). Similarly, more patients from the Caucasian group without CVD/stroke achieved LDL-C targets (2.5 mmol/L) in the 2013 period, but this was statistically significant (P<0.05) (Table 4). In contrast, the same percentage of mixed-ancestry patients without CVD/stroke achieved their LDL-C targets (<2.5 mmol/L) over both time periods (Table 4). All ethnic groups used more statin lipid-lowering therapy in 2009 vs 2013 (P<0.01) (Table 4). The largest statin change over the two time periods occurred in the Black African group (increase by 36.6%) (Table 4). However, this latter group had the lowest percentage of patients (71.4%) using statin lipid-lowering therapy in comparison with the other ethnic groups in the follow-up study (P<0.05) (Table 4).
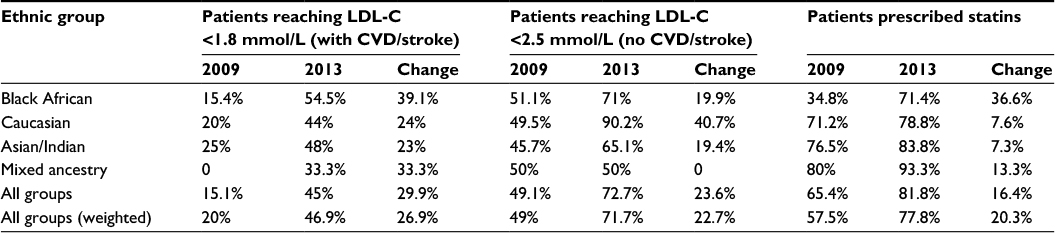 | Table 4 Ethnic differences in LDL-C target achievement and statin usage among study patients Abbreviations: LDL-C, low-density-lipoprotein cholesterol; CVD, cardiovascular disease. |
Discussion
Glycemia, BP, and dyslipidemia are major prognostic factors in the prevention of T2DM complications.12,17,18 Additionally, ethnic groups differ considerably in their frequency for diabetes-related complications.19,20 In this study, we demonstrated disparities of control of critical risk factors – HbA1c, BP, and LDL-C – in an urban multi-ethnic South African sample of T2DM patients. Although most patients received treatment, evidence-based goals were not always achieved: control of HbA1c deteriorated across all ethnicities, while improvements in BP and LDL-C target achievement occurred over time (Figure 1).
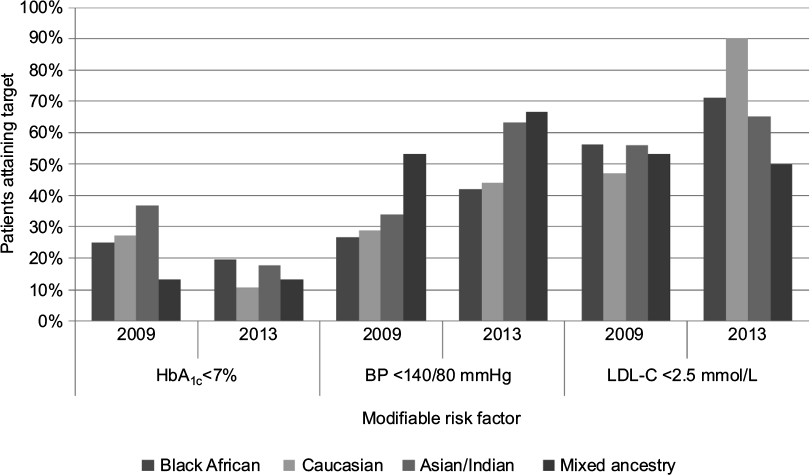 | Figure 1 Ethnic differences in achievement of glycemic, BP, and lipid targets among study patients. Abbreviations: BP, blood pressure; HbA1c, glycated hemoglobin; LDL-C, low-density-lipoprotein cholesterol. |
In the UK Prospective Diabetes Study, the undeniable benefits of glycemic control led to a reduction in microvascular complications.21 The Caucasian group of patients had the worst achievement in HbA1c (<7%), which potentially may correlate with this group having the highest rates of retinopathy and neuropathy in comparison with the rest of the groups. Our mixed-ancestry patients had the highest mean HbA1c levels (9.6%±2.2%), which were higher than the levels found for the same ethnic group of patients residing in South Africa’s Western Cape province (8.8%±3.4%).22 As found in a previous study, higher HbA1c levels in the mixed-ancestry group may be linked to the earlier activation of the cortisol axis in low-birth-weight adults who had previously developed glucose intolerance, later leading to CVD or metabolic disease.23 The second-highest mean HbA1c levels in our study were our Black African group (8.8%±2.2%) which in fact had higher levels than those found in a US study with African-Americans (7.7%±1.8%), Hispanics (6.7%±0.8%), and Caucasians (6.5%±1%).24 Despite this, almost double the amount of Black African patients (19.6%) in our study achieved HbA1c targets (<7%) compared with the Caucasians (10.6%). In general, all ethnic groups in our study compared unfavorably with studies from the US,25 South Korea,26 and Belgium,27 where 52.5%, 45.6%, and 54.0% of patients from a variety of ethnic backgrounds achieved HbA1c <7%, respectively. As recommended for patients who find it difficult to attain the general goal, a less stringent HbA1c target of <8% would show improvement in our achievement rates across all ethnicities, though still not to the levels of those seen in the aforementioned studies: Black African (44.6%), Caucasian (37.9%), Indian/Asian (45.6%), and mixed-ancestry (33.3%). The deterioration in HbA1c control over time may be attributed to a decline in B-cell function, as commonly observed in such a progressive disease. In addition, however, since more than 80% of the entire cohort was using insulin, it is likely that the fear of experiencing a devastating hypoglycemic event may have enticed patients to keep their glucose levels above normal, at the unfortunate cost of having uncontrolled HbA1c levels and risking the development of complications.
Hypertension and T2DM are intertwined conditions with overlapping risk factors. Approximately 90% of our T2DM patients were being treated for hypertension, with little variation across the different ethnicities (highest in mixed-ancestry and lowest in Asian/Indians). Hypertension prevalence rates in our T2DM patients far exceeded those seen in more developed nations, such as the US (71%) and Israel (60.2%–85.8%).28,29 However, our results support findings from two previous local studies where Black Africans had higher hypertension prevalence rates than Asian/Indians.30,31 As expected with increasing age, all ethnic groups in our study had increased mean SBP, but mean DBP was reduced after 4 years. This perhaps could be due to hyperglycemia experienced in T2DM and its pathogenic effects on large arteries.32 Less than 50% of our patients were found to have achieved the BP target (<140/80 mmHg) over both time periods (2009 and 2013). By ethnicity and order of descent, the mixed-ancestry group achieved BP goals better than the Asian/Indian, Caucasian, or Black African groups (66.7% vs 63.2% vs 43.9% vs 42%, respectively). According to Seedat, urbanized Black Africans have a higher prevalence of hypertension in comparison with their rural counterparts, due to biosocial factors, such as higher incidence of obesity, anxiety-led insomnia, cigarette smoking, alcohol intake, and lack of recreational activities. In contrast, hypertension is uncommon in rural Black Africans, who walk longer distances, are more physically active due to strenuous agricultural work, have poorer caloric intake during drought, and consume traditional maize-based diets.30 As our study took place in an urban setting, more of our Black African and mixed-ancestry patients developed hypertension over time, while Caucasian rates remained constant and two fewer Asian/Indians were treated for the condition. Although the T2DM condition amplifies the severity of renal damage at any given BP level, the Asian/Indian group in our study, who also had the highest rates of nephropathy present, were in fact targeted for more stringent BP targets, in order to try and mitigate further progression.4 Likewise, more renal protection was gained through the increased utilization of ACE inhibitors and ARBs across all race groups over time, except for Black Africans, who according to another study would have had a better response to calcium-channel blockers.33
Given the strong link between LDL-C and susceptibility of T2DM patients to CVD, approximately 80% of patients in this study were prescribed statin lipid-lowering therapy, as recommended by guidelines. While CVD was once considered the leading cause of death among white South Africans,9 more Caucasians in our study achieved better LDL-C control and goals than the rest of the groups. Paradoxically and as seen with other studies, our Caucasians also had the highest rates of CVD (36%), while Black Africans had the lowest (7%).19 Similarly, Kalk and Joffe19 found in their study that 68 (23%) of Caucasian patients presented with CVD in comparison with only 18 (4%) of Black Africans. Perhaps these aforementioned LDL-C attainment rates of our Caucasians (and in fact all other ethnic groups that improved over the 4-year period) are reflective of the positive steps taken by clinic staff in an attempt to reduce the clinical inertia at this setting.34 On the other hand, Black Africans in our study presented with almost no occurrences of CVD, which is not reflective of the actual trend. For instance, in the Transition and Health during Urbanisation of South Africans (THUSA) study, significantly higher total serum cholesterol levels where found in a cohort of 1,854 Black Africans from 37 randomly selected sites in the northern part of South Africa, especially in those who were more urbanized and consuming a richer diet of animal products.35 The Black Africans in our study may have had low CVD rates recorded, but this still reflects a relative increase, especially when compared against rural Black African populations. It is revealing that the incidence of CVD in Black Africans had almost tripled over the 4-year period in our study. Undoubtedly, these shifts were associated with the effects of urbanization, which may also be noted by the earlier onset of T2DM in Black Africans we studied in comparison with the mixed-ancestry, Asian/Indian, and Caucasian groups, 45.4 vs 45.8 vs 48.8 vs 52.5 years, respectively.
This study is to be interpreted with caution, as cross-sectional study designs cannot always infer causality. There were small numbers of patients representing different ethnicities in our study, and the ethnic ratios studied differ to those found in the general South African population.6 With a large portion of the cohort lost in the 2013 follow-up study, this unfortunately led to particularly smaller subgroups (eg, mixed ancestry). On a positive note, despite the smaller numbers of patients studied, our results support data previously obtained in other local studies. Although extrapolating one setting’s findings with another’s may be difficult in that genetics may differ by geography, our study prides itself in that there were multiple ethnicities represented by our case mix at a single location where a standardized level of care (practitioners, laboratory equipment, medications) were equally accessible to all the ethnic groups. There are limitations in the generalizability of this study, however, as it was conducted in a setting where patients had a mean duration of diabetes of 16 years, leading to an overestimation of the diabetes-related complications normally not encountered at a primary care clinic setting. Moreover, CMJAH is a tertiary academic center where referrals of a more complicated case mix of patients present to multidisciplinary teams of physicians in residency who can be assumed to deal with more complicated patients, and thus act more aggressively in their effort to maximize improved patient outcomes. Sociodemographic measures, such as income, employment, education, diet, levels of physical activity, alcohol intake, and smoking status have important roles as drivers for attaining control of CVD risk factors in patients with T2DM, and thus would have added value to this study.24 Similarly, the missing hypoglycemia rates would have been an important factor to investigate, given the increased use of insulin and HbA1c levels found in our study, over time. Lastly, the patients included in this follow-up study have been subjected to “survival bias”.
Conclusion
There is a preponderance of research that suggests that ethnic disparities exist and thus result in multiple outcomes. The principal finding of this study was to demonstrate the difficulties that exist in achieving evidence-based goals in T2DM patients of different ethnic backgrounds. Additionally, because the majority (~83%) of South Africa’s population receive their health care within the public sector, this study plays an important role, in that it provides a prospective that complements other population-based studies. Future research should focus on genetic, lifestyle, access to health care, and socioeconomic differences, in order to identify the sources of ethnic disparities of control of HbA1c, BP, and LDL-C. We encourage practitioners to address individual self-management needs and at the same time apply a more focused approach, in order to prevent/delay complications commonly associated with T2DM.
Disclosure
The authors report no conflicts of interest in this work.
References
Cooper R, Rotimi C. Hypertension in blacks. Am J Hypertens. 1997;10(7 Pt 1):804–812. | ||
Kaminer B, Lutz WP. Blood pressure in Bushmen of the Kalahari Desert. Circulation. 1960;22:289–95. | ||
Sever PS, Gordon D, Peart WS, Beighton P. Blood pressure and its correlates in urban and tribal Africa. Lancet. 1980;2(8185):60–64. | ||
NCD Risk Factor Collaboration (NCD-RisC). Worldwide trends in diabetes since 1980: a pooled analysis of 751 population-based studies with 4.4 million participants. Lancet. 2016;387(10027):1513–1530. | ||
Mbanya JC, Motala AA, Sobngwi E, Assah FK, Enoru ST. Diabetes in sub-Saharan Africa. Lancet. 2010;375(9733):2254–2266. | ||
Statistics South Africa. Mid-year population estimates: 2015. 2015. Available from: https://www.statssa.gov.za/publications/P0302/P03022015.pdf. Accessed October 30, 2016. | ||
Levitt NS, Katzenellenbogen JM, Bradshaw D, Hoffman MN, Bonnici F. The prevalence and identification of risk factors for NIDDM in urban Africans in Cape Town, South Africa. Diabetes Care. 1993;16(4):601–607. | ||
Charlton KE, Levitt NS, Lombard CJ. The prevalence of diabetes mellitus and associated risk factors in elderly coloured South Africans. S Afr Med J. 1997;87(3 Suppl):364–367. | ||
Seedat YK, Mayet FG, Gouws E. Risk factors for coronary heart disease in the white community of Durban. S Afr Med J. 1994;84(5):257–262. | ||
Omar MA, Seedat MA, Dyer RB, Motala AA, Knight LT, Becker PJ. South African Indians show a high prevalence of NIDDM and bimodality in plasma glucose distribution patterns. Diabetes Care. 1994;17(1):70–73. | ||
Collins R, Armitage J, Parish S, Sleigh P, Peto R. MRC/BHF Heart Protection Study of cholesterol-lowering with simvastatin in 5963 people with diabetes: a randomised placebo-controlled trial. Lancet. 2003;361(9374):2005–2016. | ||
UK Prospective Diabetes Study (UKPDS) Group. Intensive blood-glucose control with sulphonylureas or insulin compared with conventional treatment and risk of complications in patients with type 2 diabetes (UKPDS 33). Lancet. 1998;352(9131):837–853. | ||
SEMDSA Guideline Committee. The 2012 SEMDSA guideline for the management of type 2 diabetes (Revised). J Endocrinol Metab Diabetes S Afr. 2012;17(1):S1–S95. | ||
Pinchevsky Y, Butkow N, Raal F, Chirwa T. The implementation of guidelines in a South African population with type 2 diabetes. J Endocrinol Metab Diabetes S Afr. 2013;18(3):154–158. | ||
Kalk WJ, Joannou J, Ntsepo S, Mahomed I, Mahanlal P, Becker PJ. Ethnic differences in the clinical and laboratory associations with retinopathy in adult onset diabetes: studies in patients of African, European and Indian origins. J Intern Med. 1997;241(1):31–37. | ||
Pinchevsky Y, Shukla V, Butkow N, Raal F, Chirwa T. The achievement of glycaemic, blood pressure and LDL cholesterol targets in patients with type 2 diabetes attending a South African tertiary hospital outpatient clinic. J Endocrinol Metab Diabetes S Afr. 2015;20(2):81–86. | ||
Kjeldsen SE, Hedner T, Jamerson K, et al. Hypertension optimal treatment (HOT) study: home blood pressure in treated hypertensive subjects. Hypertension. 1998;31(4):1014–1020. | ||
Pyŏrälä K, Pedersen TR, Kjekshus J, Faergeman O, Olsson AG, Thorgeirsson G. Cholesterol lowering with simvastatin improves prognosis of diabetic patients with coronary heart disease: a subgroup analysis of the Scandinavian Simvastatin Survival Study (4S). Diabetes Care. 1997;20(4):614–620. | ||
Kalk WJ, Joffe BI. Differences in coronary heart disease prevalence and risk factors in African and white patients with type 2 diabetes. Diabetes Res Clin Pract. 2007;77(1):107–112. | ||
Kirk JK, Bell RA, Bertoni AG, et al. Ethnic disparities: control of glycemia, blood pressure, and LDL cholesterol among US adults with type 2 diabetes. Ann Pharmacother. 2005;39(9):1489–1501. | ||
UK Prospective Diabetes Study (UKPDS) Group. Effect of intensive blood-glucose control with metformin on complications in overweight patients with type 2 diabetes (UKPDS 34). Lancet. 1998;352(9131):854–865. | ||
Steyn K, Levitt NS, Patel M, et al. Hypertension and diabetes: poor care for patients at community health centres. S Afr Med J. 2008;98(8):618–622. | ||
Levitt NS, Lambert EV, Woods D, Hales CN, Andrew R, Seckl JR. Impaired glucose tolerance and elevated blood pressure in low birth weight, nonobese, young South African adults: early programming of cortisol axis. J Clin Endocrinol Metab. 2000;85(12):4611–4618. | ||
Osborn CY, de Groot M, Wagner JA. Racial and ethnic disparities in diabetes complications in the northeastern United States: the role of socioeconomic status. J Natl Med Assoc. 2013;105(1):51–58. | ||
Ali MK, Bullard KM, Gregg EW. Achievement of goals in U.S. diabetes care, 1999-2010. N Engl J Med. 2013;369(3):287–288. | ||
Jeon JY, Kim DJ, Ko SH, et al. Current status of glycemic control of patients with diabetes in Korea: the fifth Korea national health and nutrition examination survey. Diabetes Metab J. 2014;38(3):197–203. | ||
Goderis G, Borgermans L, Heyrman J, et al. Type 2 diabetes in primary care in Belgium: need for structured shared care. Exp Clin Endocrinol Diabetes. 2009;117(8):367–372. | ||
Geiss LS, Rolka DB, Engelgau MM. Elevated blood pressure among U.S. adults with diabetes, 1988-1994. Am J Prev Med. 2002;22(1):42–48. | ||
Kabakov E, Norymberg C, Osher E, et al. Prevalence of hypertension in type 2 diabetes mellitus: impact of the tightening definition of high blood pressure and association with confounding risk factors. J Cardiometab Syndr. 2006;1(2):95–101. | ||
Seedat YK. Race, environment and blood pressure: the South African experience. J Hypertens. 1983;1(1):7–12. | ||
Motala AA, Pirie FJ, Gouws E, Amod A, Omar MA. Microvascular complications in South African patients with long-duration diabetes mellitus. S Afr Med J. 2001;91(11):987–992. | ||
Stern N, Marcus Y. Hypertension in diabetes: the role of the vasculature. Curr Hypertens Rep. 2004;6(2):90–97. | ||
Radevski I, Skudicky D, Candy G, Sathekge S, Strugo V, Sareli P. Antihypertensive monotherapy with nisoldipine CC is superior to enalapril in black patients with severe hypertension. Am J Hypertens. 1999;12(2 Pt 1):194–203. | ||
Grant RW, Cagliero E, Dubey AK, et al. Clinical inertia in the management of type 2 diabetes metabolic risk factors. Diabet Med. 2004;21(2):150–155. | ||
Vorster HH. The emergence of cardiovascular disease during urbanisation of Africans. Public Health Nutr. 2002;5(1A):239–243. |
 © 2016 The Author(s). This work is published and licensed by Dove Medical Press Limited. The
full terms of this license are available at https://www.dovepress.com/terms
and incorporate the Creative Commons Attribution
- Non Commercial (unported, 3.0) License.
By accessing the work you hereby accept the Terms. Non-commercial uses of the work are permitted
without any further permission from Dove Medical Press Limited, provided the work is properly
attributed. For permission for commercial use of this work, please see paragraphs 4.2 and 5 of our Terms.
© 2016 The Author(s). This work is published and licensed by Dove Medical Press Limited. The
full terms of this license are available at https://www.dovepress.com/terms
and incorporate the Creative Commons Attribution
- Non Commercial (unported, 3.0) License.
By accessing the work you hereby accept the Terms. Non-commercial uses of the work are permitted
without any further permission from Dove Medical Press Limited, provided the work is properly
attributed. For permission for commercial use of this work, please see paragraphs 4.2 and 5 of our Terms.