Back to Journals » Clinical and Experimental Gastroenterology » Volume 15
Mucosal Gene Transcript Signatures in Treatment Naïve Inflammatory Bowel Disease: A Comparative Analysis of Disease to Symptomatic and Healthy Controls in the European IBD-Character Cohort
Authors Vatn SS ![]() , Lindstrøm JC, Moen AEF
, Lindstrøm JC, Moen AEF ![]() , Brackmann S
, Brackmann S ![]() , Tannæs TM
, Tannæs TM ![]() , Olbjørn C, Bergemalm D
, Olbjørn C, Bergemalm D ![]() , Keita ÅV, Gomollon F
, Keita ÅV, Gomollon F ![]() , Detlie TE, Lüders T, Kalla R
, Detlie TE, Lüders T, Kalla R ![]() , Adams A, Satsangi J, Jahnsen J
, Adams A, Satsangi J, Jahnsen J ![]() , Vatn MH, Halfvarson J
, Vatn MH, Halfvarson J ![]() , Ricanek P
, Ricanek P ![]() , Nilsen H
, Nilsen H
Received 18 October 2021
Accepted for publication 22 December 2021
Published 11 February 2022 Volume 2022:15 Pages 5—25
DOI https://doi.org/10.2147/CEG.S343468
Checked for plagiarism Yes
Review by Single anonymous peer review
Peer reviewer comments 2
Editor who approved publication: Professor Wing-Kin Syn
Simen Svendsen Vatn,1,2,* Jonas Christoffer Lindstrøm,3,4,* Aina EF Moen,1,4,5 Stephan Brackmann,1,2 Tone M Tannæs,1,5 Christine Olbjørn,1,6 Daniel Bergemalm,7 Åsa V Keita,8 Fernando Gomollon,9 Trond Espen Detlie,1,2 Torben Lüders,5 Rahul Kalla,10 Alex Adams,10,11 Jack Satsangi,10,11 Jørgen Jahnsen,1,2 Morten H Vatn,1 Jonas Halfvarson,7 Petr Ricanek,2 Hilde Nilsen1,5 On behalf of IBD-CHARACTER consortium
1Department of Clinical Molecular Biology, Institute of Clinical Medicine, University of Oslo, Oslo, Norway; 2Department of Gastroenterology, Division of Medicine, Akershus University Hospital, Lørenskog, Norway; 3Health Services Research Unit (HØKH), Akershus University Hospital, Lørenskog, Norway; 4Department of Methods Development and Analytics, Division of Infectious Disease Control and Environmental Health, Norwegian Institute of Public Health, Oslo, Norway; 5Section for Clinical Molecular Biology (EpiGen), Akershus University Hospital, Lørenskog, Norway; 6Department of Pediatric and Adolescent Medicine, Akershus University Hospital, Lørenskog, Norway; 7Department of Gastroenterology, Faculty of Medicine and Health, Örebro University, Örebro, Sweden; 8Department of Biomedical and Clinical Sciences, Linköping University, Linköping, Sweden; 9Digestive Diseases Unit, IIS Aragón, Zaragoza, Spain; 10Gastrointestinal Unit, Centre for Genomics and Molecular Medicine, Division of Medical and Radiological Sciences, University of Edinburgh, Edinburgh, UK; 11Translational Gastroenterology Unit, Medical Sciences/ Experimental medicine Division, University of Oxford, Oxford, UK
*These authors contributed equally to this work
Correspondence: Simen Svendsen Vatn, Akershus University Hospital, Postbox 1000, Lørenskog, 1478, Norway, Tel +47 94277594, Email [email protected]
Background: Studies of the mucosal transcriptomic landscape have given new insight into the pathogenesis of inflammatory bowel disease (IBD). Recently, the predictive biomarker potential of gene expression signatures has been explored. To further investigate the mucosal gene expression in IBD, we recruited a cohort of treatment naïve patients and compared them to both symptomatic and healthy controls.
Methods: Altogether, 323 subjects were included: Crohn’s disease (N = 75), ulcerative colitis (N = 87) and IBD unclassified (N = 3). Additionally, there were two control groups: symptomatic controls (N = 131) and healthy controls (N = 27). Mucosal biopsies were collected during ileocolonoscopy and gene expression in inflamed and non-inflamed mucosa was explored. Gene expression profiling was performed using Agilent G3 Human Gene Expression 860K v3 One-Color microarray. We recorded information about treatment escalation to anti-TNF agents or surgery, and anti-TNF response, to explore predictive opportunities of the mucosal transcriptome.
Results: Gene expression profiles in symptomatic controls in whom IBD had been excluded resembled that of IBD patients and diverged from that of healthy controls. In non-inflamed Crohn’s disease and ulcerative colitis, gene set enrichment analysis revealed dysregulation of pathways involved in basic cellular biological processes. Mitochondria-associated pathways were dysregulated both in non-inflamed and inflamed Crohn’s disease and ulcerative colitis (> 2.6 normalized enrichment scores <− 1.8). Gene expression signatures of Crohn’s disease and ulcerative colitis did not predict time for treatment escalation (p = 0.175). No significant association was found between gene expression signatures and anti-TNF response.
Conclusion: Non-inflamed samples are probably superior to inflamed samples when exploring gene expression signatures in IBD and might reveal underlying mechanisms central for disease initiation. The gene expression signatures of the control groups were related to if they were symptomatic or not, which may have important implications for future study designs.
Keywords: Crohn’s disease, healthy controls, mitochondria, mucosal transcriptome, non-inflamed, prediction, symptomatic controls, ulcerative colitis
Introduction
Inflammatory Bowel Disease (IBD) is a chronic inflammatory disease of the gut with heterogeneous manifestations, and a clinical presentation as Crohn’s disease (CD), ulcerative colitis (UC), or IBD unclassified (IBD-U).1–3
The disease course of IBD shows large individual variation in terms of severity, behavior, progression, and response to treatment. Both clinical variables4–6 and molecular signatures7–11 have been associated with different aspects of the disease course, but only a few have been shown to be robust and reliable enough to be used for decision-making in clinical practice with regard to therapy.12–14
A transcriptome-wide analysis is a hypothesis-free strategy to provide insights into the differences in gene regulation in biological samples. Various studies have associated transcriptional changes with IBD.15–19 These studies have paved the way towards the first map of mRNA expression changes characterizing the disease, and may be used for the identification of novel therapeutic targets. Recently, efforts have been put into the exploration of global gene expression signatures to facilitate personalized IBD care. In particular, responses to anti-Tumor Necrosis Factor (anti-TNF) agents, have been explored, demonstrating that gene expression signatures hold predictive biomarker potential.20–25
In order to advance our understanding of IBD and to increase the diagnostic and prognostic precision of the disease, the EU project “Inflammatory Bowel Disease CHARACTERization by a multi-modal integrated biomarker study” (IBD-Character)26 was launched in 2013. IBD-Character is a collaborative effort, involving six European university clinics (Akershus, Norway; Ørebro, Sweden; Linkøping, Sweden; Edinburgh, United Kingdom; Zaragoza, Spain; Maastricht, Netherlands). We performed mucosal transcriptome analyses of an inception cohort of newly diagnosed, mainly treatment naïve (92%) IBD patients, to create a transcriptional snapshot of IBD in its early manifestation. The RNA transcriptional status as well as demographic and clinical data were compared between patients and control groups, and between inflamed and non-inflamed tissue in IBD patients. In addition, we examined how gene expression may be associated with the clinical outcome defined as the need for treatment escalation and response to anti-TNF agents.
Methods
Patient Recruitment, Sample Collection and Follow-Up
Patients referred to the hospital with suspected IBD were recruited prospectively at six gastrointestinal clinics across Europe during 2012–2015, as part of the EU FP7 IBD-Character study.26
At inclusion, clinical data were recorded and blood samples were obtained. Mucosal biopsies were collected during ileocolonoscopy according to a study protocol and stored in Allprotect (Qiagen) stabilizing reagent at −80°C. For CD and UC patients, biopsies from both inflamed and non-inflamed tissue were collected.
In total, 323 subjects were recruited and grouped into five groups; CD (N = 75), UC (N = 87), IBD-U (N = 3), symptomatic controls (SC, N = 131), and healthy controls (HC, N = 27). Table 1 demonstrates demographics and clinical characteristics.
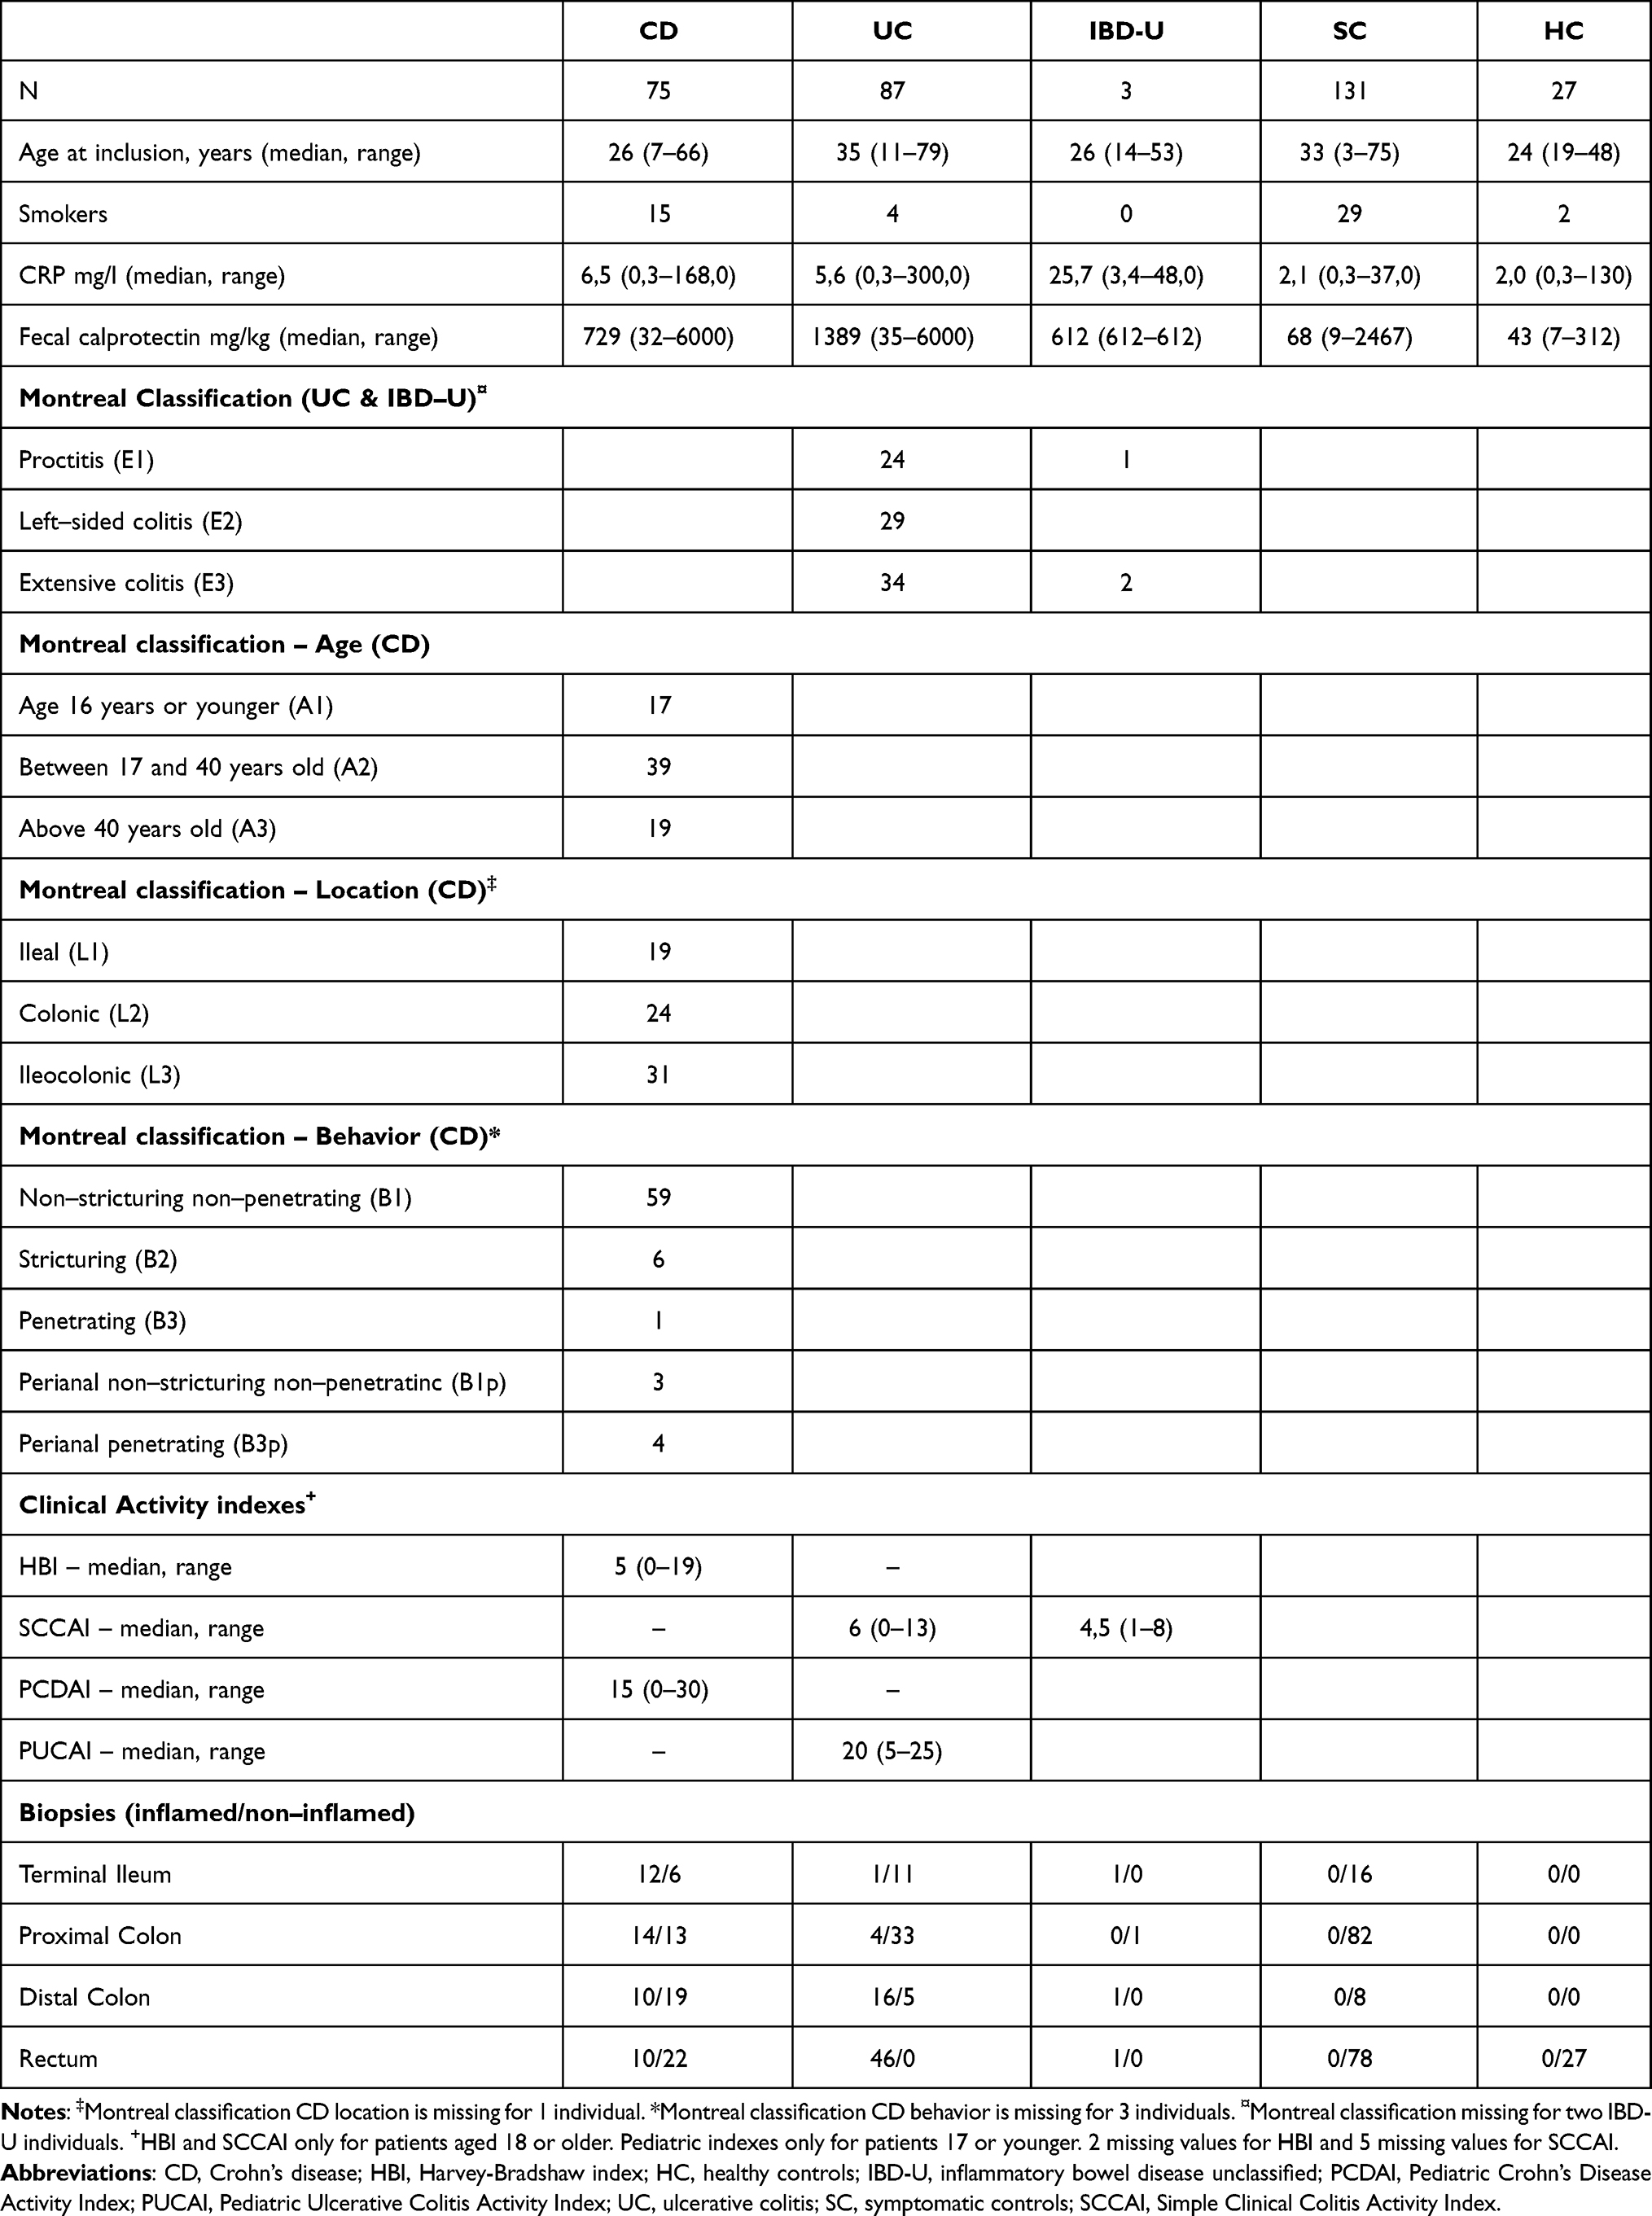 |
Table 1 Demographics, Clinical Characteristics and Sample Material |
The diagnosis of IBD was based on internationally accepted diagnostic criteria, following clinical, endoscopic, histologic, and radiologic examinations.1,3 The Montreal classification was used to characterize the clinical phenotype.27,28 The patients were mainly diagnosed at the date of biopsy sampling. Mean time from diagnosis to inclusion was 14 days, while the median was 0 days. The patients were mainly treatment naïve (92%), and they were further followed by their local gastroenterologist according to national and European guidelines.1,3,29 Follow-up data on disease course were available in 154/165 (93%) patients, 72 CD and 82 UC. Treatment escalation was defined as introduction of anti-TNF agents, cyclosporine or surgery introduced for a disease flare or disease refractory to primary treatment.
Response to anti-TNF therapy during follow-up was evaluated 14 weeks after introduction of anti-TNF. C-reactive protein (S-CRP) was analyzed in serum samples, and fecal calprotectin (F-calprotectin) was assessed according to the manufacturer’s protocol (BÜHLMANN fCAL™, Schönenbuch, Switzerland),30 at the date of introduction of anti-TNF treatment, and in week 14, respectively.
For CD, response was defined as no use of concomitant steroids, a decrease in the Harvey-Bradshaw Index (HBI) of at least 3 points, or to ≤4, and at least one of the following two criteria: (a) a reduction in S-CRP by at least 50%, or to ≤3 mg/l from baseline, or (b) a reduction F-calprotectin by at least 30%, or to <250mg/kg. Remission was defined as HBI ≤3 points and S-CRP ≤3 mg/l, and no concomitant steroids.
For UC, response was defined as no use of concomitant steroids, a reduction from the baseline partial Mayo score of at least 3 points, and at least 30%, and a reduction in the rectal bleeding subscore of at least 1 point or an absolute rectal bleeding score of 0 or 1. Additionally, at least one of the following three criteria was achieved: (a) a reduction in S-CRP fall by at least 50%, or to ≤3 mg/l from baseline, or (b) a reduction in F-calprotectin by at least 30%, or to <250mg/kg, or (c) a reduction of at least 1 in the Endoscopic Mayo score. Remission was defined as partial Mayo score 0–1, and at least one out of three criteria achieved: F-Calprotectin <250mg/kg, S-CRP ≤3 mg/l, and/or Endoscopic Mayo score 0–1.
Individuals with gastrointestinal symptoms, but with no endoscopic or histologic signs of IBD inflammation at inclusion, and no discernible evidence of IBD or other inflammation during follow-up, were classified as symptomatic controls. Seventy-five percent of these patients had diarrhea with 4–15 bowel movements per day. The remaining 25% had abdominal pain, bloating and some had constipation. In symptomatic controls with persisting symptoms 1–2 months after inclusion, a follow-up F-calprotectin was assessed. MRI and capsule endoscopy were performed with normal findings on selected cases with high F-calprotectin. Celiac serology, b-hemoglobin, and s-ferritin were assessed in all patients. Testing for fecal occult blood (FOB) was done on clinical indication. Upper endoscopy was performed in selected cases with either/or/and: Upper GI-symptoms, anemia, positive FOB, or those with elevated anti-TTG/anti deaminated-gliadin IgG, suggestive of celiac disease. If there were findings in upper GI that could be related to symptoms, the patient was excluded.
Seventy-eight percent of the symptomatic controls ended up with a diagnosis of irritable bowel syndrome (IBS), whereas in 22% of the cases no certain diagnosis could be set, as they did not meet the IBS Rome IV criteria, and other disease was also ruled out. Patients with a possible, but no definite IBD diagnosis, were excluded from the study. Patients with ischemic colitis, microscopic colitis and infectious enterocolitis were also excluded.
Healthy controls had no gastrointestinal symptoms or other disease, and they went through rectoscopy with mucosal pinch biopsies. Additionally, fecal samples and blood samples were collected from healthy controls.
Sample Processing and Gene Expression Profiling
RNA Isolation
Total RNA was isolated using QIAsymphony RNA Kit (Qiagen, Hilden, Germany) and the protocol RNA CT 400. Prior to loading into the QIAsymphony, the tissue biopsies were homogenized in Buffer RLT Plus using a 5 mm steal bead in the FastPrep-24™ Classic Instrument (MP Biomedicals, Irvine, CA, USA) at 4 m/s for 30 sec, centrifuged and the lysate transferred to new tubes. Further processing was per the manufacturer’s protocol. RNA concentration was measured using the NanoDrop ND-1000 spectrophotometer (Thermo Fisher Scientific, Waltham, MA, USA) and using the OD260 for calculation. The RNA quality, indicated by the RNA integrity number (RIN), was assessed with an Agilent 2100 Bioanalyzer, Agilent 2100 Expert software and Agilent RNA 6000 Nano Kit (Agilent Technologies Inc., Santa Clara, CA, USA). Exclusion criteria for RNA samples were RIN number below 7.5 and RNA concentration lower than 66.7 ng/μL. Four hundred and ninety-eight RNA samples passed these criteria.
Microarray Analysis
mRNA amplification, labelling, and hybridization of the RNA samples were performed following the manufacturer’s instructions (Agilent One-Color Microarray-Based Gene Expression Analysis, Low Input Quick Amp Labeling; version 6.9). In short, 100 ng RNA was amplified and labelled with Cy3 using the Low Input Quick Amp Labeling Kit, one-color (product number 5190–2305), and the labelled cRNA was purified using the Qiagen RNeasy Mini Kit.
Amplification and labelling efficiency were controlled using NanoDrop ND-1000 spectrophotometer. The cRNA quality was assessed by measuring the RNA absorbance ratio 260nm/280nm. The specific activity of labeled cRNA (pmol Cy3 per ug cRNA) was defined to be 6 or above according to the Agilent recommendations. Four hundred and eighty-one cDNA samples passed these criteria and were eligible for microarray analyses.
Six hundred ng cRNA per sample was fragmented and applied to Agilent SurePrint G3 human Gene Expression 8x60k v2 Microarrays (G4851B). The cRNA samples were randomized on the slides while attempting to balance the potential confounding variables clinical center, diagnosis, gender, age and smoking status. After hybridization for 17 h at 65°C the microarray slides were washed, scanned with the Agilent Microarray Scanner and the data extracted using Agilent Feature Extraction Software.
Statistical Analysis
Background correction (using the normexp method with offset 16) and quantile normalizing between arrays were done using the limma R package.31 After removing samples with sex chromosome mismatch, unclear diagnosis and missing gut location, gene expression profiles from 437 cRNA samples remained for statistical analyses. The distribution of samples regarding inflammation status and location for the diagnostic groups is demonstrated in Table 1.
A linear regression analysis using limma was used to compare the different diagnosis groups and inflammation statuses, while adjusting for paired samples from the same subject and different gut sampling location. Transcripts with the 90% quantile below 5 were not analyzed as they were likely to be below the limit of detection. Differentially expressed genes (DEGs) were identified at a false discovery rate of 5% (p = 0.05) and log2FC >±1.
The period from the date of IBD diagnosis, when the first-line treatment was initiated, until treatment escalation, was analyzed using Cox proportional hazards models. The analyses were performed on all patients with IBD and by the inflammation status and UC and CD separately.
Associations between gene expression levels and response to anti-TNF therapy were analyzed using logistic regression analysis. As in differential abundance analyses, low abundance transcripts were not analyzed.
We used the fgsea R package11 to test for enriched Gene Ontology (GO) terms in ranked lists based on the differential expression test.
Curated gene sets representing pathways known, or predicted, to be of pathophysiological relevance in IBD in general, or for the effect of the therapeutic options used for IBD patients in this study, were downloaded from the MsigDB database,32 and gene expression signatures predicting activity of these pathways were transformed into PathTracer deregulation scores.33
Ethics
Regional committees for medical and health research ethics (REC) in South-East Norway, and Norwegian Centre for Research Data accepted the ethical aspects of the research project. All clinical centers were granted local ethics approval for this study, and all patients gave written and informed consent prior to participating in this study. This study was conducted in accordance with the Declaration of Helsinki.
Data Transparency Statement
Clinical and descriptive data of the cohort, analytic methods and microarray raw data can be shared on request to the corresponding author ([email protected]) with permission from the IBD-Character data access committee.
Author Approval
All authors had access to the study data and reviewed and approved the final manuscript.
Results
In total, 323 subjects were included: Patients with treatment naïve IBD consisting of CD (N = 75), UC (N = 87) and IBD-U (N = 3). Additionally, symptomatic controls (N = 131) and healthy controls (N = 27) were recruited. Demographics and clinical characteristics, as Montreal Classification, S-CRP, F-calprotectin are shown in Table 1.
Principal component analysis (PCA) was used to assess to which extent inflammation status and gastrointestinal segment influenced expression variability. The PCA analysis confirmed that the diagnosis groups form one combined cluster (Figure 1A). Importantly, PCA analyses showed that the main determinant of the overall expression profile was gut segment, primarily separating terminal ileum vs colorectum, although different segments of the colorectum (proximal colon vs rectum) could also be observed (Figure 1B). Inflammation status also separated the data to some extent in PCA (Figure 1C). Neither inflammation status, segment, nor diagnosis was, however, able to provide definite separation of the data. Moreover, there was no evident subgrouping in the normalized gene expression data among neither UC (Supplementary Figure 1A) nor CD (Supplementary Figure 1B), and healthy controls as judged from hierarchical cluster analyses, although for UC patients, there was a tendency that biopsies from inflamed tissue clustered together. In CD and UC, biopsies from terminal ileum clustered together, while biopsies from different segments of the colorectum were distributed across the entire cluster.
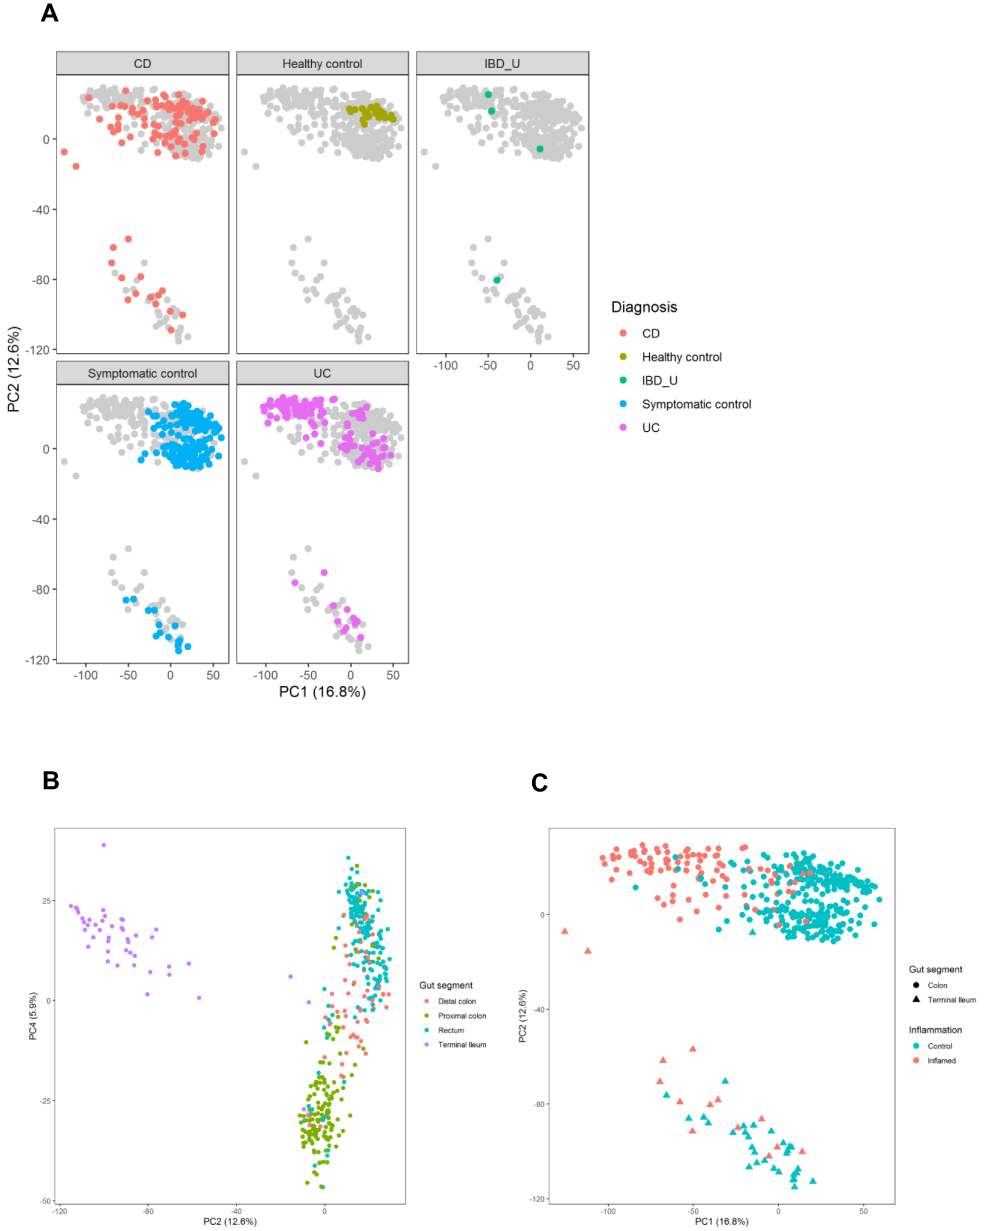 |
Figure 1 Principal Component Analysis plots, demonstrating separation of samples based on (A) diagnostic group, (B) gut segments and (C) inflammation status separated by color (inflamed samples in red, vs non-inflamed samples in blue) and gut segment separated by shape (samples from colon demonstrated with circles, vs samples from ileum demonstrated with triangles. Abbreviations: CD, Crohn’s disease; UC, ulcerative colitis; IBD-U, IBD-unclassified. |
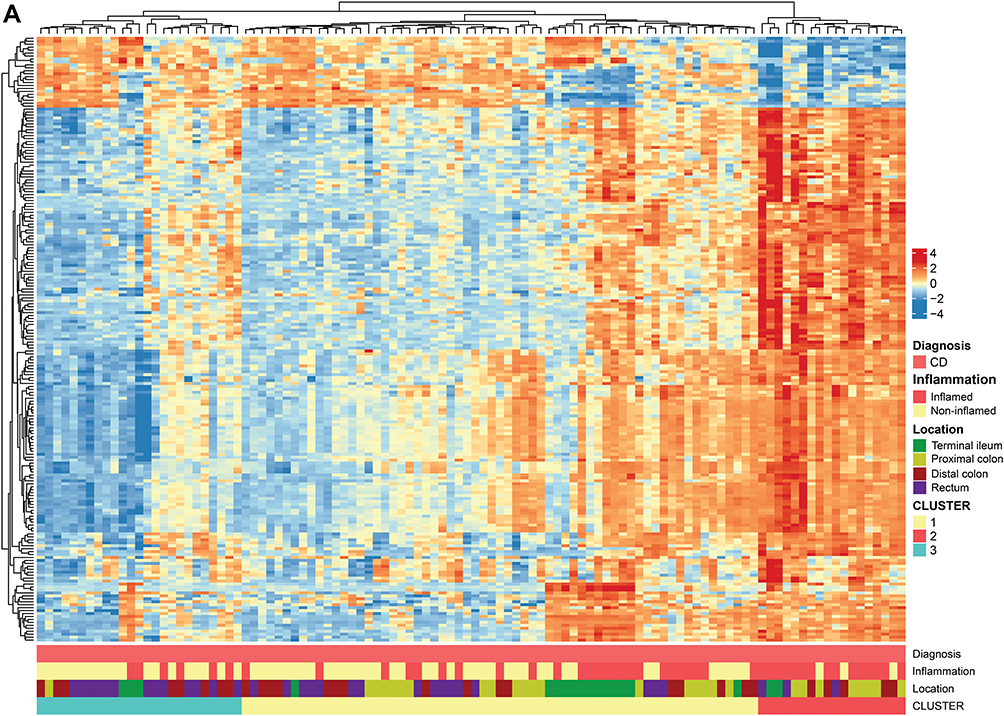 |
Figure 2 Continued. |
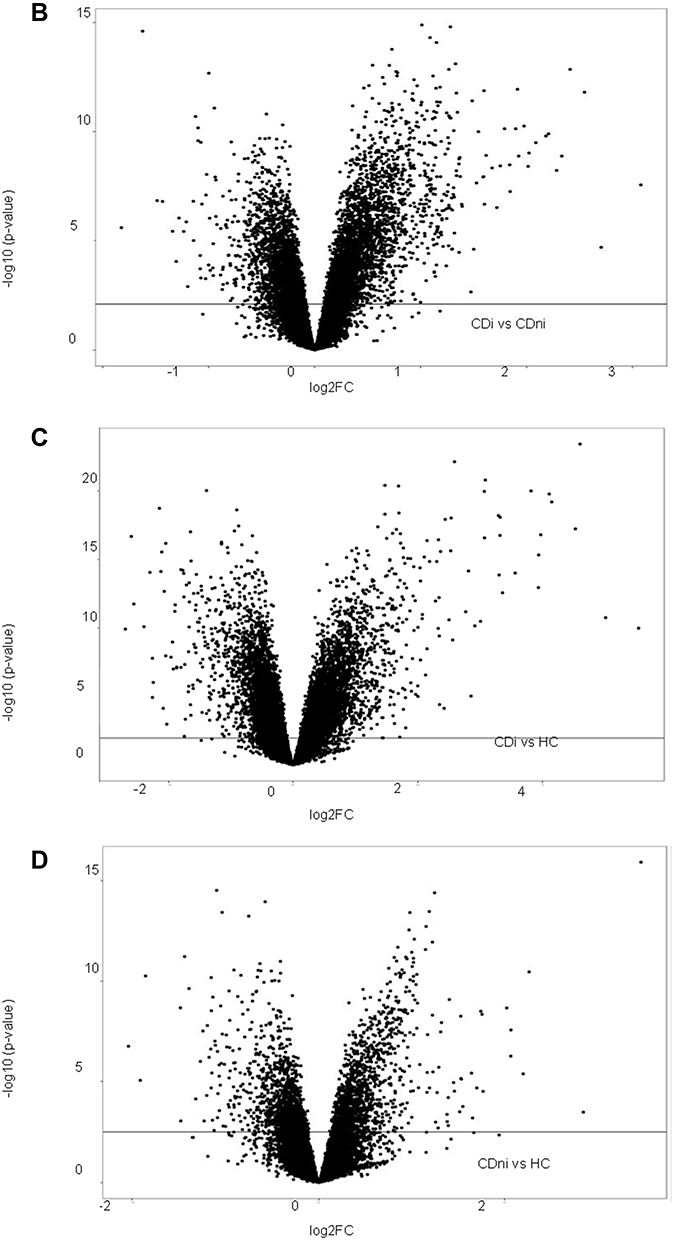 |
Figure 2 Continued. |
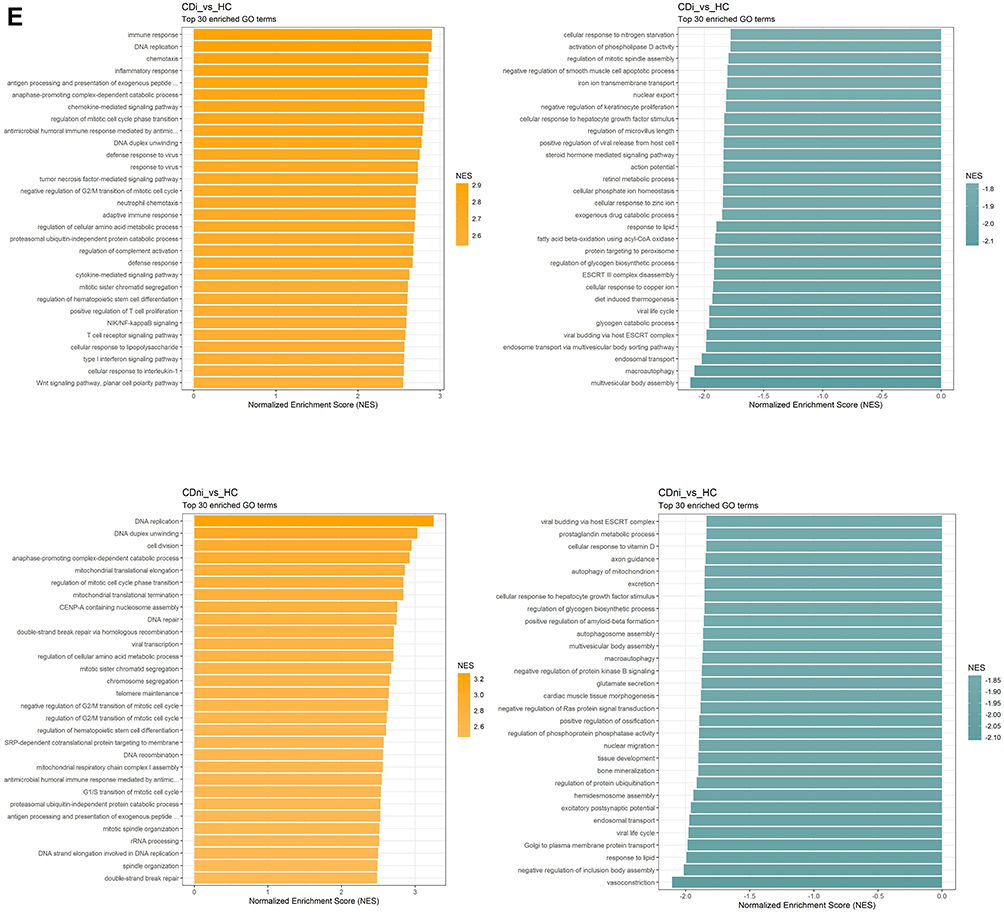 |
Figure 2 Crohn's disease. (A) Hierarchical clustering of differentially regulated genes. (B) Volcano plot comparing inflamed (CDi) and non-inflamed (CDni) samples in CD. (C) Volcano plot of inflamed biopsies from CD (CDi) compared to healthy controls. (D) Volcano plot of non-inflamed biopsies from CD (CDni) compared to healthy controls. (E) Gene set enrichment analyses given as Normalised Enrichment Scores (NES) in CDi (top panel) and CDni (bottom panel) versus healthy controls. “Orange” represents overrepresented GO terms, with positive NES. “Green” represents underrepresented GO terms, with negative NES. Abbreviations: CDi, inflamed CD; CDni, non-inflamed CD; HC, healthy controls; NES, Normalised Enrichment Score. |
The significantly differentially expressed genes (DEGs) at 5% False Discovery Rate (FDR) and the correlation between the comparisons are presented in Table 2. A high number of DEGs were observed in inflamed samples, regardless of IBD phenotype. This picture was strikingly different in non-inflamed IBD: In non-inflamed CD 401 transcripts were significantly differentially expressed compared to symptomatic controls. In non-inflamed UC, there were no differentially expressed genes that reached statistical significance when compared to symptomatic controls. Compared to healthy controls, however, non-inflamed CD and UC samples revealed 3216 and 3431 DEGs, respectively. The CD and UC results were highly correlated (r = 0.95).
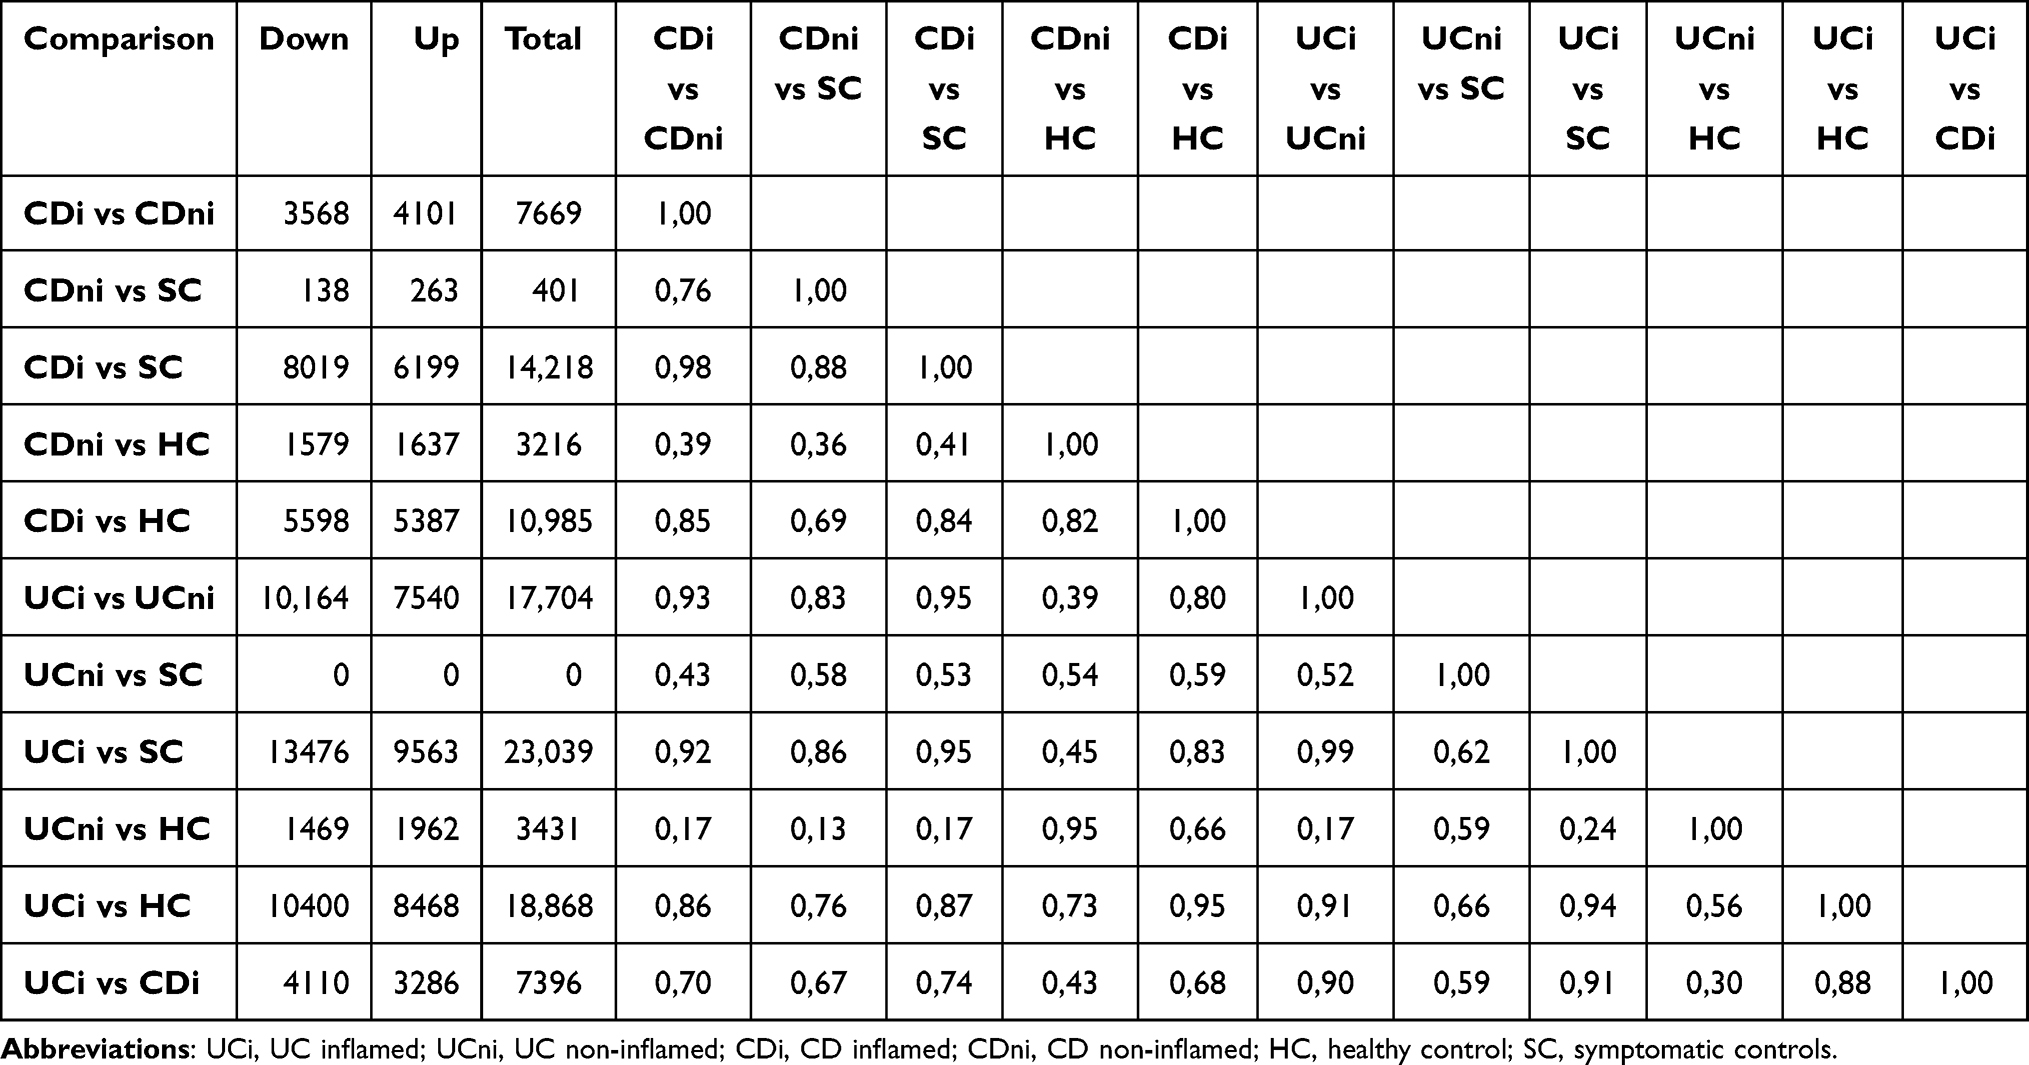 |
Table 2 Number of Differentially Expressed Genes at a 5% False Discovery Rate and the Correlation Between the Comparisons. Up and Down Refers to Whether the Genes are Lower or Higher Expressed in the First Group Compared with the Second |
These data suggest that gene expression profiles of symptomatic individuals resemble that of IBD patients, especially UC, and diverge from that of healthy controls. Hence, healthy controls were used as a reference dataset in the downstream analyses in the two following sections. Since biopsies from healthy controls were obtained from rectum only, all downstream analyses included correction for location effects.
Crohn’s Disease
Hierarchical clustering of DEGs showed extensive heterogeneity in the gene expression signatures from patients with CD. Some tendency of clustering of the inflamed samples was observed. Although the gut segment origin explained much of the variation in the data based on PCA analyses, no systematic clustering of samples from the different locations was found (Figure 2A).
Comparing gene expression status of the inflamed CD tissues with the non-inflamed CD tissues revealed 7669 DEGs (Table 2). Volcano plots show that there was a skewed distribution towards upregulated genes (Figure 2B). Gene Set Enrichment Analyses (GSEA) of the highly differentially regulated genes (log2 FC >±1) revealed that biological processes related to inflammation were overrepresented whereas mitochondrial respiration was underrepresented in inflamed CD samples compared to non-inflamed CD samples (Supplementary Figure 2A). Thus, inflammation had a strong effect on gene expression, consistent with the PCA analyses (Figure 1C).
To test whether the strong influence on global gene expression by active inflammation could mask underlying differences among the diagnosis groups, we compared gene expression between inflamed, and non-inflamed CD, respectably, with healthy controls. The comparison of inflamed CD and healthy controls showed 418 highly dysregulated genes with log2 FC >1 and 197 genes with log2 FC <-1 (Figure 2C). The highest regulated genes (up and down) primarily represented genes involved in transmembrane transport and ion transport. GSEA showed that enrichment of processes related to proliferation in addition to immune responses. Metabolism and vesicle transport were the most significantly underrepresented gene ontology (GO) terms in inflamed CD (Figure 2E).
In non-inflamed CD, few genes were highly dysregulated compared to healthy controls, with only 67 genes with log2 FC >1 and 40 genes with log2 FC <-1 (Figure 2D). Nevertheless, GSEA revealed dysregulation of several processes related to basic cellular functions between non-inflamed CD and healthy controls possibly suggesting underlying differences in gene regulation (Figure 2E). Mitophagy (autophagy of mitochondria), as well as cellular response to vitamin D, were among the most negatively enriched GO terms. Conversely, mitochondrial translation elongation and termination and mitochondrial respiratory chain complex I assembly, were among the most positively enriched GO terms.
Ulcerative Colitis
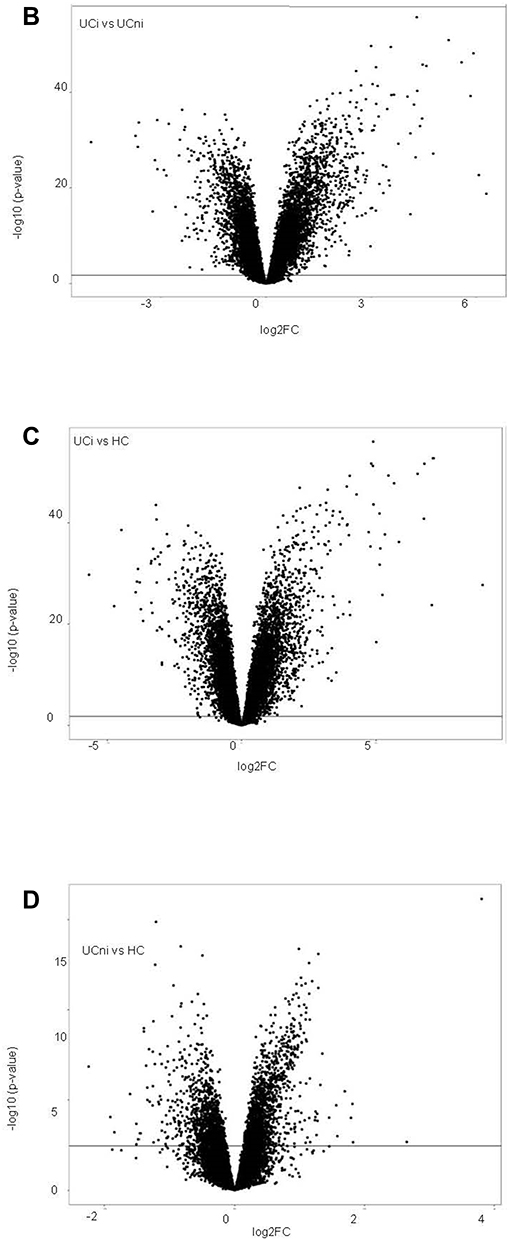
Hierarchical clustering of genes differentially regulated in UC gave a reasonable separation of the inflamed and non-inflamed biopsies (Figure 3A). Differential expressed analysis between inflamed UC and non-inflamed UC, resulted in 17,704 DEGs (Table 2). Volcano plots showed a skewing of the data as 907 genes were strongly upregulated, while only 357 were strongly downregulated (log2 FC >±1) (Figure 3B). GSEA applied to the highly upregulated genes (log2 FC >±1), identified overrepresentation of processes related to inflammation and underrepresentation of biological processes related to mitochondrial respiration in inflamed UC compared to non-inflamed UC, largely overlapping the GSEA results in CD (Supplementary Figure 2B).
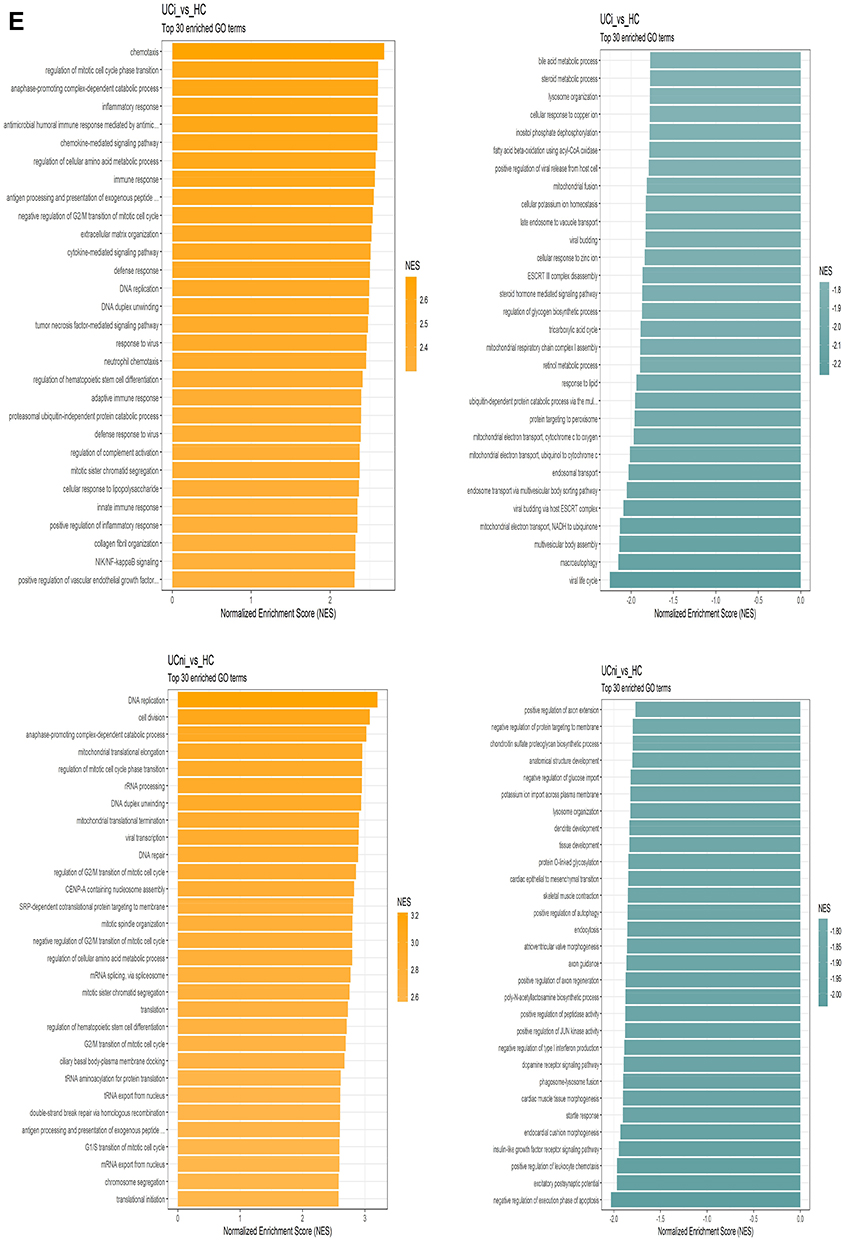
The comparison of inflamed UC and healthy controls showed 1088 genes with log2 FC >1 and 625 genes with log2 FC <-1 (Figure 3C). GSEA showed strong enrichment of processes related to proliferation and immune responses in inflamed UC. The most underrepresented GO terms in inflamed UC were dominated by vesicle transport and mitochondrial functions (Figure 3E).
Comparing non-inflamed UC and healthy controls, 111 highly dysregulated genes were found with 58 genes with log2FC >1 and 53 genes with Log2 FC <-1. Volcano plots showed that there was a slight skewing towards upregulated genes (Figure 3D). GSEA revealed dysregulation of several processes related to basic cellular functions between non-inflamed UC and healthy controls. Mitochondrial translation elongation and termination were among the most positively enriched GO terms (Figure 3E).
Figure 3 Continued. Figure 3 Continued. Figure 3 Ulcerative colitis. (A) Hierarchical clustering of differentially regulated genes. (B) Volcano plot comparing inflamed (UCi) and non-inflamed (UCni) samples in UC. (C) Volcano plot of inflamed biopsies from UC (UCi) compared to healthy controls. (D) Volcano plot of non-inflamed biopsies from UC (UCni) compared to healthy controls. (E) Gene set enrichment analyses given as Normalised Enrichment Scores (NES) in UCi (top panel) and UCni (bottom panel) versus healthy controls. “Orange” represents overrepresented GO terms, with positive NES. “Green” represents underrepresented GO terms, with negative NES. Abbreviations: UCi, inflamed UC; UCni, non-inflamed UC; HC, healthy controls; NES, Normalised Enrichment Score.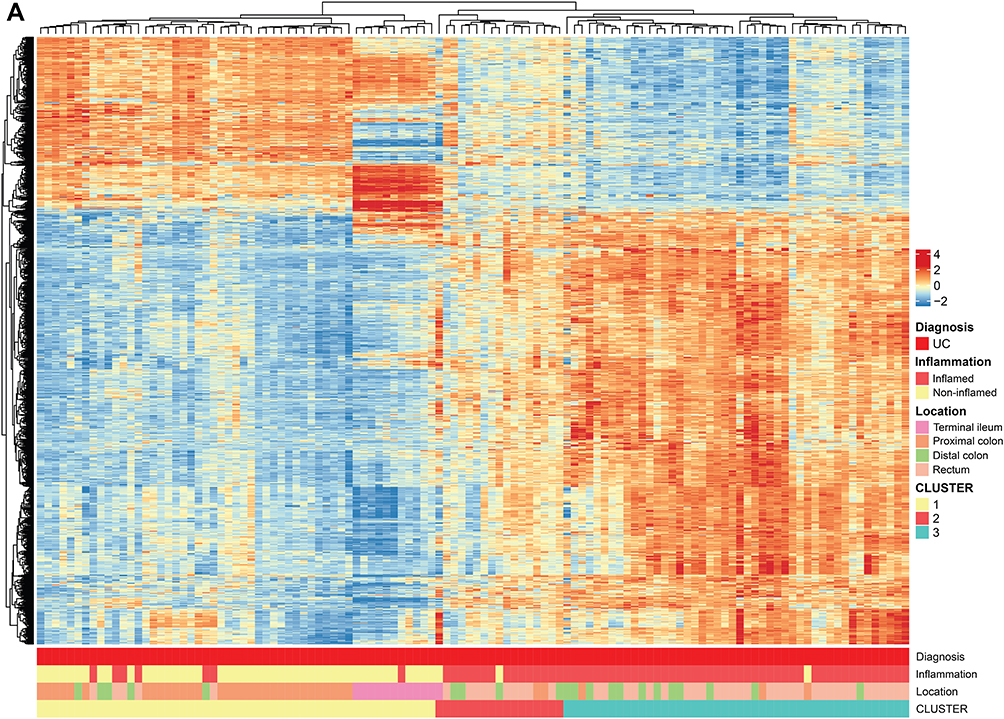
Ulcerative Colitis versus Crohn’s Disease
Comparing inflamed UC with inflamed CD yielded 204 highly (log2FC >±1) differentially expressed transcripts (146 upregulated and 58 downregulated, data not shown). The two gene expression signatures were highly correlated (r = 0.93), supporting that inflammation might mask underlying biological differences among the diagnosis groups. On a biological pathway level, the comparisons involving inflamed biopsies from UC and CD were remarkably similar with respect to normalized enrichment scores, regardless of diagnosis or whether the healthy or symptomatic controls were used in the comparison (Figure 4). In contrast, mitochondria-associated pathways had negative normalized enrichment score (NES) in inflamed UC compared to inflamed CD.
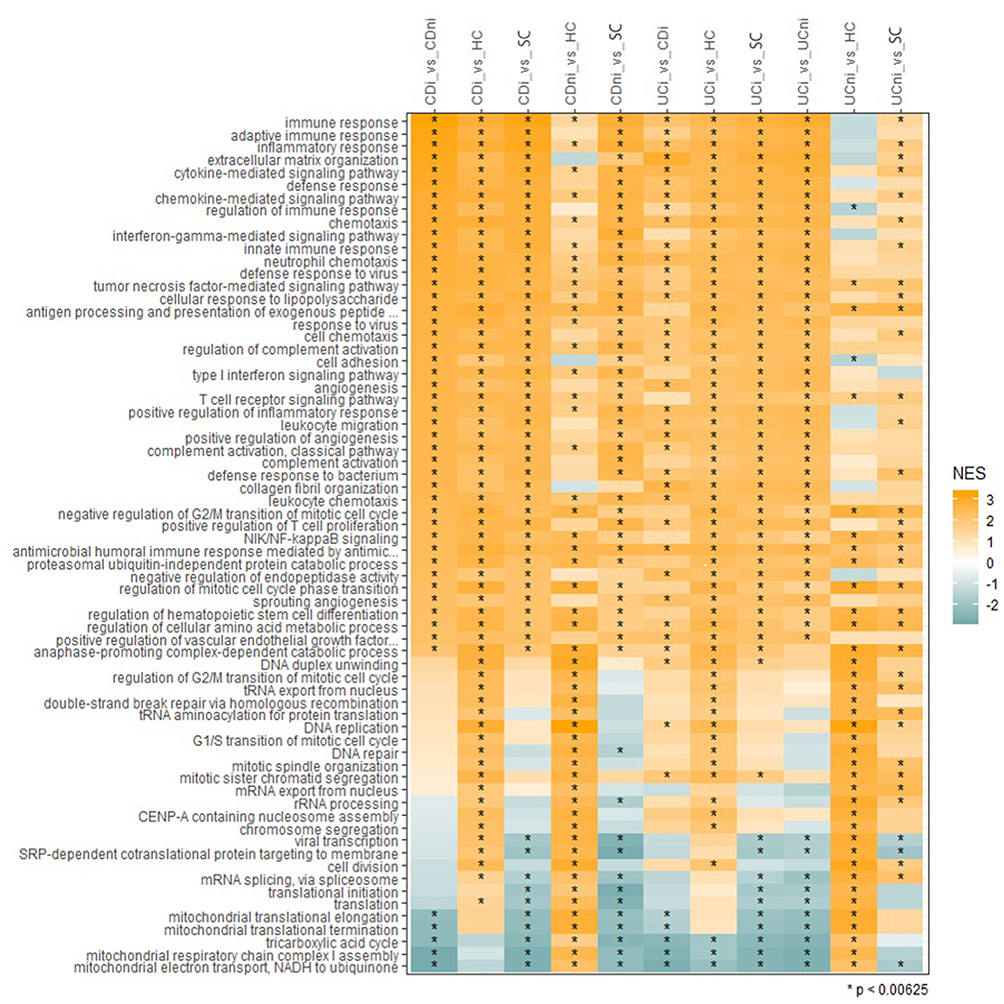 |
Figure 4 Gene set enrichment analyses. Ranking of the biological processes that are among the top 30 enriched in at least two datasets based on Normalized Enrichment Scores (NES). NES scores span from −2 to 3, where negative scores define underrepresented GO terms (green) and positive scores define overrepresented GO terms (Orange). Color intensity correlates with NES score. Significantly regulated biological processes are labelled with an asterisk (*). Abbreviations: CDi, inflamed CD; CDni, non-inflamed CD; UCi, inflamed UC; UCni, non-inflamed UC; SC, symptomatic controls; HC, healthy controls; NES, Normalised Enrichment Score. |
Comparisons of non-inflamed tissue from UC and CD with healthy controls seemed to better reveal underlying biological differences between UC and CD (Figure 4). Non-inflamed UC tissue showed negative NES, or no enrichment, for several processes affecting immune response regulation. However, both showed enrichment of TNFα - and NF-κB signaling. Furthermore, the comparisons of non-inflamed UC or CD with healthy controls revealed shared positive normalized enrichment scores for processes related to cell proliferation, mRNA splicing/translation and mitochondrial respiration, and negative normalized enrichment scores for cell adhesion, extracellular matrix organization and collagen fibril organization.
Taken together, comparing IBD with healthy controls, revealed qualitative and quantitative differences in gene expression signatures. While mostly quantitative differences relating to immune cell activation could be seen in the inflamed biopsies, differences in gene expression signatures in non-inflamed samples suggested underlying biological differences between the diagnosis groups.
Symptomatic Controls
The unique signatures of non-inflamed CD, and non-inflamed CD compared to healthy controls, were not found in the comparison with symptomatic controls (Figure 4). When comparing non-inflamed CD with symptomatic controls, we found an underrepresentation of mitochondrial pathway, which is opposite to the overrepresentation of the same GO terms when compared with healthy controls. In non-inflamed UC, the comparison with symptomatic controls was less discriminative. Nevertheless, some GO terms were significantly different also in this comparison (Figure 4), despite no differentially expressed genes at a 5% false discovery rate (Table 2).
Treatment Escalation and Anti-TNF Response
The median follow-up period was 752 days. Forty-five IBD patients (30%) experienced treatment escalation to anti-TNF agents and/or surgery during the follow-up period. Characteristics and measurements of relevant biomarkers at inclusion to the study according to whether the patient escalated or not, are shown in Supplementary Table 1.
Single-Gene Based Prediction
Transcriptome-wide analysis at 0.05 FDR did not reveal any association between transcription levels of any single gene with need for treatment escalation, when controlled for country, gut segment, or both (data not shown).
Of the genes identified by Lee et al,8 as predictive of treatment escalation in CD, four (FOXO3, HLA-B, IGFBP1 and IGFBP3) were available on the microarray in this study (Supplementary Table 2). Both inflamed and non-inflamed samples from UC and CD were explored. IGFBP1 expression was found to be nominally significant in inflamed UC samples (p = 0.045), possibly predicting treatment escalation. No significant difference in expression level was found for the candidate transcripts FOXO3, HLA-B and IGFBP3 when comparing samples from escalators and non-escalators.
Forty-two IBD patients (30 CD, 12 UC) underwent treatment escalation to anti-TNF agents. We could not find any significant association between single transcripts and anti-TNF response among these patients (data not shown).
Prediction of Treatment Escalation by Gene Set Signatures
The analyses above illustrate the limited power of gene expression changes of single genes to predict functional impact, which is reasonable as compensation and balancing of single-gene expression changes occur at several levels in biological systems. Thus, we explored whether the distinct signatures revealed by hierarchical clustering of the DEGs in CD and UC (Figures 2A and 3A, respectively) were correlated with the need of treatment escalation. As the above analyses suggested that the inflammation might mask underlying differences in gene regulation between the diagnosis groups, we performed analyses of the non-inflamed and inflamed samples falling in the same clusters for CD and UC, separately.
In non-inflamed CD, none of the patients in cluster 2 experienced treatment escalation. In contrast, 16 out of 38, and 7 out of 19 patients escalated in cluster 1, and cluster 3, respectively (Supplementary Figure 3A). However, the difference in clinical outcome between clusters was not statistically significant (p = 0.175).
In non-inflamed UC, there were also no statistical significance (p = 0.832) when comparing gene expression signatures and their relation to treatment escalation (Supplementary Figure 3A). Further, the inflamed biopsies did not predict need for or time to treatment escalation, neither in CD nor in UC (Supplementary Figure 3B).
Prediction of Anti-TNF Response by Gene Set Signatures
We explored whether the distinct signatures revealed by hierarchical clustering of the DEGs in UC and CD (Figures 2A and 3A, respectively) were correlated with anti-TNF response. When analyzing non-inflamed and inflamed samples separately for UC and CD, no signatures were found to predict anti-TNF response or anti-TNF remission (data not shown).
Prediction of Treatment Escalation and Anti-TNF Response by Pathway Signatures
It has been proposed that dysregulation of signaling pathways, might better predict the changes likely to have functional impact. Thus, to identify novel differentially regulated pathways in the IBD patients, we used PathTracer which has been shown to reveal subtle changes in pathway activity in cancer data.33 A PathScore heatmap (Supplementary Figure 3B) showed six clusters with different patterns of high and low dysregulation scores. An expected enrichment of pathways with high dysregulation scores of inflammatory responses, kRAS signaling, IFN-γ response and TNF-α signaling in inflamed samples of UC, CD and IBD-U from different locations were found (Supplementary Figure 4A). PathTracer scores did not separate UC and CD, but separated IBD from symptomatic and healthy controls.
On group level, the PathTracer clusters that separated high and low inflammatory response dysregulation scores (Supplementary Figure 4B) did not predict time for treatment escalation (Supplementary Figure 4C), although dysregulation scores of hypoxia and unfolded protein response pathways predicted need for treatment escalation in inflamed mucosa in UC (HR 1.2, p = 0.02, and HR 1.3, p = 0.01, respectively).
Cluster analyses based on pathway signature analyses revealed no association between the mucosal transcriptome and anti-TNF response, as the transcripts of patients exposed to anti-TNF therapy were scattered and there was no systematic clustering separating responders from non-responders (Supplementary Figure 4A).
Discussion
In accordance with earlier studies, location,34 and inflammation status,35,36 were important drivers of the transcriptome signatures separating the samples. In inflamed tissue, the immune responses appear to mask potentially important biological differences. Our study adds to the present knowledge by suggesting that the non-inflamed areas of the intestine, close to the inflammation, could have an even higher biomarker potential than inflamed tissue alone, supporting earlier studies demonstrating distinct gene expression profiles in non-inflamed tissue.15,35,37,38
In the present study, the non-inflamed samples from both CD and UC revealed dysregulation of a large spectrum of biological pathways. Potent inflammatory pathways, as TNF-α signaling, were dysregulated. In non-inflamed CD, cellular response to vitamin D was among the top hits of negatively enriched GO terms, strengthening the knowledge base of vitamin D as a central factor in the pathogenesis of CD.39 Of note, major disturbances in mitochondria-associated pathways were also found in non-inflamed biopsies from patients with CD and UC, compared to healthy controls, suggesting a widespread disturbance of intestinal energy regulation.
The molecular mechanistic background for mitochondrial dysfunction in the pathogenesis of IBD has been demonstrated both in CD and UC. Sünderhauf et al40 recently showed how mitochondrial functions are essential for normal differentiation of mucin-producing Goblet cells, and how this mechanism was dysregulated in UC patients in remission, supporting the concept of UC as a barrier disease, and underscoring the value of investigating non-inflamed samples to avoid blurring of patterns caused by general inflammatory drive. The link between mitochondrial dysfunction and a weakened mucosal barrier has also been investigated in non-inflamed CD by Khaloian et al.41 Khaloian et al revealed mitochondrial dysfunctions to impact epithelial cell differentiation, leading to the development of aberrant Paneth cells with reduced barrier function properties.
In a publication by Haberman et al, suppression of mucosal mitochondrial functions was demonstrated in active UC.38 In the present study, we present data that support dysregulation of mitochondrial functions also in non-inflamed UC samples. Furthermore, underrepresentation of GO terms related to mitochondrial function can also be seen in CD when comparing inflamed to non-inflamed CD samples and when comparing inflamed CD samples to healthy controls. Conversely, the non-inflamed samples in CD and UC showed enrichment of biological processes related to mitochondrial function compared to healthy controls.
Furthermore, when non-inflamed CD and UC samples were compared to healthy controls, negative enrichment scores for cell adhesion, extracellular matrix organization, and collagen fibril organization were found for both CD and UC, demonstrating dysregulation of pathways central for maintenance of robust gut barrier functions. Taken together, the present study supports a role of mitochondrial dysfunction and barrier dysfunction in the pathogenesis of both CD and UC.
In this study, we have used two well-defined control groups, both symptomatic and healthy controls. The symptomatic controls represented a large control group and were mainly (78%) represented by patients with irritable bowel syndrome (IBS). Our data demonstrated that the tissue responses among symptomatic controls resemble IBD on a transcript level. Furthermore, the comparisons between IBD and symptomatic controls presented pathway signatures that were less influenced by inflammatory status of the IBD-biopsy, than the comparisons with healthy controls. With respect to GO terms, we found differences in mitochondria-related pathways in the comparisons of IBD-samples with healthy controls and symptomatic controls, respectively. This finding might indicate similarities between IBS and IBD in context of a dysfunctional gut barrier. Interestingly, there have also been demonstrated major similarities in fecal microbiota composition between IBD and symptomatic controls in the IBD-character cohort, while the healthy controls separated to a greater extent.42 The diagnostic approach of IBS are symptom-driven, based on the Rome IV criteria.43 IBS has been reported to affect approximately 10–20% of the population globally,44,45 and severe morbidity, high economic costs and reduced quality of life have been reported among these patients.46,47 The therapeutic armamentarium available for IBD patients has steadily expanded the last years. Unfortunately, this has not been the case for IBS. The unravelling of molecular patterns in symptomatic controls, could be a source to mine for biomarkers and novel therapeutic targets also for patients with irritable bowel syndrome (IBS). This is the first study with a large number of well-defined symptomatic controls, demonstrating the large mucosal transcriptional overlap with IBD in this group, compared to healthy individuals. These findings emphasize the importance of having strict criteria when defining a control group, securing homogeneity.
Development of personalized treatment strategies, based on molecular markers, is a central aim in IBD research.14,48 However, at present, there are no reliable biomarkers to guide individually tailored treatment options. In the present paper, we presented transcriptomic profiling of newly diagnosed IBD patients with an aim of finding marker genes or marker clusters predicting treatment escalation, as well as response to anti-TNF agents.
The four genes identified by Lee et al,8 as predictive of prognosis in CD, were available on the microarray in this study (Supplementary Table 2). Among them, IGFBP1 expression was found to be associated with treatment escalation in inflamed UC samples (p = 0.045). IGFBP1 has been demonstrated to prolong the half-lives of insulin-like growth factors I and II; proteins involved in processes including immunity.49 A previous study also demonstrated a connection between IGFBP1 loci and prognosis in rheumatoid arthritis, another immune-mediated disease.50 Taken together, these results are suggestive of a common involvement of the IGFBP1 locus in IBD and rheumatoid arthritis, with a substantial impact on prognosis.
We further explored if gene expression signatures could predict treatment escalation without making significant findings. Nevertheless, in non-inflamed CD, the hierarchical cluster analyses might be suggestive of a potential to predict clinical outcome as none of the patients in gene set cluster 2 experienced treatment escalation. Noteworthy, the most discriminative transcripts, generating the clustering were DEFB4A, encoding antimicrobial peptides, and PCK1, encoding the metabolic enzyme phosphoenolpyruvate carboxykinase, an integral in energy metabolism. Studies have already revealed PCK1 to be involved in inflammation. Ko et al51 found that a deletion of the PCK1 gene gave a more proinflammatory phenotype when they explored metabolism of macrophages. We find it interesting that expression of transcripts involved in mitochondrial functions and barrier functions are dominating the clustering, even though the comparison of the signatures regarding their inclination to treatment escalation did not reach statistical significance.
The role of the transcriptome as a predictor of anti-TNF response has been extensively investigated. Some studies find signatures,21,23 others do not.20 In a multi-omic study of treatment naïve pediatric IBD patients, distinct transcriptome signatures at diagnosis were found to predict treatment escalation to anti-TNF-therapy, and anti-TNF response.37 Kugathasan et al, also studying a pediatric CD cohort, found gene expression signatures to be related to clinical outcome in an integrative model.10 In our study, no single gene association could be found to predict treatment response to anti-TNF agents. Furthermore, we did not identify gene set signatures or pathway signatures predicting anti-TNF response in CD or UC.
A strength regarding the anti-TNF response evaluation in this study, is the use of objective markers as f-calprotectin and CRP to assess response, more robust than symptom-based scoring alone (clinical activity indices as HBI and partial Mayo score). Nevertheless, there might be a potential to include more stringent criteria, defining remission, rather than response, to identify predictive gene expression signatures, as implemented in the PANTS study by Kennedy et al.52
The gut transcriptome is highly influenced by inflammation status,35,36 bowel segment34 and medical treatment.21,25,53,54 A strength of this study is, therefore, the use of a standardized protocol for biopsy sampling during ileocolonoscopy in this treatment naïve cohort. Strong influence on gene expression by active inflammation could mask underlying differences among the diagnosis groups, reinforcing the importance of a standardized protocol for biopsy sampling.55,56 The sampling of both inflamed and non-inflamed samples made it possible to look for precursor molecular changes in the ileocolonic mucosa close to segments with active inflammation. The patients were newly diagnosed, mainly treatment naïve (>92%), and the impact of a longstanding inflammation on the transcriptome, could possibly be less dominant in this cohort.
A limitation in the present study is the lack of application of endoscopic severity scores such as Simple endoscopic score for CD and endoscopic Mayo score, as well as histopathological evaluation, to grade inflammation in the mucosal biopsies, as earlier studies have demonstrated these factors influence on the gene expression profiles.38,57 This could restrict the opportunity to classify molecular phenotypes and relate these molecular phenotypes to endoscopic and histological phenotype, probably playing an important role when performing treatment response analyses.
In conclusion, gene expression signatures of the non-inflamed tissue in treatment naïve CD and UC reveal dysregulation of biological pathways that might potentially be central in disease initiation and prognosis. In particular, major disturbances in mitochondria-associated pathways and barrier dysfunction were confirmed. The gene expression signatures of the control groups were related to if they were symptomatic or not, which may have important implications for future study designs. Larger studies of treatment-naïve IBD with standardized sampling and prospective follow-up of clinical outcome are relevant to identify gene expression signatures applicable for supporting clinical decision-making.
Abbreviations
CD, Crohn’s disease; DEFB4A, defensin, beta 4A; DEG, differentially expressed gene; FDR, false discovery rate; FOX03, forkhead box 03; GO, gene ontology; GSEA, gene set enrichment analysis; HBI, Harvey-Bradshaw Index; HC, healthy controls; HLA-B, human leucocyte antigen B; IBD, inflammatory bowel disease; IBD-U, inflammatory bowel disease unclassified; IBS, irritable bowel syndrome) IGFBP1, insulin-like growth factor binding protein 1; IGFBP3, insulin-like growth factor binding protein 3; PCK1, phosphoenolpyruvate carboxykinase 1; UC, ulcerative colitis; SC, symptomatic controls.
Data Transparency
Clinical and descriptive data of the cohort, analytic methods, and microarray raw data can be shared on request to the corresponding author ([email protected]) with permission from the IBD Character data access committee.
Acknowledgments
The authors thank the IBD-Character Consortium for contributions in study conception and design: Elaine R Nimmo, Hazel E Drummond, Ray K Boyapati, Nicholas T Ventham, Nicholas A Kennedy, David C Wilson, Charles W Lees, Colin L Noble, Ian D Arnott, Gwo-Tzer Ho, Alan G Shand, Kate R O’Leary, Anna Frengen, Panpan You, Janne Sølvernes, Fredrik A Dahl, Gunn S Ekeland, Haldor Husby, Johan D Söderholm, Henrik Hjortswang, Mauro D’Amato, Leif Törkvist, Christina Casén, Magdalena K Karlsson, Fredrik Hjelm, Mats Gullberg, Niklas Nordberg, Anette Ocklind, Erik Pettersson, Daniel Ekman, Mikael Sundell, Eddie Modig, Anne-Clémance Veillard, Renaud Schoemans, Dominique Poncelet, Céline Sabatel, Ivo G Gut, Marta Gut, Simon Heath, Monica Bayes, Angelika Merkel, and Ferdinando Bonfiglio.
Funding
The study was funded by the following EU FP7 grant: IBD-CHARACTER (contract # 2858546). PR and SV were funded by South-Eastern Norway Regional Health Authority (project numbers 2014011 and 2018001).
Disclosure
Prof. Dr. Stephan Brackmann reports personal fees from Athna/Pharmanovia, personal fees from Augere medical, outside the submitted work. Dr Daniel Bergemalm reports grants from EU FP7 grant, during the conduct of the study; personal fees from Pfizer, personal fees from Janssen, personal fees from Ferring, outside the submitted work. Professor Fernando Gomollon reports grants, personal fees from TAKEDA, grants and personal fees from JANSSEN, grants, personal fees from ABBVIE, personal fees from PFIZER, outside the submitted work. Dr Trond Espen Detlie reports personal fees from Ferring, personal fees from Tillotts, personal fees from Pharmacosmos, personal fees from Vifor Pharma, outside the submitted work. Prof. Dr. Jonas Halfvarson reports grants from EU, during the conduct of the study; grants, personal fees from Janssen, grants, personal fees from Takeda, grants, personal fees from MSD, personal fees from AbbVie, personal fees from Aqilion, personal fees from Celgene, personal fees from Celltrion, personal fees from Ferring, personal fees from Gilead, personal fees from Index Pharma, personal fees from Lincs, personal fees from Novartis, non-financial support from Olink Proteomics, personal fees from Pfizer, personal fees from Prometheus Laboratories Inc., personal fees from Sandoz, personal fees from Shire, personal fees from Thermo Fisher Scientific, personal fees from Tillotts Pharma, personal fees from Vifor Pharma, outside the submitted work. The authors declare no other conflicts of interest to this work.
References
1. Gionchetti P, Dignass A, Danese S, et al. 3rd European evidence-based consensus on the diagnosis and management of Crohn’s Disease 2016: part 2: surgical management and special situations. J Crohn’s Colitis. 2016;11(2):135–149. doi:10.1093/ecco-jcc/jjw169
2. Magro F, Gionchetti P, Eliakim R, et al. Third European Evidence-based consensus on diagnosis and management of ulcerative colitis. part 1: definitions, diagnosis, extra-intestinal manifestations, pregnancy, cancer surveillance, surgery, and ileo-anal pouch disorders. J Crohns Colitis. 2017;11(6):649–670. doi:10.1093/ecco-jcc/jjx008
3. Gomollón F, Dignass A, Annese V, et al. 3rd European evidence-based consensus on the diagnosis and management of crohn’s disease 2016: part 1: diagnosis and medical management. J Crohn’s Colitis. 2016;11(1):3–25. doi:10.1093/ecco-jcc/jjw168
4. Beaugerie L, Seksik P, Nion-Larmurier I, Gendre JP, Cosnes J. Predictors of Crohn’s disease. Gastroenterology. 2006;130(3):650–656. doi:10.1053/j.gastro.2005.12.019
5. Monstad I, Hovde O, Solberg IC. Clinical course and prognosis in ulcerative colitis: results from population-based and observational studies. Ann Gastroenterol. 2014;27(2):95–104.
6. Thia KT, Sandborn WJ, Harmsen WS, Zinsmeister AR, Loftus EV
7. Biasci D, Lee JC, Noor NM, et al. A blood-based prognostic biomarker in IBD. Gut. 2019;68(8):1386–1395. doi:10.1136/gutjnl-2019-318343
8. Lee JC, Biasci D, Roberts R, et al. Genome-wide association study identifies distinct genetic contributions to prognosis and susceptibility in Crohn’s disease. Nat Genet. 2017;49(2):262–268. doi:10.1038/ng.3755
9. Lee JC, Lyons PA, McKinney EF, et al. Gene expression profiling of CD8+ T cells predicts prognosis in patients with Crohn disease and ulcerative colitis. J Clin Invest. 2011;121(10):4170–4179. doi:10.1172/JCI59255
10. Kugathasan S, Denson LA, Walters TD, et al. Prediction of complicated disease course for children newly diagnosed with Crohn’s disease: a multicentre inception cohort study. Lancet. 2017;389(10080):1710–1718. doi:10.1016/S0140-6736(17)30317-3
11. Peck BC, Weiser M, Lee SE, et al. MicroRNAs classify different disease behavior phenotypes of crohn’s disease and may have prognostic utility. Inflamm Bowel Dis. 2015;21(9):2178–2187. doi:10.1097/MIB.0000000000000478
12. Zhang H, Zeng Z, Mukherjee A, Shen B. Molecular diagnosis and classification of inflammatory bowel disease. Expert Rev Mol Diagn. 2018;18(10):867–886. doi:10.1080/14737159.2018.1516549
13. Lee H-S, Cleynen I. Molecular profiling of inflammatory bowel disease: is it ready for use in clinical decision-making? Cells. 2019;8(6):535. doi:10.3390/cells8060535
14. Borg-Bartolo SP, Boyapati RK, Satsangi J, Kalla R. Precision medicine in inflammatory bowel disease: concept, progress and challenges. F1000Res. 2020;9:F1000 Faculty Rev–54. doi:10.12688/f1000research.20928.1
15. Häsler R, Sheibani-Tezerji R, Sinha A, et al. Uncoupling of mucosal gene regulation, mRNA splicing and adherent microbiota signatures in inflammatory bowel disease. Gut. 2017;66(12):2087. doi:10.1136/gutjnl-2016-311651
16. Dooley TP, Curto EV, Reddy SP, et al. Regulation of gene expression in inflammatory bowel disease and correlation with IBD drugs: screening by DNA microarrays. Inflamm Bowel Dis. 2004;10(1):1–14. doi:10.1097/00054725-200401000-00001
17. Costello CM, Mah N, Häsler R, et al. Dissection of the inflammatory bowel disease transcriptome using genome-wide cDNA microarrays. PLoS Med. 2005;2(8):e199. doi:10.1371/journal.pmed.0020199
18. Sipos F, Galamb O, Wichmann B, et al. Peripheral blood based discrimination of ulcerative colitis and Crohn’s disease from non-IBD colitis by genome-wide gene expression profiling. Dis Markers. 2011;30(1):1–17. doi:10.1155/2011/756290
19. Wu F, Dassopoulos T, Cope L, et al. Genome-wide gene expression differences in Crohn’s disease and ulcerative colitis from endoscopic pinch biopsies: insights into distinctive pathogenesis. Inflamm Bowel Dis. 2007;13(7):807–821. doi:10.1002/ibd.20110
20. Telesco SE, Brodmerkel C, Zhang H, et al. Gene expression signature for prediction of golimumab response in a Phase 2a open-label trial of patients with ulcerative colitis. Gastroenterology. 2018;155(4):1008–11.e8. doi:10.1053/j.gastro.2018.06.077
21. Toedter G, Li K, Marano C, et al. Gene expression profiling and response signatures associated with differential responses to infliximab treatment in ulcerative colitis. Am J Gastroenterol. 2011;106(7):1272–1280. doi:10.1038/ajg.2011.83
22. West NR, Hegazy AN, Owens BMJ, et al. Oncostatin M drives intestinal inflammation and predicts response to tumor necrosis factor–neutralizing therapy in patients with inflammatory bowel disease. Nat Med. 2017;23:579. doi:10.1038/nm.4307
23. Rismo R, Olsen T, Cui G, Christiansen I, Florholmen J, Goll R. Mucosal cytokine gene expression profiles as biomarkers of response to infliximab in ulcerative colitis. Scand J Gastroenterol. 2012;47(5):538–547. doi:10.3109/00365521.2012.667146
24. Halloran B, Chang J, Shih DQ, et al. Molecular patterns in human ulcerative colitis and correlation with response to infliximab. Inflamm Bowel Dis. 2014;20(12):2353–2363. doi:10.1097/MIB.0000000000000239
25. Arijs I, Quintens R, Van Lommel L, et al. Predictive value of epithelial gene expression profiles for response to infliximab in Crohn’s disease. Inflamm Bowel Dis. 2010;16(12):2090–2098. doi:10.1002/ibd.21301
26. IBD-Character consortium; 2020. Available from: https://cordis.europa.eu/project/rcn/106191_en).htm.
27. Mokrowiecka A, Kumor A, Jakubczyk E, Pietruczuk M, Malecka-Panas E. The application of Montreal classification in different clinical and serological IBD subtypes. Hepatogastroenterology. 2010;57(101):787–793.
28. Satsangi J, Silverberg MS, Vermeire S, Colombel JF. The Montreal classification of inflammatory bowel disease: controversies, consensus, and implications. Gut. 2006;55(6):749–753. doi:10.1136/gut.2005.082909
29. Harbord M, Eliakim R, Bettenworth D, et al. Third European evidence-based consensus on diagnosis and management of ulcerative colitis. Part 2: current management. J Crohn’s Colitis. 2017;11(7):769–784. doi:10.1093/ecco-jcc/jjx009
30. Osipenko MF, Livzan MA, Skalinskaya MI, Lyalyukova EA. [Fecal calprotectin concentration in the differential diagnosis of bowel diseases]. Ter Arkh. 2015;87(2):30–33. Russian. doi:10.17116/terarkh201587230-33
31. Ritchie ME, Phipson B, Wu D, et al. limma powers differential expression analyses for RNA-sequencing and microarray studies. Nucleic Acids Res. 2015;43(7):e47–e. doi:10.1093/nar/gkv007
32. Liberzon A, Birger C, Thorvaldsdóttir H, Ghandi M, Mesirov JP, Tamayo P. The Molecular Signatures Database (MSigDB) hallmark gene set collection. Cell Syst. 2015;1(6):417–425. doi:10.1016/j.cels.2015.12.004
33. Nygård S, Lingjærde OC, Caldas C, et al. PathTracer: high-sensitivity detection of differential pathway activity in tumours. Sci Rep. 2019;9(1):16332. doi:10.1038/s41598-019-52529-3
34. Noble CL, Abbas AR, Cornelius J, et al. Regional variation in gene expression in the healthy colon is dysregulated in ulcerative colitis. Gut. 2008;57(10):1398–1405. doi:10.1136/gut.2008.148395
35. Noble CL, Abbas AR, Lees CW, et al. Characterization of intestinal gene expression profiles in Crohn’s disease by genome-wide microarray analysis. Inflamm Bowel Dis. 2010;16(10):1717–1728. doi:10.1002/ibd.21263
36. Xu L, Ma L, Lian J, Yang J, Chen S. Gene expression alterations in inflamed and unaffected colon mucosa from patients with mild inflammatory bowel disease. Mol Med Rep. 2016;13(3):2729–2735. doi:10.3892/mmr.2016.4880
37. Howell KJ, Kraiczy J, Nayak KM, et al. DNA methylation and transcription patterns in intestinal epithelial cells from pediatric patients with inflammatory bowel diseases differentiate disease subtypes and associate with outcome. Gastroenterology. 2018;154(3):585–598. doi:10.1053/j.gastro.2017.10.007
38. Haberman Y, Karns R, Dexheimer PJ, et al. Ulcerative colitis mucosal transcriptomes reveal mitochondriopathy and personalized mechanisms underlying disease severity and treatment response. Nat Commun. 2019;10(1):38. doi:10.1038/s41467-018-07841-3
39. Mouli VP, Ananthakrishnan AN. Review article: vitamin D and inflammatory bowel diseases. Aliment Pharmacol Ther. 2014;39(2):125–136. doi:10.1111/apt.12553
40. Sünderhauf A, Hicken M, Schlichting H, et al. Loss of mucosal p32/gC1qR/HABP1 triggers energy deficiency and impairs goblet cell differentiation in ulcerative colitis. Cell Mol Gastroenterol Hepatol. 2021;12(1):229–250. doi:10.1016/j.jcmgh.2021.01.017
41. Khaloian S, Rath E, Hammoudi N, et al. Mitochondrial impairment drives intestinal stem cell transition into dysfunctional Paneth cells predicting Crohn’s disease recurrence. Gut. 2020;69(11):1939–1951. doi:10.1136/gutjnl-2019-319514
42. Vatn S, Carstens A, Kristoffersen AB, et al. Faecal microbiota signatures of IBD and their relation to diagnosis, disease phenotype, inflammation, treatment escalation and anti-TNF response in a European Multicentre Study (IBD-Character). Scand J Gastroenterol. 2020;10:1–11.
43. Drossman DA, Hasler WL. Rome IV-functional GI disorders: disorders of gut-brain interaction. Gastroenterology. 2016;150(6):1257–1261. doi:10.1053/j.gastro.2016.03.035
44. Gwee KA, Ghoshal UC, Chen M. Irritable bowel syndrome in Asia: pathogenesis, natural history, epidemiology, and management. J Gastroenterol Hepatol. 2018;33(1):99–110. doi:10.1111/jgh.13987
45. Canavan C, West J, Card T. The epidemiology of irritable bowel syndrome. Clin Epidemiol. 2014;6:71–80. doi:10.2147/CLEP.S40245
46. Cassar GE, Youssef GJ, Knowles S, Moulding R, Austin DW. Health-related quality of life in irritable bowel syndrome: a systematic review and meta-analysis. Gastroenterol Nurs. 2020;43(3):E102–e22. doi:10.1097/SGA.0000000000000530
47. Buono JL, Carson RT, Flores NM. Health-related quality of life, work productivity, and indirect costs among patients with irritable bowel syndrome with diarrhea. Health Qual Life Outcomes. 2017;15(1):35. doi:10.1186/s12955-017-0611-2
48. McGovern D. Personalized medicine in inflammatory bowel disease. Gastroenterol Hepatol (N Y). 2014;10(10):662–664.
49. Franceschi C, Olivieri F, Marchegiani F, et al. Genes involved in immune response/inflammation, IGF1/insulin pathway and response to oxidative stress play a major role in the genetics of human longevity: the lesson of centenarians. Mech Ageing Dev. 2005;126(2):351–361. doi:10.1016/j.mad.2004.08.028
50. Padyukov L, Seielstad M, Ong RT, et al. A genome-wide association study suggests contrasting associations in ACPA-positive versus ACPA-negative rheumatoid arthritis. Ann Rheum Dis. 2011;70(2):259–265. doi:10.1136/ard.2009.126821
51. Ko CW, Counihan D, Wu J, Hatzoglou M, Puchowicz MA, Croniger CM. Macrophages with a deletion of the phosphoenolpyruvate carboxykinase 1 (Pck1) gene have a more proinflammatory phenotype. J Biol Chem. 2018;293(9):3399–3409. doi:10.1074/jbc.M117.819136
52. Kennedy NA, Heap GA, Green HD, et al. Predictors of anti-TNF treatment failure in anti-TNF-naive patients with active luminal Crohn’s disease: a prospective, multicentre, cohort study. Lancet Gastroenterol Hepatol. 2019;5:341–353
53. Planell N, Lozano JJ, Mora-Buch R, et al. Transcriptional analysis of the intestinal mucosa of patients with ulcerative colitis in remission reveals lasting epithelial cell alterations. Gut. 2013;62(7):967–976. doi:10.1136/gutjnl-2012-303333
54. Mäkitalo L, Sipponen T, Kärkkäinen P, Kolho KL, Saarialho-Kere U. Changes in matrix metalloproteinase (MMP) and tissue inhibitors of metalloproteinases (TIMP) expression profile in Crohn’s disease after immunosuppressive treatment correlate with histological score and calprotectin values. Int J Colorectal Dis. 2009;24(10):1157–1167. doi:10.1007/s00384-009-0756-5
55. Ouahed J, Gordon W, Canavan JB, et al. Mucosal gene expression in pediatric and adult patients with ulcerative colitis permits modeling of ideal biopsy collection strategy for transcriptomic analysis. Inflamm Bowel Dis. 2018;24(12):2565–2578. doi:10.1093/ibd/izy242
56. Granlund A, Flatberg A, Østvik AE, et al. Whole genome gene expression meta-analysis of inflammatory bowel disease colon mucosa demonstrates lack of major differences between Crohn’s disease and ulcerative colitis. PLoS One. 2013;8(2):e56818. doi:10.1371/journal.pone.0056818
57. Camarillo GF, Goyon EI, Zuñiga RB, Salas LAS, Escárcega AEP, Yamamoto-Furusho JK. Gene expression profiling of mediators associated with the inflammatory pathways in the intestinal tissue from patients with ulcerative colitis. Mediators Inflamm. 2020;2020:9238970. doi:10.1155/2020/9238970
 © 2022 The Author(s). This work is published and licensed by Dove Medical Press Limited. The
full terms of this license are available at https://www.dovepress.com/terms
and incorporate the Creative Commons Attribution
- Non Commercial (unported, 3.0) License.
By accessing the work you hereby accept the Terms. Non-commercial uses of the work are permitted
without any further permission from Dove Medical Press Limited, provided the work is properly
attributed. For permission for commercial use of this work, please see paragraphs 4.2 and 5 of our Terms.
© 2022 The Author(s). This work is published and licensed by Dove Medical Press Limited. The
full terms of this license are available at https://www.dovepress.com/terms
and incorporate the Creative Commons Attribution
- Non Commercial (unported, 3.0) License.
By accessing the work you hereby accept the Terms. Non-commercial uses of the work are permitted
without any further permission from Dove Medical Press Limited, provided the work is properly
attributed. For permission for commercial use of this work, please see paragraphs 4.2 and 5 of our Terms.