Back to Journals » OncoTargets and Therapy » Volume 8
Morphologic patterns and imaging features of intracranial hemangiopericytomas: a retrospective analysis
Authors Pang H ![]() , Yao Z, Ren R, Liu G, Zhang J, Feng X
, Yao Z, Ren R, Liu G, Zhang J, Feng X
Received 2 April 2015
Accepted for publication 12 June 2015
Published 20 August 2015 Volume 2015:8 Pages 2169—2178
DOI https://doi.org/10.2147/OTT.S85971
Checked for plagiarism Yes
Review by Single anonymous peer review
Peer reviewer comments 2
Editor who approved publication: Professor Daniele Santini
Haopeng Pang,1 Zhenwei Yao,1 Yan Ren,1 Guobing Liu,2 Jiawen Zhang,1 Xiaoyuan Feng1
1Department of Radiology, Affiliated Huashan Hospital of Fudan University, People’s Republic of China; 2Department of Nuclear Medicine, Zhongshan Hospital, Fudan University, Shanghai, People’s Republic of China
Objectives: Hemangiopericytomas (HPCs) are rare intracranial tumors. Their differential diagnosis using computed tomography (CT) and magnetic resonance imaging (MRI) is difficult because of similarities in morphologic features with other intracranial tumors and meningiomas.
Methods: We retrospectively analyzed the clinical data and CT and MRI findings of 32 patients diagnosed with HPCs via histopathology. We evaluated the location, shape, morphologic patterns, density, and signal intensity of the tumors and classified them into four types.
Results: The number of tumors analyzed was 32; 29 were supratentorial and three were infratentorial. Eighteen tumors were lobular, while 14 were oval in shape. Further, 28 tumors had cystic areas, and 16 had signal-void vessels. Among the 20 tumors that had been scanned by MRI; eleven showed isointensity, eight slight hyperintensity, and one slight hypointensity on T1-weighted image. Moreover, 12 showed isointensity, and eight showed slight hyperintensity on T2-weighted image and T2-weighted-fluid-attenuated-inversion recovery. Diffusion-weighted images showed isointensity (9/13) or slight hyperintensity (4/13). Of the 15 tumors scanned by contrast-enhanced MRI, one showed poor enhancement; six, moderate enhancement; and eight, intense enhancement. Only one tumor exhibited the “dural tail” sign. Moreover, calcification was observed in just one tumor on CT imaging (1/22). All tumors (5/5) showed intense enhancement on CT angiography, whereas some exhibited dual blood supply (2/5).
Conclusion: We conclude that tumors present outside the brain parenchyma, with isointense to slightly intense regions on MRI scans, oval/lobular shape, well-/ill-defined margins, signal-void vessels, apparent cystic areas, dual blood supply, and intense enhancement on CT or MRI scans, but without calcification or a “dural tail” sign, may be diagnosed as HPCs.
Keywords: hemangiopericytoma, computed tomography, magnetic resonance imaging
Introduction
Hemangiopericytomas (HPCs) are rare tumors occurring in the walls of capillary blood vessels throughout the body,1 but are most commonly found in vessels around the thighs and pelvic retroperitoneum.2 Head and neck tumors account for 25%–33% of all cases of HPCs.3 Among the head tumors, HPCs account for 0.29%–1% of all intracranial tumors and <2.5% of all meningeal tumors.4,5
Intracranial HPC is a nonmeningothelial neoplasm originating in mesenchymal cells. The exact cellular composition of HPC tumors has remained largely unclear, although some researchers suggest that HPCs are mainly composed of pluripotent perivascular cells called Zimmermann pericytes, which are modified smooth muscle contractile cells surrounding the capillaries.6 The immunohistochemical profiles of HPCs show marked morphological variability, and they exhibit features overlapping with other HPC-like tumors, such as synovial sarcomas, mesenchymal chondrosarcomas, infantile fibrosarcomas, juxtaglomerular tumors, and solitary fibrous tumors.7 Thus, diverse neoplasms with certain common morphological characteristics, such as monotonous appearance at low-power microscopic examination, moderate to high cellularity, and presence of numerous, variably thick-walled, branched staghorn vessels, have been classified as HPCs.7
The term angioblastic meningioma was first used to describe three meningeal tumors depending on their morphology and clinical course.8 Angioblastic meningiomas are sometimes categorized as HPCs.9 In 1993, the World Health Organization (WHO) discontinued use of the term angioblastic meningioma in favor of HPC, but HPCs continued to be categorized as meningeal tumors.10 In 2000, WHO distinguished the categories of intracranial HPCs and meningiomas and formally defined HPCs as nonmeningeal tumors, owing to their distinctive histologic features.2 Thus, the terms hemangiopericytomas and angioblastic meningiomas may have been incorrectly used in the literature before the year 2000. Because of the confusing usage of these two terms, literature on differential diagnosis of HPCs is scarce.
We retrospectively analyzed the radiographic findings of patients with histologically confirmed intracranial HPC to identify the morphological patterns and radiographic features that could aid in definitive and differential diagnosis of HPCs.
Methods
Patients
We retrospectively analyzed the cases of 32 patients (11 women and 21 men) who were diagnosed with intracranial HPCs (24 primary and 8 recurrent tumors) and treated at our medical center from June 2008 to March 2014. The study design was approved by the institutional review board of our hospital. Complete case histories and clinical data, including sex, age, clinical presentation, duration of symptoms, and treatments used, were compiled and reviewed.
Computed tomographic (CT) and/or magnetic resonance imaging (MRI) scans were obtained for all patients before treatment; the imaging methods used are listed in Table 1. Of the 32 patients, 20 agreed to a routine MRI scan in a 3.0 Tesla scanner (Siemens Magnetom, Erlangen, Germany; GE Healthcare, Piscataway, NJ, USA). Enhanced MRI examination was conducted for 15 of the 20 patients, and 13 among them underwent diffusion-weighted imaging (DWI) scanning (b =0/800–1,000 s/mm2). Twenty-two patients underwent routine CT scanning; of these, one underwent CT angiography (CTA) alone, and four underwent both routine CT scanning and CTA. Ten patients were examined with both CT and MRI (Table 1).
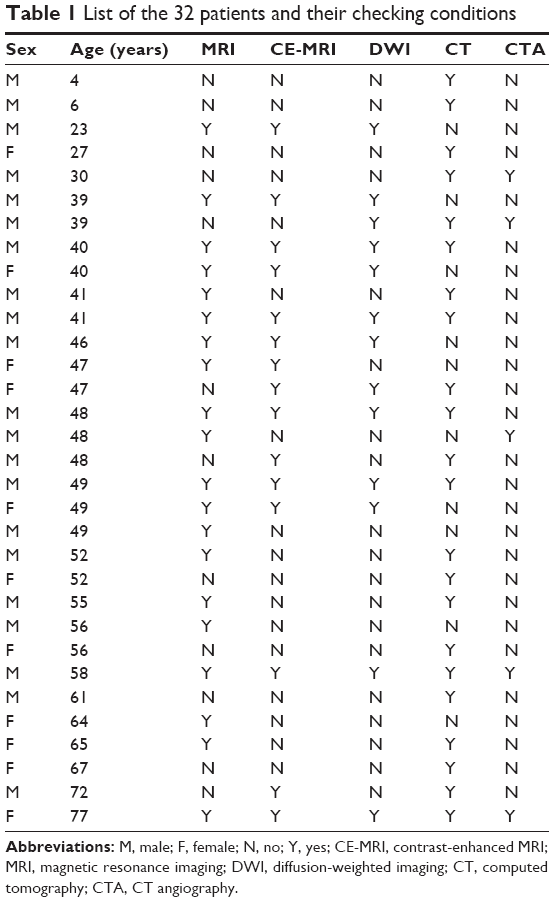 | Table 1 List of the 32 patients and their checking conditions |
HPCs of all the 32 patients were surgically resected or experienced biopsy, and the tumor histology was confirmed by histopathology. All resected tumors were fixed in paraformaldehyde and stained with hematoxylin and eosin. The tumors were then classified, by an experienced neuropathologist, according to the WHO 2007 criteria for tumors of the central nervous system.11
Imaging techniques
CT was performed by using the 256-section equipment (Philips Healthcare, Eindhoven, the Netherlands) with axial collimation of 16×0.625 mm (n=13) or the 64-section equipment (Siemens) with axial collimation of 24×1.2 mm (n=9). Section thickness was 10 mm, and current/voltage was 230 mA/120 kV. Contrast-enhanced (CE)-CT was performed after intravenous injection of iopromide (1.5 mL/kg body weight; Ultravist 370; Schering, Berlin, Germany) at a rate of 2 mL/s.
CTA was performed using the 256-section equipment with section thickness/gap of 0.9/0.1 mm; current/voltage, 150–250 mA/100 kV; and intravenous iopromide injection (2 mL/kg body weight) at 4 mL/s.
A uniform MRI protocol was used for routine testing with standard spin echo axial planes for T1 (TR/TE =450–650/15–20 ms), T2 (TR/TE =2,000–2,500/70–120 ms), and T2-weighted-fluid-attenuated-inversion recovery (T2W-FLAIR) (TR/TE/TI =8,000–9,000/80–100/2,000–2,200 ms) weighted sequences and a sagittal plane for T1-weighted (T1W) sequences on two 3 T systems. Other main parameters included an FOV of 220–240 mm; matrix, 256×320; section thickness/gap, 5–6/0.5–0.6 mm (axial plane) and 4/0.8 mm (sagittal plane); and excitation number, 1–2. CE-MRI was performed to obtain MPRAGE T1 weighted sequences, 3-dimensional spoiled gradient echo sequences with isocentric resolution of 1×1×1 mm3 or a 3-spin echo sequences consisting of axial, coronal, and sagittal sections after intravenous injection of 0.2 mmol/kg body weight of gadopentetate dimeglumine (Magnevist; Schering).
Imaging analysis
All images were reviewed by three experienced neuroradiologists and analyzed by consensus. CT and MRI scans were analyzed to determine tumor location, shape, size, margin, texture, signal intensity (SI) in routine scans, pattern and degree of contrast enhancement, invasion of adjacent structures, and peripheral edema. For CT measurements, the maximal solid mass on the axial plane with an area of 50–60 mm2 was selected as the region of interest. Tumor size was measured on the axial plane. The lesion margin was considered well defined if >1/3rd of the margin was sharply demarcated relative to the surrounding tissue and ill defined if <1/4th of the margin was sharply demarcated. Intermediate proportions were considered partially defined. Tumor shape was categorized as regular (round/oval) or irregular (lobular). Enhancement pattern was either homogenous or heterogeneous. Degree of enhancement was classified as absent (tumor density increment ≤10 HU on CE-CT, and CE-MRI SI ≤ SI of the contralateral normal brain), poor (10 HU < tumor density increment ≤20 HU and SI of the contralateral normal brain < SI of the tumor ≤ SI of the cavernous sinus on CE-MRI), moderate (20 HU < tumor density increment ≤40 HU and SI of cavernous sinus < SI of tumor ≤ SI of superior sagittal sinus), and intense (tumor density increment >40 HU and SI > SI of superior sagittal sinus). Peripheral edema was categorized as mild (maximum width <1/2 of tumor size), moderate (maximal tumor size > maximum width >1/2 of tumor size), or severe (maximum width > maximal tumor size). An area with clear/unclear boundary, regular/irregular shape, without enhancement, with SI similar to that of cerebrospinal fluid on T1- and T2-weighted images, or homogeneous low attenuation (≤20 HU) was defined as a cystic area. Calcification was diagnosed if regions with SI similar to that of skull bones and density ≥200 HU were identified. Signal-void vessels were defined as tumor vessels with SI similar to that of the internal carotid artery on T1 and T2 weighted sequences. “Dural tail” sign was diagnosed when the dural thickening adjacent to the lesion appeared like a “rat’s tail” on CE-MRI.
Tumors were categorized on the basis of their morphologic patterns into four types according to location, shape, calcification, bone erosion, and presence of cystic area, signal-void vessels, enhancement, and “dural tail” sign.
Results
Clinical presentation
The clinical profiles of all 32 patients are summarized in Table 2. The overall mean age at diagnosis was 46 years (range, 4–77 years) in both sexes, 43 years in men, and 53.2 years in women. The most frequent clinical presentation was headache (12/32) or decline in limb muscle strength (9/32); other symptoms included visual descent (5/32), dizziness (3/32), right ptosis (1/32), raucedo (1/32), and ataxia (1/32).
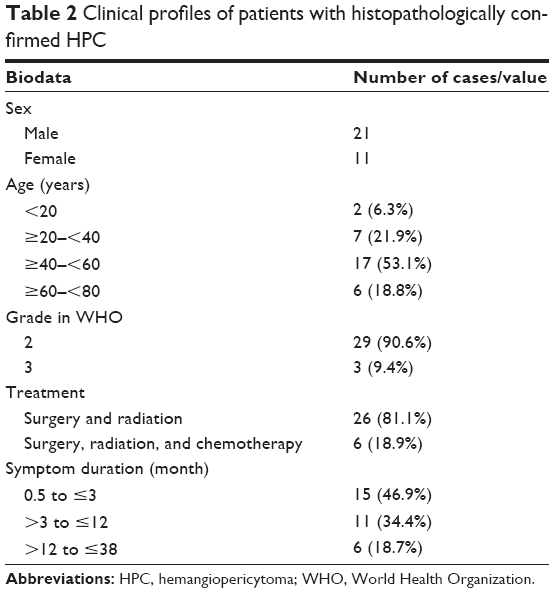 | Table 2 Clinical profiles of patients with histopathologically confirmed HPC |
Fifteen patients presented with rapidly progressing mass (history ≤3 months); 10, with moderately progres-sing mass (history, 3–12 months); and 7, with gradually growing mass (history ≥12 months). Eight patients presented with local recurrence, and one patient presented with local recurrence and pulmonary metastases (Figure 1). The mean duration of symptoms was 4 months (range, 0.5–38 months, with 78.1% patients (25/32) showing symptoms for ≤9 months).
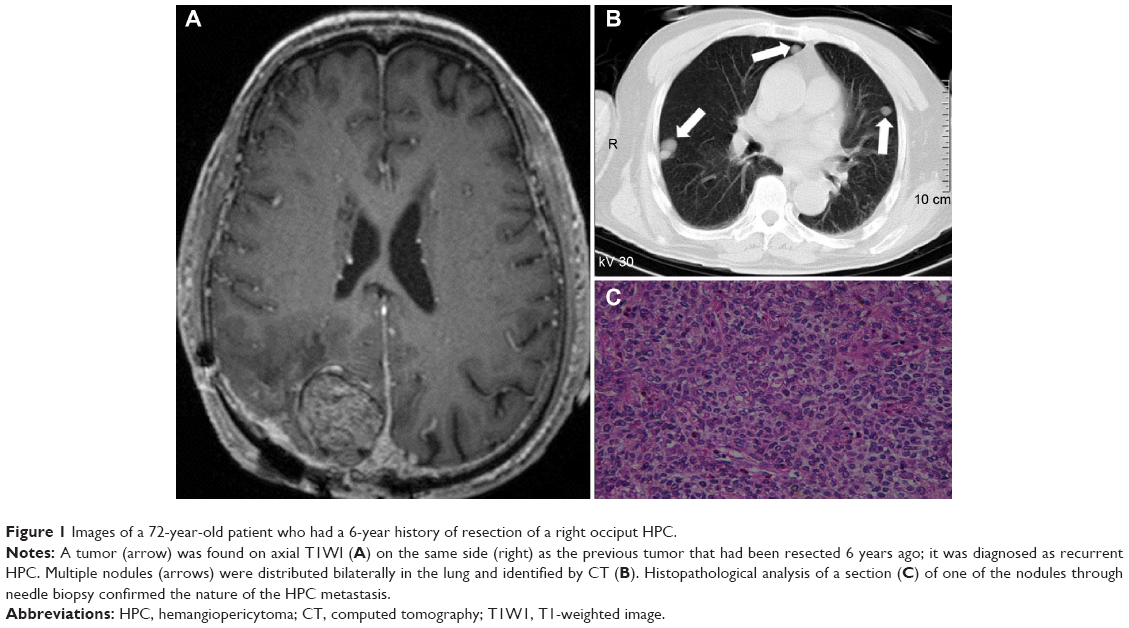 | Figure 1 Images of a 72-year-old patient who had a 6-year history of resection of a right occiput HPC. |
Imaging results
The tumor types of all patients as confirmed by CT and MRI scans are summarized in Table 3. We classified the tumors into four types on the basis of texture, size, attenuation, and SI (Table 3). Supratentorial tumors of regular or irregular shape with cystic areas, signal-void vessels, intense enhancement on CT or MRI, with or without bone erosion, and well-defined margins, but without “dural tail” sign and calcification were classified as type 1 tumors (Figure 2). Supratentorial tumors of regular or irregular shape with intense enhancement, signal-void vessels, well-defined margins, with or without bone erosion, but without “dural tail” sign, calcification, and cystic areas were classified as type 2 tumors (Figure 3). Infratentorial tumors of irregular shape with cystic areas, signal-void vessels, intense enhancement, but without “dural tail” sign and calcification were classified as type 3 tumors (Figure 4). Infratentorial tumors of regular or irregular shape with signal-void vessels, and intense enhancement, but without “dural tail” sign, cystic areas, and calcification were classified as type 4 tumors (Figure 5).
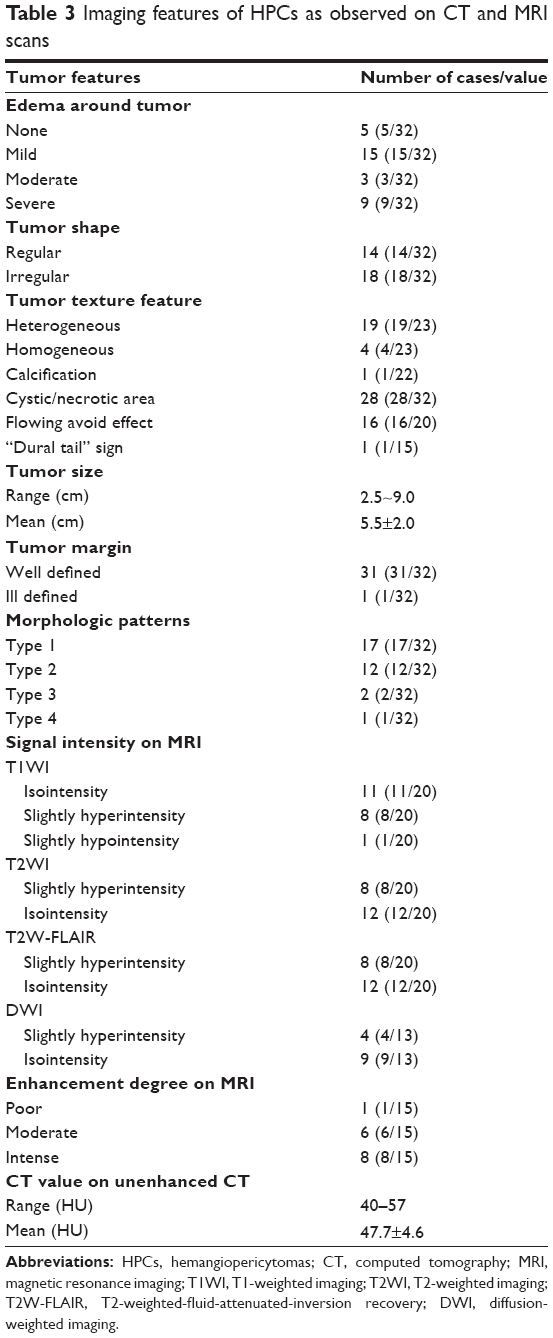 | Table 3 Imaging features of HPCs as observed on CT and MRI scans |
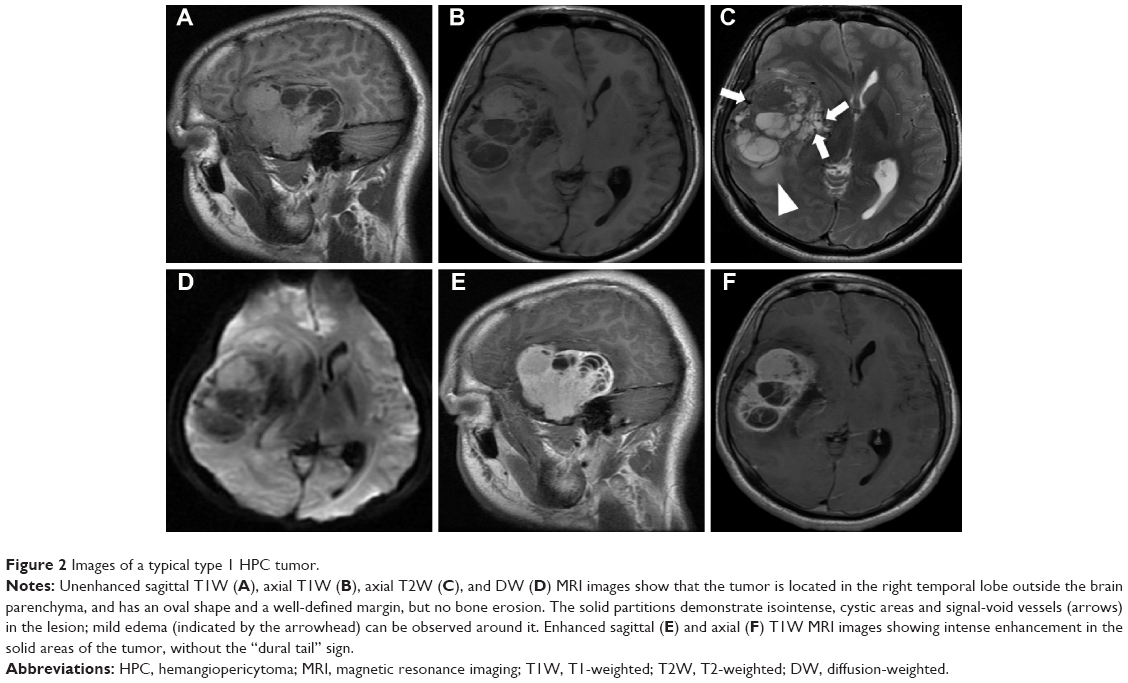 | Figure 2 Images of a typical type 1 HPC tumor. |
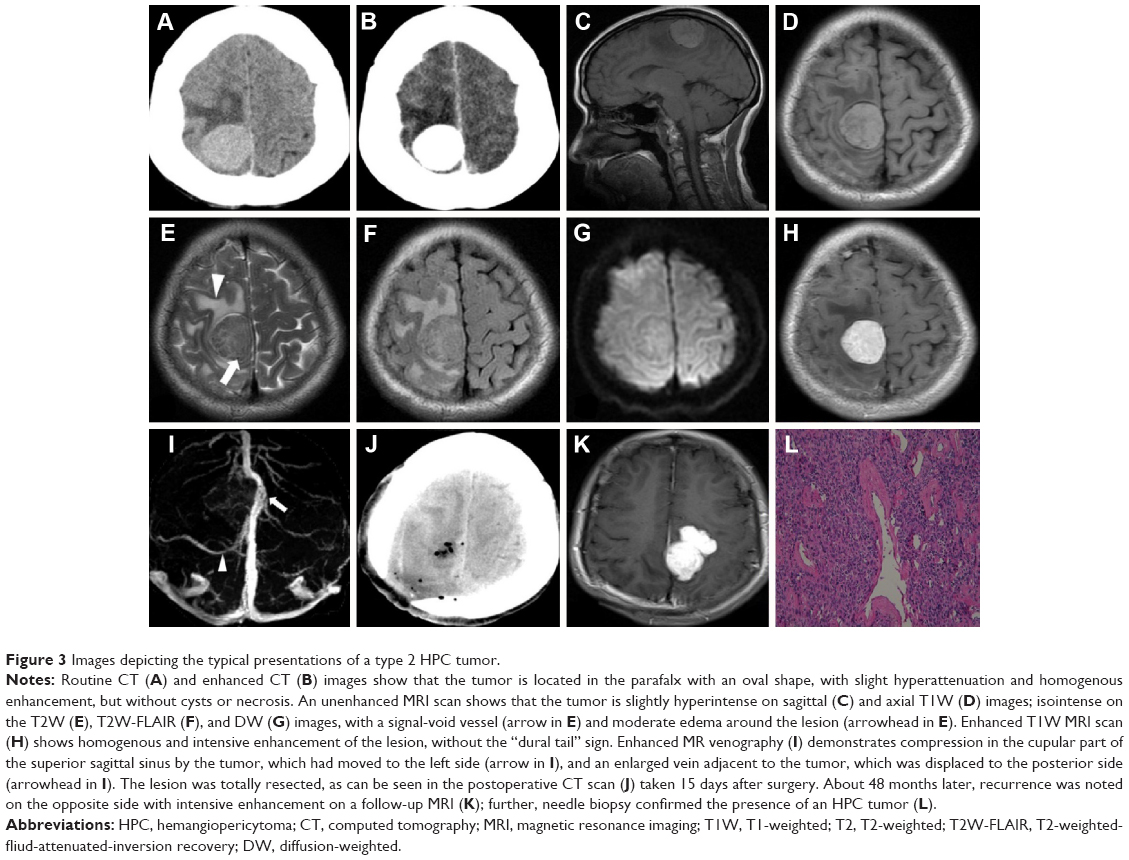 | Figure 3 Images depicting the typical presentations of a type 2 HPC tumor. |
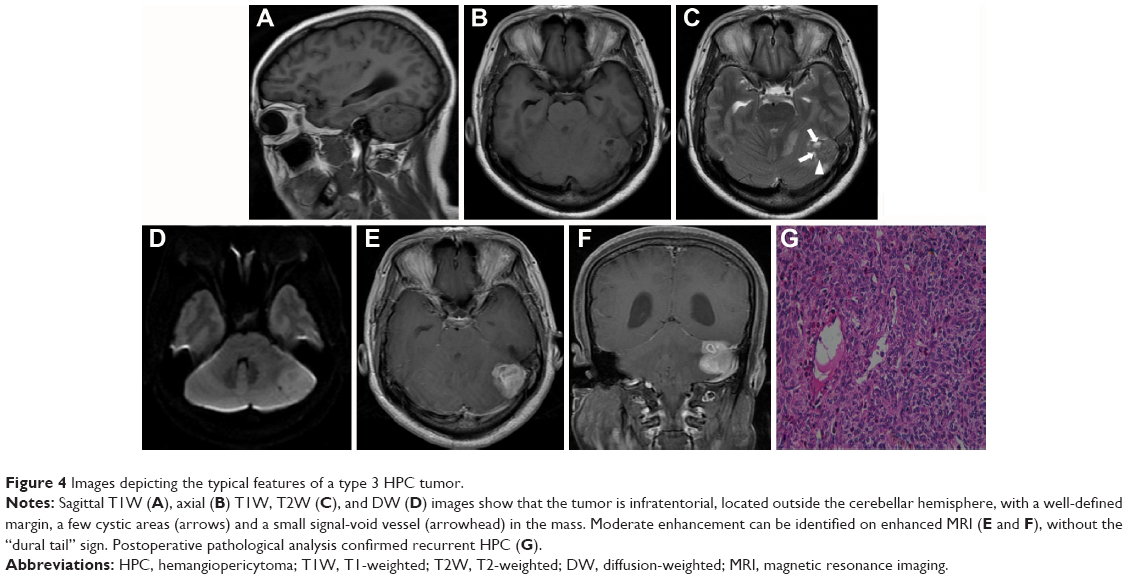 | Figure 4 Images depicting the typical features of a type 3 HPC tumor. |
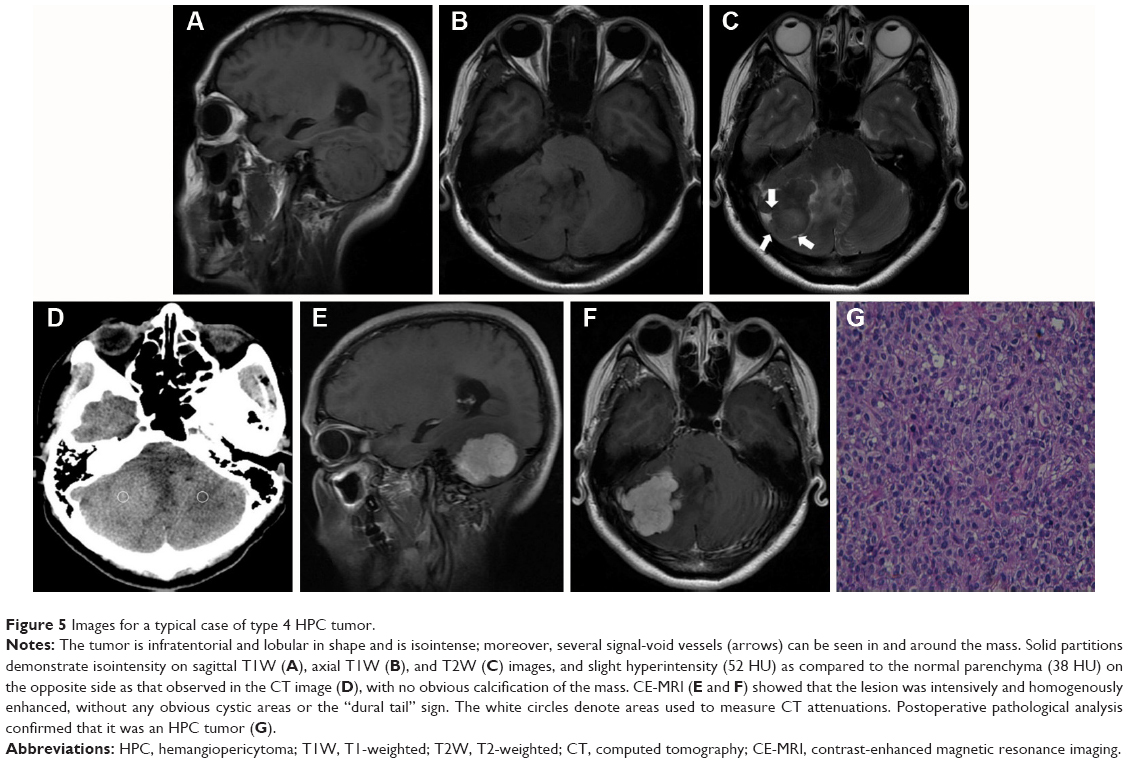 | Figure 5 Images for a typical case of type 4 HPC tumor. |
All 32 tumors were located outside the brain parenchyma. Of these, 18 were located in the base of fossa (six in anterior cranial fossa; eight, middle fossa; three, posterior fossa; and one, over middle and posterior fossa); ten were located in the parafalx; and four were adjacent to the cerebellar tentorium. The dural attachment of three (3/32) HPCs was broad based and that of eight (8/32) was narrow based. Most of the HPCs (28/32) were ≥3 cm in size; the smallest was 2.4 cm, and the largest was 9.0 cm, with a mean diameter of 5.5 cm. The severity of edema and tumor shape and margin are summarized in Table 3. Of the 31 well-defined masses, nine were oval, five were round, and 17 were lobular, whereas the single ill-defined tumor was oval. Invasion of the adjacent cranial bone was found in three patients, including two patients with temporal bone erosion (Figure 6A), and one with erosion of the anterior cranial base.
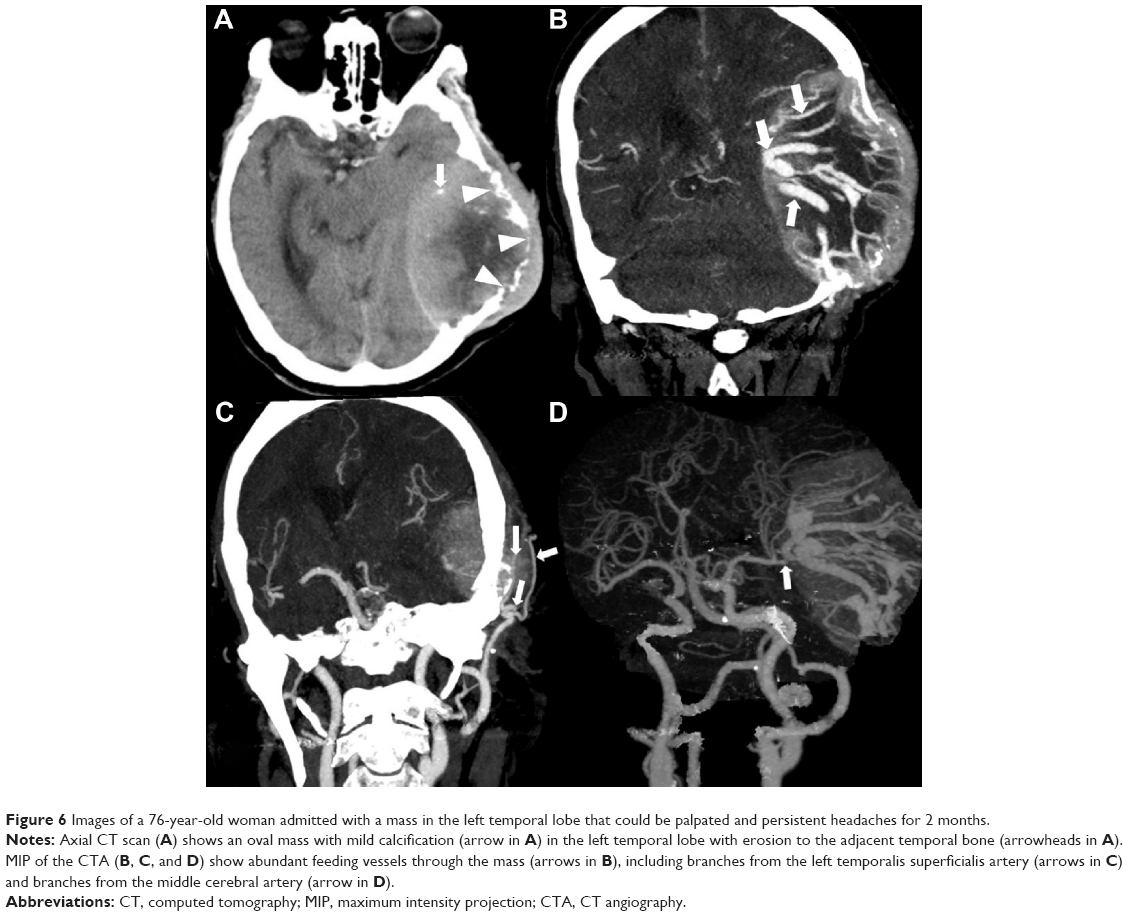 | Figure 6 Images of a 76-year-old woman admitted with a mass in the left temporal lobe that could be palpated and persistent headaches for 2 months. |
Calcification of lesions was observed in only one of the 22 patients who underwent CT scanning (Figure 6A). Tumor masses of all 22 patients showed slightly higher density than brain parenchyma. The mean density was 47.7 HU (range, 40–57 HU). Of the eight patients in whom contrast medium was administered, enhancement was homogenous in two and heterogeneous in six. On CTA, two tumors showed abundant blood flow through the mass (Figure 6B), accompanied with dual blood supply from branches of the internal and external carotid arteries (Figure 6C and D), and three tumors showed blood supply from the internal carotid artery or the basilar artery. All the five tumors exhibited intense heterogeneous enhancement, with a mean increased density of 128±39 HU (range, 65–176 HU). Of the five masses, three showed ring-like enhancement, and two showed plaque-like enhancement; cystic areas could be seen in all five.
Of the 20 tumors scanned by MRI, 16 showed signal-void vessels. Classification of tumor masses depending on SI relative to that of skull bone as obtained on T1W, T2W, T2W-FLAIR, and DW images is shown in Table 3. Of the 15 patients who underwent CE-MRI, 13 had heterogeneous tumors and two had homogeneous tumors. “Dural tail” sign was observed in one patient. The degree of enhancement for these 15 patients is shown in Table 3. The remaining five patients who did not undergo the procedure had heterogeneous tumors.
Of the ten patients who underwent both CT and MRI scanning, eight underwent enhanced MRI and two underwent CTA (Table 1). Of these two patients, the tumor was located in the middle cranial fossa in one patient and in the parahippocampus in the other. Both tumors showed heterogeneous intense enhancement on enhanced CT and MRI; of these, one showed calcification within the mass and dual blood supply. Of the remaining eight patients, four underwent CE-MRI. The tumors in two of these eight patients were narrow and demonstrated bone erosion. Two tumors were broad based and four were narrow based without bone erosion.
Discussion
HPC is a rare tumor that represents <1% of all central nervous tumors.12 The average age at diagnosis is 37–44 years, and their incidence is similar in both sexes.12,13 One study reported the average of occurrence as 47 years in women and 40.9 years in men.14 In our study, the overall and sex-dependent mean ages at diagnosis were similar to those of previous studies.13–15 Consistent with previous studies, headache and descent of limb muscle strength were the most frequent clinical symptoms in our series.15 In our study, almost equivalent numbers of lobulated/irregular vs round/oval tumors were observed (56% vs 44%). Most HPCs were large and had a mean size of 5.5 cm, similar to previous studies with larger cohorts.2,15
Definitive diagnosis of HPCs is provided by accurate histopathologic assessment, which determines and allows planning of the management strategy, regardless of the preoperative imaging analysis findings.6 Almost all the HPCs in our study showed slight hyperattenuation on CT, isointensity or slight hyperintensity on T1WI, and slight hyperintensity or isointensity on T2WI and DWI; these features may be related to the pathologic features that cause high cellularity in these tumors. Consistent with previous studies, most tumors with moderate to intense enhancement on MRI and intense enhancement on CT exhibited prominent intratumoral or peritumoral signal-void vessels, and vascular channels showed low signal intensities on all MRI sequences, indicating high blood flow.15–17 However, these CT and MRI characteristics are nonspecific and do not allow for differential diagnosis from meningioma. Nevertheless, most masses were heterogeneous, had cystic areas, and signal-void vessels; some masses exhibited intense enhancement on CT or MRI; some had bone erosion when they were adjacent to the skull bones; and very few showed “dural tail” sign or calcification. To our knowledge, these features are, in aggregate, different from those observed for common meningiomas or other malignant tumors, including anaplastic neuroepitheliomas, glioblastomas, and metastatic tumors. The frequency of bone erosion observed in tumors adjacent to skull bones in our series was similar to that reported by other researchers.15,16,18 Thus, we conclude that an intracranial HPC can be differentially diagnosed if it presents as a well-defined mass with necrosis, signal-void vessels, intense enhancement, bone erosion when adjacent to the skull bone, and is devoid of calcification and “dural tail” signs.
HPCs are abundantly supplied by blood from the branches of the internal carotid artery and vertebral artery.17,19 The CTA results in our study showed that blood flow pattern was consistent with that reported in previous studies.20 Because intracranial HPCs receive abundant blood supply, and some even receive dual blood supply, ie, blood supply simultaneously from two large arteries, a preoperative CTA may be helpful in differential diagnosis, and embolization can be implemented as a safe option to decrease tumor size and avoid severe bleeding during surgery.6,17,21 HPCs are associated with postoperative recurrence and metastasis. Mena et al22 reported recurrence and metastatic rates of 60.6% and 23.4% in 94 intracranial HPCs, respectively. In another investigation involving 44 patients, the local recurrence rates at 1, 5, and 10 years after surgery were 15%, 65%, and 76%, respectively.12 Because of the retrospective nature of our study, we were unable to obtain integral follow-up data and accurate recurrence and metastasis rates. Liver and bone are common metastatic sites of primary HPCs; rare sites include heart, breasts, and pancreas.23 The tendency of HPCs, especially their malignant subtypes, toward local recurrence and metastases could be attributed to their specific biological and histological characteristics, which could have led to their classification as an independent subtype of nonmesenchymal tumors in the year 2000.1,4,7 Another reason for the high risk of recurrence of HPCs could be the fact that these tumors are large in size and that complete resection may not be possible owing to high vascularity proximal to dural sinuses.19,24 Complete resection was not possible because of this reason in three of our patients. Postoperative adjuvant radiotherapy contributes to improving disease-free and overall survival in HPC patients. In our study, 26 patients received postoperative radiotherapy, and six patients received postoperative chemoradiotherapy. The mean radiation dose was 57 Gy (range, 50–60 Gy), which was similar to that reported in previous studies.12,19 To decrease the recurrence ratio and improve disease-free and overall survival rates, adjuvant radiotherapy with a dose range of 55–60 Gy is commonly recommended in clinical practice even when complete resection is achieved.19,25 Additionally, a postoperative follow-up protocol involving clinical evaluation every 6 months and annual MRI scanning for at least 3 years is recommended.21,25
It is difficult to predict the prognosis of HPC, because the clinical behavior of HPCs does not always correlate with the histopathologic features of the tumors, and histopathological criteria for defining malignancy have hitherto been variable between studies.6 Nevertheless, large tumors (>5 cm), with high cellularity, pleomorphic tumor cells, incremental mitotic rate (4 mitotic events/10 high-power fields), atypical mitosis, and hemorrhagic and necrotic foci are considered to be highly malignant.2,26 The overall 10-year survival rate of HPCs is 70%;2 however, reduced 10-year survival rates are observed in cancers with >4 mitotic events/10 high-power fields (9%), necrosis (29%), or tumors >6.5 cm in size (63%). Earlier studies report that local recurrence rates vary from 15% to 76%;12 however, in 15% of metastatic HPCs, the latency period varies from 63 to 107 months.12
In our study, HPCs could be classified into four morphologic types. Location and morphologic patterns are useful for differential diagnosis of HPCs from other frequently occurring primary intracranial tumors that present with similar imaging features as HPCs in similar locations. Nearly 50% of our patients had type 1 tumors. Type 1 tumors exhibited morphologic features similar to those of gliomas, especially when the tumors had ill-defined margins and intense enhancement and could be confused with high-grade gliomas. To our knowledge, however, signal-void vessels are rarely present in gliomas. Moreover, presence of collapsed/compressed brain tissue around the tumor mass, as observed in our patients with type 1 tumors, indicates that the original source of the mass is outside the brain tissue, a feature rarely present in gliomas. Type 2 tumors in our series presented morphologic features similar to those of meningiomas. However, most meningiomas exhibit “dural tail” signs when they are adjacent to the cerebral falx27,28 and frequent calcification within the tumor mass.27 These features are very distinct from those observed for type 2 tumors in our series. None of the type 2 tumors showed “dural tail” signs even though ten tumors were in close proximity to the cerebral falx. Type 3 tumors in our series had morphologic features similar to those of medulloblastomas and pilocytic astrocytomas. Medulloblastomas present with hyperdense regions on CT,29 obvious hyperintense regions on DWI, and a taurine peak at 3.42 ppm on MR spectra.30 These features are different from those of HPCs. Pilocytic astrocytomas frequently exhibit necrosis or cysts and prominent enhancement of the solid regions within the tumor.31 However, almost all of these tumors are located in the cerebellar parenchyma, such as vermis, and hemicerebellum, and no researchers have suggested the presence of signal-void vessels within or surrounding these astrocytomas.31 On the contrary, HPCs are located outside the cerebellar parenchyma and frequently present with signal-void vessels. The two type 3 tumors in our patients showed signal-void vessels, and the cerebellar parenchyma surrounding the tumor mass was compressed, indicating that these tumors were situated outside the cerebellar parenchyma. Type 4 tumors in our study showed morphologic features similar to those of meningiomas located in the infratentorium; however, the classic presentation of a meningioma is the presence of an oval homogenous intense or dense mass with “dural tail” sign.27,32 The single patient with type 4 tumor in our study did, however, have a lobular tumor without the “dural tail” sign. Larger cohorts of patients will need to be analyzed to delineate the features of type 4 tumors.
This is the first study to provide a detailed differential diagnosis of HPCs from other types of primary intracranial tumors and meningiomas. However, it did have certain limitations. First, this study was a retrospective analysis; therefore, patient data were retrieved from chart reviews. Most of our patients did not simultaneously undergo CT and MRI examinations; moreover, CTA had been performed for only five patients. If simultaneous CT and MRI scanning and subsequent CTA had been performed for more patients, the overall characterization and classification of tumors on the basis of radiographic findings could have been more robust. Second, none of patients underwent dynamic CE-MRI and MR spectroscopy (MRS). Because these functional MRI techniques, particularly MRS and dynamic CE-MRI, are superior to routine MRI for characterization and delineation of intracranial tumor lesions such as HPCs, additional studies using these functional techniques are warranted. Third, because of the retrospective design, we did not have integral follow-up data on these patients; therefore, local recurrence and metastatic rates could not be determined.
Conclusion
Intracranial HPCs displays nonspecific attenuation or signal intensities on CT or MRI scans. Therefore, definitive diagnosis of HPCs on the basis of CT and MRI scans is difficult. On the basis of our detailed retrospective analysis, we propose that tumors present outside the brain parenchyma, with isointense to slightly intense regions on MRI scans, oval/lobular shape, well- or ill-defined margins, signal-void vessels, apparent cystic areas, dual blood supply, and intense enhancement on CT or MRI scans, but without calcification or a “dural tail” sign, may be diagnosed as HPCs.
Disclosure
The authors report no conflicts of interest in this work.
References
Stout AP, Murray MR. Hemangiopericytoma: a vascular tumor featuring zimmermann’s pericytes. Ann Surg. 1942;116(1):26–33. | ||
Kleihues P, Louis DN, Scheithauer BW, et al. The WHO classification of tumors of the nervous system. J Neuropathol Exp Neurol. 2002;61(3):215–225, 226–229. | ||
Ruscalleda J, Feliciani M, Avila A, Castaner E, Guardia E, de Juan M. Neuroradiological features of intracranial and intraorbital meningeal haemangiopericytomas. Neuroradiology. 1994;36(6):440–445. | ||
Enzinger FM, Smith BH. Hemangiopericytoma. An analysis of 106 cases. Hum Pathol. 1976;7(1):61–82. | ||
Auguste LJ, Razack MS, Sako K. Hemangiopericytoma. J Surg Oncol. 1982;20(4):260–264. | ||
Fountoulakis EN, Papadaki E, Panagiotaki I, Giannikaki E, Lagoudianakis G, Bizakis J. Primary haemangiopericytoma of the parapharyngeal space: an unusual tumour and review of the literature. Acta Otorhinolaryngol Ital. 2011;31(3):194–198. | ||
Gengler C, Guillou L. Solitary fibrous tumour and haemangiopericytoma: evolution of a concept. Histopathology. 2006;48(1):63–74. | ||
Bailey P, Cushing H, Eisenhardt L. Angioblastic meningiomas. Arch Pathol. 1928;6(6):953–990. | ||
Begg CF, Garret R. Hemangiopericytoma occurring in the meninges: case report. Cancer. 1954;7(3):602–606. | ||
Kleihues P, Burger PC, Scheithauer BW. The new WHO classification of brain tumours. Brain Pathol. 1993;3(3):255–268. | ||
Louis DN, Ohgaki H, Wiestler OD, et al. The 2007 WHO classification of tumours of the central nervous system. Acta Neuropathol. 2007;114(2):97–109. | ||
Russell WO, Cohen J, Enzinger F, et al. A clinical and pathological staging system for soft tissue sarcomas. Cancer. 1977;40(4):1562–1570. | ||
Billings KR, Fu YS, Calcaterra TC, Sercarz JA. Hemangiopericytoma of the head and neck. Am J Otolaryngol. 2000;21(4):238–243. | ||
Jaaskelainen J, Servo A, Haltia M, Wahlstrom T, Valtonen S. Intracranial hemangiopericytoma: radiology, surgery, radiotherapy, and outcome in 21 patients. Surg Neurol. 1985;23(3):227–236. | ||
Chiechi MV, Smirniotopoulos JG, Mena H. Intracranial hemangiopericytomas: MR and CT features. AJNR Am J Neuroradiol. 1996;17(7):1365–1371. | ||
Cosentino CM, Poulton TB, Esguerra JV, Sands SF. Giant cranial hemangiopericytoma: MR and angiographic findings. AJNR Am J Neuroradiol. 1993;14(1):253–256. | ||
Musacchio M, Mont’Alverne F, Belzile F, Lenz V, Riquelme C, Tournade A. Posterior cervical haemangiopericytoma with intracranial and skull base extension – diagnostic and therapeutic challenge of a rare hypervascular neoplasm. J Neuroradiol. 2003;30(3):180–187. | ||
Abdel-Fattah HM, Adams GL, Wick MR. Hemangiopericytoma of the maxillary sinus and skull base. Head Neck. 1990;12(1):77–83. | ||
Chan WS, Zhang J, Khong PL. 18F-FDG-PET-CT imaging findings of recurrent intracranial haemangiopericytoma with distant metastases. Br J Radiol. 2010;83(992):e172–e174. | ||
Hattingen E, Pilatus U, Good C, Franz K, Lanfermann H, Zanella FE. An unusual intraventricular haemangiopericytoma: MRI and spectroscopy. Neuroradiology. 2003;45(6):386–389. | ||
Jalali R, Srinivas C, Nadkarni TD, Rajasekharan P. Suprasellar haemangiopericytoma – challenges in diagnosis and treatment. Acta Neurochir (Wien). 2008;150(1):67–71. | ||
Mena H, Ribas JL, Pezeshkpour GH, Cowan DN, Parisi JE. Hemangiopericytoma of the central nervous system: a review of 94 cases. Hum Pathol. 1991;22(1):84–91. | ||
Spatola C, Privitera G. Recurrent intracranial hemangiopericytoma with extracranial and unusual multiple metastases: case report and review of the literature. Tumori. 2004;90(2):265–268. | ||
Galanis E, Buckner JC, Scheithauer BW, Kimmel DW, Schomberg PJ, Piepgras DG. Management of recurrent meningeal hemangiopericytoma. Cancer. 1998;82(10):1915–1920. | ||
Sheehan J, Kondziolka D, Flickinger J, Lunsford LD. Radiosurgery for treatment of recurrent intracranial hemangiopericytomas. Neurosurgery. 2002;51(4):905–910, 910–911. | ||
Middleton LP, Duray PH, Merino MJ. The histological spectrum of hemangiopericytoma: application of immunohistochemical analysis including proliferative markers to facilitate diagnosis and predict prognosis. Hum Pathol. 1998;29(6):636–640. | ||
Qi ST, Liu Y, Pan J, Chotai S, Fang LX. A radiopathological classification of dural tail sign of meningiomas. J Neurosurg. 2012;117(4):645–653. | ||
Rokni-Yazdi H, Sotoudeh H. Prevalence of “dural tail sign” in patients with different intracranial pathologies. Eur J Radiol. 2006;60(1):42–45. | ||
Tortori-Donati P, Fondelli MP, Fau Rossi A, et al. Medulloblastoma in children: CT and MRI findings. Neuroradiology. 1996;38(4):352–359. | ||
Wu GY, Pang HP, Ghimire P, Liu GB. 1H magnetic resonance spectroscopy and diffusion weighted imaging findings of medulloblastoma in 3.0T MRI: a retrospective analysis of 17 cases. Neural Regen Res. 2012;7(32):2554–2559. | ||
Arai K, Sato N, Aoki J, et al. MR signal of the solid portion of pilocytic astrocytoma on T2-weighted images: is it useful for differentiation from medulloblastoma? Neuroradiology. 2006;48(4):233–237. | ||
Kawahara Y, Nakada M, Hayashi Y, et al. Prediction of high-grade meningioma by preoperative MRI assessment. J Neurooncol. 2012;108(1):147–152. |
 © 2015 The Author(s). This work is published and licensed by Dove Medical Press Limited. The
full terms of this license are available at https://www.dovepress.com/terms
and incorporate the Creative Commons Attribution
- Non Commercial (unported, 3.0) License.
By accessing the work you hereby accept the Terms. Non-commercial uses of the work are permitted
without any further permission from Dove Medical Press Limited, provided the work is properly
attributed. For permission for commercial use of this work, please see paragraphs 4.2 and 5 of our Terms.
© 2015 The Author(s). This work is published and licensed by Dove Medical Press Limited. The
full terms of this license are available at https://www.dovepress.com/terms
and incorporate the Creative Commons Attribution
- Non Commercial (unported, 3.0) License.
By accessing the work you hereby accept the Terms. Non-commercial uses of the work are permitted
without any further permission from Dove Medical Press Limited, provided the work is properly
attributed. For permission for commercial use of this work, please see paragraphs 4.2 and 5 of our Terms.