Back to Journals » Diabetes, Metabolic Syndrome and Obesity » Volume 12
Morbidity associated with overweight and obesity in health personnel: a 10-year retrospective of hospital-based cohort study in Taiwan
Authors Yeh TL ![]() , Chen HH
, Chen HH ![]() , Chiu HH, Chiu YH, Hwang LC
, Chiu HH, Chiu YH, Hwang LC ![]() , Wu SL
, Wu SL ![]()
Received 4 November 2018
Accepted for publication 17 January 2019
Published 7 March 2019 Volume 2019:12 Pages 267—274
DOI https://doi.org/10.2147/DMSO.S193434
Checked for plagiarism Yes
Review by Single anonymous peer review
Peer reviewer comments 2
Editor who approved publication: Professor Ming-Hui Zou
Tzu-Lin Yeh,1,2 Hsin-Hao Chen,1 Hsiao-Hui Chiu,3 Yu-Hua Chiu,4 Lee-Ching Hwang,5,6 Shang-Liang Wu7
1Department of Family Medicine, Hsinchu MacKay Memorial Hospital, Hsinchu City, Taiwan; 2Institute of Epidemiology and Preventive Medicine, College of Public Health, National Taiwan University, Taipei, Taiwan; 3Department of Nursing, Taipei Veterans General Hospital, Taipei City, Taiwan; 4Occupational Safety and Health Office, Taipei Veterans General Hospital, Taipei City, Taiwan; 5Department of Family Medicine, MacKay Memorial Hospital, Taipei, Taiwan; 6Department of Medicine, MacKay Medical College, New Taipei City, Taiwan; 7School of Medicine, Griffith University, Gold Coast Campus, QLD, Australia
Purpose: To investigate morbidity associated with overweight and obesity in health personnel and compare the differences among work roles.
Materials and methods: This retrospective cohort study examined measurements obtained during employee medical checkups between 2007 and 2016 in a Taiwan medical center. BMI was used to define overweight (≥24 and <27 kg/m2) and obesity (≥27 kg/m2). Morbidity refers to prevalence, period incidence proportion, and incidence rate. Multivariable Cox model was used to estimate the HRs and 95% CI of the incidence proportion across work roles.
Results: Ten thousand six hundred fifty-one health personnel with 24,295 BMI measurements were recruited. Mean age was 33.4±10.7 years and 72.4% was female. In total, 1,992 (8.2%) health personnel were underweight, 13,568 (55.8%) had a normal BMI, 5,097 (21%) were overweight, and 3,638 (15%) were obese. Five thousand nine hundred one health personnel with 31,172 different interval-year arrangement combinations were obtained. The incidence proportion of overweight and obesity was 1,947 (6.2%) and 1,494 (4.8%), respectively. The incidence rate was 37/1,000 and 15/1,000 person-years, respectively. Compared with that in supporting staff, the HR of overweight in doctors, nurses, and allied health professionals was 0.93 (95% CI =0.73–1.18, P=0.553), 0.92 (95% CI =0.73–1.16, P=0.491), and 0.85 (95% CI =0.67–1.09, P=0.202), respectively. Similarly, the HR of obesity was 0.86 (95% CI =0.66–1.14, P=0.301), 0.89 (95% CI =0.67–1.18, P=0.430), and 0.84 (95% CI =0.63–1.13, P=0.248), respectively.
Conclusion: In health personnel, the prevalence of overweight and obesity was 21% and 15%, respectively. The incidence proportion was 6.2% and 4.8%, respectively. Morbidity across the four health work roles examined was not significantly different.
Keywords: prevalence, incidence, obesity, overweight, health personnel, body mass index
Introduction
Obesity (BMI ≥30 kg/m2) and overweight (BMI ≥25 to ≤29.9 kg/m2) are significantly associated with excess morbidity and mortality.1 Obesity2–13 and overweight14–16 are associated with >200 comorbidities. Obesity and overweight represent a rapidly growing threat to the health of people in an increasing number of countries.17 In 2016, 39.1% and 38.5% of adult (≥18 years) women and men, respectively, were overweight or obese worldwide. Furthermore, the mean BMI increased in both men and women from 21.5% to 38.9% during 1975–2016.18
Health personnel consist of men and women working in the provision of health services as individual practitioners or employees of health institutions and programs, regardless of professional training or public regulation. “Health personnel,” originally introduced as “health manpower” in 1966–1967, is a MeSH term introduced in 1992 from a discursive dictionary of health care. The currently more familiar terms include “healthcare providers,” “health service providers,” and “health workers,” referring to persons who provide health services. Occupations in this submajor group are classified into several minor groups. According to the ISCO, health workers are classified as health professionals, health associate professionals, personal care workers in health services, health management, supporting personnel, etc.19 Health professionals are classified into 12 subgroups such as doctors, nurses, pharmacists. Health associate professionals are classified into 16 subgroups. They work long hours, are exposed to occupational hazards,20 and have higher levels of illness-related absence, dissatisfaction, distress, and “burnouts” at work than staff in other sectors.21 However, little is known regarding the health differences among these health work roles.
Overweight and obesity are significant issues among health personnel. The prevalence of obesity and overweight in health personnel ranged from 8.5% to 60% in different studies.22,23 In Taiwan, only two studies have investigated the prevalence of overweight and obesity in hospital employees: the first, conducted in 1993,24 demonstrated the association of overweight and obesity in hospital employees with a significantly increased risk of developing diabetes, hypertension, hypertriglyceridemia, and hyperuricemia; the second, conducted in 2003,25 showed the independent association of these conditions with cardiovascular risk factors. Our aim was to investigate the current morbidity rate of overweight and obesity in health personnel and compare differences across health work roles.
Materials and methods
This retrospective cohort study examined the BMI measurements obtained during employee medical checkups between 2007 and 2016 at the teaching medical center, Taipei Veterans General Hospital in Taiwan. The hospital arranged the health examinations of health personnel according to each staff member’s age, job position, work risk, and insurance status as required by law. All first-level supervisors and special work health personnel who are exposed to loud noise, radiation, dust, and formaldehyde were required to do an annual health examination. All health personnel younger than 40 years were required to receive a health examination every 5 years. For health personnel older than 40 years and who have public insurance, they were required to receive a health examination every 2 years; for those who are older than 40 years and who have labor insurance, they were required to receive a health examination every 3 years. The research protocol and access to the data were approved by the institutional review board of the Taipei Veterans General Hospital (approval number: 2017-08-009AC). For those investigators who did not have access to formal ethics review committees, we had a waiver of health professional consent by the IRB of the Taipei Veterans General Hospital. We followed the principles on patient data confidentiality as outlined in the Declaration of Helsinki. The selected health personnel were aged between 18 and 66 years. The current ISCO is very detailed. Thus, we simplified the classification according to health work roles (ie, doctors, nurses, AHP, and supporting staff). This classification was previously used in another study.26
BMI was calculated as the ratio of body weight (in kilograms) divided by the square of height (in meters). According to the Bureau of Health Promotion, Department of Health in Taiwan, a BMI denotes underweight (<18.5 kg/m2), normal weight (≥18.5 to <24 kg/m2), overweight (≥24 to <27 kg/m2), and obesity (≥27 kg/m2).27
The term “morbidity rate” refers to the prevalence or incidence, epidemiologically.28 The prevalence, period incidence proportion, and incidence rate were calculated. We used fixed-interval and nonfixed-interval statistical methods to calculate these morbidity rates. If a health personnel had 10 BMI measurements in 10 years, a total of 45 (ie, 9+8+7+6+5+4+3+2+1) BMI measurements with different interval years were obtained. We calculated all 1- to 9-year interval data to determine the exact period incidence.
Microsoft Excel (Microsoft Corporation, Redmond, WA, USA) was used for data cleaning. Continuous variables were expressed as mean and standard deviation, while categorical variables were expressed as frequencies with accompanying percentages. We used the multivariable Cox regression model to estimate the HRs and 95% CI of the incidence proportion across health work roles adjusted by sex and age.29 Statistical significance was set at P<0.05. Statistical analysis was performed using the statistical software package for social sciences, SPSS® version 20.0 (IBM SPSS Inc., Chicago, IL, USA).
Results
From 2007 to 2016, the hospital had an average of 5,988 health personnel, 95% of these health personnel completed their health examination program according to the regulations. For the analysis of prevalence, 10,651 health personnel with 24,295 BMI measurements obtained from 2007 to 2016 were selected. The basic demographic characteristics of these 10,651 health personnel are shown in Table 1. Mean age was 33.4±10.7 years and the majority (72.4%) was female. The distribution of doctors, nurses, AHP, and supporting staff was 22.5%, 44.4%, 13.4%, and 19.6%, respectively. All of them provided 1–10 BMI measurements during the period of investigation according to their age and health work roles. Table 2 compares the prevalence of underweight, normal, overweight, and obese by measurement years. Among the 24,295 BMI measurements, the numbers and percentages of personnel with underweight, normal BMI, overweight, and obese were 1,992 (8.2%), 13,568 (55.8%), 5,097 (21%), and 3,638 (15%), respectively. Overall prevalence of overweight and obesity was 36%.
 | Table 1 Characteristics of health personnel at initial body mass index measurements Abbreviation: AHP, allied health professional. |
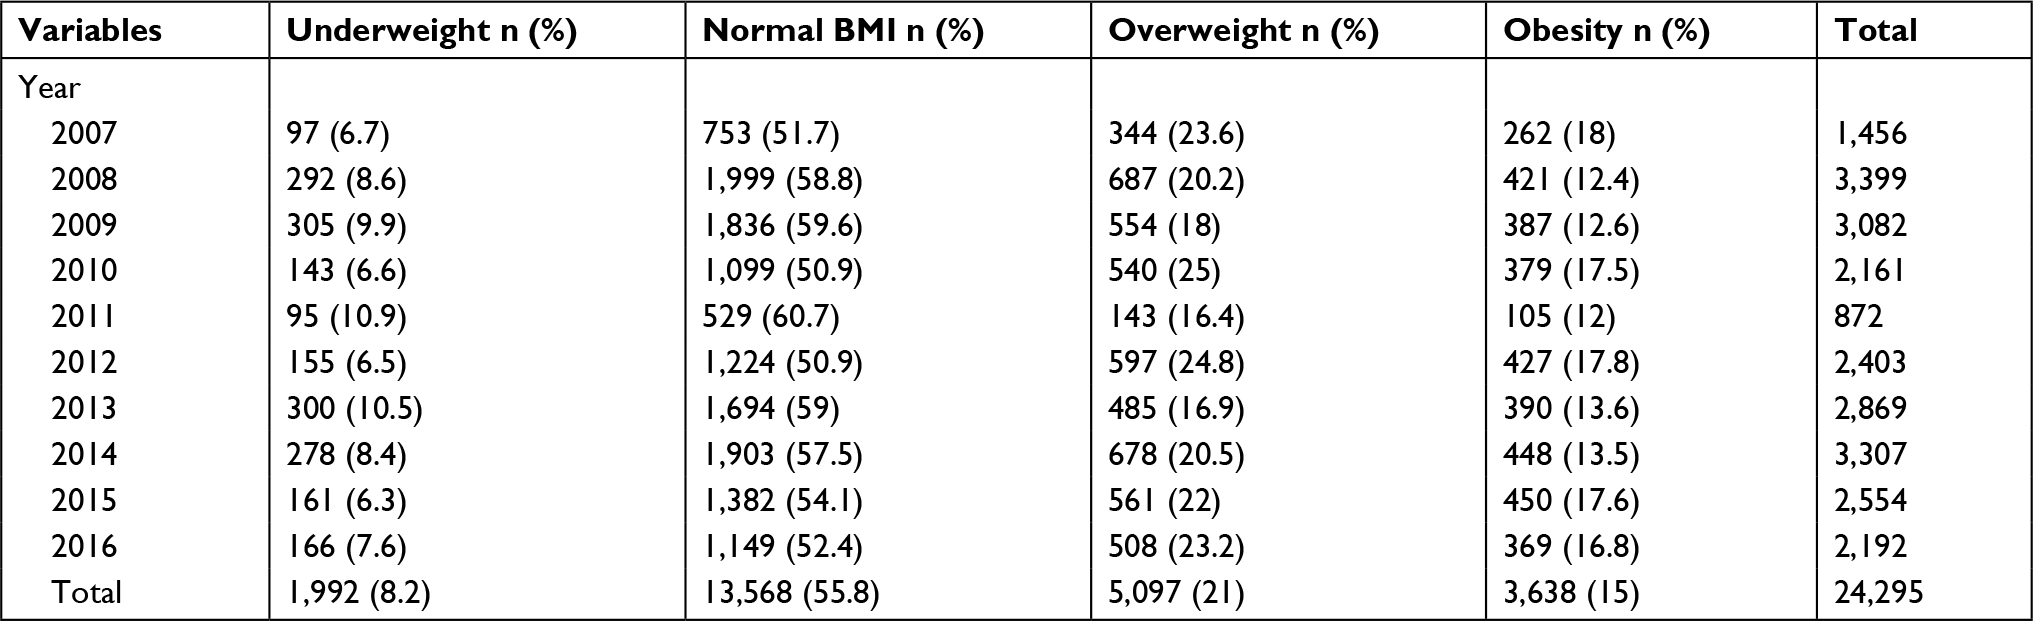 | Table 2 Comparisons on the prevalence of underweight, normal, overweight, and obese by measurement years Abbreviation: BMI, body mass index. |
To analyze incidence, we excluded those who provided only a single BMI measurement and those not at risk of obese or overweight initially. In total, 5,901 health personnel with 31,172 different interval-year arrangement combinations were obtained, with a mean age of 35.2±10.4 years and a larger female proportion (80.6%). The distribution of doctors, nurses, AHP, and supporting staff was 17.7%, 47.5%, 17.4%, and 17.4%, respectively, for overweight incidence (Table 1). Table 3 shows the incidence proportion of overweight and obesity in four health work roles for the 1- to 8-year period. Nine-year period data were not shown due to the small sample size. Overall incidence proportion of overweight and obesity in health personnel was 6.2% and 4.8%, respectively. The incidence proportion of overweight in doctors, nurses, AHP, and supporting staff was 6.7%, 6.7%, 5.7%, and 6%, respectively. The incidence proportion of obesity in doctors, nurses, AHP, and supporting staff was 6.4%, 4.1%, 4%, and 4.9%, respectively. Health personnel had a 3.9% and 3.1% chance of becoming overweight and obese, respectively, a year after their first BMI measurement. The incidence proportion of overweight and obesity in health personnel, 9 years after their first BMI measurement, was 7.6% and 6.8%, respectively. There was a trend toward a higher incidence proportion of overweight and obesity in health personnel at longer follow-ups. Doctors had the highest incidence proportion of overweight (4.5%) and obesity (4.3%) compared with other health work roles at the 1-year-apart interval. Nine years later, AHP had the highest incidence proportion of overweight (9.0%). Table 4 shows the incidence rate of overweight and obesity across the four health work roles investigated in this study. The incidence rate of overweight and obesity among hospital personnel was 37/1,000 and 15/1,000 person-years, respectively. Doctors had the highest incidence rate of overweight (60/1,000 person-years) and obesity (22/1,000 person-years) compared with nurses, AHP, and supporting staff.
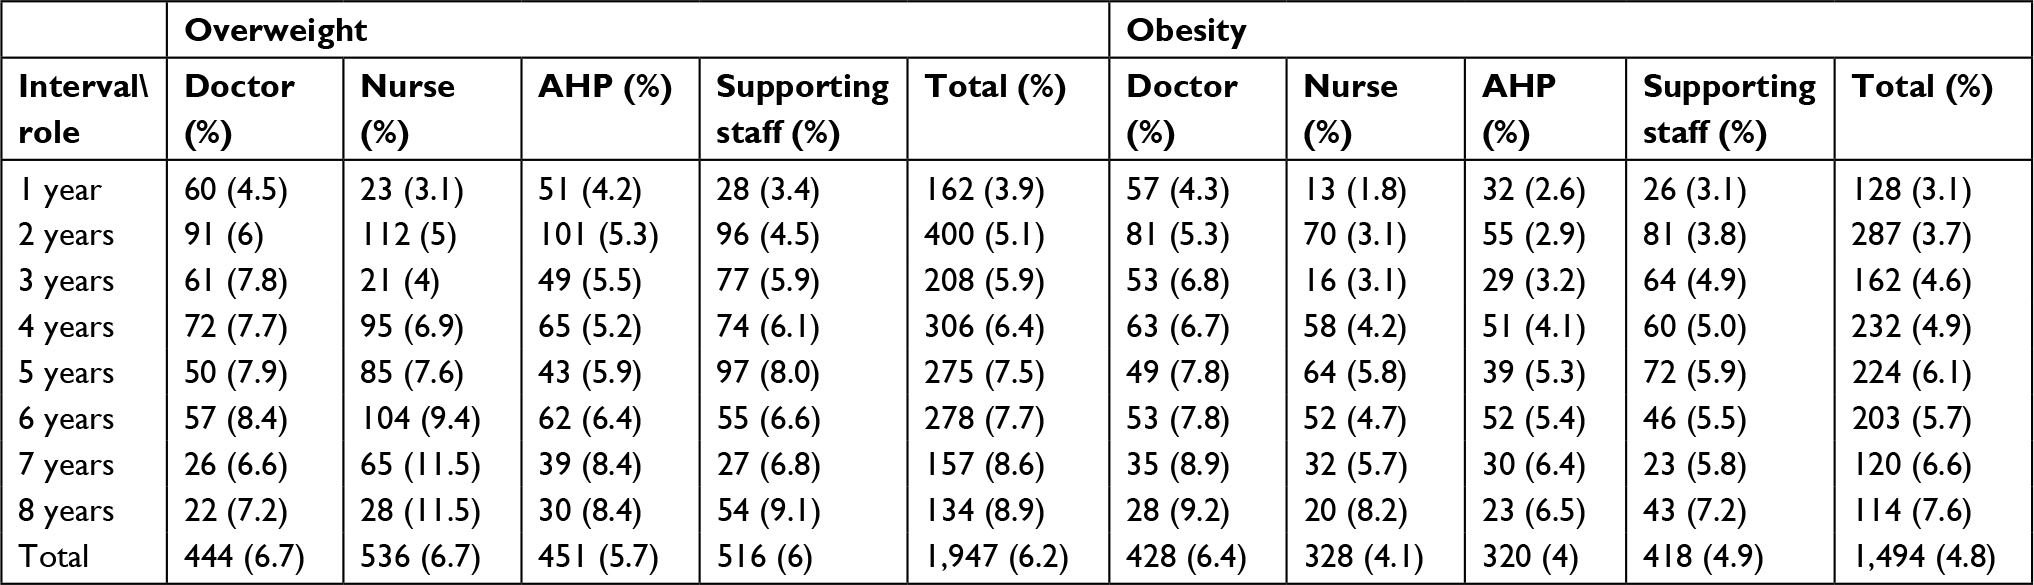 | Table 3 Period incidence proportion of overweight and obesity across four different health work roles, presented as numbers and percentages Abbreviation: AHP, allied health professional. |
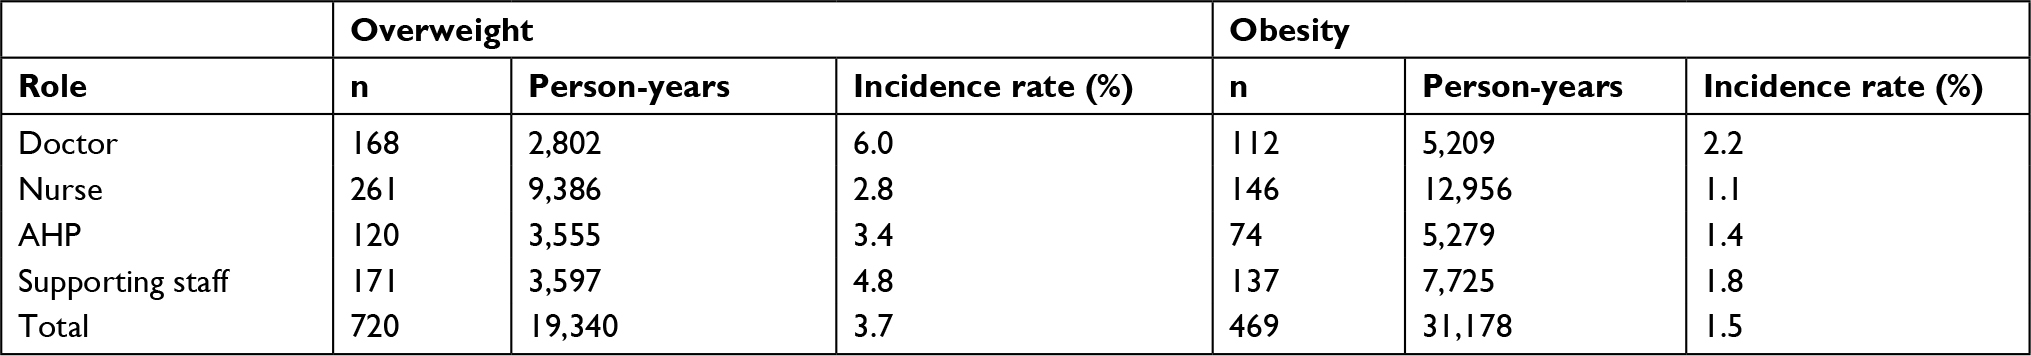 | Table 4 Incidence rate of overweight and obesity across four different health work roles Abbreviation: AHP, allied health professional. |
To clarify the morbidity of overweight and obesity, and its difference across health work roles, Cox regression analysis was used to adjust for sex and age (Table 5). Males were significantly more likely to become overweight and obese than females with an HR of 2.74 (95% CI =2.26–3.33, P=0.00) and an HR of 2.35 (95% CI =1.86–2.97, P=0.00), respectively. Health personnel were significantly more likely to become overweight (HR of 1.02 [95% CI =1.01–1.02, P=0.00]) and obese with increasing age (HR of 1.02 [95% CI =1.01–1.03, P=0.00]). The incidence proportion of overweight and obesity was not significantly different across health work roles. Compared with that in supporting staff, the HR of overweight in doctors, nurses, and AHP was 0.93 (95% CI =0.73–1.18, P=0.55), 0.92 (95% CI =0.73–1.16, P=0.49), and 0.85 (95% CI =0.67–1.09, P=0.20), respectively. Compared with that in supporting staff, the HR of obesity in doctors, nurses, and AHP was 0.86 (95% CI =0.66–1.14, P=0.30), 0.89 (95% CI =0.67–1.18, P=0.43), and 0.84 (95% CI =0.63–1.13, P=0.25), respectively.
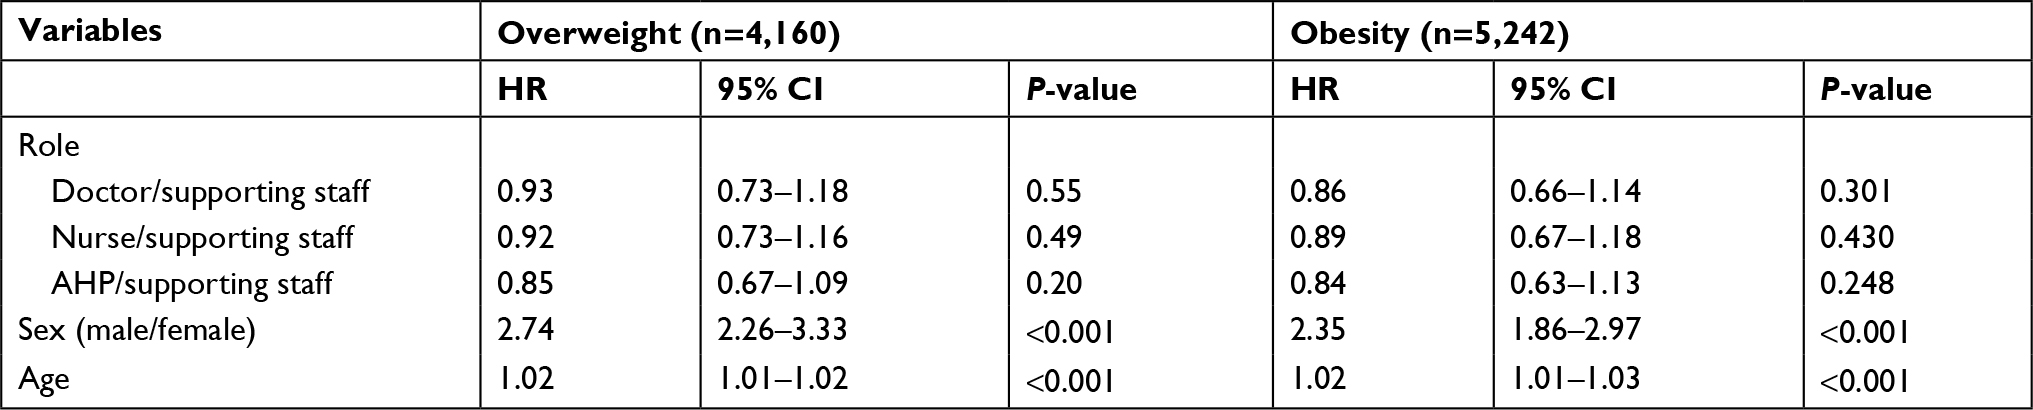 | Table 5 Comparisons of the incidence rate of overweight and obesity among health personnel adjusted for sex, age, and role Abbreviation: AHP, allied health professional. |
Discussion
Among Taiwanese health personnel, from 2007 to 2016, the overall prevalence of overweight and obesity was 21% and 15%, respectively. The incidence proportion of overweight and obesity was 6.2% and 4.8%, respectively. The incidence rate of overweight and obesity was 37/1,000 and 15/1,000 person-years, respectively. The prevalence rate was relatively stable in these 10 years; however, the period incidence proportion was higher at longer follow-ups. Nurse was the most predominant health work role in the study population. Doctors had the highest incidence proportion and density for overweight or obesity. However, after performing Cox regression analysis, the difference in morbidity across the four health work roles was not significant. Male health personnel had a significantly higher risk of becoming overweight or obese than female health personnel. With increasing age, health personnel were significantly more likely to become overweight and obese.
Overweight and obesity are important concerns for hospital personnel. In our study, the prevalence of overweight and obesity in health personnel was 36%. This finding is consistent with that reported in a study conducted in 1993, showing that the prevalence of overweight and obesity among hospital personnel in Taiwan was 17.6% and 14.5%, respectively.24 In Western countries, there is a higher prevalence of hospital personnel with overweight and obese. A UK survey showed that approximately half of the NHS staff were overweight or obese.30 A study in Mexico revealed that the prevalence of personnel with overweight and obese was 60%.23 A cross-sectional study in the USA showed this prevalence to be as high as 78.1%.31 These findings may be explained by the overweight and obesity prevalence data of the general population. According to the WHO report published in 2016, the global prevalence of overweight and obesity was 38.9%. The Americas had the highest prevalence of overweight and obesity (62.5%), followed by Europe (58.7%), the Western Pacific (31.7%), and South East Asia (21.9%).18
Our research targeting Taiwanese health personnel showed that the incidence proportion of overweight and obesity was 6.2% and 4.8%, respectively. Moreover, the incidence rate of overweight and obesity was 37/1,000 and 15/1,000 person-years, respectively. For the general population, the incidence proportion of overweight and obesity was well reported in the Framingham study. For males, the incidence proportion of overweight increased from 21.8% in the 1950s to 35.2% in the 1990s, while that of obesity increased from 5.8% to 14.8%. For females, the incidence proportion of overweight increased from 15.0% to 33.1%, while that of obesity increased from 3.9% to 14%.32 Few articles have addressed the incidence proportion of overweight and obesity in the workplace. An earlier study, conducted in 1970, investigated the incidence proportion of overweight and obesity among police and firemen in Honolulu, Hawaii.33 Another early survey focused on overweight and obesity among workers of big industrial plants in Szczecin, Poland.34 Most articles have reported the prevalence rather than the incidence proportion of overweight and obesity in health personnel. Only one retrospective cohort study examined 3,678 hospital staff in Thailand, with a follow-up time of 1.9 years. The incidence rate was 22.2/1,000 person-years (95% CI =18.8–26.1), which is consistent with that observed in our analysis.22
Our results also showed that the prevalence rate was relatively stable in the past 10 years. However, the period incidence proportion seemed to be higher at longer follow-ups. Articles addressing the trend of morbidity associated with obesity in health personnel are limited. A Mexican study published in 2001 reported changes in the prevalence of overweight and obesity between 1994 and 1996 in general hospital workers. The prevalence of overweight increased from 26.91% to 37.45%, while that of obesity increased from 9.66% to 12.6%.35 These rates are much higher than those reported in our results. However, the study showed that the increase in the prevalence of overweight was observed mainly in males (from 24.51% to 40.21%).35 Our observations support that male health personnel had a higher chance of becoming overweight or obese. The NAHSIT was conducted in 1993–1996 and 2005–2008. Results showed that the prevalence of female personnel with overweight and obese aged 45–64 years was ~50% in 2005 and ~60% in 2008.36 These findings are consistent with those of our study, as the trend did not change significantly. The prevalence reported in our analysis was much lower than that reported in the NAHSIT due to our focus on Taiwanese health personnel rather than the Taiwanese general population. The imbalance in the sex ratio in our study population may explain the difference. Regarding the sex issue, our results differ from those of a Kenyan study, in which females were found to be strongly associated with obesity and metabolic syndrome. Two studies focusing on female nurses showed that 53%–55% were overweight or obese.37,38 More studies focusing on Asian health personnel are warranted.
We classified health personnel into four health work roles. A previous study showed that nurses had the highest BMI, followed by doctors and superior technicians.39 Another study focusing on female hospital personnel revealed that overweight was more frequent in cleaning staff (56%) and nursing auxiliaries (36%) than in nurses (24%) and administrative staff (27%).40 A Taiwanese study showed that nonmedical workers had the highest prevalence of obesity (21.9%), which is similar to our results.25 The differences in health status among different health personnel roles may not only be explained by different study designs, lifestyles, and work patterns but may also be related to the different socioeconomic health inequalities, including health selection, relative resource deprivation, and the accumulation of socially patterned exposures over the life course.41 For instance, doctors had the highest incidence proportion and density; however, these differences were not significant after multivariable regression analysis. More research focusing on the incidence proportion of overweight and obesity, and how it differs across health work roles, is warranted.
Despite the high prevalence of overweight and obesity, medical staff have shown a lower level of awareness of their own individual cardiovascular disease risk factors.42 The reason for this may be related to lifestyle and job stress. Work schedules and job stress are related to obesity in nurses. Their jobs require less physical exertion and are characterized by limited movement and long working hours.43 Nurses working 12-hour night shifts exercise less due to tiredness and have increased access to junk food.44 Lifestyle also plays an important role. Hospital employees with obesity have shown higher consumption of potatoes, fats, sugary beverages, and spend more time watching television, playing computer games, and sitting.31 In a UK NHS staff survey, there was low compliance to a five-a-day fruits and vegetables recommendation and physical activity guidelines.30
Moreover, health issues and decreased work performance are challenges. Overweight and obesity in hospital employees are associated with a significantly increased cardiovascular risk of developing diabetes, hypertension, hypertriglyceridemia, and hyperuricemia.24 Another study in Taiwan also found a positive association between hospital employees with overweight or obese and cardiovascular risk factors (ie, high blood pressure, blood sugar levels, low-density lipoprotein cholesterol) and a negative association between obesity and high-density lipoprotein cholesterol.25 Dissatisfaction with worksite wellness is also higher among employees with obesity.31 Obesity may modify job demands and affect worker capacity in terms of occupational biomechanics and anthropometry. These effects may place workers at a greater risk of injury.45
It is recommended for health personnel to take appropriate preventive measures to avoid the cardiovascular risk and work burden related to obesity and to improve their health. We did not find differences across health work roles; thus, preventive measures do not have to focus on a particular role. The use of lifestyle-promoting programs, in addition to interventions in the workplace, may be effective strategies for increasing occupational ability among health care workers. Whole-system healthy workplace interventions may improve health and well-being and promote healthier behaviors in health care staff.21
limitations
Our study has several limitations. First, we did not report other confounding factors, such as lifestyle, physical activity, diet habit, and work style. Second, we only addressed overweight and obesity as defined by BMI. Central obesity measured by waist circumference was not evaluated. Further research focusing on central obesity or metabolic syndrome would provide useful information. Third, we did not examine the correlation of anthropometrics with metabolic profiles or further cardiovascular events. Therefore, further investigation is important.
Conclusion
In health personnel, the overall prevalence of overweight and obesity was 21% and 15%, respectively. The incidence proportion was 6.2% and 4.8%, respectively, while the incidence rate was 37/1,000 and 15/1,000 person-years, respectively. Morbidity across the health work roles of doctors, nurses, AHP, and supporting staff was not significantly different.
Abbreviations
AHP, allied health professionals; BMI, body mass index; ISCO, International Standard Classification of Occupations; MeSH, Medical Subject Headings; NAHSIT, Nutrition and Health Survey in Taiwan; NHS, National Health Service.
Acknowledgments
We thank the MacKay Memorial Hospital librarian, Pei-jin Li, for examining the references. We thank Chun-Yang Huang, cardiovascular surgeon in the Taipei Veterans General Hospital, for facilitating our access to resources. We would like to thank Uni-edit (www.uni-edit.net) for editing and proofreading this manuscript.
Author contributions
All authors made substantial contributions as follows: 1) SLW, LCH, and TLY conceived and designed the study; 2) SLW, HHChiu, and TLY acquired, analyzed, and interpreted the data; 3) TLY drafted the article; and 4) HHChen critically revised the article to add important intellectual content. All authors contributed to data analysis, drafting and revising the article, gave final approval of the version to be published, and agree to be accountable for all aspects of the work.
Disclosure
This research did not receive any specific grant from funding agencies in the public, commercial, or not-for-profit sectors. All authors had full access to the data of the study and take responsibility for the integrity of the data and accuracy of the data analysis. The authors report no other conflicts of interest in this work.
References
Clinical Guidelines on the Identification, Evaluation, and Treatment of Overweight and Obesity in Adults--The Evidence Report. National Institutes of Health. Obes Res. 1998;6 (Suppl 2):51S–209S. | ||
Aune D, Sen A, Prasad M, et al. BMI and all cause mortality: systematic review and non-linear dose-response meta-analysis of 230 cohort studies with 3.74 million deaths among 30.3 million participants. BMJ. 2016;353:i2156. | ||
Tobias DK, Pan A, Jackson CL, et al. Body-mass index and mortality among adults with incident type 2 diabetes. N Engl J Med. 2014;370(3):233–244. | ||
Kramer CK, Zinman B, Retnakaran R. Are metabolically healthy overweight and obesity benign conditions? A systematic review and meta-analysis. Ann Intern Med. 2013;159(11):758–769. | ||
Pischon T, Boeing H, Hoffmann K, et al. General and abdominal adiposity and risk of death in Europe. N Engl J Med. 2008;359(20):2105–2120. | ||
Flegal KM, Graubard BI, Williamson DF, Gail MH. Cause-specific excess deaths associated with underweight, overweight, and obesity. JAMA. 2007;298(17):2028–2037. | ||
Yan LL, Daviglus ML, Liu K, et al. Midlife body mass index and hospitalization and mortality in older age. JAMA. 2006;295(2):190–198. | ||
Price GM, Uauy R, Breeze E, Bulpitt CJ, Fletcher AE. Weight, shape, and mortality risk in older persons: elevated waist-hip ratio, not high body mass index, is associated with a greater risk of death. Am J Clin Nutr. 2006;84(2):449–460. | ||
Mctigue K, Larson JC, Valoski A, et al. Mortality and cardiac and vascular outcomes in extremely obese women. JAMA. 2006;296(1):79–86. | ||
Jee SH, Sull JW, Park J, et al. Body-mass index and mortality in Korean men and women. N Engl J Med. 2006;355(8):779–787. | ||
Gu D, He J, Duan X, et al. Body weight and mortality among men and women in China. JAMA. 2006;295(7):776–783. | ||
Freedman DM, Ron E, Ballard-Barbash R, Doody MM, Linet MS. Body mass index and all-cause mortality in a nationwide US cohort. Int J Obes. 2006;30(5):822–829. | ||
Adams KF, Schatzkin A, Harris TB, et al. Overweight, obesity, and mortality in a large prospective cohort of persons 50 to 71 years old. N Engl J Med. 2006;355(8):763–778. | ||
Boggs DA, Rosenberg L, Cozier YC, et al. General and abdominal obesity and risk of death among black women. N Engl J Med. 2011;365(10):901–908. | ||
Berrington de Gonzalez A, Hartge P, Cerhan JR, et al. Body-mass index and mortality among 1.46 million white adults. N Engl J Med. 2010;363(23):2211–2219. | ||
Prospective Studies Collaboration, Whitlock G, Lewington S, et al. Body-mass index and cause-specific mortality in 900 000 adults: collaborative analyses of 57 prospective studies. Lancet. 2009;373(9669):1083–1096. | ||
World Health Organization. Obesity: preventing and managing the global epidemic. Report of a WHO consultation. World Health Organ Tech Rep Ser. 2000;894(i–xii):1–253. | ||
World Health Organization. Global health Observatory Data Repository. Prevalence of overweight among adults, BMI ≥ 25, age-standardized. Estimates by who region. 2017; 2016, prevalence of overweight among adults, BMI ≥ 2025 (age-standardized estimate) (%), 2018+ years, both sexes. Available from: http://apps.who.int/gho/data/view.main.GLOBAL2461A?lang=en. Accessed April 23, 2018. | ||
World Health Organization. Classifying health workers; 2010. Available from: www.who.int/hrh/statistics/workforce_statistics. Accessed August 17, 2018. | ||
Leong L, Chia SE. Prevalence of cardiovascular risk factors among healthcare staff in a large healthcare institution in Singapore. Singapore Med J. 2012;53(8):517–521. | ||
Brand SL, Thompson Coon J, Fleming LE, Carroll L, Bethel A, Wyatt K. Whole-system approaches to improving the health and wellbeing of healthcare workers: a systematic review. PLoS One. 2017;12(12):e0188418. | ||
Kitayaporn D, Sudlah N, Athirakul K, Jenkolrob K, Anuras S, Anuras J. Incidence and factors associated with overweight and obesity, and hypertensive disorder, among staff in a private healthcare setting: a retrospective cohort study. J Med Assoc Thai. 2011;94(9):1044–1052. | ||
del Pilar Cruz-Domínguez M, González-Márquez F, Ayala-López EA, et al. [Overweight, obesity, metabolic syndrome and waist/height index in health staff]. Rev Med Inst Mex Seguro Soc. 2015;53(Suppl 1):S36–S41. Spanish | ||
Hwang LC, Tsai CH, Chen TH. Overweight and obesity-related metabolic disorders in hospital employees. J Formos Med Assoc. 2006;105(1):56–63. | ||
Lin CM, Li CY. Prevalence of cardiovascular risk factors in Taiwanese healthcare workers. Ind Health. 2009;47(4):411–418. | ||
Braithwaite J, Westbrook M. Rethinking clinical organisational structures: an attitude survey of doctors, nurses and allied health staff in clinical directorates. J Health Serv Res Policy. 2005;10(1):10–17. | ||
Health Promotion Administration Ministry of Health and Welfare. Check your body weight every day. Available from: https://www.hpa.gov.tw/Pages/Detail.aspx?nodeid=542&pid=9734. Accessed April 23, 2018. | ||
Centers for Disease Control and Prevention. Lesson 3: measures of risk; 2012. Available from: https://www.cdc.gov/ophss/csels/dsepd/ss1978/lesson3/section2.html. Accessed August 16, 2018. | ||
Breslow NE, Day NE. Statistical methods in cancer research. Volume II-The design and analysis of cohort studies. IARC Sci Publ. 1987;82:1–406. | ||
Sharma SV, Upadhyaya M, Karhade M, et al. Are hospital workers healthy? A study of cardiometabolic, behavioral, and psychosocial factors associated with obesity among hospital workers. J Occup Environ Med. 2016;58(12):1231–1238. | ||
Uwanuruochi K, Ukpabi OJ, Onwuta CN, Onwubere BJ, Anisiuba BC, Michael FS. Cardiovascular risk factors in adult staff of federal medical centre, Umuahia: a comparison with other Nigerian studies. West Afr J Med. 2013;32(4):243–247. | ||
Parikh NI, Pencina MJ, Wang TJ, et al. Increasing trends in incidence of overweight and obesity over 5 decades. Am J Med. 2007;120(3):242–250. | ||
Morioka HM, Brown ML. Incidence of obesity and overweight among Honolulu police and firemen. Public Health Rep. 1970;85(5):433–439. | ||
Grobelna M, Sygit M, Cipkowska B. Czestość wystepowania nadwagi a zwyczaje zywieniowe wybranej grupy pracowników fizycznych duzych zakładów przemysłowych Szczecina [Incidence of obesity and food habits among industrial workers of Szczecin]. Med Pr. 1979;30(6):403–410. Polish. | ||
Fanghänel G, Sánchez-Reyes L, Berber A, Gómez-Santos R. Evolution of the prevalence of obesity in the workers of a general Hospital in Mexico. Obes Res. 2001;9(4):268–273. | ||
Yeh CJ, Chang HY, Pan WH. Time trend of obesity, the metabolic syndrome and related dietary pattern in Taiwan: from NAHSIT 1993-1996 to NAHSIT 2005-2008. Asia Pac J Clin Nutr. 2011;20(2):292–300. | ||
Lomas C. The nurse who drove down obesity. Nurs Times. 2007;103(13):22–23. | ||
Miller SK, Alpert PT, Cross CL. Overweight and obesity in nurses, advanced practice nurses, and nurse educators. J Am Acad Nurse Pract. 2008;20(5):259–265. | ||
Campos-Matos I, Peralta-Santos A, Gomes B, Borges G, Aguiar P. Body mass index assessment of health care professionals in a primary care setting in Portugal: a cross sectional study. Acta Med Port. 2014;27(5):609–614. | ||
Mamelle N, Bertucat I, Bossard N, Saury A, Monier MT, Tourniaire J. Facteurs de risque de surcharge pondérale: enquête auprès du personnel féminin hospitalier [Risk factors in overweight: a survey among female hospital personnel]. Rev Epidemiol Sante Publique. 1990;38(2):117–124. German. | ||
Marmot MG, Smith GD. Socio-economic differentials in health. J Health Psychol. 1997;2(3):283–296. | ||
Sovová E, Nakládalová M, Kaletová M, Lukl J, Benusová I, Doupalová P. Vliv cílene intervence na výskyt rizikových faktorů kardiovaskulárních onemocnĕní u zdravotnických zamĕstnanců [The influence of targeted intervention on the incidence of risk factors of cardiovascular diseases at medical staff]. Vnitr Lek. 2006;52(1):21–25. Czech. | ||
Han K, Trinkoff AM, Storr CL, Geiger-Brown J. Job stress and work schedules in relation to nurse obesity. J Nurs Adm. 2011;41(11):488–495. | ||
Gillen S. Staff obesity must be tackled by employers, doctors demand. Nurs Stand. 2013;27(19):9. | ||
Cavuoto LA, Nussbaum MA. Influences of obesity on job demands and worker capacity. Curr Obes Rep. 2014;3(3):341–347. |
 © 2019 The Author(s). This work is published and licensed by Dove Medical Press Limited. The
full terms of this license are available at https://www.dovepress.com/terms
and incorporate the Creative Commons Attribution
- Non Commercial (unported, 3.0) License.
By accessing the work you hereby accept the Terms. Non-commercial uses of the work are permitted
without any further permission from Dove Medical Press Limited, provided the work is properly
attributed. For permission for commercial use of this work, please see paragraphs 4.2 and 5 of our Terms.
© 2019 The Author(s). This work is published and licensed by Dove Medical Press Limited. The
full terms of this license are available at https://www.dovepress.com/terms
and incorporate the Creative Commons Attribution
- Non Commercial (unported, 3.0) License.
By accessing the work you hereby accept the Terms. Non-commercial uses of the work are permitted
without any further permission from Dove Medical Press Limited, provided the work is properly
attributed. For permission for commercial use of this work, please see paragraphs 4.2 and 5 of our Terms.