Back to Journals » Research and Reports in Tropical Medicine » Volume 14
Monetary Value of Disability-Adjusted Life Years and Potential Productivity Losses Associated With Neglected Tropical Diseases in the East African Community
Authors Kirigia JM ![]() , Kubai PK
, Kubai PK ![]()
Received 6 February 2023
Accepted for publication 16 June 2023
Published 29 June 2023 Volume 2023:14 Pages 35—47
DOI https://doi.org/10.2147/RRTM.S382288
Checked for plagiarism Yes
Review by Single anonymous peer review
Peer reviewer comments 3
Editor who approved publication: Dr Mario Rodríguez-Pérez
Joses Muthuri Kirigia,1 Patrick Kinyua Kubai2
1African Sustainable Development Research Consortium (ASDRC), Nairobi, Kenya; 2Meru University of Science and Technology (MUST), Meru, Kenya
Correspondence: Joses Muthuri Kirigia, ASDRC, P.O. Box 6994 00100 GPO, Nairobi, Kenya, Email [email protected]
Introduction: In 2019, the East African Community (EAC) lost 12,048,918 disability-adjusted life-years (DALY) across all ages from neglected tropical diseases (NTDs). The specific objectives of the study reported in the paper were to estimate for EAC the monetary value of DALYs sustained by all ages from NTDs, and the potential productivity losses within the working age bracket of 15 years and above.
Methods: The EAC total monetary value of DALYs lost from all 20 NTDs is the sum of each partner state’s monetary value of DALYs lost from all 20 NTDs. The ith partner state’s monetary value of DALY from jth disease equals ith state’s GDP per capita net of current health expenditure multiplied by DALYs lost from jth disease in 2019. The EAC total productivity losses attributable to DALYs lost from all 20 NTDs is the sum of lost productivity across the seven partner states. The ith partner state’s productivity loss associated with jth disease equals ith state’s GDP per capita net of current health expenditure multiplied by DALYs lost from jth disease and the ith state’s labour force participation rate adjusted for underutilization (unemployment and time-related underemployment) in 2019.
Results: The total 12,048,918 DALYs lost in EAC from NTDs had a of International Dollars (Int$) 21,824,211,076 and an average of Int$ 1811 per DALY. The 2,614,464 DALYs lost from NTD among 15-year-olds and above caused an estimated of Int$ 2,588,601,097 (0.392% of the EAC gross domestic product in 2019), and an average of Int$ 990.1 per DALY.
Conclusion: The study succeeded in estimating the monetary value of DALYs sustained by all ages from 20 NTDs, and the potential productivity losses within the working age bracket of 15 years and above in the seven EAC partner states. The DALYs lost from NTD among 15-year-olds and above caused a sizeable loss in the economic productivity of EAC.
Keywords: neglected tropical diseases, disability-adjusted life years, gross domestic product, current health expenditure, non-health GDP per capita
Introduction
The inter-governmental organization of the East African Community (EAC) has seven Partner States, consisting of Burundi, the Democratic Republic of Congo (DRC), Kenya, Rwanda, South Sudan, Tanzania, and Uganda, headquartered in Arusha, Tanzania.1 In 2019, the EAC had a total population of 267.843 million people, a total gross domestic product (GDP) of International Dollars (Int$) 659.6 billion, and a GDP per capita of Int$2,462.64.2
The neglected tropical diseases (NTDs) serve to reduce the pace of health and economic development.3 As depicted in Supplementary Table 1, in 2019, the EAC lost 12,044,918 disability-adjusted life-years (DALY) across all ages from the 20 NTDs.4 Approximately 49.8% of the total EAC NTD disease burden was borne by DRC, 17.0% by Uganda, 13.5% by Tanzania, 6.4% by Kenya, 5.7% by Burundi, 5.1% by South Sudan, and 2.5% by Rwanda. Thus, DRC alone incurred almost half of the total NTD burden in the EAC. About 98% of NTD-related all-ages DALYs lost in the EAC were from eight causes, ie, malaria, onchocerciasis, schistosomiasis, intestinal nematode infections, Ebola, leishmaniasis, lymphatic filariasis, and cysticercosis. The remaining nine causes accounted for almost 2% of DALYs. It is worth noting that 83% of all-ages DALYs were caused by malaria alone.
The children aged 0–14 years bore 9,434,454 (78.3%) of the total NTD-related DALYs lost in the EAC (Supplementary Table 2).4 DRC bore 48.4%, Uganda bore 18.5%, Tanzania bore 14.3%, Burundi bore 6.1%, Kenya bore 5.5%, South Sudan bore 4.9%, and Rwanda bore 2.3%. Therefore, DRC’s 0–14-year-olds incurred almost half of the DALY’s loss in the EAC. About 93% of DALYs lost among 0–14-year-olds were caused by malaria. Onchocerciasis, intestinal nematode infections, and leishmaniasis each accounted for about one per cent of the DALYs. The remaining 13 causes (Ebola, Schistosomiasis, Rabies, lymphatic filariasis, yellow fever, African trypanosomiasis, food-borne trematodes, Dengue, leprosy, cystic echinococcosis, cysticercosis, Guinea worm disease, and other NTDs accounted for almost 4% of the DALYs. Thus, over three-quarters of the DALYs among children were caused by malaria.
The 15-year-olds and above bore 2,614,464 (21.7%) of the total NTD EAC DALY loss (Supplementary Table 3).4 Of these, DRC incurred 54.9%, Uganda 11.6%, Tanzania 10.7%, Kenya 9.6%, South Sudan 5.8%, Burundi 4.1%, and Rwanda 3.4%. About 90.2% of the DALYs lost among 15-year-olds and above resulted from five causes: malaria (45.4%), Onchocerciasis (24.4%), schistosomiasis (10.0%), Ebola (5.8%), and intestinal nematode infections (4.6%). Cysticercosis, Lymphatic filariasis, yellow fever, rabies, and African trypanosomiasis caused 8.34% of the DALYs. Approximately 1.45% of DALYs resulted from Dengue, trachoma, cystic echinococcosis, leprosy, Guinea worm disease, and other NTDs.
The success of EAC’s fight against NTDs depends on the strength of partner states’ national health systems (NHS),5 systems that tackle social determinants of health (SDH),6 and national health research systems (NHRS).7 However, first, the NHSs in EAC are underperforming.8 For example, the EAC partner states had gaps in the overall UHC service coverage index (UHCSCI) of 56% in Burundi, 61% in DRC, 44% in Kenya, 46% in Rwanda, 68% in South Sudan, 50% in Uganda, and 54% in Tanzania.8 The gaps in UHCSCI are due to deficits in its component sub-indices on infectious diseases (IDS); noncommunicable diseases (NCD); reproductive, maternal, newborn and child health (RMNCH); and service delivery capacity and access (SDCA).8 For instance, the deficits in the UHC service coverage sub-index on IDS (which include NTDs) were 45% in Burundi, 56% in DRC, 47% in Kenya, 37% in Rwanda, 72% in South Sudan, 49% in Uganda, and 49% in Tanzania.8
In turn, the gaps in the UHC service coverage sub-index on IDS are partly related to the sub-optimal densities of human resources for health and health financing.9,10 In 2019, the number of physicians per 10,000 population in Burundi of 1.1, DRC at 4.1, Kenya at 3.3, Rwanda at 3.1, South Sudan at 1.6, Uganda at 1.8, Tanzania at 4.9 were significantly lower than the minimum requirement of 20.7 to achieve a UHCSCI of 80 out of 100.9 Similarly, the current health expenditure per capita of US$ 21 in Burundi, US$ 21 in DRC, US$ 83 in Kenya, US$ 51 in Rwanda, US$ 23 in South Sudan, US$ 32 in Uganda, and US$ 40 in Tanzania fell short of the McIntyre, Meheus and Røttingen’s recommended target of US$86 needed for universal access to primary health care services.10,11
Second, the availability of safely managed water and sanitation, and the practice of handwashing with soap and water are essential interventions in the fight against NTD infections. According to the WHO, in 2020, 12% (Rwanda) to 19% (DRC) of the population used safely managed drinking water services; 13% (DRC) to 26% (Tanzania) of the population used safely managed sanitation services; and 5 (Rwanda) to 48% (Tanzania) of the population used a handwashing facility with soap and water.12 These statistics indicate that most of the EAC population does not have access to safely managed drinking water and sanitation services, which predisposes them to the risk of NTD infections.
Third, the existence of vibrant NHRS in EAC partner states is vital for the generation and utilization of contextualized evidence to guide the development of policies and plans for scaling-up coverage of preventive and management interventions against NTDs.13,14 Regrettably, in 2018, the NHRS barometer score for Burundi, DRC, and South Sudan was below 50% (on a scale of 0 to 100%), ie, below average performance.15 On the other hand, the NHRS barometer scores for Kenya, Rwanda, Uganda, and Tanzania were between 70% and 87%, signifying sub-optimal but better performance.
Given the competing needs in various sectors, health-related sectors will need to mount vigorous evidence-based advocacy with national partner states governments, private sectors, and external health development partners, to raise additional resources for bridging the existing gaps in NHS,5 SDH,12 and NHRS.15 Furthermore, eliminating those systemic deficits is crucial for partner states to attain the United Nations Sustainable Development Goal 3.3 target of ending the epidemics of NTDs by 2030.16
Some of the evidence needed in advocacy for increased investments in the fight against NTDs are estimates of the monetary value of DALYs and potential productivity losses associated with NTDs. According to Card and Mooney valuation of human life [and indeed the burden of disease] should be made more rational and explicit because health development resources are limited.17 Rice explains that estimates of productivity losses help translate the burden of disease into dollar terms, which is the universal language in the policy arena, and is also useful for advocacy for increased investments into intervention programmes, and guiding the allocation of research resources on specific diseases (p.178).18
Globally, a few systematic reviews have summarized studies on the economic burden of some NTDs. For example, the economic burden of malaria by Andrade et al,19 leishmaniasis by Sunyoto, Boelaert and Meheus,20 Human African trypanosomiasis (HAT) by Keating et al,21 Taenia solium cysticercosis in Tanzania by Trevisan et al,22 Cystic echinococcosis (CE) by Widdicombe et al,23 lymphatic filariasis (LF) and onchocerciasis by Keating et al,24 vision impairment by Marques et al,25 dengue by Oliveira, Itria and Lima,26 and yellow fever by de Broucker et al27. However, most of the studies included in these systematic reviews capture the indirect costs (productivity losses) incurred by households due to time losses arising from illness. Also, there is a dearth of published indirect cost studies on some NTDs. Thus, there was a need for comparable contextualized estimates of the monetary value of DALYs and potential productivity losses for all the EAC partner states and all the pertinent NTDs for use in advocacy demonstrating the likely social value of NTD-related health programs.
The current study attempted to answer the following two research questions: (a) Assuming all lives are equally valuable to the EAC society, irrespective of age and productivity, what is the monetary value of DALYs incurred by the EAC in 2019? (b) From a societal (economy-wide) perspective, what is the overall economic productivity loss (indirect cost) associated with NTD-related DALYs losses among persons aged 15 years and above in the EAC in 2019?
The specific objectives of the study reported in this paper were to:
- estimate per EAC country the monetary value of DALYs sustained by all ages from 20 NTDs.
- estimate per EAC country the productivity losses within the working age bracket of 15 years and above.
Methods
Study Area and Population
The cross-sectional monetary valuation part of the study focuses on the 12,048,918 DALY lost among all ages from 20 NTDs in the seven EAC partner states in 2019.4 Whereas, productivity loss analysis focuses on the 2,614,464 DALYs lost among 15-year-olds and above due to 20 NTDs in the EAC. The NTDs include African trypanosomiasis, cystic echinococcosis, cysticercosis, dengue, Ebola, food-borne trematodiases, Guinea worm disease, intestinal nematode infections, leishmaniasis, leprosy, lymphatic filariasis, malaria, onchocerciasis, rabies, schistosomiasis, trachoma, yellow fever, Chagas disease, zika virus, and other neglected tropical diseases.
Estimation of the Monetary Value of DALYs Lost in the EAC from NTDs in 2019
This subsection focuses on the monetary valuation of the 12,048,918 DALY lost among all ages from 20 NTDs in the seven EAC partner states in 2019.4 Murray defined a DALY as “an indicator of the time lived with a disability [states of less-than-optimal health] and the time lost due to premature mortality” (p.441).28 Lopez et al29 define disability as limitations in carrying out activities of daily living because of any physical, sensory, cognitive, or emotional abnormality caused by disease or injury. Murray28 and the WHO30 document methods for estimating DALY. GBD 2019 Diseases and Injuries Collaborators explains the methodology of the Global Burden of Disease Study 2019.31
The EAC total monetary value of DALYs  lost from all 20 NTDs is the sum of each partner state’s monetary value of DALYs
  lost from all 20 NTDs. Formally:
Where:  is the summation from country i=1 to i=7; i = Burundi, DRC, Kenya, Rwanda, South Sudan, Tanzania, and Uganda;
  is the partner state i total monetary value of DALYs from all NTDs.
A partner state’s  is the sum of the monetary values of DALYs from each of the 20 NTDs
  . That is:
Where:  is the summation of monetary values from disease j=1 to j=20.
The ith partner state’s monetary value of DALY from jth disease equals ith state’s GDP per capita net of current health expenditure multiplied by DALYs lost from jth disease in 2019.

Where:  is the GDP per capita for ith partner state in 2019;
  is the current health expenditure per capita ith partner state in 2019 (the latest year for which data was available);
  are the DALYs lost by ith state from jth NTD in 2019 (the latest year for which data was available).
Why have we used non-health GDP per capita (ie,  ) in the valuation of DALYs? According to Chisholm et al32 and WHO,33 given that consumers of health care derive utility or happiness from improved health (and not health care per se), a more appropriate quantity of interest would be the impact of diseases (such as NTDs) on the non-health components of GDP.
Estimation of Productivity Losses Associated with NTDs
This subsection estimates economic productivity losses (indirect costs) associated with 2,614,464 NTD-related DALY lost among persons aged 15 years and above in the seven EAC partner states in 2019. The EAC total productivity losses  attributable to DALYs lost from all 20 NTDs is the sum of lost productivity across the seven partner states:
Where:  is the summation from partner state i=1 to i=7;
  is the partner state i total productivity loss from all NTDs.
Each partner state’s total productivity loss is the sum of productivity losses associated with each of the 20 NTDs  . That is:
Where:  is the summation from disease j=1 to j=20.
The ith partner state’s productivity loss associated with jth disease equals ith state’s GDP per capita net of current health expenditure multiplied by DALYs lost from jth disease and the ith state’s adjusted labour force participation rate  . Formally:

Where:  ,
,  , and
, and  are as defined earlier.
  equals ith partner state labour force participation rate among the population aged 15 years and above (
 ) minus the state’s combined rate of unemployment and time-related underemployment (
 ). According to the International Labor Organization:34
Persons in unemployment are defined as all those of working age who were not in employment, carried out activities to seek employment during a specified recent period and were currently available to take up employment given a job opportunity (p.10).
Persons in time-related underemployment are defined as all persons in employment who, during a short reference period, wanted to work additional hours, whose working time in all jobs was less than a specified hours threshold, and who were available to work additional hours given an opportunity for more work (p.9).
Data and Sources
Table 1 contains data used in estimating Equations 1–6.
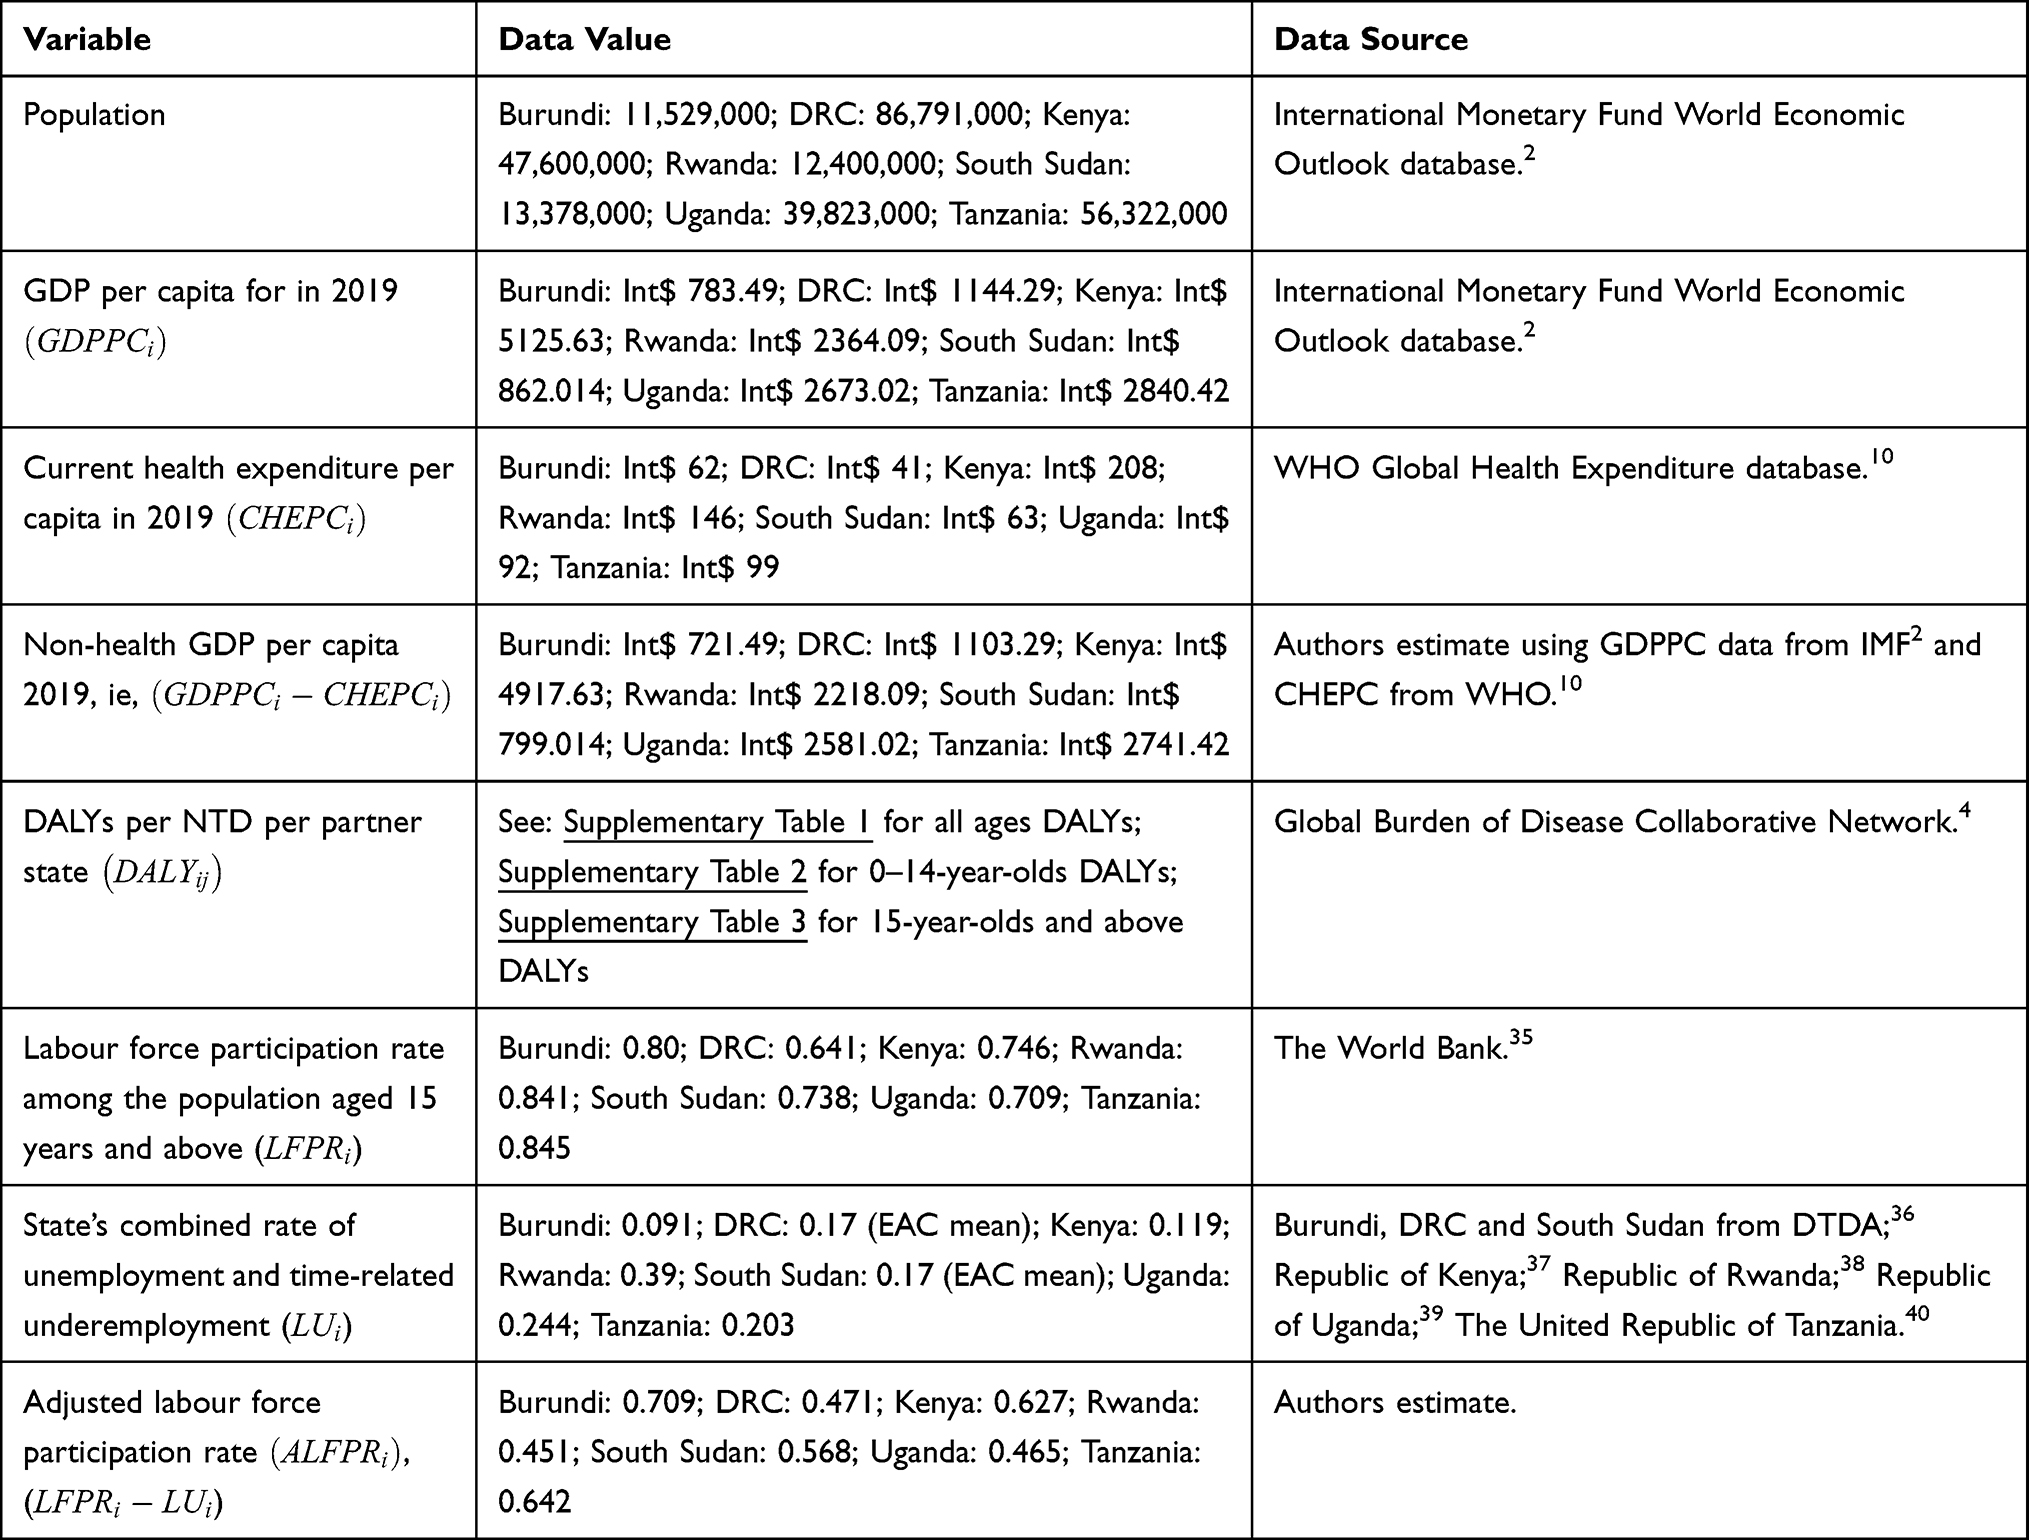 |
Table 1 Data and Sources |
Data Analysis
The Excel Software developed by Microsoft (New York) was utilized to estimate Equations 1–6.
Ethical Clearance
The need for ethics approval was waived by the Meru University of Science and Technology Institutional Research and Ethics Review Committee (MIRERC) [REF: MU/1/39/28 Vol. 2 (105)]. According to MIRERC Standard Operating Procedures (SOP),41 Clause 15.4.5, the following forms of research are exempted from the ethical review:
15.4.5 Research involving the collection or study of existing data, documents, records, pathological specimens, or diagnostic specimens, if these sources are publicly available or if the information is recorded by the investigator in such a manner that subjects cannot be identified, directly or through identifiers that are linked to the subjects. (p.23)
The said MIRERC SOP document is available at https://www.must.ac.ke/wp-content/uploads/2017/10/MIRERC-SOPs-28-June-2017.pdf.
The reason for the ethics waiver was that our study manuscript completely relied on the analysis of existing/secondary data (which is recorded in a manner that subjects cannot be identified at all) from international publicly available sources (International Monetary Fund, Institute of Health Metrics, and World Health Organization).
Results
The Monetary Value of DALYs per Country
As shown in Table 2, in 2019, the all-ages 12,048,918 DALYs lost in EAC from NTDs had a  of Int$21,824,211,076; and an average of Int$1811 per DALY.
  are the value society attaches to DALYs lost at all ages, ie, from age zero and above. The monetary value per person in the population was Int$81, varying from Int$37 in South Sudan to Int$133 in Uganda. On the other hand, the EAC monetary value per DALY was Int$1811, ranging from Int$762 in Burundi to Int$4918 in Kenya.
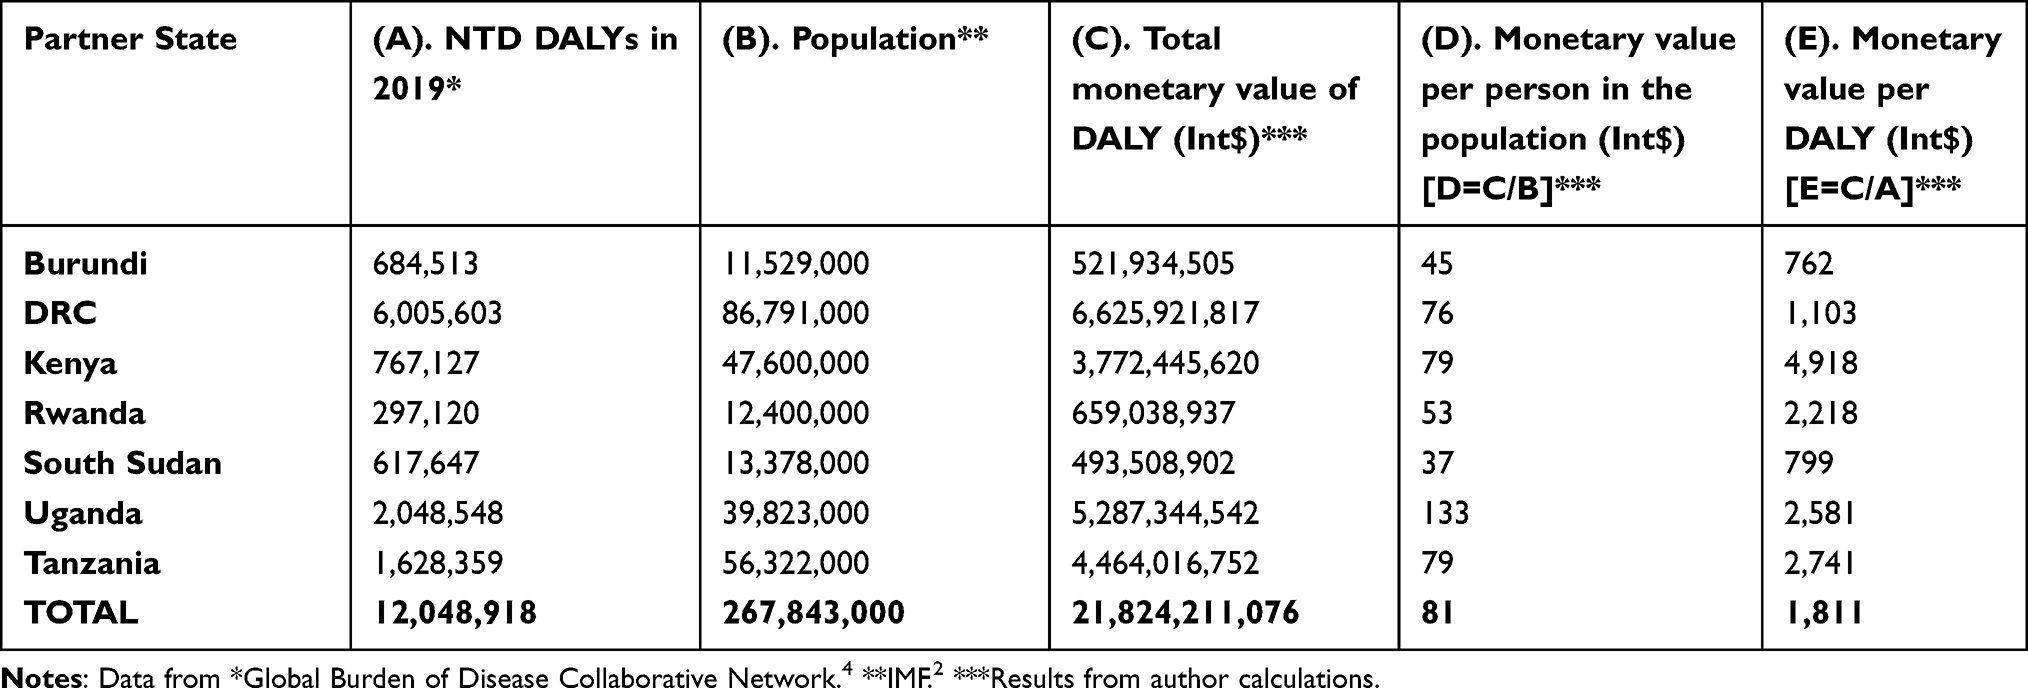 |
Table 2 EAC Monetary Value of DALYs Lost Across All Ages in 2019 |
Of the  caused by NTDs, DRC bore 30.4%, Uganda bore 24.2%, Tanzania bore 20.4%, Kenya bore 17.3%, Rwanda bore 3.0%, Burundi bore 2.4%, and South Sudan bore 2.3%. Thus, DRC and Uganda alone incurred 54.6% of the
  .
.
The Monetary Value per NTD
Table 3 shows the EAC monetary value of DALYs lost from individual NTDs across all ages in 2019 (see Supplementary Table 4 for details). Five diseases (intestinal nematode infections, malaria, onchocerciasis, schistosomiasis, Ebola) alone accounted for 95.2% of the monetary value of DALYs lost. About 84% of  result from malaria (Supplementary Table 5).
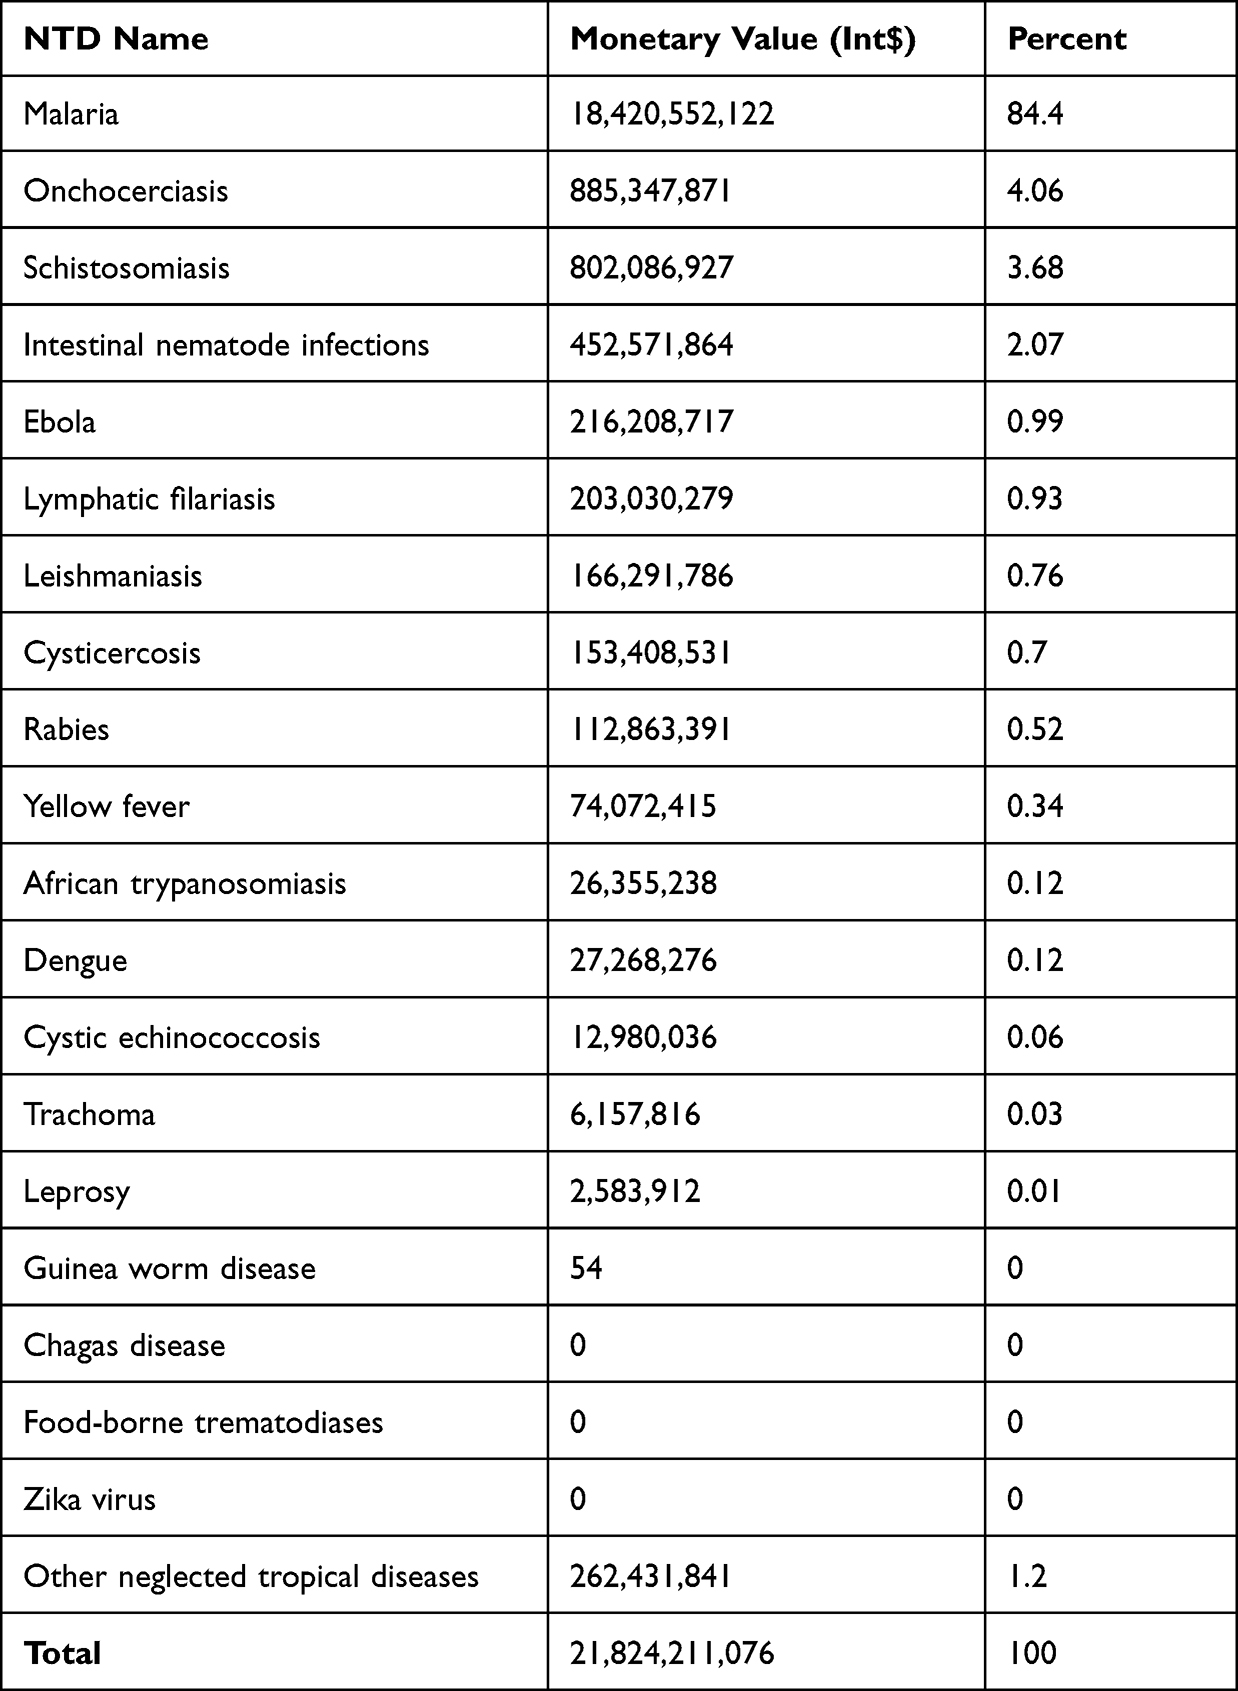 |
Table 3 East African Community Monetary Value of DALYs Lost from NTDs Across All Ages in 2019 |
Potential Productivity Loss per Country
As depicted in Figure 1, the 2,614,464 DALYs lost from NTD among 15-year-olds and above caused an estimated  of Int$ 2,588,601,097, ie, 0.392% of the EAC GDP in 2019.
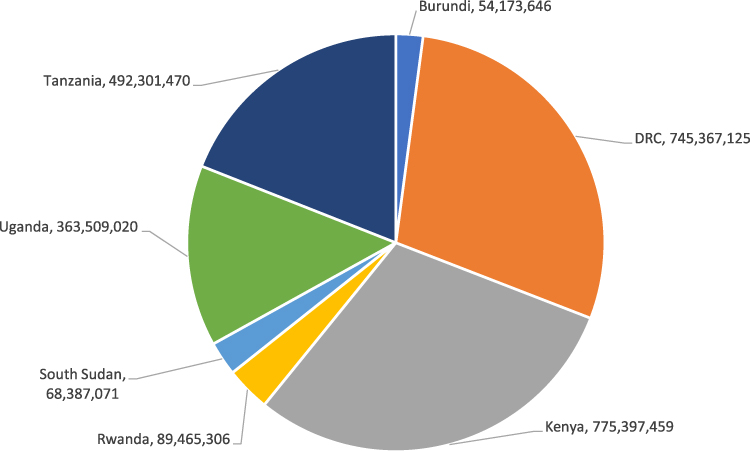 |
Figure 1 Neglected tropical diseases caused economic productivity losses per East African Community party state (2019 Int$ or Purchasing Power Parity). |
Out of the  , 30.0% was incurred by Kenya, 28.8% by DRC, 19.0% by Tanzania, 14.0% by Uganda, 3.5% by Rwanda, 2.6% by South Sudan, and 2.1% by Burundi. Thus, DRC and Kenya alone bore 58.7% of the lost productivity in the EAC.
Figure 2 presents the Economic productivity lost from NTDs per 100,000 population in the EAC in 2019. Overall, the EAC incurred a productivity loss of Int$966,462 per 100,000 population from NTDs in 2019. In terms of NTD-related productivity losses per 100,000 population, the EAC partner states ranked in the following order: Kenya, Uganda, DRC, Tanzania, Rwanda, South Sudan, and Burundi.
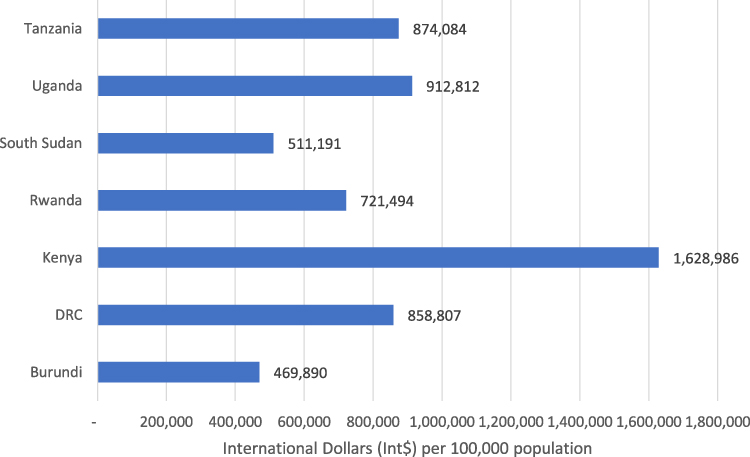 |
Figure 2 Potential economic productivity lost from neglected tropical diseases per 100,000 population in the East African Community (Int$, 2019). |
As depicted in Table 4, the EAC average productivity loss per person in population was Int$ 9.7, and the productivity loss per DALY was Int$ 990.1 in the EAC. The productivity loss per person in a population varied from Int$ 5.3 in Burundi to Int$ 16.3 in Kenya. Whereas the productivity loss per DALY ranged from Int$ 453.8 in South Sudan to Int$ 3083.4 in Kenya.
 |
Table 4 Potential Economic Productivity Lost from NTDs per EAC Partner State in 2019 |
Productivity Losses per NTD
As shown in Table 5, malaria caused 51% of EAC’s total economic productivity losses associated with NTDs. Approximately 88.7% of the  was caused by five NTDs, ie, malaria (50.62%), schistosomiasis (15.60%), onchocerciasis (13.90%), intestinal nematode infections (5.27%), and lymphatic filariasis (3.28%). Another eleven NTDs (cysticercosis, Ebola, rabies, leishmaniasis, yellow fever, African trypanosomiasis, dengue, cystic echinococcosis, trachoma, leprosy, and Guinea worm disease) accounted for 10.1% of the productivity lost. There were no DALY and productivity losses from Chagas disease, Food-borne trematodiases, and Zika virus. Other neglected tropical diseases, not specified in the GBD study, accounted for 1.24% of the lost productivity in the EAC.
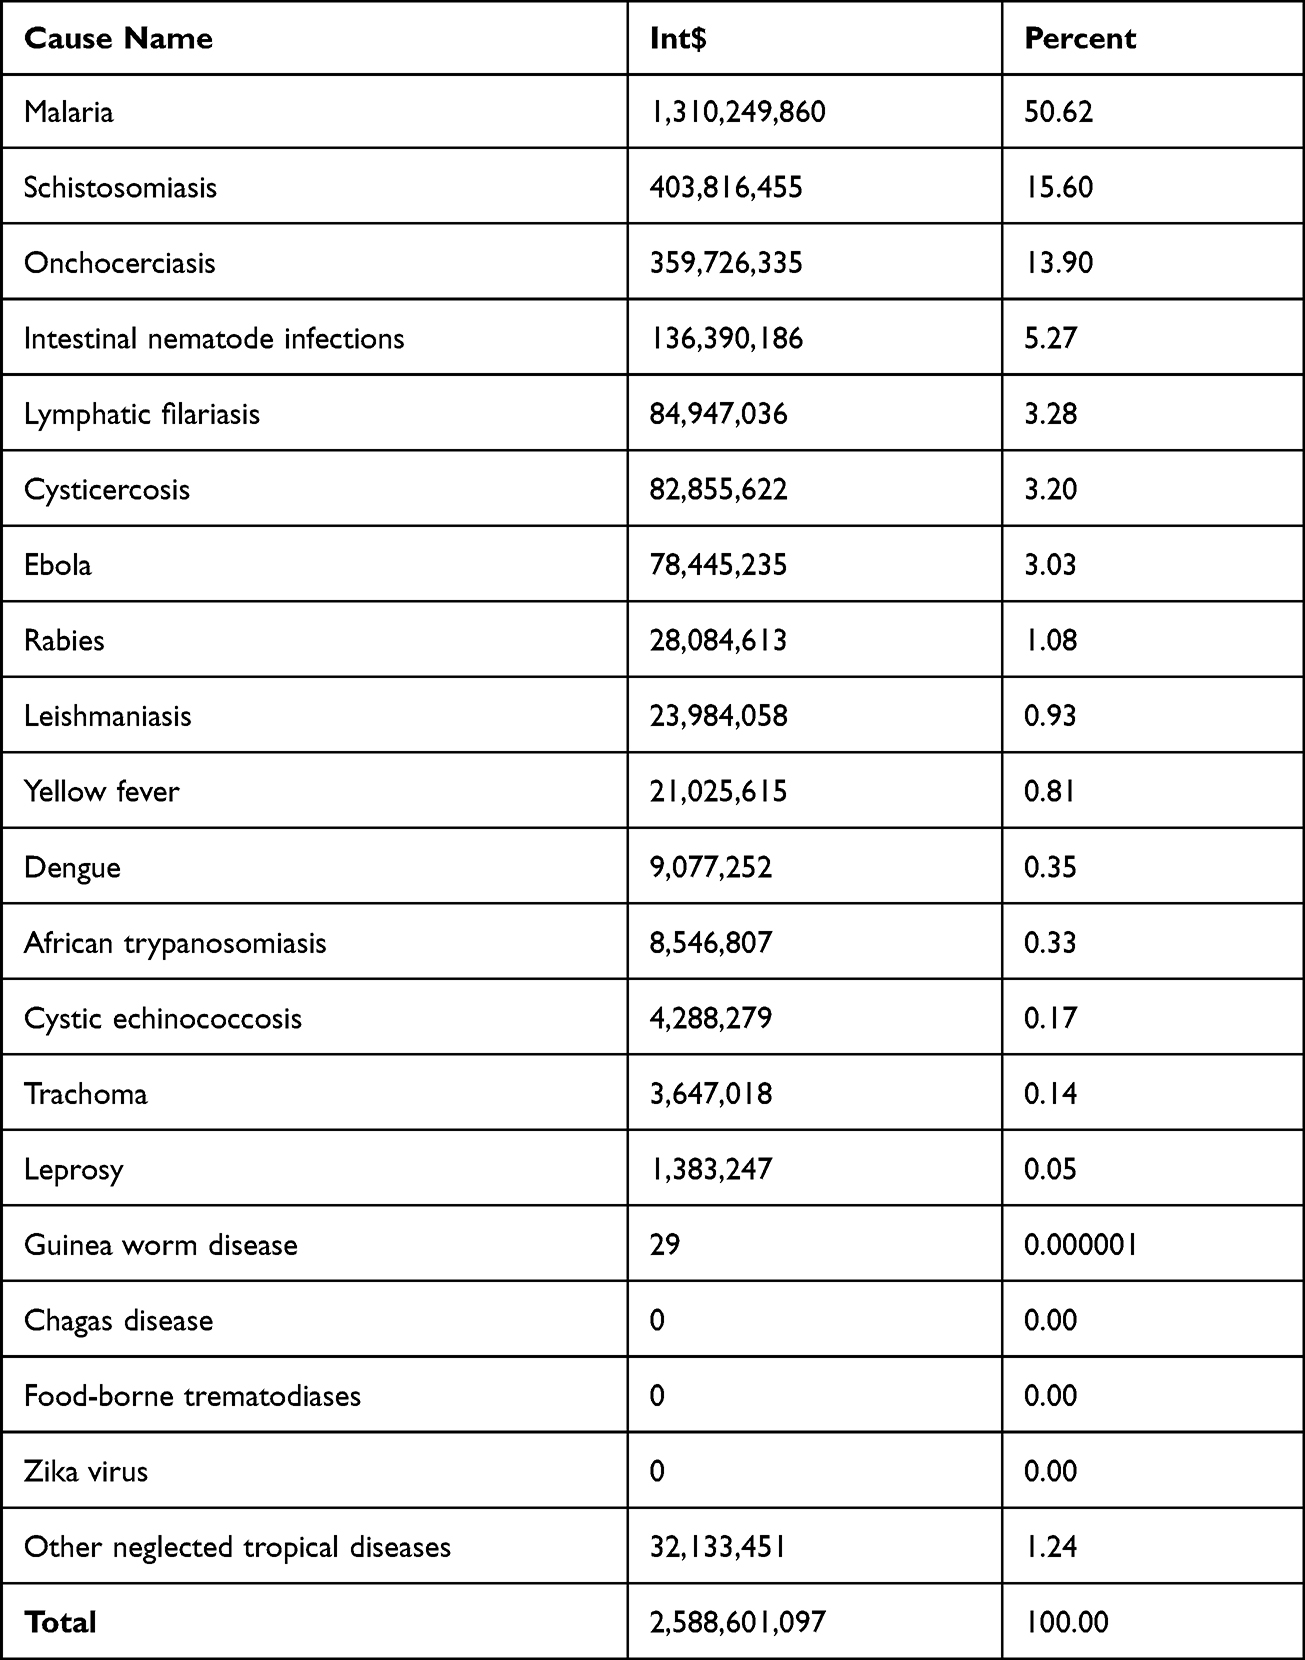 |
Table 5 Potential Economic Productivity Losses per NTD in the EAC (Int$, 2019) |
As depicted in Supplementary Table 5, malaria was the leading cause of productivity losses in Burundi (55.46%), DRC (37.79%), Kenya (53.36%), Rwanda (54.17%), Uganda (69.27%), and Tanzania (53.73%). However, onchocerciasis led in South Sudan (48.79%).
Schistosomiasis was the second leading cause of lost productivity in Burundi (16.77%), Kenya (27.68%), Rwanda (18.35%), Uganda (10.99%), and Tanzania (17.10%). However, in DRC, the second leading cause was onchocerciasis (36.01%); in South Sudan, the second leading cause was malaria (29.27%).
Discussions
Comparison with Other Studies Valuing DALYs from NTDs
No past study has been dedicated to estimating the  and
and  of DALYs from NTDs in Africa. However, Kirigia and Mwabu42 estimated the monetary value of DALYs lost from all causes (communicable, maternal, perinatal, and nutritional conditions; non-communicable diseases (NCDs); and injuries) in the EAC in 2015. The authors estimated that DALYs lost from NTDs (including malaria) in the EAC in 2015 had a monetary value of Int$11,953,760,232. The current study estimated that the DALYs lost from NTDs in the EAC in 2019 had a
  of Int$ 21,824,211,076. However, Kirigia and Mwabu’s42 study did not estimate the TEPL, the average
  , or the average
  .
.
Kirigia and Mburugu43 estimated the monetary value of human lives lost due to NTDs in the African continent in 2015. However, the authors did not estimate the monetary value of the years of life lost due to non-fatal disability, and thus, their findings are not comparable with those of the current study. Furthermore, Kirigia and Mburugu43 did not also estimate the  .
.
Limitations
The current study has some limitations. First, our study uses non-health GDP per capita to value the DALYs lost from NTDs. The GDP metric omits the environmental degradation due to economic production processes; inequalities in income distribution; and non-economic aspects of peoples’ life, eg, quality of life, social connections and relationships, insecurity, political voice, and governance; sustainability of GDP over time.44
Second, the GBD 2016 DALYs and HALE Collaborators explain that even though tremendous effort has gone into revising the methods of calculating the DALY, some limitations remain.45 For example, (a) delayed reporting by national authorities of data on variables used in DALY estimations, which is compounded by conflicts in some EAC partner states such as DRC and South Sudan.45 (b) The assumption of the analyses of independence of the uncertainty calculated for years of life lost and years of life lived with a disability may not hold, for instance, where a correlation might exist between death and the prevalence of NTDs.37,45 (c) Uncertainty in disability weights. Solberg et al46 and Schroeder47 critique the assumptions underlying DALY estimations.
Third, the study reported in this paper suffers criticisms against the human capital approach (HCA) for the monetary valuation of human life and DALYs. For example, the HCA assumes that the only objective of society is the maximization of present and future production.48 However, society may also be concerned with the NTDs disease burden because of the adverse effects on individuals’ health per se and their ability to enjoy leisure activities. The standard HCA estimates incorporate a zero value for persons without labour income, such as children below working age (0–14 years in the current study), retired individuals with only investment or pension income, and persons who cannot work due to severe disability. In the current study, while estimating the  , we valued DALYs lost at all ages in the EAC using the same partner state’s non-health GDP per capita. However, in the estimation of TEPL, we considered only the losses sustained by persons aged 15 years and older who participate in the labour force.
Fourth, Shiell, Gerard and Donaldson have argued that the estimates of economic productivity losses attributable to diseases do not aid healthcare decision-making because they do not simultaneously calculate the costs and consequences of alternative interventions against specific diseases.49 Therefore, the findings reported in this paper are solely for raising public awareness of the economic burden of NTDs in the EAC and advocacy with ministries of finance, the private sector, and external development partners for augmenting and sustaining investments in the control of NTDs.
Fifth, although it would have been informative to apply both the human capital approach (HCA) and friction cost method (FCM) in the estimation of  for comparison purposes, it was not possible to apply the latter due to the paucity of data. As explained by Koopmanschap and Ineveld,50 in the FCM,
… production losses [are] confined to the period needed to replace a sick worker: the so-called friction period (p.100).
Unfortunately, detailed information required in FCM on different working population segments (including the 85% of people who work in the informal sector) of the labour market was not available for the EAC.51 Instead, the current study applied a nuanced form of HCA, which adjusts the partner state’s  for respective labour force participation rates and the combined rates of unemployment and time-related underemployment to generate potential productivity losses attributable to NTDs.
Suggestions for Further Studies
We believe that instead of investing more scarce research resources in studies that estimate the economic burden of NTDs, EAC partner states would reap more value-for-money from the conduct of economic evaluations, whose evidence would potentially serve multiple purposes, eg, priority-setting within individual disease intervention options and across NTDs. Three main forms of economic evaluation studies that assess both costs and consequences include cost-effectiveness analysis,52–55 cost-utility analysis,56,57 and cost-benefit analysis58,59 of diagnostic, drug treatment, and vector control options against individual or cluster of NTD.
Conclusions
The study succeeded in estimating the monetary value of DALYs sustained by all ages from 20 NTDs; and the productivity losses within the working age bracket of 15 years and above in the seven EAC partner states. The DALYs lost from NTDs among 15-year-olds and above caused a 0.392% (Int$2.588 billion) loss in the annual economic productivity of EAC.
The economic evidence presented in this paper is meant to complement human rights arguments for increasing investments in health-related sectors to prevent, diagnose, and manage NTDs. According to the 1948 United Nations (UN) International Bill of Human Rights (IBHR), all persons, including those living in NTD endemic geographical areas have inalienable rights to life (Article 2) and
… to a standard of living adequate for the health and well-being …, including food, clothing, housing and medical care and necessary social services, … (Article 25).60
The 1966 UN International Covenant on Economic, Social and Cultural Rights (ICESCR) Article 12 states that it is the right of everyone to enjoy the highest attainable standard of physical and mental health.61 The Covenant requires the State Parties to
… improve all aspects of environmental and industrial hygiene; the prevention, treatment and control of endemic diseases (such as NTDs); and the creation of conditions which would assure [availability and access] to all medical services in the event of sickness. (Article 12).61
Thus, economic arguments notwithstanding, EAC partner states are obligated by both the IBHR and the ICESR to avail adequate financing for NTD prevention and control.
Although economic evidence reported in the paper is helpful for awareness-raising and advocacy for increased investments in the control of NTDs, there is a greater need for economic evaluation studies, which produce pertinent evidence to guide decision-making.52,56
Disclosure
The authors report no conflicts of interest in this work.
References
1. East African Community [EAC]. EAC partner states. Arusha: EAC; 2022. Available from: https://www.eac.int/.
2. International Monetary Fund (IMF). World economic and financial surveys: world economic outlook database. WEO Data. Washington, D.C: IMF; 2022. Available from: https://www.imf.org/en/Publications/WEO/weo-database/2021/October.
3. World Health Organization [WHO]. Macroeconomics and Health: Investing in Health for Economic Development. Geneva: World Health Organization; 2001.
4. Global Burden of Disease Collaborative Network. Global Burden of Disease Study 2019 (GBD 2019) Results. Seattle, United States: Institute for Health Metrics and Evaluation (IHME); 2020. Available from: https://vizhub.healthdata.org/gbd-results/.
5. World Health Organization. The world health report 2000. Health systems: improving performance. Geneva: World Health Organization; 2000.
6. Commission on Social Determinants of Health (CSDH). Closing the gap in a generation: health equity through action on the social determinants of health. Final Report of the (CSDH) Commission on Social Determinants of Health. Geneva: World Health Organization; 2008.
7. World Health Organization. The world health report 2013 – research for universal health coverage. Geneva: World Health Organization; 2013.
8. World Health Organization, Global Health Observatory. UHC service coverage index (SDG 3.8.1). Geneva: World Health Organization; 2022. Available from: https://www.who.int/data/gho/data/indicators/indicator-details/GHO/uhc-index-of-service-coverage.
9. GBD 2019 Human Resources for Health Collaborators. Measuring the availability of human resources for health and its relationship to universal health coverage for 204 countries and territories from 1990 to 2019: a systematic analysis for the global burden of disease study 2019. Lancet. 2022;399(10341):2129–2154. doi:10.1016/S0140-6736(22)00532-3
10. World Health Organization. Global Health Expenditure Database. Geneva: World Health Organization; 2022. Available from: https://apps.who.int/nha/database/Select/Indicators/en.
11. McIntyre D, Meheus F, Røttingen J-A. What level of domestic government health expenditure should we aspire to for universal health coverage? Health Econ Policy Law. 2017;12:125–137. doi:10.1017/S1744133116000414
12. World Health Organization. World Health Statistics 2022: Monitoring Health for the SDGs. Geneva: World Health Organization; 2022.
13. Kirigia JM, Ota MO, Senkubuge F, Wiysonge CS, Mayosi BM. Developing the African national health research systems barometer. Health Res Policy Sys. 2016;14:53. doi:10.1186/s12961-016-0121-4
14. Kirigia JM, Pannenborg CO, Amore LGC, Ghannem H, IJsselmuiden C, Nabyonga-Orem J. Global Forum 2015 dialogue on “From evidence to policy – thinking outside the box”: perspectives to improve evidence uptake and good practices in the African Region. BMC Health Serv Res. 2016;16(Suppl 4):215. doi:10.1186/s12913-016-1453-z
15. Rusakaniko S, Makanga M, Ota M, et al. Strengthening national health research systems in the WHO African Region – progress towards universal health coverage. Global Health. 2019;15:50. doi:10.1186/s12992-019-0492-8
16. United Nations (UN). Transforming our world: the 2030 agenda for sustainable development. General Assembly Resolution A/RES/70/1. New York: UN; 2015.
17. Card WI, Mooney GH. What is the monetary value of a human life? Br Med J. 1977;2(6103):1627–1629. doi:10.1136/bmj.2.6103.1627
18. Rice DP. Cost of illness studies: what is good about them? Inj Prev. 2000;6(3):177–179. doi:10.1136/ip.6.3.177
19. Andrade MV, Noronha K, Diniz BPC, et al. The economic burden of malaria: a systematic review. Malar J. 2022;21(1):283. doi:10.1186/s12936-022-04303-6
20. Sunyoto T, Boelaert M, Meheus F. Understanding the economic impact of leishmaniasis on households in endemic countries: a systematic review. Expert Rev Anti Infect Ther. 2019;17(1):57–69. doi:10.1080/14787210.2019.1555471
21. Keating J, Yukich JO, Sutherland CS, Woods G, Tediosi F. Human African trypanosomiasis prevention, treatment and control costs: a systematic review. Acta Trop. 2015;150:4–13. doi:10.1016/j.actatropica.2015.06.003
22. Trevisan C, Devleesschauwer B, Schmidt V, Winkler AS, Harrison W, Johansen MV. The societal cost of Taenia solium cysticercosis in Tanzania. Acta Trop. 2017;165:141–154. doi:10.1016/j.actatropica.2015.12.021
23. Widdicombe J, Basáñez MG, Entezami M, Jackson D, Larrieu E, Prada JM. The economic evaluation of Cystic echinococcosis control strategies focused on zoonotic hosts: a scoping review. PLoS Negl Trop Dis. 2022;16(7):e0010568. doi:10.1371/journal.pntd.0010568
24. Keating J, Yukich JO, Mollenkopf S, Tediosi F. Lymphatic filariasis and onchocerciasis prevention, treatment, and control costs across diverse settings: a systematic review. Acta Trop. 2014;135:86–95. doi:10.1016/j.actatropica.2014.03.017
25. Marques AP, Ramke J, Cairns J, et al. The economics of vision impairment and its leading causes: a systematic review. EClinicalMedicine. 2022;46:101354. doi:10.1016/j.eclinm.2022
26. Oliveira LNDS, Itria A, Lima EC. Cost of illness and program of dengue: a systematic review. PLoS One. 2019;14(2):e0211401. doi:10.1371/journal.pone.0211401
27. de Broucker G, Sim SY, Brenzel L, Gross M, Patenaude B, Constenla DO. Cost of nine pediatric infectious illnesses in low- and middle-income countries: a systematic review of cost-of-illness studies. Pharmacoeconomics. 2020;38(10):1071–1094. doi:10.1007/s40273-020-00940-4
28. Murray CJ. Quantifying the burden of disease: the technical basis for disability-adjusted life years. Bull World Health Organ. 1994;72(3):429–445.
29. Lopez AD, Mathers CD, Ezzati M, et al. Global Burden of Disease and Risk Factors. New York: Oxford University Press; 2006.
30. World Health Organization. WHO Methods and Data Sources for the Global Burden of Disease Estimates 2000–2019. Geneva: World Health Organization; 2020.
31. GBD 2019 Diseases and Injuries Collaborators. Global burden of 369 diseases and injuries, 1990–2019: a systematic analysis for the global burden of disease study 2019. Lancet. 2020;396(10258):1204–1222. doi:10.1016/S0140-6736(20)30925-9
32. Chisholm D, Stanciole AE, Edejer TTT, Evans DB. Economic impact of disease and injury: counting what matters. BMJ. 2010;340:c924. doi:10.1136/bmj.c924
33. World Health Organization. WHO Guide to Identifying the Economic Consequences of Disease and Injury. World Health Organization; 2009.
34. International Labour Office (ILO). Resolution concerning statistics of work, employment and labour underutilization, Resolution I,
35. The World Bank. Data. Labour force participation rate - Sub-Saharan Africa. Washington, D.C: The World Bank; 2022. Available from: https://data.worldbank.org/indicator/SL.TLF.ACTI.ZS?locations=ZG.
36. Danish Trade Union Development Agency (DTDA). Burundi Labour Market Profile 2021/2022. Copenhagen: Danish Trade Union Development Agency; 2021.
37. Republic of Kenya. Quarterly Labour Force Report. Quarter 1, 2019. Nairobi: Kenya National Bureau of Statistics; 2019.
38. Republic of Rwanda. Labour Force Survey Annual Report, December 2018. Kigali: National Institute of Statistics of Rwanda (NISR); 2018.
39. Republic of Uganda. Annual labour force survey 2018/19 report. Kampala: Uganda Bureau of Statistics; 2019.
40. The United Republic of Tanzania. Integrated labour force survey 2020/21. National Bureau of Statistics (NBS) and Office of the Government Statistician Zanzibar, Dar es Salaam; 2021.
41. Meru University of Science & Technology (MUST). Standard operating procedures of the Must Institutional Research Ethics Review Committee (MIRERC). Document WI‐1‐39‐4. Meru: MIRERC; 2017.
42. Kirigia JM, Mwabu GM. The monetary value of disability-adjusted-life-years lost in the East African Community in 2015. Mod Econ. 2018;9:1360–1377. doi:10.4236/me.2018.97087
43. Kirigia JM, Mburugu GN. The monetary value of human lives lost due to neglected tropical diseases in Africa. Infect Dis Poverty. 2017;6:165. doi:10.1186/s40249-017-0379-y
44. Stiglitz JE, Amartya S, Jean-Paul F. Mismeasuring our lives: why GDP doesn’t add up: the report. New York: The New Press; 2010.
45. GBD 2016 DALYs and HALE Collaborators. Global, regional, and national disability-adjusted life years (DALYs) for 333 diseases and injuries and healthy life expectancy (HALE) for 195 countries and territories, 1990–2016: a systematic analysis for the global burden of disease study 2016. Lancet. 2017;390(10100):1260–1344. doi:10.1016/S0140-6736(17)32130-X
46. Solberg CT, Sorheim P, Muller KE, Gamlund E, Norheim OF, Barra M. The devils in the DALY: prevailing evaluative assumptions. Public Health Ethics. 2020;13(3):259–274. doi:10.1093/phe/phaa030
47. Schroeder SA. Which values should be built into economic measures? Econ Philos. 2019;35(3):521–536. doi:10.1017/S0266267118000317
48. Landefeld JS, Seskin EP. The economic value of life: linking theory to practice. Am J Public Health. 1982;72:555–566. doi:10.2105/AJPH.72.6.555
49. Shiell A, Gerard K, Donaldson C. Cost of illness studies: an aid to decision-making? Health Policy. 1987;8(3):317–323. doi:10.1016/0168-8510(87)90007-8
50. Koopmanschap MA, van Ineveld BM. Towards a new approach for estimating indirect costs of disease. Soc Sci Med. 1992;34(9):100–1010. doi:10.1016/0277-9536(92)90131-9
51. International Labour Organization (ILO). Concept Note: informal economy in Africa: which way forward? In: Making Policy Responsive, Inclusive, and Sustainable. Geneva: ILO; 2022.
52. Drummond ME, Sculpher MJ, Torrance GW, O’Brien BJ, Stoddart GL. Methods for the Economic Evaluation of Health Care Programmes.
53. Sutherland CS, Yukich J, Goeree R, Tediosi F. A literature review of economic evaluations for a neglected tropical disease: human African trypanosomiasis (“sleeping sickness”). PLos Negl Trop Dis. 2015;9(2):e0003397. doi:10.1371/journal.pntd.0003397
54. Turner HC, Walker M, Pion SDC, McFarland DA, Bundy DAP, Basanez M-G. Economic evaluations of onchocerciasis interventions: a systematic review and research needs. Trop Med Int Health. 2019;24(7):788–816. doi:10.1111/tmi.13241
55. Uzoegbo SC, Jackson LJ, Bloch SCM. A systematic review and quality appraisal of the economic evaluations of schistosomiasis interventions. PLoS Negl Trop Dis. 2022;16(10):e0010822. doi:10.1371/journal.pntd.0010822
56. Kirigia JM. Economic Evaluation of Public Health Problems in Sub-Saharan Africa. Nairobi: University of Nairobi Press; 2009.
57. Kirigia JM. Cost-utility analysis of schistosomiasis intervention strategies in Kenya. Environ Dev Econ. 1998;3(3):319–346. doi:10.1017/S1355770X98000187
58. Aehyung K, Benton B. Cost-Benefit Analysis of the Onchocerciasis Control Program (OCP). Washington, D.C: The World Bank; 1995.
59. Kirigia JM, Sambo LG, Kainyu LH. A cost-benefit analysis of preventive schistosomiasis interventions in Kenya. Afr J Health Sci. 2000;7(3–4):5–11.
60. United Nations (UN), The International Bill of Human Rights, Universal Declaration of Human Rights. Adopted and proclaimed by General Assembly resolution 217 A (III) of 10 December 1948. New York: UN; 1948.
61. United Nations (UN), International Covenant on Economic, Social and Cultural Rights. Adopted and opened for signature, ratification and accession by general assembly resolution 2200 A (XXI) of 16 December 1966. New York: UN; 1966.
 © 2023 The Author(s). This work is published and licensed by Dove Medical Press Limited. The
full terms of this license are available at https://www.dovepress.com/terms
and incorporate the Creative Commons Attribution
- Non Commercial (unported, 3.0) License.
By accessing the work you hereby accept the Terms. Non-commercial uses of the work are permitted
without any further permission from Dove Medical Press Limited, provided the work is properly
attributed. For permission for commercial use of this work, please see paragraphs 4.2 and 5 of our Terms.
© 2023 The Author(s). This work is published and licensed by Dove Medical Press Limited. The
full terms of this license are available at https://www.dovepress.com/terms
and incorporate the Creative Commons Attribution
- Non Commercial (unported, 3.0) License.
By accessing the work you hereby accept the Terms. Non-commercial uses of the work are permitted
without any further permission from Dove Medical Press Limited, provided the work is properly
attributed. For permission for commercial use of this work, please see paragraphs 4.2 and 5 of our Terms.