Back to Journals » International Journal of Nanomedicine » Volume 11
Molecular magnetic resonance imaging of activated hepatic stellate cells with ultrasmall superparamagnetic iron oxide targeting integrin αvβ3 for staging liver fibrosis in rat model
Authors Zhang C, Liu H, Cui Y, Li X, Zhang Z, Zhang Y, Wang D
Received 26 November 2015
Accepted for publication 6 February 2016
Published 18 March 2016 Volume 2016:11 Pages 1097—1108
DOI https://doi.org/10.2147/IJN.S101366
Checked for plagiarism Yes
Review by Single anonymous peer review
Peer reviewer comments 6
Editor who approved publication: Professor Lei Yang
Caiyuan Zhang,1,* Huanhuan Liu,1,* Yanfen Cui,1,* Xiaoming Li,1 Zhongyang Zhang,1 Yong Zhang,2 Dengbin Wang1
1Department of Radiology, Xinhua Hospital, Shanghai Jiao Tong University School of Medicine, 2MR Advanced Application and Research Center, GE Healthcare China, Shanghai, People’s Republic of China
*These authors contributed equally to this work
Purpose: To evaluate the expression level of integrin αvβ3 on activated hepatic stellate cells (HSCs) at different stages of liver fibrosis induced by carbon tetrachloride (CCl4) in rat model and the feasibility to stage liver fibrosis by using molecular magnetic resonance imaging (MRI) with arginine-glycine-aspartic acid (RGD) peptide modified ultrasmall superparamagnetic iron oxide nanoparticle (USPIO) specifically targeting integrin αvβ3.
Materials and methods: All experiments received approval from our Institutional Animal Care and Use Committee. Thirty-six rats were randomly divided into three groups of 12 subjects each, and intraperitoneally injected with CCl4 for either 3, 6, or 9 weeks. Controls (n=10) received pure olive oil. The change in T2* relaxation rate (ΔR2*) pre- and postintravenous administration of RGD-USPIO or naked USPIO was measured by 3.0T clinical MRI and compared by one-way analysis of variance or the Student’s t-test. The relationship between expression level of integrin αvβ3 and liver fibrotic degree was evaluated by Spearman’s ranked correlation.
Results: Activated HSCs were confirmed to be the main cell types expressing integrin αvβ3 during liver fibrogenesis. The protein level of integrin αv and β3 subunit expressed on activated HSCs was upregulated and correlated well with the progression of liver fibrosis (r=0.954, P<0.001; r=0.931, P<0.001, respectively). After injection of RGD-USPIO, there is significant difference in ΔR2* among rats treated with 0, 3, 6, and 9 weeks of CCl4 (P<0.001). The accumulation of iron particles in fibrotic liver specimen is significantly greater for RGD-USPIO than naked USPIO after being injected with equal dose of iron.
Conclusion: Molecular MRI of integrin αvβ3 expressed on activated HSCs by using RGD-USPIO may distinguish different liver fibrotic stages in CCl4 rat model and shows promising to noninvasively monitor the progression of the liver fibrosis and therapeutic response to antifibrotic treatment.
Keywords: magnetic resonance imaging, ultrasmall superparamagnetic iron oxide, liver fibrosis, hepatic stellate cell, integrin
Introduction
Liver fibrosis is the excessive healing response to chronic liver injury, including viral hepatitis, alcoholic hepatitis, nonalcoholic steatohepatitis, autoimmune hepatitis, and metabolic disease.1 It may subsequently progress to cirrhosis with consequence of portal hypertension, hepatocellular carcinoma, and liver failure and was estimated to affect 1%–2% of the world’s population.2–4 Recent research reported that liver fibrosis is reversible and treatable at early stage.5,6 Meanwhile, bridging or higher fibrosis is an indication for treatment in patients with hepatitis C.7 Thus, early diagnosis and precise staging of liver fibrosis can help predict the prognosis and select the patients for treatment.
Liver biopsy is regarded as gold standard for staging liver fibrosis, whereas it was reported that sampling error and interobserver bias might limit it in clinical use.8 Moreover, as an invasive procedure with significant complications, it may result in poor patient compliance.9 For all of these reasons, the application of noninvasive strategies to repeatedly assess liver fibrosis is clinically important. Liver stiffness measurement based on ultrasonography (US) and magnetic resonance imaging (MRI) has potential to assess the progression of liver fibrosis for both patient and animal model. Several previous studies have shown that US elastography and magnetic resonance elastography discriminated moderate and advanced liver fibrosis from early-stage liver injury or normal patient population.10,11 However, factors such as parenchymal inflammation, steatosis, hepatic vascular congestion, cholestasis, and portal hypertension may affect the accurate measurement of stiffness.12–14 Another advanced MRI technique, diffusion-weighted imaging, allows monitoring the motion of extracellular pure water molecules by measuring apparent diffusion coefficient that may reflect microstructural changes in region of interest (ROI) and has been shown to be decreased in moderated or advanced fibrosis.15 The potential limitation is that these MRI-based techniques indirectly reflect relationship between their measurements and liver fibrosis, and can be confounded by a variety of factors.16 Therefore, direct monitoring of key cells closely related to fibrogenesis may be more accurate to evaluate liver fibrosis than these approaches.
Recently, molecular imaging has emerged to visualize, characterize, and measure the biological progress at the molecular and cellular level in humans and other living systems using different imaging modalities that include MRI, positron emission tomography, single photon emission computed tomography, US, and optical imaging.17 Owning to its high spatial resolution, simultaneous anatomic, physiologic, and functional information, and nonionizing radiation, MRI is more highly desirable for molecular imaging.18
Following liver injury, the hepatic stellate cells (HSCs) undergo a complex transformation process where the cells are activated from quiescent type, become myofibroblast-like cells, and contribute to the major source of extracellular matrix.1,19 With the activation of HSCs, the integrin αvβ3 is expressed on HSCs, promotes HSCs adhesion and migration, and binds to extracellular matrix by means of three amino acid sequence of arginine-glycine-aspartic acid (RGD).20–22 It has been reported that the expression of integrin αvβ3 is upregulated and markedly increased at the advanced stage of liver fibrosis.20,23,24 Additionally, integrin αvβ3 without expression on hepatocyte has potential to be an ideal molecular target to monitor the activated HSCs during liver fibrogenesis.25,26 Previously, we developed ultrasmall superparamagnetic iron oxide nanoparticle (USPIO) modified by RGD peptide (RGD-USPIO) as MR T2 contrast agent to specifically target integrin αvβ3 expressed on activated HSCs and demonstrated that this approach can identify the presence of early liver fibrosis in rat model induced by carbon tetrachloride (CCl4).27 In the present study, we further evaluate the expression of integrin αvβ3 on activated HSCs at different stages of liver fibrosis and the feasibility to stage liver fibrosis in CCl4 rat model by using molecular MRI with RGD-USPIO specifically targeting integrin αvβ3.
Materials and methods
General materials
Iron (III) acetylacetonate (Fe(acac)3 ≥97%) was purchased from Sigma-Aldrich Chemical Co. (St Louis, MO, USA). Cyclo (Arg-Gly-Asp-Tyr-Lys) (c (RGDyK)) was obtained from Chinapeptides Co., Ltd. (Shanghai, People’s Republic of China). The male Sprague Dawley rats (6–8 weeks old, 230–250 g body weight) were purchased from Shanghai Experimental Animal Center (Shanghai, People’s Republic of China). Unless otherwise specified, all chemical reagents were obtained from Sinopharm Chemical Reagent Co. (Shanghai, People’s Republic of China).
Synthesis of polyacrylic acid coated USPIO
USPIO was coated by polyacrylic acid (PAA) using Polyol method.28 A mixture of iron (III) acetylacetonate (353 mg) and PAA (72 mg) was added to a mechanically stirred solution of triethylene glycol (30 mL). Under an inert nitrogen atmosphere, the mixture was heated to 185°C for 30 minutes, and further heated to 287°C with the heating rate of 10°C/3 min, and maintained at this temperature for 30 minutes. The black colloidal suspension was subsequently cooled down to room temperature. Ethyl acetate (50 mL) was added to the solution. The sediment was separated by an external magnetic field and washed thrice with ethanol to remove the residuals thoroughly. Finally, the PAA coated USPIO particles were dispersed in deionized water.
Coupling of RGD peptide to PAA-USPIO
1-Ethyl-3-(dimethylaminopropyl) carbodiimide hydrochloride (5.6 mg) was added to deionized water (100 μL). Fifty micrograms of the c (RGDyK) peptide and 500 μg PAA-USPIO (2 mg/mL) were mixed and placed into vertical rotating apparatus for 2 hours at room temperature. The deionized water was added to the mixture and centrifuged twice, each for 10 minutes at 4,000 rpm. Subsequently, RGD-USPIO particles were dispersed in deionized water.
Characterization of nanoparticles
The iron concentration of nanoparticles was adjusted to 20 μg/mL. The distribution and core diameter of nanoparticles was measured by transmission electron microscopy (TEM; JEM-2100F; JEOL, Akishima, Tokyo, Japan). The hydrodynamic diameters of USPIO and RGD-USPIO were determined by dynamic light scattering ([DLS]; Zetasizer Nano-z; Malvern Instruments, Malvern, UK). The measurement of hydrated diameters was repeated thrice. Results are expressed as means ± standard deviation (SD).
To determine the relaxivity of nanoparticles, five samples of RGD-USPIO were diluted to the concentration of 0.2, 0.4, 0.6, 0.8, and 1.0 mM, respectively. The 1.41T MRI contrast agent analyzer (mq60; Bruker, Karlsruhe, Germany) was used to measure the T1 and T2 relaxation times of nanoparticles with different concentration. T1 and T2 relaxivity (r1 and r2) were plotted against the iron concentration in the nanoparticles dilutions. T1 and T2 relaxation rate (R1 and R2) were determined by a linear fit.
In vitro evaluation of binding characterization of RGD-USPIO
Rat hepatic stellate cell line (HSC-T6) was purchased from Cell Bank, Chinese Academy of Science (Shanghai, People’s Republic of China). HSC-T6 cell lines were maintained in Dulbecco’s Modified Eagle’s Medium (DMEM) (Gibco, Paisley, UK) supplemented with 10% fetal bovine calf serum (FBS) (Gibco) and penicillin–streptomycin (100 IU/mL and 100 mg/mL media, respectively) under 5% CO2 atmosphere at 37°C.
HSC-T6 cells were diluted to 106 cells/mL in DMEM plus 10% fetal bovine calf serum and 2 mL were seeded on glass coverslips in 6-well culture plates. When HSC-T6 cells reached log phase of growth at 50%–60% confluence they were then incubated with 0.03 μmol/mL RGD-USPIO for 20 minutes, 1, 2, and 3 hours, respectively. Cells incubated with USPIO were used as controls. After incubation, the culture medium was removed. The cells were washed thrice with phosphate buffered saline (pH=7.4).
Prussian blue staining was performed to determine the uptake of RGD-USPIO by HSC-T6. The cells treated with RGD-USPIO or USPIO were fixed by 4% paraformaldehyde for 30 minutes. The fixed cells were incubated with a solution of 2% potassium ferrocyanide and 2% hydrochloric acid (V:V=1:1) for 10 minutes. After washing with distilled water for 5 minutes, the fixed cells were counterstained by 0.1% nuclear fast red for 5 minutes.
For quantitative assessment of iron uptake in cells, the cells treated with RGD-USPIO or USPIO were digested with 0.25% trypsogen (Gibco). A total of 7×10⁵ cells were incubated with 37% hydrochloric acid and heated to 75°C for 30 minutes. Inductively coupled plasma optical emission spectrometer (ICP-OES; ICAP-6300; Thermo Fisher Scientific, Waltham, MA, USA) was used to measure the amount of intracellular iron contents. Iron content was expressed in picogram of iron per cell.
Animal models
All experimental procedures were carried out in strict accordance with the recommendations in the Guide for the Care and Use of Laboratory Animals of the National Institutes of Health. The protocol was approved by Ethics Committee of Xinhua Hospital Affiliated to Shanghai Jiao Tong University School of Medicine. All the surgeries were performed under anesthesia, and animal suffering was minimized. All of the rats were fed with standard diet. Thirty-six rats were randomly divided into three groups, and intraperitoneally injected with a 40% mixture of CCl4 and olive oil at a dose of 0.15 mL/100 g body weight, twice a week for either 3, 6, or 9 weeks, to induce fibrosis at different stages. Controls (n=10) received only pure olive oil.
In vivo MRI and image analysis
Pre- and postcontrast MRI were performed for each animal 1 week after the last injection to avoid acute effects of CCl4.29 Animals treated with or without CCl4 were randomly divided into two groups. Animals in one group were injected with RGD-USPIO while another group received naked USPIO as controls.
The rats were anesthetized with an intraperitoneal injection of pentobarbital sodium (30 mg/kg body weight) and transferred to a 3.0-T clinical MR unit (Signa HDxt; GE Medical System, Milwaukee, WI, USA). A dedicated rat 8-channel receiver coil with 5 cm inner diameter (Chenguang Medical Technologies, Shanghai, People’s Republic of China) was used for the abdominal imaging in this study. T2* mapping images were acquired transversely prior to contrast agent administration by using the multi-echo gradient recall echo sequence with free-breath. Detailed image parameters were as follows: repetition time (TR) =1,000 ms, echo time (TE) range =9.2–73.4 ms, flip angle =90°, echoes =8, matrix =288×128, field of view (FOV) =180×180 mm2, slice thickness =2 mm, number of excitations (NEX) =2. After administration of RGD-USPIO or USPIO via tail vein at a dose of 100 μmol Fe/kg, T2* mapping images were repeated 6 hours later.
T2* mapping images were transferred to the dedicated postprocessing workstation (V4.3; GE Healthcare, Milwaukee, WI, USA) for quantitative analysis. Three ROI with an area of 30–50 mm2 were placed on the left lateral, left medium, and right lobe of liver at the level of porta hepatis avoiding large hepatic vessels, respectively, by a radiologist (YC) with 5-year experience of abdominal MRI interpretation. R2* (=1/T2* relaxation time) is generated by fitting the gradient echo signal intensity as a function of TE to a monoexponential decay for each ROI. ΔR2* is calculated by subtracting the precontrast value of R2* from its postcontrast value. Results are expressed as means ± SD. After MRI, all experimental rats were sacrificed at each time point with deep anesthesia by overdose of intraperitoneal injection of pentobarbital sodium. The liver tissue was harvested and divided into several lumps for histological, immunofluorescent, TEM, Western blot, and real-time polymerase chain reaction (RT-PCR) analysis.
Liver fibrosis stage analysis
The specimens were fixed with 10% formalin for 24 hours and then embedded in paraffin. The formalin-fixed and paraffin-embedded sections were stained with hematoxylin and eosin and sirius red. The Ishak scoring system was used to stage liver fibrosis by pathologists (nonauthors, 10 and 12 years of experience) in consensus. Collagen proportionate area, a parameter to assess liver fibrosis quantitatively, was measured by the method described previously.30
Immunofluorescence of integrin αvβ3 in fibrotic liver
Currently, owing to invalidation of the antirat integrin αvβ3 antibody, integrin β3 subunit was used to localize the expression of integrin αvβ3. It has been confirmed that integrin β3 only binds to αv and αII subunit, and the latter was expressed in megakaryocytic series and some tumor cells.31 Furthermore, alpha-smooth muscle actin (α-SMA) is a well-characterized marker of activated HSCs.32 We performed immunofluorescent colocalization of integrin β3 and α-SMA to determine the expression of integrin αvβ3 on the activated HSCs.
Frozen tissue sections (5 μm) were fixed with acetone for 20 minutes and dried in the air for 30 minutes at room temperature. After blocking with 2% BSA for 30 minutes, slices were incubated with rabbit antirat integrin β3 antibody (1:200; ab75872; Abcam, Cambridge, MA, USA) and mouse antirat α-SMA antibody (1:200; ab7817; Abcam) and then visualized with FITC-conjugated goat antirabbit and Cy3-conjugated donkey antimouse secondary antibody (1:200; Santa Cruz Biotechnology, CA, USA). After washing three times with phosphate buffered saline, the whole slides were mounted with mounting medium containing 4′-6-diamidino-2-phenylindole. Fluorescence images were acquired with an epifluorescence microscope (IX81; Olympus, Shinjuku-ku, Tokyo, Japan).
Quantitative analysis of integrin β3 and α-SMA fluorescence intensity was assessed by Image-Pro Plus (v. 6.0) software (Media Cybernetics, Warrendale, PA, USA). The integrin β3 and α-SMA fluorescence intensity was calculated by measuring the optical density in equivalent area (mm2). Ten random images (×20 magnification) were analyzed for each liver section.
Prussian blue staining and TEM in determination of iron content in liver
The formalin-fixed and paraffin-embedded sections were stained with Prussian blue in routine protocol. The liver specimen was fixed with 2.5% glutaraldehyde at 4°C for 2–4 hours, dehydrated with 50%–100% ethyl alcohol, and then embedded with a mixture of acetone and 812 embedding medium (V:V=1:1). The ultra-slice of specimen was stained with 2% uranyl acetate and lead citrate, and observed under TEM at 100 kV.
Western blotting
The frozen tissue specimen was lysed in radio-immunoprecipitation assay lysis buffer. Lysates were centrifuged at 12,000 rpm for 10 minutes and protein concentration was determined using an enhanced bicinchoninic acid protein assay kit (Pierce Biotechnology, Inc., Rockford, IL, USA). Fifty microgram of proteins were separated using 8% SDS-PAGE and transferred to the polyvinylidene fluoride membrane. After that, the polyvinylidene fluoride membrane was blocked with 5% nonfat milk blocking buffer, and then incubated overnight at 4°C with rabbit antirat integrin β3 (1:1,000; ab75872; Abcam), rabbit antirat integrin αv (1:1,000; ab124968; Abcam), and mouse antirat α-SMA antibody (1:100; ab7817; Abcam). After washing, the membrane was incubated with horseradish peroxidase-conjugated secondary antibodies and detected by enhanced chemiluminescence assay. β-Actin was used as the loading control, and the bands were detected using enhanced chemiluminescence (EMD Millipore, Billerica, MA, USA).
Quantitative RT-PCR analysis
The messenger RNA (mRNA) of integrin αv and β3 subunit and α-SMA was analyzed by RT-PCR as described previously. According to published rat gene sequence in National Center for Biotechnology Information database, the primers were designed by Primer Premier 5.0. The 2−ΔΔCT method was used to calculate the relative mRNA expression normalized to GAPDH in parallel analysis.33
Statistics
Quantitative data were expressed as mean ± SD. Means were compared using one-way analysis of variance or the Student’s t-test with GraphPad Prism 5 (GraphPad Software Inc., La Jolla, CA, USA). Spearman’s ranked correlation test was performed for evaluating correlation between protein expression of integrin αvβ3 and liver fibrosis stage. P-values of <0.05 were considered statistically significant.
Results
Characterization of RGD-USPIO nanoprobe
The mean core size of particles determined by TEM was 14.5±1.9 nm (Figure 1). DSL measurements indicated that the mean hydrated size of RGD-USPIO and USPIO was 37.5±3.1 and 32.1±2.8 nm, respectively. R1 and R2 value of RGD-PAA-USPIO was 8.7 and 137.85 mM−1S−1, respectively.
 | Figure 1 TEM images of iron core. |
Binding characterization of RGD-USPIO in vitro
To assess the binding characterization of RGD-USPIO to integrin αvβ3 expressed on HSC-T6, we performed Prussian blue staining for cells incubation with RGD-USPIO or naked USPIO during different incubation periods (20 minutes, 1, 2, and 3 hours). Prussian blue staining showed that a large amount of iron particles was internalized in the cytoplasm of HSC-T6 after incubation with RGD-USPIO, whereas there was low accumulation of iron particles after incubation with naked USPIO (Figure 2A–D). In addition, ICP spectrometry for quantitatively assessing intracellular iron content further confirmed higher uptake of RGD-USPIO in comparison with naked USPIO. After initial incubation with RGD-USPIO for 20 minutes, the uptake of iron in HSC-T6 is 0.26±0.03 pg/cell. Increasing incubation period, intracellular iron content steadily rose and reached 0.68±0.07 pg/cell (1 hour), 0.86±0.08 pg/cell (2 hours), 1.20±0.13 pg/cell (3 hours). In contrast, incubating with naked USPIO, a weak uptake of iron was observed and remained at the low level even after 3 hours incubation (Figure 2E). These results indicate that specific binding of RGD-USPIO to integrin αvβ3 mediated the initialization of iron particles.
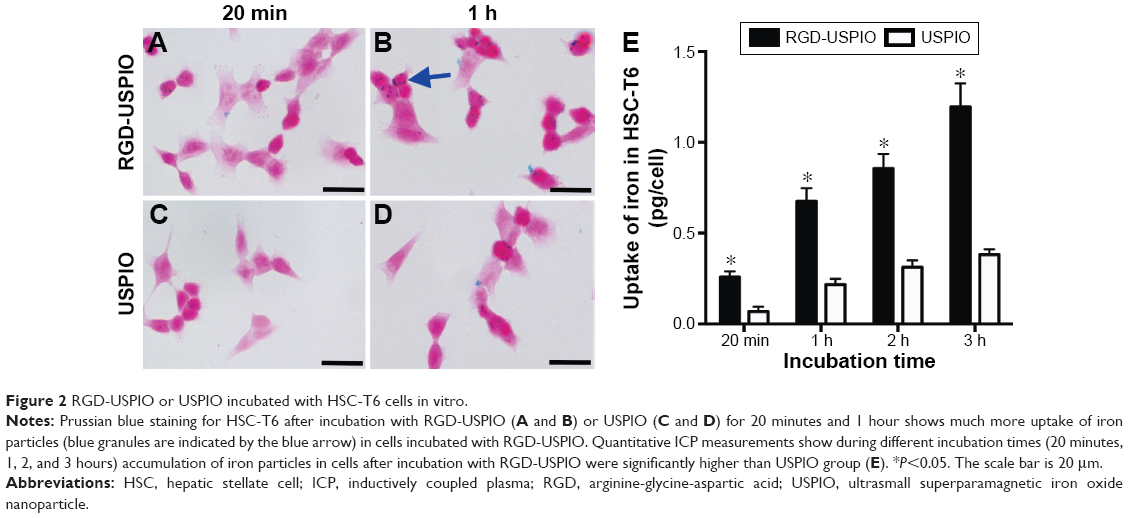 | Figure 2 RGD-USPIO or USPIO incubated with HSC-T6 cells in vitro. |
The expression of integrin αvβ3 in fibrotic liver
After 3 weeks of CCl4 administration, most of the rats presented with portal fibrosis (Ishak score 1.17±0.39, representing mild fibrosis), and the disease progressed to extensive portal fibrosis with occasional bridging fibrosis (Ishak score 3.0±0.89, representing moderate fibrosis) by 6 weeks and eventually developed to marked bridging fibrosis with some regenerative nodules (Ishak score 4.8±0.42, representing advanced fibrosis) by 9 weeks. During administration of CCl4, there was one rat death by 6 weeks, and two rats died by 9 weeks. Collagen deposition was increased with the progression of liver fibrosis (Figure 3).
 | Figure 3 Liver specimen (×200) were stained by Sirius red after 0, 3, 6, and 9 weeks of CCl4 induction representing Ishak 0 (A), Ishak 1 (B), Ishak 3 (C), and Ishak 5 (D), respectively. (E) Sirius red area was compared among liver fibrosis groups and control group. The scale bar is 50 μm. |
During increased weeks of CCl4 administration, the mRNA level and protein expression level of α-SMA and integrin αv and β3 subunit were significantly upregulated (Figure 4). Particularly, the protein expression level of α-SMA and integrin αv and β3 subunit correlated well with Ishak fibrosis score (r=0.9, P<0.001; r=0.954, P<0.001; r=0.931, P<0.001, respectively). To further confirm origination of the upregulated expression of integrin αvβ3, we performed immunofluorescent colocalization between integrin αvβ3 and α-SMA. Figure 5A shows that the majority of positive-staining area of integrin β3 overlapped with that of α-SMA. With the progression of liver fibrosis, the intensity of integrin αvβ3 and α-SMA staining was significantly increased and reached the highest in the advanced liver fibrosis (P<0.001, Figure 5B). Taken together, these findings demonstrate that the expression of integrin αvβ3 was upregulated during progression of liver fibrosis and mainly localized in the activated HSCs.
 | Figure 4 The protein level of integrin αv and β3 subunit and α-SMA in rat liver induced by CCl4 for 0, 3, 6, and 9 weeks (A–D). The mRNA of integrin αv and β3 subunit and α-SMA in rat liver induced by CCl4 for 0, 3, 6, and 9 weeks (E–G). Data are expressed as mean ± SD (n=5 per group). |
 | Figure 5 Photomicrographs of immunofluorescence staining of liver sections. |
MRI
MRI with T2* mapping sequence was successfully performed in all experimental rats. At the 6 hours time point postinjection of RGD-USPIO, the ΔR2* value for rats treated with CCl4 was significantly increased in comparison with untreated rats. Taking all groups of fibrosis, there is significant difference in ΔR2* among rats treated with 3, 6, and 9 weeks of CCl4 (P<0.001, Figure 6). However, after intravenous administration of naked USPIO, no significant difference in ΔR2* was found for rats treated with 3, 6, and 9 weeks of CCl4, and the value of ΔR2* only shows significant difference between advanced liver fibrosis and normal liver (P<0.001). In addition, rats in fibrosis group injected with RGD-USPIO have significantly higher ΔR2* value than those injected with naked USPIO (P<0.001).
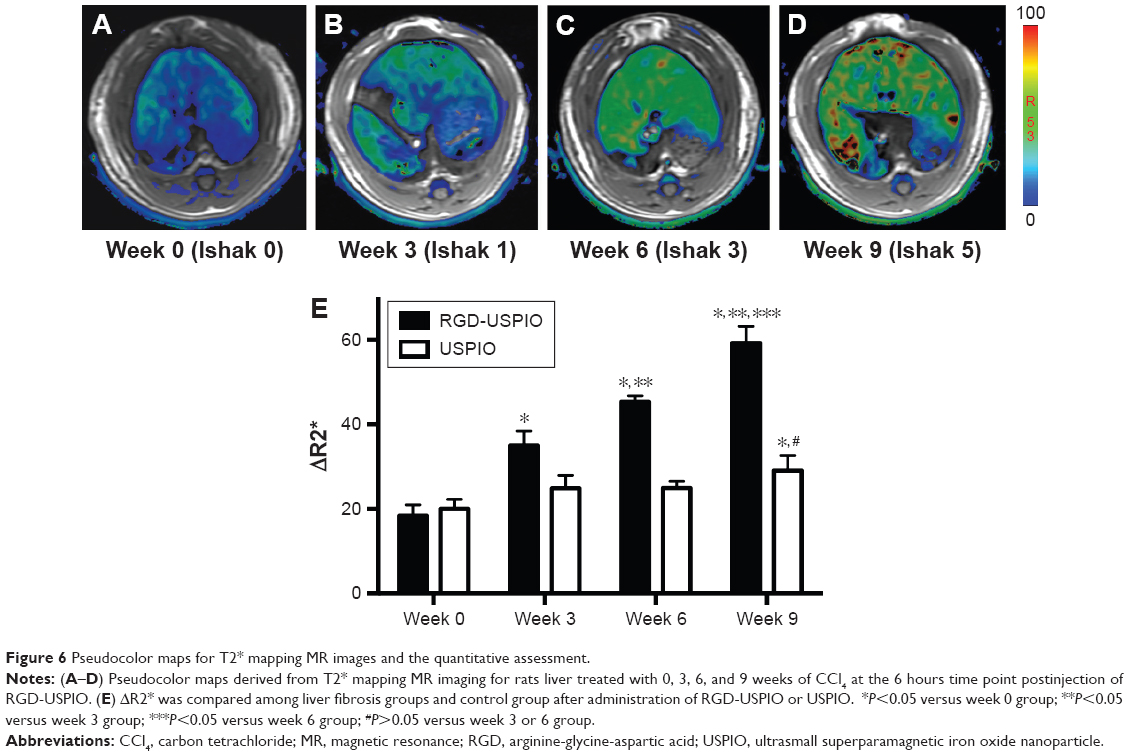 | Figure 6 Pseudocolor maps for T2* mapping MR images and the quantitative assessment. |
Distribution of iron particles in liver
At the 6 hour time point after injected RGD-USPIO, Prussian blue staining of the fibrotic liver or normal liver specimen demonstrated that the deposition of iron particles in the fibrotic liver parenchyma mainly distributed along the fibrotic septa, where it has been reported to be the area inhabited by activated HSCs (Figure 7A). However, after administration of naked USPIO, iron particles deposited in the region of portal track and its adjacent hepatic sinus (Figure 7B). Interestingly, this finding suggested that it was an effective way to specifically target the activated HSCs by using RGD-USPIO. TEM shows activated HSCs in the specimen of fibrotic liver contained a large amount of iron particles, indicating specific uptake of RGD-USPIO in activated HSCs (Figure 7C and D).
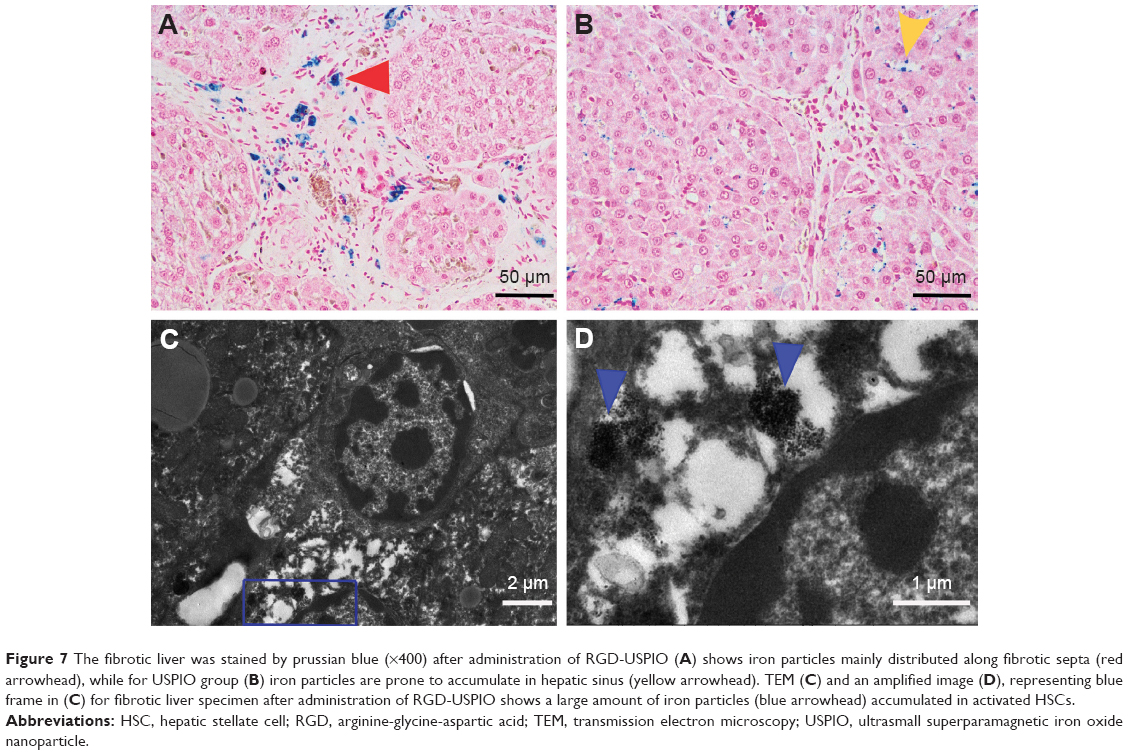 | Figure 7 The fibrotic liver was stained by prussian blue (×400) after administration of RGD-USPIO (A) shows iron particles mainly distributed along fibrotic septa (red arrowhead), while for USPIO group (B) iron particles are prone to accumulate in hepatic sinus (yellow arrowhead). TEM (C) and an amplified image (D), representing blue frame in (C) for fibrotic liver specimen after administration of RGD-USPIO shows a large amount of iron particles (blue arrowhead) accumulated in activated HSCs. |
Discussion
In this study, we have found that the expression of integrin αvβ3 on activated HSCs was increased and correlated well with the progression of liver fibrosis in CCl4 rat model. Its presence has been demonstrated in two ways. First, the finding that the protein and mRNA of integrin αvβ3 were upregulated along with the severity of liver fibrosis and reached the highest level after 9 weeks of CCl4 induction is consistent with previous study using different animal models of secondary biliary fibrosis or lobular fibrosis induced by thioacetamide and CCl4 or bile duct ligation.20,23,24 Second, we found that the majority of positive staining areas of integrin αvβ3 in fibrotic liver overlapped with those of α-SMA, which is a well-known biomarker of activated HSCs, indicating that the increased expression of integrin αvβ3 arose from activated HSCs. In this context, monitoring integrin αvβ3 as molecular target could potentially detect the amount of activated HSCs and therefore stage the liver fibrosis.
Recently, MR molecular imaging is an effective tool to detect early tumor angiogenesis by targeting integrin αvβ3 with RGD peptide modified USPIO is an effective tool to detect early angiogenesis, it has been proved to monitor the tumor responses to antiangiogenic therapies in xenografts model.34,35 In the present study, we have demonstrated for the first time that MR molecular imaging may stage liver fibrosis in CCl4 rat model by using RGD-USPIO specifically targeting integrin αvβ3. Evidence of staging liver fibrosis by using RGD-USPIO is that the value of ΔR2* showed significant difference among different liver fibrosis stages. It is worth noting that specific binding characteristics of the imaging probe with molecular target is essential to achieve the close correlation between the detected change in MR signal and the change in expression of integrin αvβ3. To enhance binding affinity, we used the cyclic RGD peptide (c (RGDyK)), which has been reported to provide 30-fold higher stability in comparison with conventional linear peptide.36 In addition, after incubating with RGD-USPIO, HSC-T6 took up iron particles at an early incubation time of 20 minutes, and there was significant increase in the accumulation of iron particles along with incubation time. However, the naked USPIO accumulated in the cells remained at the lower level even after incubation of 3 hours. This finding indicated that RGD-USPIO was specifically bound to integrin. In experiments in vivo, Prussian staining of liver specimen showed that after administration of RGD-USPIO, iron particles mainly deposited along the fibrotic septa in the perisinusoidal space of Disse where HSCs most commonly reside. In contrast, the deposition of iron particles was randomly distributed in the hepatic sinus after administration of USPIO. TEM further demonstrated that a large amount of iron particles was taken up by activated HSCs. Taken together, these findings suggest that RGD-USPIO is able to specifically and strongly bind to integrin αvβ3 expressed on activated HSCs.
Study on staging liver fibrosis by using MR molecular imaging is limited so far. A new method to diagnose and stage liver fibrosis in CCl4 rat model has been suggested by researchers, who reported after intravenous administration of collagen-specific probe (EP-3533) based on Gd3+, there was significant difference in change of contrast to noise ratio between liver and muscle in liver fibrosis stages of Ishak 0, 2–3, and 4–5.37 However, owing to the low longitudinal relaxivity of EP-3533 (16.2 mMs−1 at 4.7 T MR), detection of sparsely expressed targets (early injured liver) is potentially limited. In our study, the transverse relaxivity of RGD-USPIO (137.85 mMs−1 at 1.41 T MR) allows detecting the sparse targets with sufficient sensitivity for in vivo detection.38
We have demonstrated that MR molecular imaging specific targeting integrin αvβ3 may differentiate different stages of liver fibrosis, while one potential limitation is unspecific uptake of USPIO particles by Kuffer cells (the resident macrophages of liver). It depends on the coating material and size of USPIO.39 In our study, the hydrated particle size of RGD-USPIO is 37.5 nm, which may decrease the uptake into reticuloendothelial system.40 In order to avoid the unspecific uptake of USPIO affecting the measurement of ΔR2*, we designed the control group including animal models with similar Ishak fibrosis score by injecting the same iron dose of naked USPIO as that of RGD-USPIO. Significant difference in ΔR2* value was only found between advanced liver fibrosis and normal liver. This may be explained in two ways. First, the severe liver fibrosis was frequently associated with severe inflammation resulting in more infiltration of macrophages in liver parenchyma. Second, these increased macrophages may cause the additional endocytosis of USPIO and contribute to the increase in ΔR2* value. However, there is significant difference of ΔR2* value in advanced liver fibrosis by injection of naked USPIO and RGD-USPIO, indicating that specific uptake of USPIO account for the large proportion of changes in signal intensity.
In conclusion, we have shown that the increased integrin αvβ3 on activated HSCs was well correlated with the progression of liver fibrosis in CCl4 rat model. Molecular MRI with specific targeting of the integrin αvβ3 by using RGD peptide modified USPIO was successfully demonstrated for the first time to distinguish different stages of liver fibrosis. It could be promising to noninvasively monitor the progression of the liver fibrosis and therapeutic response to antifibrotic treatment.
Acknowledgments
We thank Chunfu Zhang (Med-X Research Institute, Shanghai Jiao Tong University, China) for technical assistance in synthesis of nanoparticles. This study was supported by grants from the National Natural Science Foundation of China (NSFC 81171389, 81371621), Key Program of Basic Research from Shanghai Municipal Science and Technology Commission (12JC1406500), the Program of Shanghai Municipal Health Outstanding Discipline Leader (XBR 2013110), and the Program of Medical Engineering Cross Research Fund of Shanghai Jiao Tong University (YG2012MS15). The funders had no role in study design, data collection and analysis, decision to publish, or preparation of the manuscript. This work has never been submitted for publication previously and has not been submitted for publication elsewhere.
Disclosure
The authors report no conflicts of interest in this work.
References
Hernandez-Gea V, Friedman SL. Pathogenesis of liver fibrosis. Annu Rev Pathol. 2011;6:425–456. | ||
Schuppan D, Afdhal NH. Liver cirrhosis. Lancet. 2008;371(9615):838–851. | ||
Friedman SL. Evolving challenges in hepatic fibrosis. Nat Rev Gastroenterol Hepatol. 2010;7(8):425–436. | ||
Bataller R, Brenner DA. Liver fibrosis. J Clin Invest. 2005;115(2):209–218. | ||
Povero D, Busletta C, Novo E, et al. Liver fibrosis: a dynamic and potentially reversible process. Histol Histopathol. 2010;25(8):1075–1091. | ||
Iredale JP. Models of liver fibrosis: exploring the dynamic nature of inflammation and repair in a solid organ. J Clin Invest. 2007;117(3):539–548. | ||
Ghany MG, Strader DB, Thomas DL, Seeff LB. Diagnosis, management, and treatment of hepatitis C: an update. Hepatology. 2009;49(4):1335–1374. | ||
Regev A, Berho M, Jeffers LJ, et al. Sampling error and intraobserver variation in liver biopsy in patients with chronic HCV infection. Am J Gastroenterol. 2002;97(10):2614–2618. | ||
Castera L, Pinzani M. Biopsy and non-invasive methods for the diagnosis of liver fibrosis: does it take two to tango? Gut. 2010;59(7):861–866. | ||
Wang Y, Ganger DR, Levitsky J, et al. Assessment of chronic hepatitis and fibrosis: comparison of MR elastography and diffusion-weighted imaging. AJR Am J Roentgenol. 2011;196(3):553–561. | ||
Friedrich-Rust M, Wunder K, Kriener S, et al. Liver fibrosis in viral hepatitis: noninvasive assessment with acoustic radiation force impulse imaging versus transient elastography. Radiology. 2009;252(2):595–604. | ||
Sagir A, Erhardt A, Schmitt M, Haussinger D. Transient elastography is unreliable for detection of cirrhosis in patients with acute liver damage. Hepatology. 2008;47(2):592–595. | ||
Castera L, Foucher J, Bernard PH, et al. Pitfalls of liver stiffness measurement: a 5-year prospective study of 13,369 examinations. Hepatology. 2010;51(3):828–835. | ||
Faria SC, Ganesan K, Mwangi I, et al. MR imaging of liver fibrosis: current state of the art. Radiographics. 2009;29(6):1615–1635. | ||
Taouli B, Koh DM. Diffusion-weighted MR imaging of the liver. Radiology. 2010;254(1):47–66. | ||
Talwalkar JA, Yin M, Fidler JL, Sanderson SO, Kamath PS, Ehman RL. Magnetic resonance imaging of hepatic fibrosis: emerging clinical applications. Hepatology. 2008;47(1):332–342. | ||
Mankoff DA. A definition of molecular imaging. J Nucl Med. 2007;48(6):18N, 21N. | ||
Liu Y, Yang Y, Zhang C. A concise review of magnetic resonance molecular imaging of tumor angiogenesis by targeting integrin alphavbeta3 with magnetic probes. Int J Nanomedicine. 2013;8:1083–1093. | ||
Iredale JP. Hepatic stellate cell behavior during resolution of liver injury. Semin Liver Dis. 2001;21(3):427–436. | ||
Henderson NC, Arnold TD, Katamura Y, et al. Targeting of alphav integrin identifies a core molecular pathway that regulates fibrosis in several organs. Nat Med. 2013;19(12):1617–1624. | ||
Giancotti FG, Ruoslahti E. Integrin signaling. Science. 1999;285(5430):1028–1032. | ||
Gaertner FC, Schwaiger M, Beer AJ. Molecular imaging of avb3 expression in cancer patients. Q J Nucl Med Mol Imaging. 2010;54(3):309–326. | ||
Patsenker E, Popov Y, Stickel F, et al. Pharmacological inhibition of integrin alphavbeta3 aggravates experimental liver fibrosis and suppresses hepatic angiogenesis. Hepatology. 2009;50(5):1501–1511. | ||
Zhou X, Murphy FR, Gehdu N, Zhang J, Iredale JP, Benyon RC. Engagement of alphavbeta3 integrin regulates proliferation and apoptosis of hepatic stellate cells. J Biol Chem. 2004;279(23):23996–24006. | ||
Zhang X, Xin J, Shi Y, et al. Assessing activation of hepatic stellate cells by (99m)Tc-3PRGD2 scintigraphy targeting integrin alphavbeta3: a feasibility study. Nucl Med Biol. 2015;42(3):250–255. | ||
Li F, Song Z, Li Q, et al. Molecular imaging of hepatic stellate cell activity by visualization of hepatic integrin alphavbeta3 expression with SPECT in rat. Hepatology. 2011;54(3):1020–1030. | ||
Wang QB, Han Y, Jiang TT, et al. MR Imaging of activated hepatic stellate cells in liver injured by CCl4 of rats with integrin-targeted ultrasmall superparamagnetic iron oxide. Eur Radiol. 2011;21(5):1016–1025. | ||
Laurent S, Forge D, Port M, et al. Magnetic iron oxide nanoparticles: synthesis, stabilization, vectorization, physicochemical characterizations, and biological applications. Chem Rev. 2008;108(6):2064–2110. | ||
Polasek M, Fuchs BC, Uppal R, et al. Molecular MR imaging of liver fibrosis: a feasibility study using rat and mouse models. J Hepatol. 2012;57(3):549–555. | ||
Bedossa P, Dargere D, Paradis V. Sampling variability of liver fibrosis in chronic hepatitis C. Hepatology. 2003;38(6):1449–1457. | ||
Chen YQ, Trikha M, Gao X, et al. Ectopic expression of platelet integrin alphaIIb beta3 in tumor cells from various species and histological origin. Int J Cancer. 1997;72(4):642–648. | ||
Carpino G, Morini S, Ginanni Corradini S, et al. Alpha-SMA expression in hepatic stellate cells and quantitative analysis of hepatic fibrosis in cirrhosis and in recurrent chronic hepatitis after liver transplantation. Dig Liver Dis. 2005;37(5):349–356. | ||
Livak KJ, Schmittgen TD. Analysis of relative gene expression data using real-time quantitative PCR and the 2(-Delta Delta C(T)) Method. Methods. 2001;25(4):402–408. | ||
Zhang C, Jugold M, Woenne EC, et al. Specific targeting of tumor angiogenesis by RGD-conjugated ultrasmall superparamagnetic iron oxide particles using a clinical 1.5-T magnetic resonance scanner. Cancer Res. 2007;67(4):1555–1562. | ||
Zhang F, Huang X, Zhu L, et al. Noninvasive monitoring of orthotopic glioblastoma therapy response using RGD-conjugated iron oxide nanoparticles. Biomaterials. 2012;33(21):5414–5422. | ||
Bogdanowich-Knipp SJ, Chakrabarti S, Williams TD, Dillman RK, Siahaan TJ. Solution stability of linear vs. cyclic RGD peptides. J Pept Res. 1999;53(5):530–541. | ||
Fuchs BC, Wang H, Yang Y, et al. Molecular MRI of collagen to diagnose and stage liver fibrosis. J Hepatol. 2013;59(5):992–998. | ||
Sosnovik DE, Nahrendorf M, Weissleder R. Molecular magnetic resonance imaging in cardiovascular medicine. Circulation. 2007;115(15):2076–2086. | ||
Kalber TL, Smith CJ, Howe FA, et al. A longitudinal study of R2* and R2 magnetic resonance imaging relaxation rate measurements in murine liver after a single administration of 3 different iron oxide-based contrast agents. Invest Radiol. 2005;40(12):784–791. | ||
Briley-Saebo KC, Johansson LO, Hustvedt SO, et al. Clearance of iron oxide particles in rat liver: effect of hydrated particle size and coating material on liver metabolism. Invest Radiol. 2006;41(7):560–571. |
 © 2016 The Author(s). This work is published and licensed by Dove Medical Press Limited. The
full terms of this license are available at https://www.dovepress.com/terms
and incorporate the Creative Commons Attribution
- Non Commercial (unported, 3.0) License.
By accessing the work you hereby accept the Terms. Non-commercial uses of the work are permitted
without any further permission from Dove Medical Press Limited, provided the work is properly
attributed. For permission for commercial use of this work, please see paragraphs 4.2 and 5 of our Terms.
© 2016 The Author(s). This work is published and licensed by Dove Medical Press Limited. The
full terms of this license are available at https://www.dovepress.com/terms
and incorporate the Creative Commons Attribution
- Non Commercial (unported, 3.0) License.
By accessing the work you hereby accept the Terms. Non-commercial uses of the work are permitted
without any further permission from Dove Medical Press Limited, provided the work is properly
attributed. For permission for commercial use of this work, please see paragraphs 4.2 and 5 of our Terms.