Back to Journals » Drug Design, Development and Therapy » Volume 12
Modes of cell death induced by tetrahydroisoquinoline-based analogs in MDA-MB-231 breast and A549 lung cancer cell lines
Authors Nel M, Joubert AM, Dohle W, Potter BVL ![]() , Theron AE
, Theron AE ![]()
Received 27 September 2017
Accepted for publication 27 March 2018
Published 25 June 2018 Volume 2018:12 Pages 1881—1904
DOI https://doi.org/10.2147/DDDT.S152718
Checked for plagiarism Yes
Review by Single anonymous peer review
Peer reviewer comments 3
Editor who approved publication: Professor Anastasios Lymperopoulos
Marcel Nel,1 Anna M Joubert,1 Wolfgang Dohle,2 Barry VL Potter,2 Anne E Theron1
1Department of Physiology, Faculty of Health Sciences, University of Pretoria, Pretoria, South Africa; 2Medicinal Chemistry & Drug Discovery, Department of Pharmacology, University of Oxford, Oxford, UK
Background: A and B rings of the steroidal microtubule disruptor, 2-methoxyestradiol, and its analogs can be mimicked with a tetrahydroisoquinoline (THIQ) core. THIQs are cytotoxic agents with potential anticancer activities. The aim of this in vitro study was to investigate the modes of cell death induced by four nonsteroidal THIQ-based analogs, such as STX 2895, STX 3329, STX 3451 and STX 3450, on MDA-MB-231 metastatic breast and A549 epithelial lung carcinoma cells.
Materials and methods: Cytotoxicity studies determined the half-maximal growth inhibitory concentration of the analogs to be at nanomolar concentrations without the induction of necrosis. Light and fluorescent microscopy determined that compounds caused microtubule depolymerization and displayed morphological hallmarks of apoptosis.
Results: Flow cytometric analyses confirmed apoptosis induction as well as an increased G2/M phase on cell cycle analysis. Furthermore, intrinsic pathway signaling was implicated due to increased cytochrome c release and a decrease in mitochondrial transmembrane potential. Potential involvement of autophagy was observed due to increased acidic vacuole formation and increased aggresome activation factor.
Conclusion: Thus, it can be concluded that these four THIQ-based analogs exert anti-proliferative and antimitotic effects, induce apoptosis and involve autophagic processes. Further investigation into the efficacy of these potential anticancer drugs will be conducted in vitro and in vivo.
Keywords: cancer, apoptosis, autophagy, antimitotic, nonsteroidal
Background
Lung cancer is the most common cancer in the world, affecting 7% of women and 6% of men.1 It is responsible for 27% of all cancer deaths.1 Breast cancer is the most prevalent cancer in South African women and is diagnosed in 25% of women worldwide.2 Breast cancer is responsible for 15% of cancer deaths in women.3 Since 1989, cancer-related mortality has been declining in women under 50 years of age due to early detection, increased awareness and improved treatment.3
A new group of chemotherapeutic agents have been synthesized to target tubulin dynamics. Colchicine, a microtubule-depolymerizing drug, did not complete clinical cancer trials due to unacceptable high toxic side effects that included blood dyscrasias, myelotoxicity and gastrointestinal symptoms.4,5 Research strategies aim to improve the pharmacodynamic and pharmacokinetic profiles of the existing anticancer compounds by either reducing side effect profiles, maximizing their therapeutic effects or designing agents that are insensitive to multidrug resistance mechanisms.6 A potential intracellular target for anticancer drug design includes the colchicine binding site, which lends anti-angiogenic actions to the compounds as well as the ability to overcome P-glycoprotein-mediated drug resistance.5
2-Methoxyestradiol (2-ME), an endogenous β-estradiol metabolite, disrupts microtubule dynamics by binding to the colchicine binding site. At lower concentrations, 2-ME causes stabilization of microtubule dynamics, whereas at higher concentrations 2-ME results in microtubule depolymerization.7 2-ME warranted further investigation due to its anti-proliferative and antimitotic abilities as well as its potent anti-angiogenic properties in various commercial cancer cell lines and thus underwent Phase I and II clinical trials registered as Panzem® (EntreMed, Inc., Rockville, MD, USA).4,8–11 However, 2-ME exhibited extensive glucuronidation and had a very low oral bioavailability (1%–2%).12 New chemically modified analogs were designed to improve the anti-tubulin properties of the parent compound as well as to improve the compounds’ pharmaceutical properties and metabolic availability. This included the synthesis of a bis-sulfamoylated derivative, 2-methoxyestradiol-3,17-O, O-bis-sulfamate (2-MEbisMATE, STX 140), which encompassed the addition of sulfamate groups to C3 and C17 of 2-ME.13,14 Sulfamoylation of 2-ME promoted binding to carbonic anhydrase II (CAII) in erythrocytes which facilitated bypassing of the first-pass metabolism in the liver.15 Compared to 2-ME, this sulfamoylated derivative displayed resistance to catabolism and improved bioavailability in rodents.16 Structure–activity relationship (SAR) studies identified the pharmacophore that underlay the anti-proliferative activity of the steroidal microtubule disruptors as the aromatic A ring with either a 2-methoxy, 2-methylsulfanyl or 2-ethyl together with a 3-O-sulfamate group and the D-ring hydrogen-bond acceptor at C17.17 Sulfamoylation improves pharmaceutical properties and is also a technique for imparting inhibition of steroid sulfatase and carbonic anhydrase IX (CAIX).18
Leese et al17 demonstrated that a tetrahydroisoquinoline (THIQ) core could be used to mimic the A and B rings of steroidal microtubule disruptors such as 2-MEbisMATE based upon reports indicating the use of THIQs as selective estrogen receptor modulators. THIQ-based analogs are excellent steroidomimetics and have low molecular weight and a good solubility profile.19 THIQ-containing alkaloids interact with microtubule networks and lead to cell cycle arrest in the G2 phase that results in p53-independent apoptosis in human colon adenocarcinoma (LoVo/SW620) cell lines.20 The THIQ core possesses a good degree of rigidity, and thus steroidomimetic microtubule disruptors were synthesized by introducing C2 and C3 of the steroidal A ring to C6 and C7 of the THIQ core, as well as introducing the required hydrogen bond acceptor that projected from the steroidal D ring to N2, for effective pharmacophore translation from the steroidal 2-MEbisMATE to the nonsteroidal THIQs.17,19 The anti-proliferative activity of this new series of sometimes “chimeric” molecules (one of which, STX 2895, could be considered as a chimeric hybrid of elements of the 2-ethyl analog of 2-ME 3-O-sulfamate and colchicine) exceeds that of the steroidal parent compounds (2-ME and 2-MEbisMATE), and excellent oral activity in vivo is also imparted. Furthermore, the early promise of these nonsteroidal microtubule-disrupting analogs was confirmed through recent studies in NF1 tumor cell lines and their inhibition of tumor growth in vivo in a xenograft model of multiple myeloma and breast cancer.17,21,22 However, extensive exploration of the mechanism of action of these THIQ-based analogs is still lacking.
The aim of this study was to investigate the modes of cell death induced by THIQ-based analogs as well as to confirm the enhanced efficacy induced by the aryl sulfamate-substituted moiety on metastatic breast adenocarcinoma MDA-MB-231 cells and A549 epithelial lung carcinoma cells. For this in vitro study, four nonsteroidal THIQ-based analogs were investigated, namely 2-(3′-bromo-4′,5′-dimethoxybenzyl)-6-hydroxy-7-methoxy-1,2,3,4-tetrahydroisoquinoline (STX 3450), 7-ethyl-6-sulfamoyloxy-2-(3′,4′,5′-trimethoxybenzyl)-1,2,3,4-tetrahydroisoquinoline (STX 2895), (±)-2-(3′-bromo-4′,5′-dimethoxybenzyl)-7-methoxy-3-methyl-6-sulfamoyloxy-1,2,3,4-tetrahydroisoquinoline (STX 3329) and 2-(3′-bromo-4′,5′-dimethoxybenzyl)-7-methoxy-6-sulfamoyloxy-1,2,3,4-tetrahydroisoquinoline (STX 3451; Figure 1). Comparative studies were also performed between the non-sulfamoylated compound such as STX 3450 and the sulfamoylated compounds such as STX 2895, STX 3329 and STX 3451.
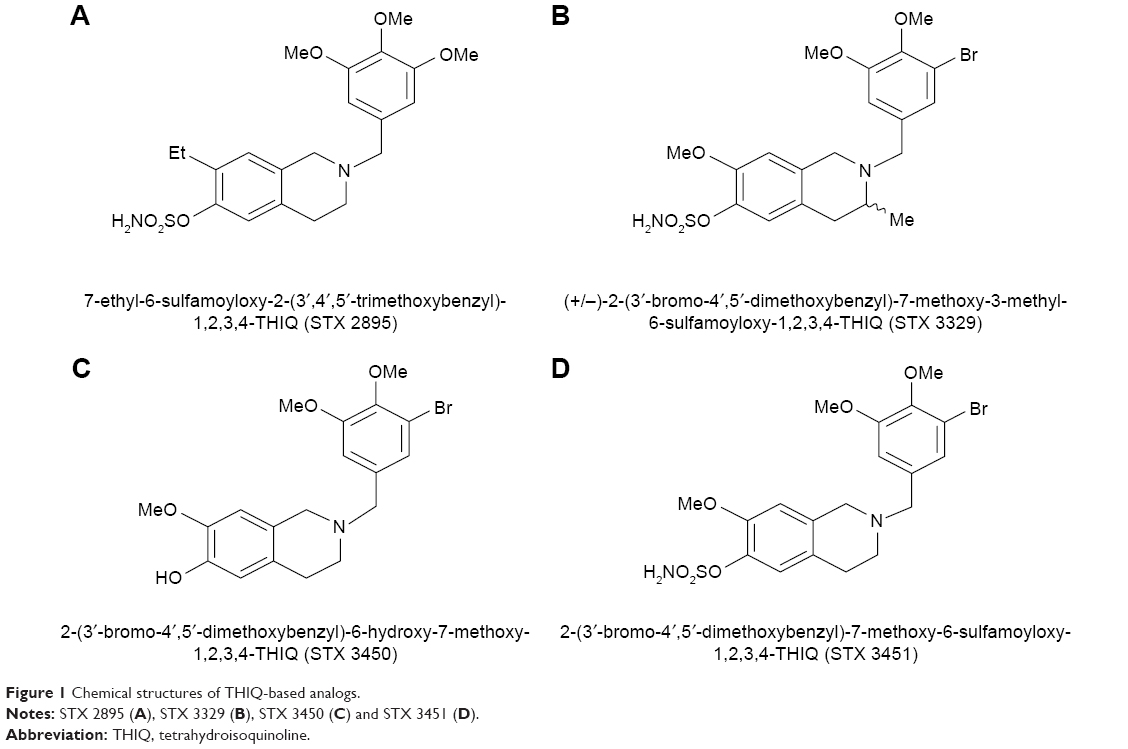 | Figure 1 Chemical structures of THIQ-based analogs. |
Materials and methods
Reagents
Dulbecco’s Modified Eagle’s Medium (DMEM), phosphate-buffered saline (PBS), trypsin, monodansylcadaverine (MDC) stain, propidium iodide (PI), ribonuclease A (RNase A) and all other additional chemicals not specifically mentioned were of analytical grade and were purchased from Sigma-Aldrich Co. (St Louis, MO, USA). Penicillin, streptomycin and fungizone were bought from Thermo Fisher Scientific (Waltham, MA, USA), and fetal calf serum (FCS) was purchased from Biochrom GmbH (Berlin, Germany). Crystal violet, 1% glutaraldehyde and Triton X-100 were purchased from EMD Millipore (Billerica, MA, USA). Ethics approval was obtained from The Research Ethics Committee, Faculty of Health Sciences, University of Pretoria, South Africa (reference number: 258/2015).
Chemical compounds and appropriate controls
2-ME was obtained from Sigma-Aldrich Co. The THIQ-based analogs STX 3450, STX 3451, STX 3329 and STX 2895 were synthesized as described previously.23,24 Working 1 mM stock solutions of 2-ME and THIQ-based analogs were prepared in dimethyl sulfoxide (DMSO) and stored at −20°C. DMSO, actinomycin D, colchicine and tamoxifen were obtained from Sigma-Aldrich Co. DMSO was used as a vehicle control, not exceeding 0.05% (volume/volume) concentration in the final dilution. Actinomycin D (0.1 μg/mL) and colchicine (1 μM) were used as positive controls for apoptosis. A final concentration of 20 μM tamoxifen was used as a positive control for autophagy. Cells were exposed to 2-ME (1 μM) as a control for mitotic arrest. For all experiments following the cytotoxicity studies, cells were exposed to the half-maximal growth inhibitory concentration (GI50) values for 24 h and incubated at 37°C.
Cell lines and general cell culture protocols
For this in vitro study, the commercial metastatic human adenocarcinoma breast cancer cell line (MDA-MB-231) and the human lung carcinoma epithelial cell line (A549) were used (Cellonex, Johannesburg, South Africa). Complete cell growth medium was prepared by adding 10% heat-activated FCS, fungizone (250 μg/L), penicillin G (100 U/mL) and streptomycin (100 μg/L) to DMEM. Viable cells were seeded at 5,000 cells/200 μL growth medium for 96-well plates and 3.5 × 10⁴ cells/3 mL growth medium for six-well plates. For the 25 cm2 culture flasks, viable cells were seeded at 1 × 10⁶ cells/5 mL growth medium. A Forma Scientific water-jacketed incubator (Forma Scientific, Inc., Marietta, OH, USA) was used to incubate cells in a humidified atmosphere (5% CO2, 37°C). To detach cells, growth medium was discarded and cells were washed with PBS. Cells were harvested by adding 1 mL trypsin to the flask (5 min) until rounded and collected by centrifugation (100 × g for 5 min). Cells were subcultured, seeded for an experiment or frozen. A 24 h cell attachment policy and a 24 h exposure period were used for all experiments.25
Cytotoxicity studies using spectrophotometric quantification of crystal violet
Crystal violet staining was used to determine the cytotoxicity of 2-ME, STX 3450, STX 3451, STX 2895 and STX 3329 by exposing the cells to a dose concentration series over a 24 h period. Glutaraldehyde (1%) was added to the samples (15 min at room temperature [RT]), after which it was discarded. Crystal violet (0.1%) was added for 30 min, after which the plates were washed under running tap water (±10 min). Once the plates were dry, 200 μL 0.2% Triton X-100 was added to the wells and incubated for solubilization (30 min). After incubation, 100 μL of the solution was pipetted to clean 96-well plates, and the ELx800 Universal Microplate Reader (Bio-Tek Instruments Inc., Winooski, VT, USA) was used to read the absorbance of the samples at 570 nm. The GI50 was calculated from three independent biological repeats, n = 3.
Measurement of lactate dehydrogenase (LDH) activity for necrotic cell death determination
LDH is a cytosolic enzyme that contributes to energy production within cells. Damaged and injured cells lose their membrane integrity and release LDH during necrotic cell death.26 LDH cytotoxicity assay kit was purchased from Roche Applied Sciences (Mannheim, Germany). After 24 h of exposure, the microplate was centrifuged at 100 × g (10 min). Supernatant (100 μL) was transferred to clean 96-well plates. Negative experimental controls included cells grown in medium only and cells exposed to DMSO as a vehicle control. Cells exposed to 2% Triton X-100 served as a positive control for LDH release. The catalyst solution was prepared beforehand by adding the lyophilisate provided in kit to 1 mL double distilled water (ddH2O) and stored at 4°C. LDH reaction mixture was prepared shortly before use with 250 μL of catalyst solution and 11.25 mL dye solution. LDH reaction mixture (100 μL) was added to each well, and samples were incubated for 30 min at RT protected from light. Absorbance was read using the ELx800 Universal Microplate Reader at 490 nm. The experiment was repeated three times in replicates of three, and the data are shown as mean ± SD.
Investigation of morphological changes through the use of polarization-optical transmitted light differential interference contrast microscopy
Polarization-optical transmitted light differential interference contrast microscopy (PlasDIC) was used to view morphological changes that occurred in MDA-MB-231 and A549 cells after a 24 h exposure period to 2-ME and THIQ-based analogs. Using the Axiovert-40 microscope (Carl Zeiss, Göttingen, Germany) and the Axiovert MRm monochrome camera (Carl Zeiss, Göttingen, Germany), PlasDIC images were visualized and captured at 40× magnification.
Acidic vacuole staining employing fluorescence microscopy
Treated cells were stained with 0.5 mM MDC in PBS for 10 min (37°C) and protected from light. Cells were washed four times with PBS. Fluorescent images were visualized using the Zeiss inverted Axiovert CFL 40 microscope (40× magnification) and captured by the Axiovert MRm monochrome camera (Carl Zeiss, Göttingen, Germany). MDC staining was detected with an ultraviolet (UV) filter at 380 nm excitation and 420 nm emission.
Investigations of intracellular ultrastructure with transmission electron microscopy (TEM)
Exposed cells were fixed for 1 h in 2.5% glutaraldehyde in 0.075 M phosphate buffer (pH 7.4; RT) and washed with 0.075 M phosphate buffer (3 × 10 min). Using 0.5% osmium tetroxide, cells were fixed for 1 h at RT after which cells were washed with ddH2O three times. Cells were dehydrated with increasing ethanol concentrations (10%, 30%, 50%, 70%, and 100%) for 10 min at each concentration and left in 100% ethanol overnight. Cells were infiltrated with 30% Quetol in ethanol followed by 60% Quetol for 1 h at each concentration and then for 4 h with 100% Quetol. Specimens were embedded and polymerized (39 h at 60°C). A microtome was used to prepare ultrathin sections that were mounted on copper disks. Samples were stained with 4% aqueous uranyl acetate (2 min) and in Reynolds’ lead citrate (5 min), each followed by rinsing with ddH2O. The JEM-2100F field-emission transmission electron microscope (JEOL, Tokyo, Japan) was used to view the TEM images at the Electron Microscopy Unit of the University of Pretoria (Pretoria, South Africa).
Confocal microscopy used to investigate microtubule integrity
MDA-MB-231 and A549 cells were seeded at 60,000 cells/2 mL in 24-well plates on sterilized 12 mm round coverslips. After exposure, DMEM was aspirated and cells were washed with pre-warmed PBS. Cells were permeabilized with pre-warmed optimal fixation buffer [80 mM piperazine-N,N′-bis(2-ethanesulfonic acid), 1 mM ethylene glycol-bis(β-aminoethyl ether)-N, N, N′, N′-tetraacetic acid (EGTA), 1 mM MgCl2, 0.5% Triton X-100 and 10% glycerol, adjusted to a pH of 6.7] for 10 min at 37°C. Cells were fixed in ice-cold methanol (6 min at −20°C) and then washed with PBS. Cells were incubated in the primary antibody cocktail containing the primary monoclonal antibody to tubulin alpha (clone DM1A) purchased from Imgenex (San Diego, CA, USA; 1:4,000 ratio) in PBS containing 0.3% bovine serum albumin (BSA; 30 min at RT). Slides were washed three times in PBS, after which samples were incubated in the secondary antibody cocktail containing the Alexa Fluor 488 IgG secondary antibody (1:1,000 ratio; Thermo Fisher Scientific) and 4′,6-diamidino-2-phenyliindole fluorescent stain (1:1,000; Thermo Fisher Scientific) in PBS containing 0.3% BSA (30 min at RT) while being protected from light. Samples were washed three times with PBS. Coverslips were mounted with a glycerol-based mounting fluid. Cells were examined using a Zeiss LSM 510 Meta Confocal Microscope (Carl Zeiss Meditec AG, Jena, Germany) at the Electron Microscopy Unit of the University of Pretoria (Pretoria, South Africa).
Cell cycle progression analysis via quantification of PI staining
PI is a fluorescent dye used to quantify DNA content at 488 nm excitation.27 Flow cytometry employing PI was used to distinguish cells in the different cell cycle phases. After exposure, cells were trypsinized and washed in ice-cold PBS and resuspended in 200 μL ice-cold PBS. Cells were fixed in ice-cold 70% ethanol and incubated overnight at 4°C. Cells were resuspended in PBS containing 0.01% Triton X-100, PI (40 μg/mL) and RNase A (100 μg/mL) and incubated for 40 min at 37°C. PI fluorescence (detected at 590 nm) was measured using the fluorescence channel 3 (FL3) on the FC500 system flow cytometer (Beckman Coulter, Brea, CA, USA) after being excited at 488 nm. Cell cycle distributions were analyzed with Cyflogic flow cytometry analysis software (Beckman Coulter) using the DNA content per cell which illustrates the sub-G1, G1, S, G2/M fractions.
Apoptosis detection: annexin V-fluorescein isothiocyanate (FITC) quantification
Viable cells have phosphatidylserine (PS) located mostly on the inner surface of the cell membrane. When apoptosis occurs, PS flip will occur to the outside surface of cells to which annexin-V binds.28 The BioVision Annexin-V FITC kit was purchased from BioVision Research Products (Mountain View, CA, USA), and the experiment was performed according to the manufacturer’s protocol. Washed cells were resuspended in annexin V-FITC binding buffer (0.25–107 cells/mL). Annexin V-FITC (5 μL) and 10 μL of PI were added to 100 μL of the cell suspension, and samples were incubated at RT (15 min) in the dark. Annexin V binding buffer was added to each test tube. PI (FL3), and annexin V (FL1) fluorescence was analyzed with the FC500 system flow cytometer equipped with an air-cooled argon laser excited at 488 nm. Three biological repeats with data from a minimum of 10,000 cells were captured.
Autophagy detection: quantification of aggresome formation via flow cytometry
The Enzo Life Sciences’ ProteoStat® Aggresome Detection Kit was purchased from Enzo Life Sciences (Farmingdale, NY, USA). The protocol was carried out according to the manufacturer’s guidelines. After treatment, cells were trypsinized and washed with ice-cold PBS. Cells were fixed in 4% formaldehyde (added in a dropwise manner while being vortexed) and incubated at RT (30 min). Cells were washed with PBS and resuspended in the small amount of remaining PBS. Permeabilizing solution was added, and samples were incubated on ice for 30 min. Cells were washed in PBS and resuspended in 500 μL diluted ProteoStat aggresome detection reagent. Samples were covered in foil and incubated for 30 min (RT). Fluorescence of samples was analyzed using the FL3 channel of the FC500 system flow cytometer equipped with an air-cooled argon laser excited at 488 nm. The aggresome activity factor (AAF) was calculated by using the mean fluorescence intensity (MFI) of the samples. An AAF of >25 was indicative of a significant increase in aggresome formation.
Signal transduction pathway determination via mitochondrial membrane potential assay
MitoCapture® (BioVision Research Products) is a fluorescent cationic dye that is used to distinguish between viable and apoptotic cells.25,29 MitoCapture accumulates in the mitochondria of viable cells and is released into the cytoplasm of apoptotic cells.29 The MitoCapture mitochondrial apoptosis detection kit was purchased from BioVision Research Products. After exposure, harvested cells were resuspended in 500 μL MitoCapture solution and incubated for 20 min (37°C). After incubation, cells were centrifuged (5 min at 100 × g) and the supernatant was discarded. The cells were resuspended in 500 μL incubation buffer (pre-warmed). The samples were analyzed via flow cytometry by the use of the FC500 system flow cytometer. Apoptotic cells were detectable in the FL1 channel (FITC), and viable cells were detectable in the FL3 channel (PI), both excited at 488 nm.
Intrinsic apoptosis assay: cytochrome c release from mitochondria
A FlowCellect Cytochrome c Kit was purchased from EMD Millipore, and the experiment was conducted according to the manufacturer’s protocol. Cytochrome c is a mediator of the intrinsic pathway of apoptosis.28,30 Apoptotic cells will thus show a decrease in cytochrome c staining within the mitochondria when compared to viable cells.25,30 Treated cells were washed with PBS, resuspended in 100 μL permeabilization buffer (2.5 μL 5× fixation buffer, 10 μL 10× permeabilization buffer with 87.5 μL PBS for each sample) and incubated on ice (10 min). Cells were centrifuged, and the supernatant was discarded. Cells were resuspended in 100 μL fixation buffer (40 μL of the 5× fixation buffer with 60 μL PBS for each sample) and incubated for 20 min at RT. Samples were washed in 150 μL blocking buffer. Cells were resuspended in 100 μL blocking buffer and incubated for 30 min at RT. Anti-cytochrome c FITC antibody (10 μL) was added to the samples at RT (30 min). Samples were washed and resuspended in blocking buffer. Fluorescence of the samples was analyzed on FL1 by the use of the FC500 system flow cytometer equipped with an air-cooled argon laser excited at 488 nm.
Autophagy quantification: light chain 3 (LC3)I/II Western blot analysis
Cells were washed with ice-cold PBS after the 24 h drug exposure. Cells were incubated in radioimmunoprecipitation cell lysis buffer (10 mM Tris–HCl, 0.5% sodium deoxcylate, 150 mM NaCl, 1 mM ethylenediaminetetraacetic acid [EDTA], 1 mM EGTA and 1% sodium dodecyl sulfate [SDS] in ddH2O, pH 7.4) for 5 min on ice after which cells were scraped, collected and centrifuged (30 min at 4°C [1,000 × g]). The Pierce® bicinchoninic acid (BCA) Protein Assay Kit (Thermo Fisher Scientific) was used to determine the protein concentration of the samples as per manufacturer’s protocol. Absorbance was read at 570 nm on an ELx800 Universal Microplate Reader after which 25 μg protein of each sample was added to NuPAGE lithium dodecyl sulfate buffer (1:4; Sigma-Aldrich Co.) and 5% β-mercaptoethanol. Samples were denatured at 96°C for 10 min. Samples were separated on NuPAGE Bis–Tris gel (4%–12%) wells via electrophoresis in 1× 3-(N-morpholino) propane sulfonic acid buffer (190 mM glycine, 25 mM Tris and 0.1% SDS in ddH2O, pH 8.3) at 120 V for 90 min alongside a SeeBlue® Plus2 Pre-stained Standard Protein Ladder (Thermo Fisher Scientific). Proteins were transferred to an Amersham Hybond 0.2 μm polyvinylidene fluoride (PVDF) membrane (GE Healthcare Life Sciences, Uppsala, Sweden; activated with 100% methanol) in a 1× transfer buffer (48 mM Tris, 39 mM glycine, 20% methanol and 0.0375% SDS) overnight at 40 V (4°C). Membranes were incubated in blocking buffer (2% BSA in 0.2% PBS Tween) for 30 min at RT followed by an overnight incubation (4°C) with the primary antibody cocktail (1:1,000 monoclonal LC3B/MAP1LC3B antibody produced in rabbit [Novus Biologicals, Littleton, CO, USA] in 0.2% PBS Tween, 2% BSA). Membranes were washed three times in 0.2% PBS Tween followed by a 2 h incubation with the secondary antibody (anti-rabbit IgG antibody raised in goat labeled with horseradish peroxidase [HRP]; 1:10,000; SeraCare, Milford, MA, USA) in 2.5% BSA in PBS. Membranes were washed three times in 0.2% PBS Tween. Pierce enhanced chemiluminescence (ECL) Western blotting reagent (Thermo Fisher Scientific) was used to activate HRP to visualize proteins using a ChemiDoc MP (Bio-Rad Laboratories Inc., Hercules, CA, USA). Monoclonal anti-actin antibody produced in mouse (1:5,000; Sigma-Aldrich Co.) was used to standardize the membranes and visualized using the anti-mouse IgG secondary antibody raised in goat labeled with HRP (SeraCare). Image Lab 5.2.1 (Bio-Rad Laboratories Inc.) was used to quantify band density. A minimum of three biological repeats were performed.
Statistical analyses
Morphology studies encompassing TEM, PlasDIC, MDC and confocal microscopy supplied qualitative data. A minimum of five representative images were captured for each sample. Microscopy studies were performed in duplicate at minimum. Spectrophotometry and flow cytometry supplied quantitative data. Spectrophotometric experiments were repeated three times, each with n = 3. For flow cytometry, a minimum of 10,000 cells were analyzed per run, and the data of three independent biological repeats are shown as mean ± SD. Data were analyzed with Kaluza Software (Beckman Coulter). Means were presented by bar graphs with error bars referring to SDs. Analysis of variance (ANOVA) single-factor model of significance was used to statistically analyze data, followed by a two-tailed Student’s t-test. A statistically significant P-value of <0.05 was used and indicated with an asterisk.
Results
THIQ-based analogs inhibited 50% of cell growth at nanomolar concentrations
Cytotoxicity studies were performed to determine the anti-proliferative effect of the THIQ-based analogs (STX 2895, STX 3329, STX 3451 and STX 3450) on A549 and MDA-MB-231 cancer cells in vitro. The GI50 values of the exposed cells were determined by dose-dependent studies over a 24 h period using spectrophotometric quantification of crystal violet staining. The GI50 values for exposed A549 cells were calculated as 1,500 ± 61 nM for 2-ME, 50 ± 2.8 nM for STX 2895, 40 ± 8.9 nM for STX 3329, 800 ± 10 nM for STX 3450 and 40 ± 3.4 nM for STX 3451. The GI50 values for exposed MDA-MB-231 cells were calculated as 1,500 ± 87 nM for 2-ME, 55 ± 9.2 nM for STX 2895, 45 ± 7.6 nM for STX 3329, 1,100 ± 41 nM for STX 3450 and 45 ± 5.3 nM for STX 3451. A nanomolar GI50 was determined for all compounds. It should be noted that STX 3329 is a racemic compound, as shown in Figure 1, with a chiral center adjacent to the B-ring nitrogen. Thus, it is not possible to be definitive which of the two enantiomers, or both, are active in these assays and their relative activity. This must await potential future optical resolution.
LDH quantification indicates that THIQ-based analogs do not induce necrotic cell death
To evaluate necrotic cell death induction by STX 2895, STX 3329, STX 3450 and STX 3451 on A549 and MDA-MB-231 cells, LDH assays were performed. Cells were exposed to Triton X as a positive control (high control) for complete cell lysis and LDH release. When compared to the DMSO (vehicle control), no statistically significant increase in LDH release was found in 2-ME-, STX 3450-, STX 2895-, STX 3329- and STX 3451-exposed A549 and MDA-MB-231 cells (Figure 2). These data indicate that cells did not rupture as in necrotic cell death, even at higher concentrations of the compounds.
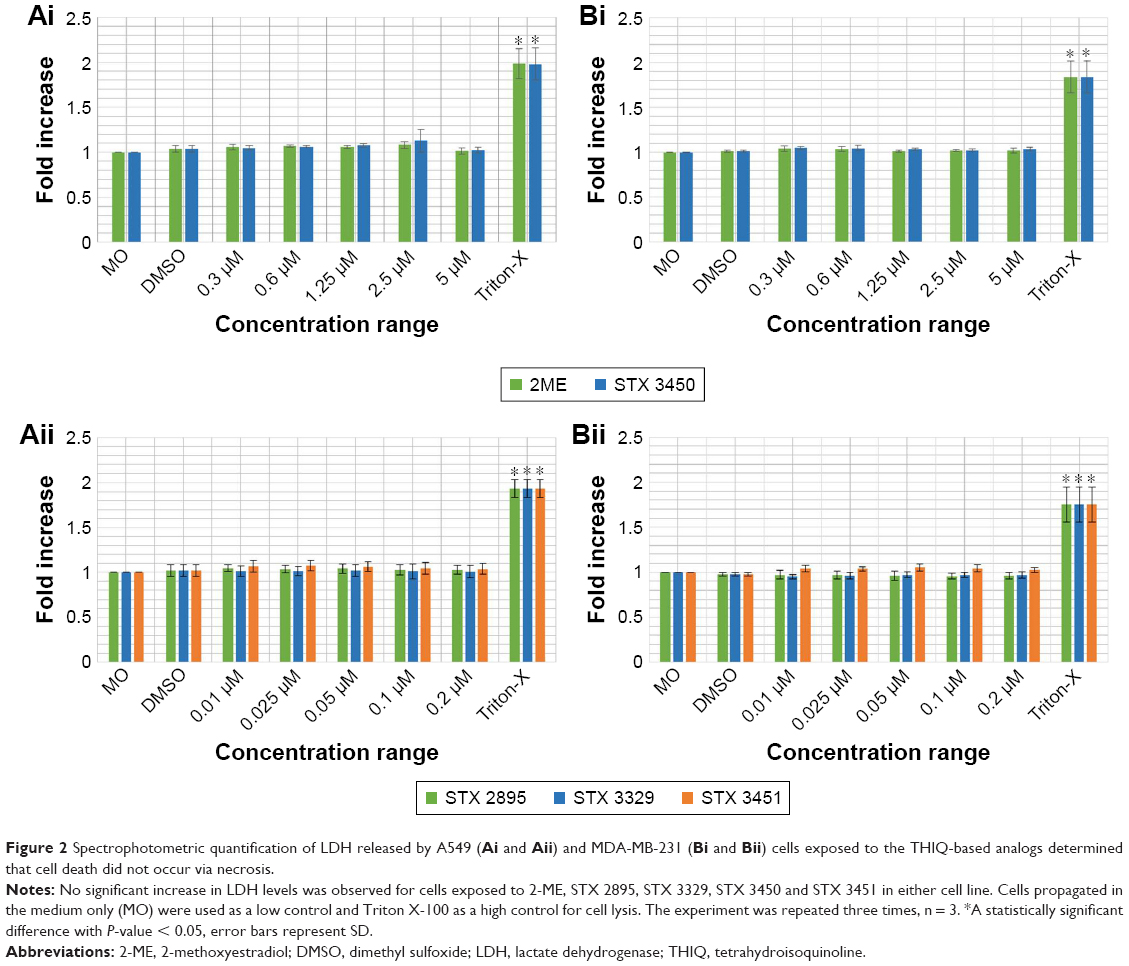 | Figure 2 Spectrophotometric quantification of LDH released by A549 (Ai and Aii) and MDA-MB-231 (Bi and Bii) cells exposed to the THIQ-based analogs determined that cell death did not occur via necrosis. |
Polarization-optical transmitted light differential interference contrast microscopy indicates induction of apoptotic cell death consequent to compound exposure
Polarization-optical transmitted light differential interference contrast microscopy (PlasDIC) was used to evaluate the morphological effect of 2-ME, STX 2895, STX 3329, STX 3450 and STX 3451 exposure on A549 and MDA-MB-231 cells. A549 and MDA-MB-231 cells were exposed to the compounds for 24 h at the determined GI50 values. A549 and MDA-MB-231 cells grown in DSMO (Figure 3A) showed confluent cell growth with no signs of cellular distress. Cells were mostly seen to be in interphase, similar to the cells grown in medium only. A549 and MDA-MB-231 cells treated with actinomycin D (Figure 3B) showed a decrease in cell density. Apoptotic body formation, shrunken cells and cell debris were demonstrated, the former two being characteristic of apoptotic cell death. 2-ME-treated A549 and MDA-MB-231 cells (Figure 3C) showed more rounded cells indicative of mitotic arrest as well as the presence of apoptotic bodies. A549 and MDA-MB-231 cells exposed to STX 2895 (Figure 3D), STX 3329 (Figure 3E), STX 3450 (Figure 3F) and STX 3451 (Figure 3G) showed a decrease in cell density, rounded cells indicative of metaphase arrest and the presence of apoptotic bodies and shrunken cells.
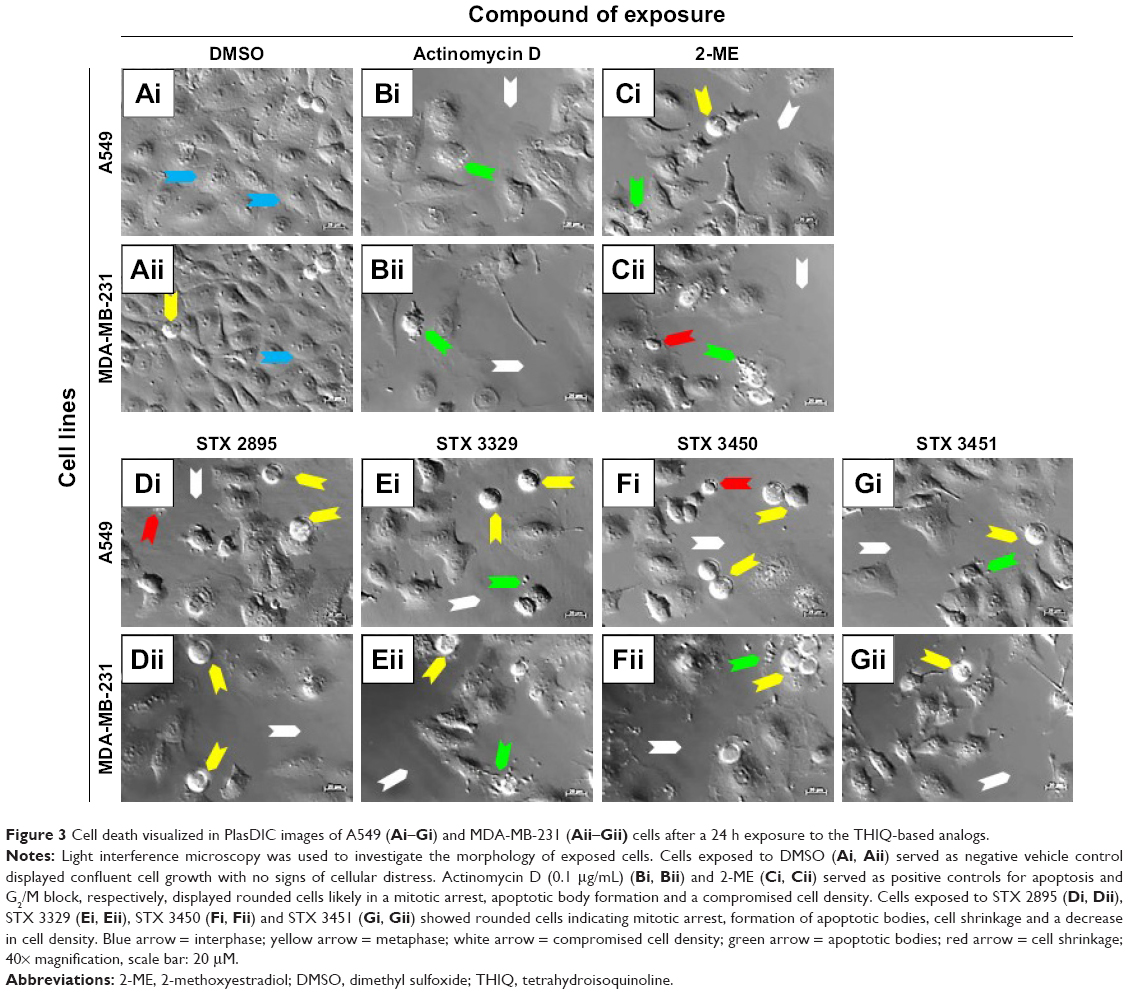 | Figure 3 Cell death visualized in PlasDIC images of A549 (Ai–Gi) and MDA-MB-231 (Aii–Gii) cells after a 24 h exposure to the THIQ-based analogs. |
Cells exposed to THIQ-based analogs underwent programmed cell death type I
Flow cytometry employing annexin V-FITC and PI was used to distinguish between viable cells, apoptosis and necrosis. No statistically significant difference in viability was found between A549 and MDA-MB-231 cells grown in medium only and the DMSO-vehicle-exposed cells (Figure 4A). Statistical analysis of the A549 scatter plot data indicated a statistically significant increase in apoptosis in actinomycin D- (54.24% ± 5.99%; P = 7.58E-03), 2-ME- (23.85% ± 5.43%; P = 3.82E-02), STX 2895- (23.12% ± 7.24%; P = 4.67E-02), STX 3329- (39.98% ± 7.04%; P = 1.95E-02), STX 3450- (29.07% ± 5.76%; P = 2.72E-02) and STX 3451-treated cells (13.01% ± 0.02%; P = 1.77E-02) when compared to DMSO vehicle control (3.75% ± 1.76%; Figure 4B[i]). Similarly, analysis of the MDA-MB-231 scatter plots (Figure 4B[ii]) indicated a statistically significant increase in apoptosis in actinomycin D- (16.49% ± 2.11%; P = 1.74E-03), 2-ME- (30.92% ± 2.89%; P = 4.49E-04), STX 2895- (29.3% ± 6.08%; P = 3.67E-03), STX 3329- (25.76% ± 2.67%; P = 6.70E-04), STX 3450- (29.76% ± 6.18%; P = 3.66E-03) and STX 3451-treated cells (25.43% ± 4.05%; P = 6.27E-04) when compared to the DMSO vehicle control (1.94% ± 1.04%). A decrease in cell viability was observed for both A549 and MDA-MB-231 cells exposed to the THIQ-based analogs when compared to the DMSO (vehicle control). No statistical difference in necrosis induction was found for THIQ-exposed A549 and MDA-MB-231 cells when compared to the DMSO (vehicle control).
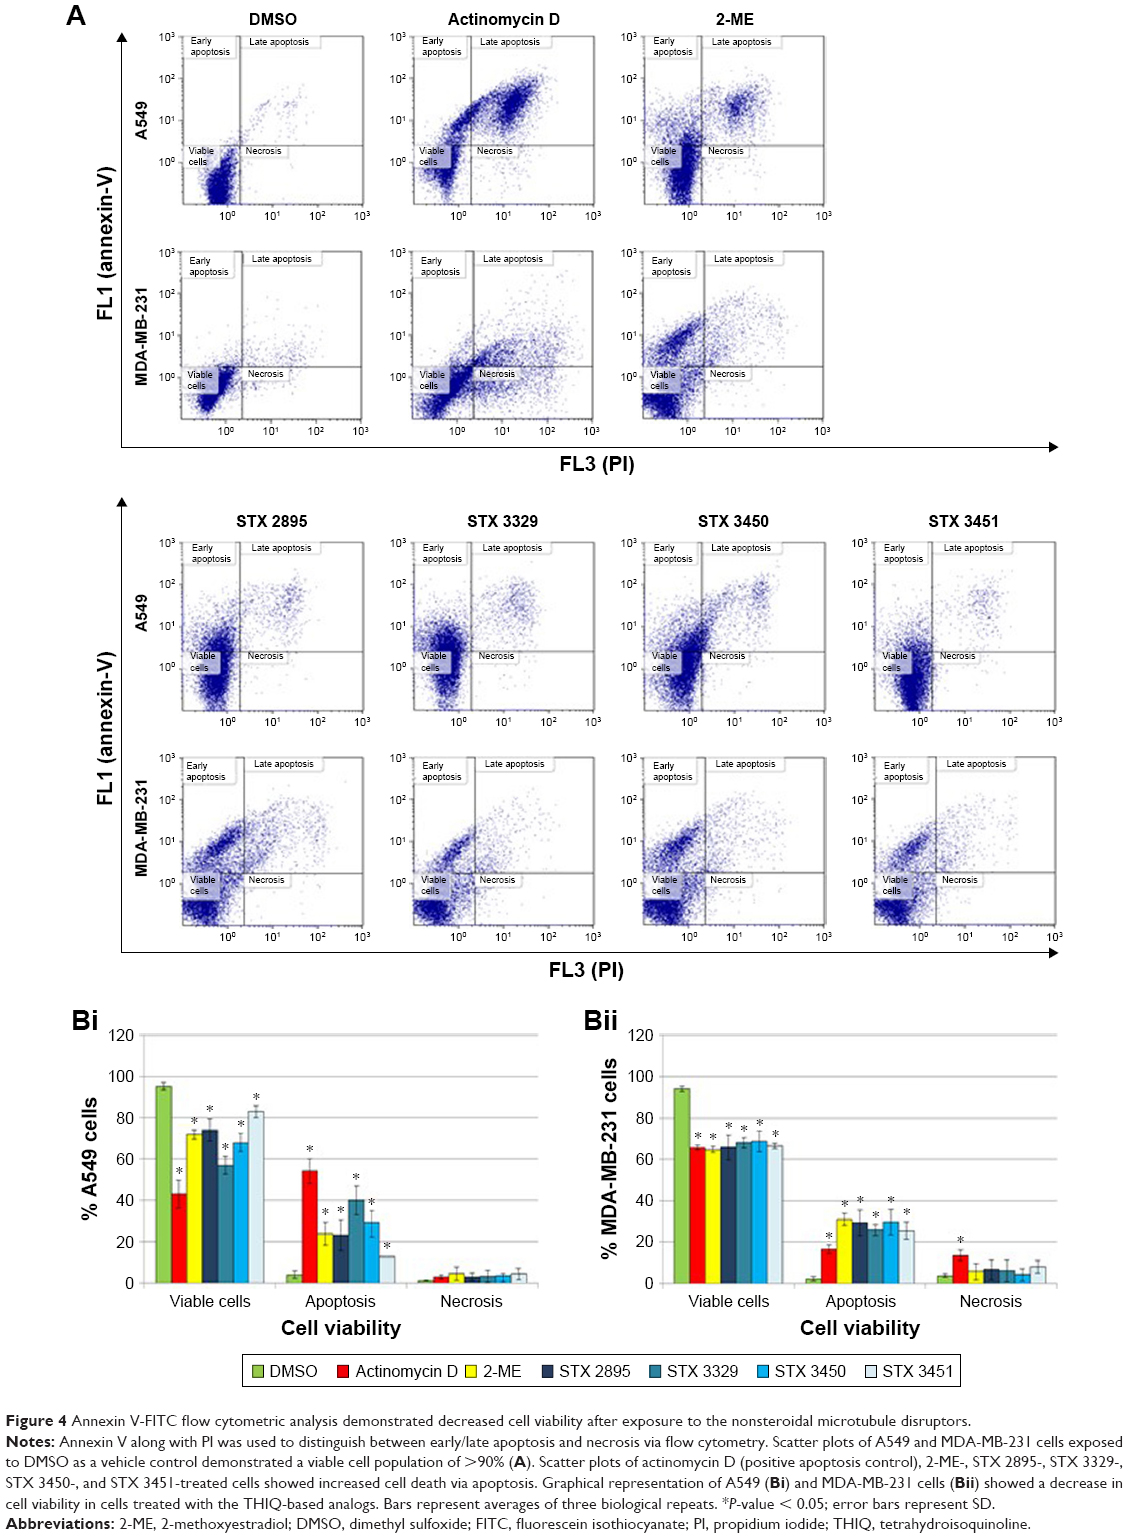 | Figure 4 Annexin V-FITC flow cytometric analysis demonstrated decreased cell viability after exposure to the nonsteroidal microtubule disruptors. |
Cell viability decreased with a concurrent increase in G2/M phase in THIQ-exposed cells
The quantification of cells at various stages within the cell cycle was determined with flow cytometry. Figure 5A shows the histograms obtained from the cell cycle analysis of A549 and MDA-MB-231 cells exposed to the THIQ-based analogs. No statistical significance was detected between cells grown in medium only and cells treated with the DMSO (vehicle control) in both cell lines. A549 and MDA-MB-231 cells exposed to actinomycin D, 2-ME, STX 2895, STX 3329, STX 3450 and STX 3451 displayed statistically significant changes in cell cycle distributions (Figure 5B). Actinomycin D-treated A549 cells and MDA-MB-231 cells displayed a significant increase in the sub-G1 phase (21.34% ± 5.93%; P = 2.27E-02 and 11.20% ± 0.04%; P = 1.55E-04, respectively). 2-ME-treated A549 cells had a significant increase in the sub-G1 (20.99% ± 0.67%; P = 5.38E-03) and G2/M phases (24.65% ± 2.27%; P = 4.83E-03), and 2-ME-treated MDA-MB-231 cells displayed a significant increase in the sub-G1 (12.84% ± 1.01%; P = 1.65E-04) and G2/M phases (33.76% ± 1.95%; P = 4.87E-02). STX 2895-treated A549 and MDA-MB-231 cells showed a statistically significant increase in the sub-G1 (32.15% ± 5.87%; P = 1.96E-03 and 11.33% ± 2.96%; P = 2.13E-02, respectively) and G2/M phases (23.72% ± 0.94%; P = 1.31E-02 and 33.16% ± 1.41%; P = 4.75E-02, respectively). STX 3329-treated A549 cells showed a statistically significant increase in the sub-G1 (27.00% ± 4.43%; P = 1.95E-03) and G2/M phases (23.50% ± 0.41%; P = 5.16E-03). STX 3329-treated MDA-MB-231 cells showed a statistically significant increase in the sub-G1 (21.76% ± 2.97%; P = 1.63E-03) and G2/M phases (41.66% ± 0.48%; P = 2.90E-02). STX 3450-treated A549 and MDA-MB-231 cells showed a statistically significant increase in the sub-G1 (14.67% ± 0.17%; P = 4.45E-03 and 15.99% ± 4.01%; P = 1.20E-02, respectively) and G2/M phases (70.64% ± 3.60%; P = 4.46E-04 and 73.37% ± 3.77%; P = 1.27E-03, respectively). STX 3451-treated A549 cells displayed a statistically significant increase in the sub-G1 (19.75% ± 0.09%; P = 6.54E-03) and G2/M phases (25.70% ± 1.64%; P = 5.41E-03). STX 3451-treated MDA-MB-231 cells showed a statistically significant increase in the sub-G1 (21.06% ± 4.07%; P = 4.48E-03) and G2/M phases (32.94% ± 1.17%; P = 4.94E-02).
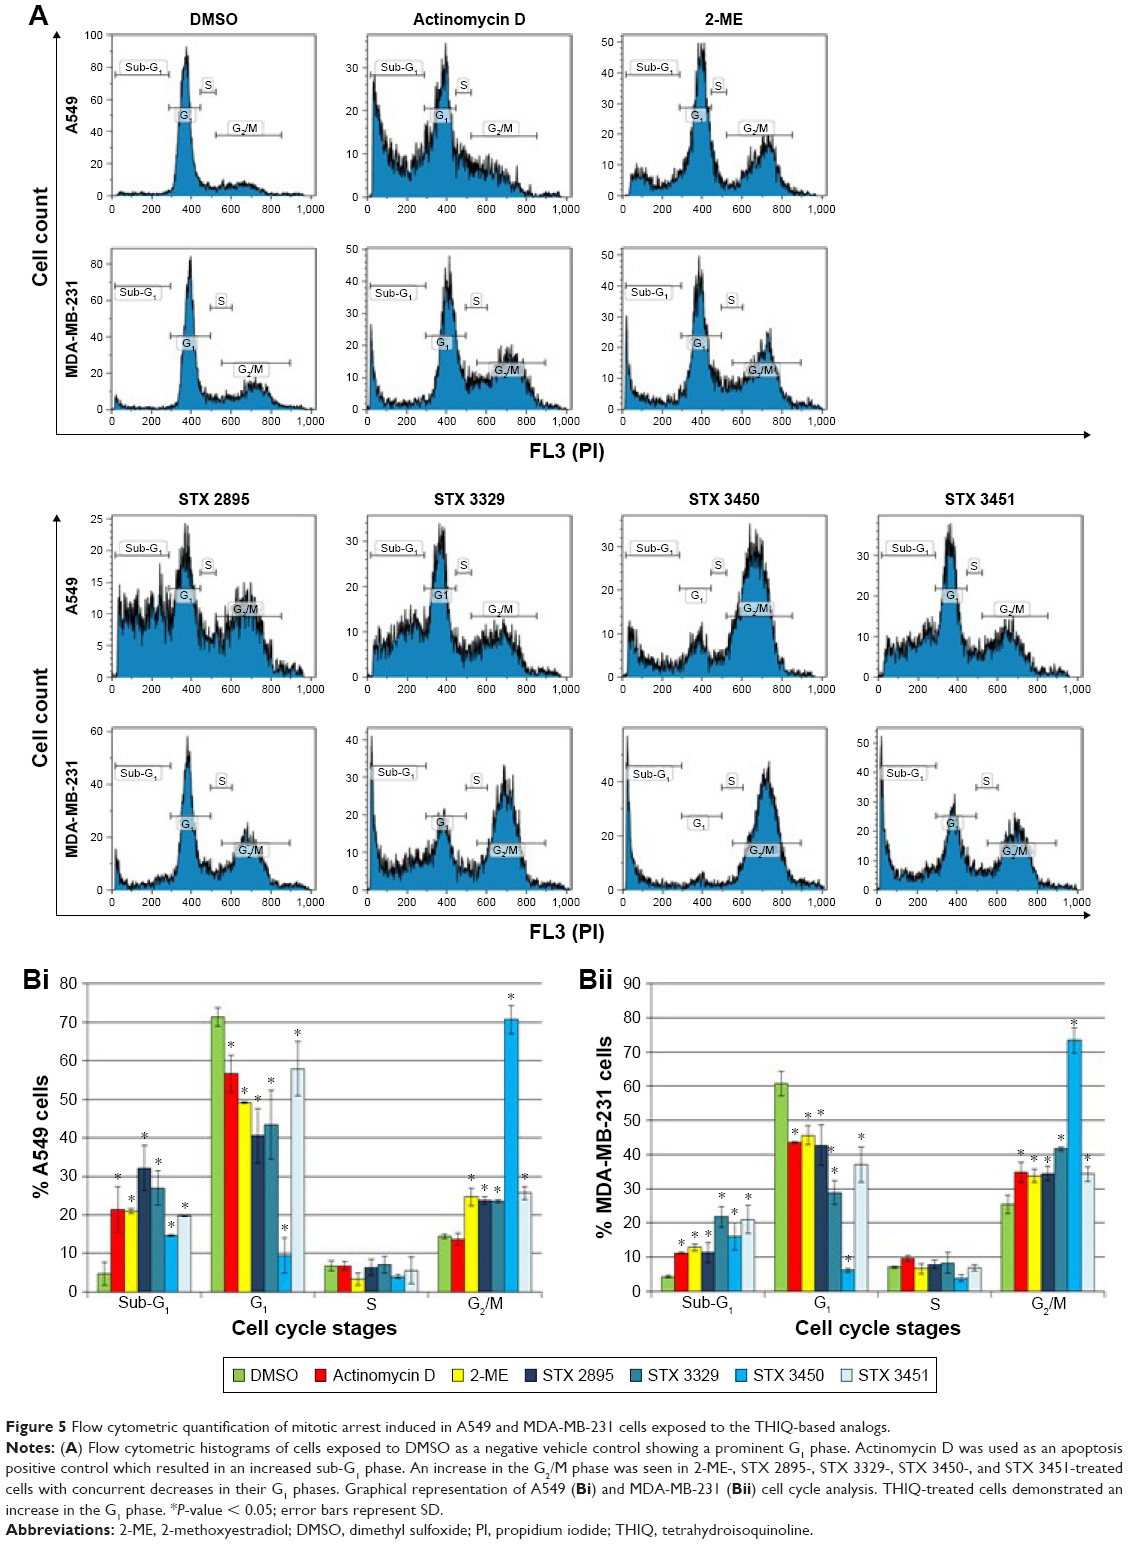 | Figure 5 Flow cytometric quantification of mitotic arrest induced in A549 and MDA-MB-231 cells exposed to the THIQ-based analogs. |
Depolarization of microtubule network detected via confocal microscopy
Immunofluorescence using the monoclonal antibody to tubulin alpha (Imgenex) was used to determine the effect of the THIQ-based analogs on microtubule integrity. A549 and MDA-MB-231 cells grown in medium only and exposed to DMSO as a vehicle control (Figure 6A[i] and [ii]) showed intact microtubule structures and confluent cell growth with most cells in interphase. The cells exposed to colchicine (positive apoptosis control; Figure 6B[i] and [ii]) showed shrunken rounded cells. A decrease in cell density as well as DNA fragmentation was also observed. A549 and MDA-MB-231 cells treated with 2-ME (Figure 6C[i] and [ii]), STX 2895 (Figure 6D[i] and [ii]), STX 3329 (Figure 6E[i] and [ii]), STX 3450 (Figure 6F[i] and [ii]) and STX 3451 (Figure 6G[i] and [ii]) showed a decrease in cell confluence, rounded cells (indicative of a G2/M phase block), DNA fragmentation and microtubule disruption. These images suggest that 2-ME and THIQ-based analogs work in a similar manner to colchicine, resulting in the depolarization of the microtubule network. This microtubule disruption may thus induce apoptotic cell death due to the resultant metaphase block.
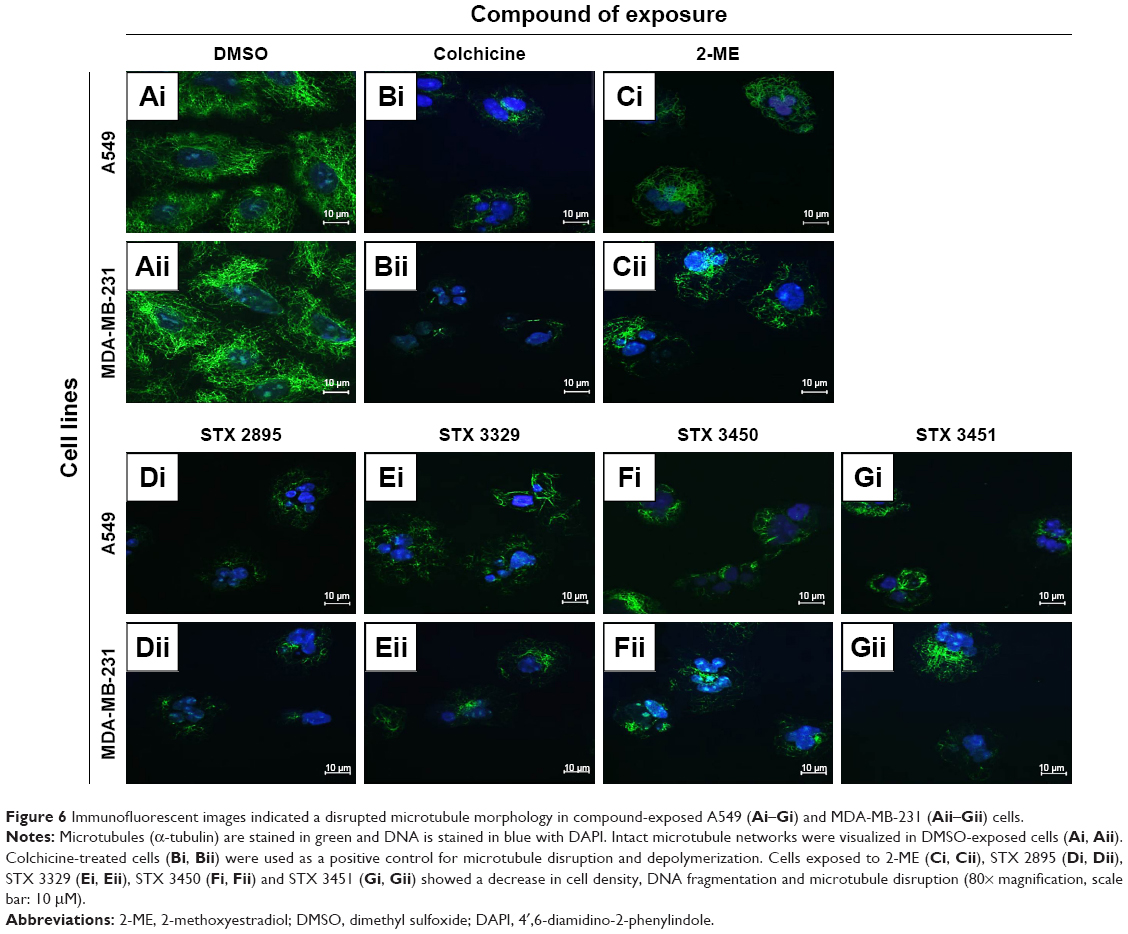 | Figure 6 Immunofluorescent images indicated a disrupted microtubule morphology in compound-exposed A549 (Ai–Gi) and MDA-MB-231 (Aii–Gii) cells. |
TEM indicates apoptosis induction as well as increased vacuole formation after THIQ exposure
TEM was used to visualize the intracellular response within 2-ME and THIQ-analog-exposed A549 and MDA-MB-231 cells. Cells exposed to DMSO (Figure 7A) showed a smooth cell membrane with an intact nuclear membrane. No morphological differences were seen between cells grown in medium only and DMSO-treated cells (not demonstrated). Actinomycin D-exposed cells showed hypercondensed chromatin as well as apoptotic body formation (Figure 7B). Tamoxifen-treated cells showed an increase in vesicle formation (Figure 7C[i]). To observe morphological changes that could indicate apoptosis and autophagy, A549 and MDA-MB-231 cells were exposed to 2-ME (Figure 7D), STX 2895 (Figure 7E), STX 3329 (Figure 7F), STX 3450 (Figure 7G) and STX 3451 (Figure 7H). 2-ME- and THIQ-exposed cells showed hypercondensed chromatin, apoptotic bodies and increased cell membrane protrusions. Increased vacuolar structures that are characteristics of autophagy were also observed when cells were exposed to 2-ME and THIQ-based analogs.
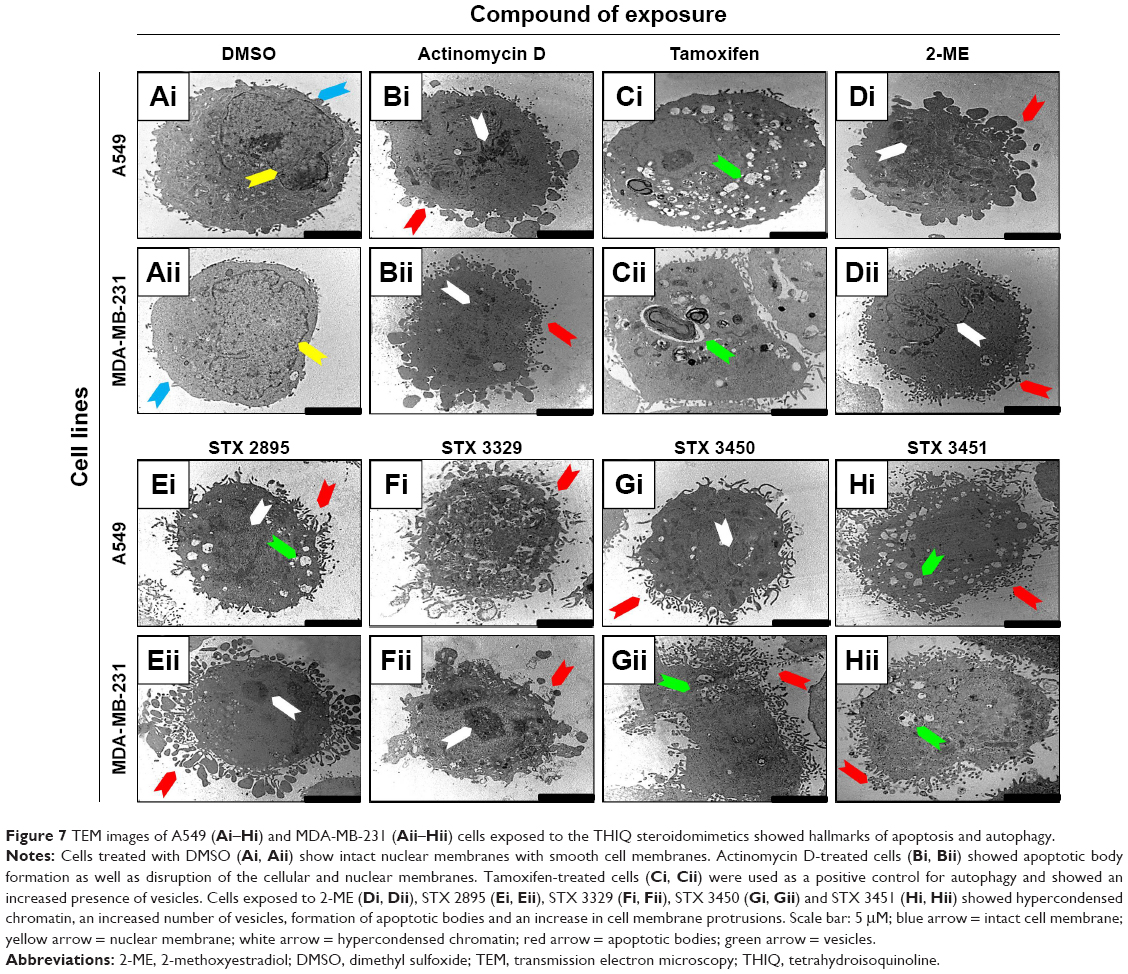 | Figure 7 TEM images of A549 (Ai–Hi) and MDA-MB-231 (Aii–Hii) cells exposed to the THIQ steroidomimetics showed hallmarks of apoptosis and autophagy. |
THIQ-based analog exposure led to increased acidic vacuole staining via MDC
MDC is a fluorophore which nonspecifically stains acidic vacuoles. MDC staining was performed on compound-exposed A549 and MDA-MB-231 cells to identify acidic vacuole formation potentially indicative of autophagy. DMSO-treated cells (Figure 8A) showed nonspecific weak MDC staining with confluent cells. Tamoxifen-treated A549 and MDA-MB-231 (Figure 8B) cells showed an increase in MDC-stained vacuoles. A549 and MDA-MB-231 cells exposed to 2-ME (Figure 8C), STX 2895 (Figure 8D), STX 3329 (Figure 8E), STX 3450 (Figure 8F) and STX 3451 (Figure 8G) demonstrated an increase in MDC-stained vacuoles as well as decreased cell density.
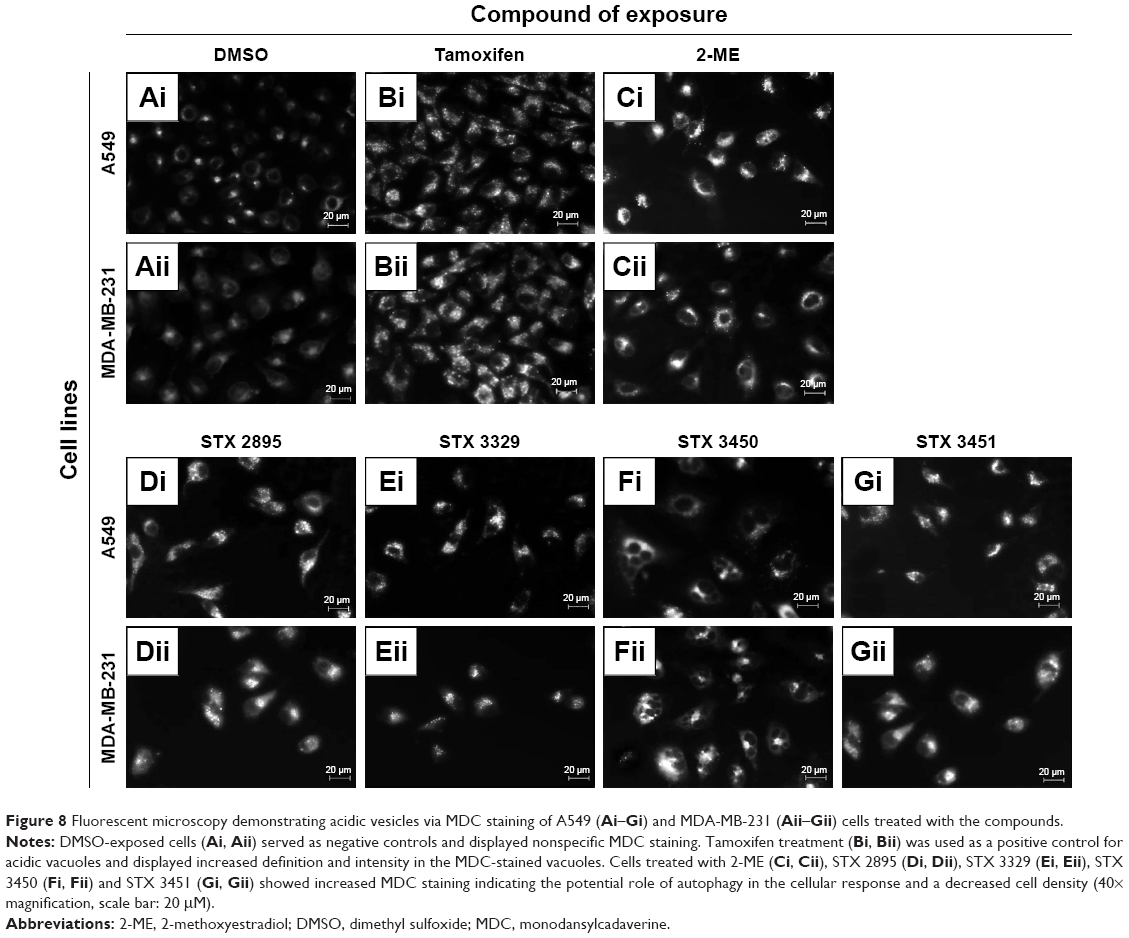 | Figure 8 Fluorescent microscopy demonstrating acidic vesicles via MDC staining of A549 (Ai–Gi) and MDA-MB-231 (Aii–Gii) cells treated with the compounds. |
AAF increased in THIQ-exposed cells
Flow cytometry employing the ProteoStat Aggresome Detection Kit was used to quantify and confirm the results of increased MDC staining in response to the THIQ analog exposure. Aggresomes with denatured protein cargo and aggresome-like inclusion bodies were detected at an excitation of 488 nm. Figure 9A illustrates overlay histograms of exposed A549 and MDA-MB-231 cells, respectively, where a right shift was observed in the tamoxifen-treated cells indicating an increase in aggresome formation. In addition, a right shift was seen in 2-ME-, STX 2895-, STX 3329-, STX 3450- and STX 3451-treated cells. The AAF was calculated as per the manufacturer’s protocol, and an AAF of >25 was taken to be indicative of autophagy induction. An AAF of >25 was found for tamoxifen, 2-ME, STX 2895, STX 3329, STX 3450 and STX 3451. Graphical representation (Figure 9B) shows a statistically significant increase in aggresomes within A549 and MDA-MB-231 cells treated with tamoxifen (74.62 ± 14.98; P = 2.96E-03 and 41.19 ± 4.93; P = 3.91E-04, respectively) when compared to the DMSO (vehicle control). A statistically significant increase in aggresomes was observed within A549 cells exposed to 2-ME (38.02 ± 7.11; P = 2.89E-03), STX 2895 (47.32 ± 0.86; P = 9.16E-06), STX 3329 (65.10 ± 0.98; P = 3.93E-06), STX 3450 (53.28 ± 15.66; P = 9.43E-03) and STX 3451 (33.45 ± 3.97; P = 8.47E-04). A statistically significant increase in aggresomes was observed within MDA-MB-231 cells exposed to 2-ME (36.62 ± 10.32; P = 6.43E-03), STX 2895 (46.21 ± 6.89; P = 6.50E-04), STX 3329 (52.18 ± 8.64; P = 3.22E-03), STX 3450 (49.62 ± 5.83; P = 2.86E-04) and STX 3451 (55.84 ± 2.50; P = 2.41E-05).
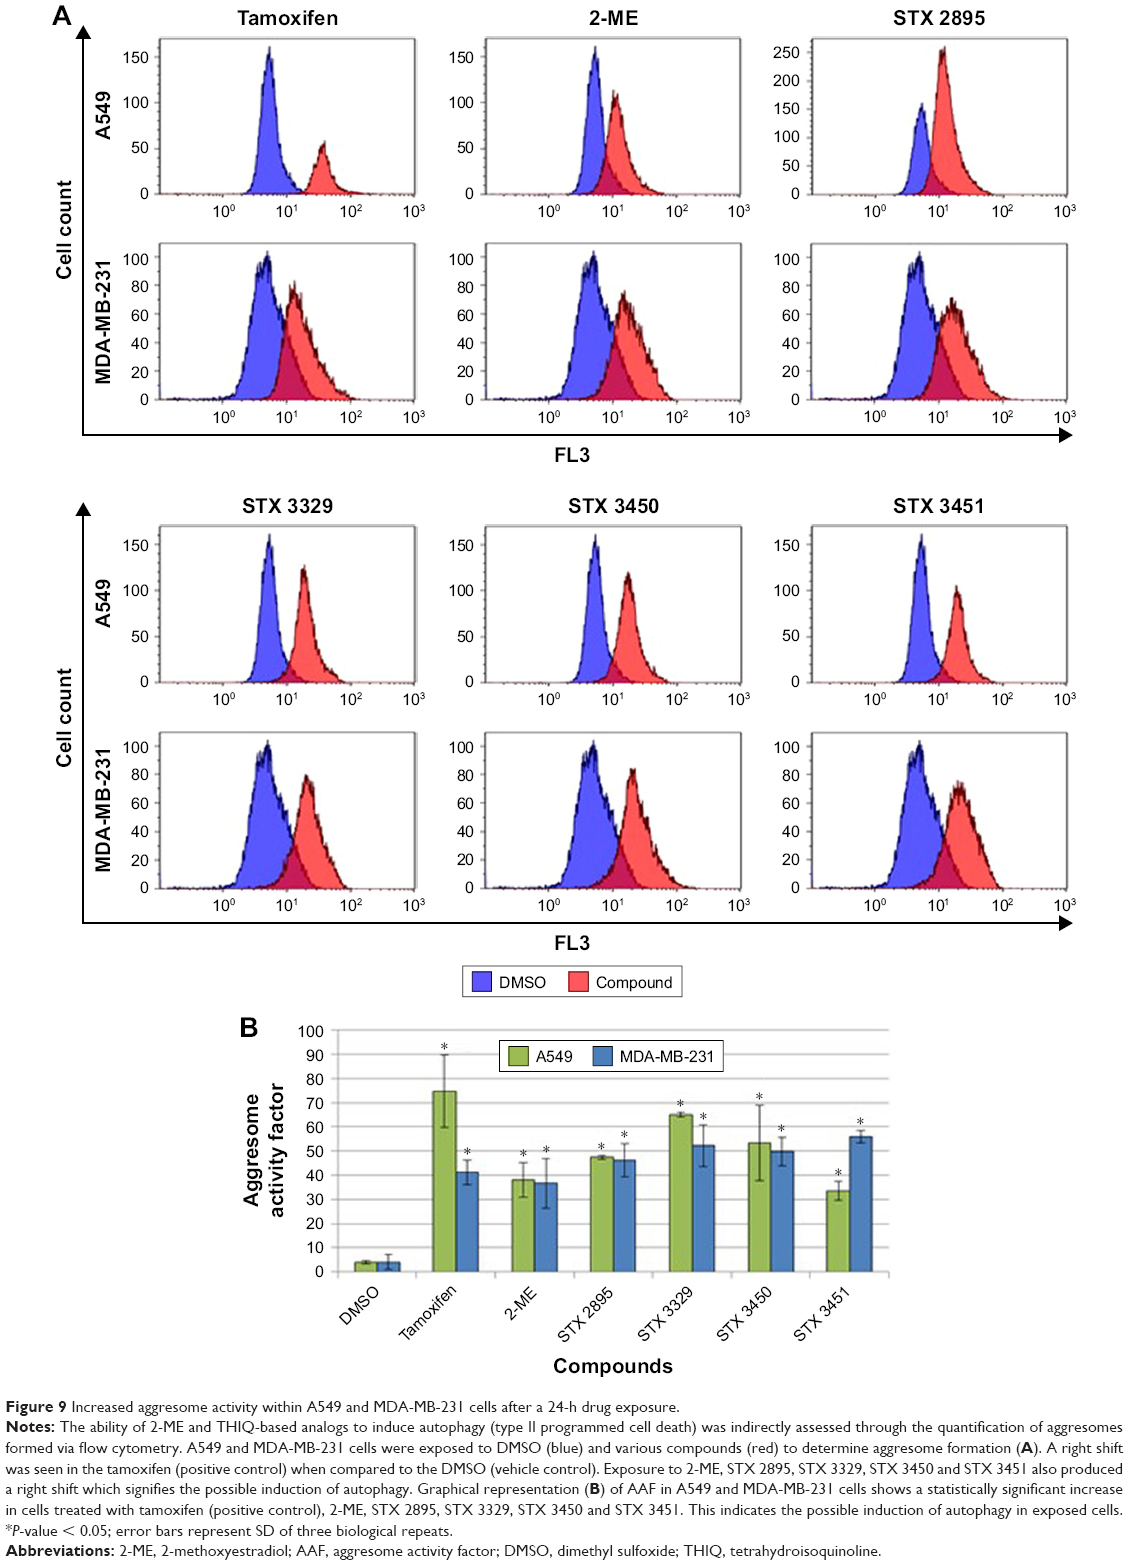 | Figure 9 Increased aggresome activity within A549 and MDA-MB-231 cells after a 24-h drug exposure. |
Loss of mitochondrial membrane potential due to THIQ analog treatment
Flow cytometry was used to quantify mitochondrial transmembrane potential within exposed cells with the MitoCapture mitochondrial apoptosis detection kit. MitoCapture dye accumulated in the mitochondria of viable cells and was released into the cytoplasm in response to apoptotic cell death signaling. Figure 10A illustrates overlay histograms of exposed A549 and MDA-MB-231 cells. A right shift was seen in the overlay histograms for colchicine-treated cells, as well as of 2-ME-, STX 2895-, STX 3329-, STX 3450- and STX 3451-treated cells, indicating loss of mitochondrial membrane integrity. Graphical representation of data capture from the mitochondrial membrane x-mean fluorescence (Figure 10B) showed a statistically significant fold increase within A549 and MDA-MB-231 cells treated with colchicine (2.24 ± 0.46; P = 0.03 and 1.62 ± 0.35; P = 0.01, respectively) when compared to the DMSO (vehicle control). A statistically significant fold increase was observed within A549 cells exposed to 2-ME (1.22 ± 0.07; P = 1.82E-03), STX 2895 (1.22 ± 0.03; P = 4.95E-05), STX 3329 (1.17 ± 0.07; P = 5.71E-03), STX 3450 (1.36 ± 0.08; P = 2.90E-04) and STX 3451 (1.36 ± 0.16; P = 7.22E-03). A statistically significant fold increase was observed within MDA-MB-231 cells exposed to 2-ME (1.21 ± 0.09; P = 7.91E-03), STX 2895 (1.58 ± 0.48; P = 4.83E-02), STX 3329 (1.27 ± 0.12; P = 6.75E-03), STX 3450 (1.41 ± 0.07; P = 1.12E-04) and STX 3451 (1.27 ± 0.07; P = 1.19E-03).
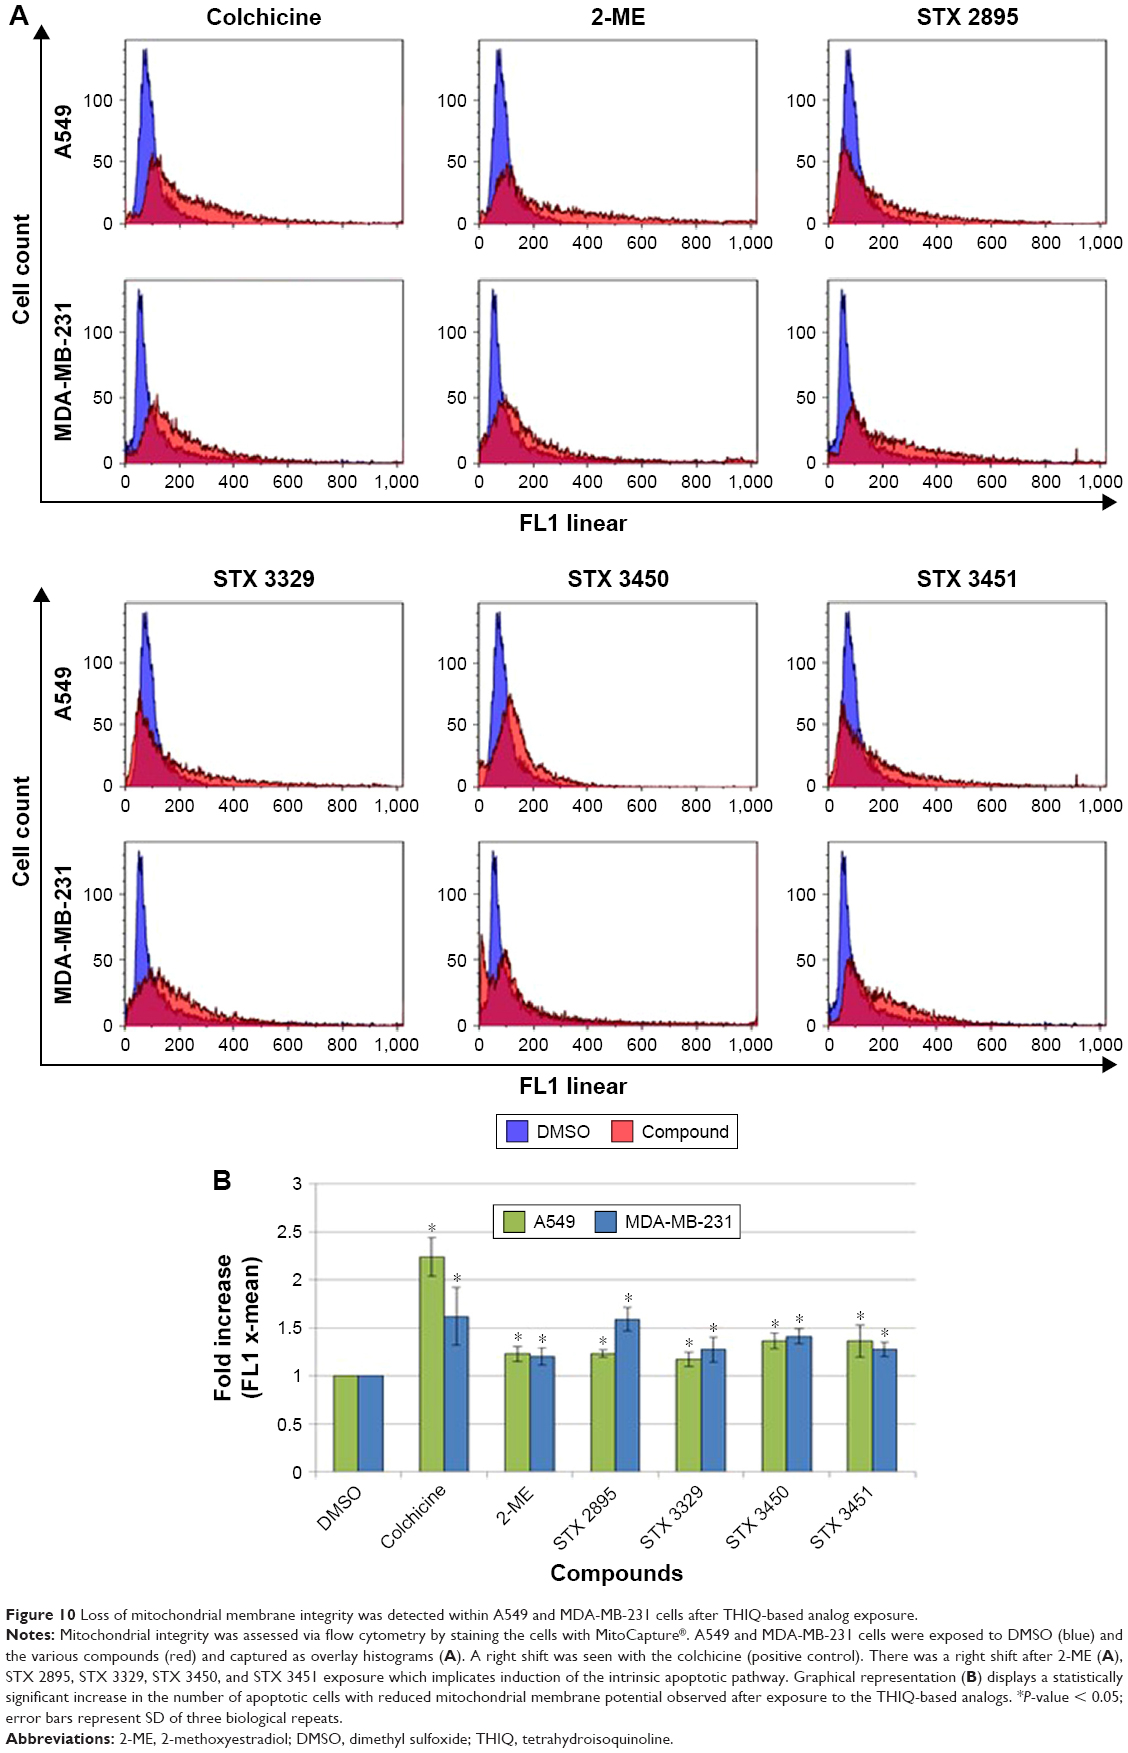 | Figure 10 Loss of mitochondrial membrane integrity was detected within A549 and MDA-MB-231 cells after THIQ-based analog exposure. |
Cytochrome c release from mitochondria indicates the induction of the intrinsic apoptotic pathway
Flow cytometry employing the FlowCellect Cytochrome c Kit was used to quantify the induction of intrinsic apoptotic pathway through the release of cytochrome c from the mitochondria. The induction of the intrinsic apoptotic pathway led to the loss of mitochondrial membrane integrity which was followed by the release of cytochrome c into the cytosol. Figure 11A shows overlay histograms of drug-exposed A549 and MDA-MB-231 cells. A left shift was seen in the overlay histogram for colchicine-treated cells indicating a decrease in cytochrome c x-mean fluorescence when compared to DMSO. A left shift was seen in 2-ME-, STX 2895-, STX 3329-, STX 3450- and STX 3451-treated cells, indicating the release of cytochrome c from the mitochondria. Graphical representations of the fold change in cytochrome c (Figure 11B) showed a statistically significant fold decrease in the cytochrome c x-mean fluorescence within A549 and MDA-MB-231 cells treated with colchicine (0.51 ± 0.082; P = 5.51E-04 and 0.59 ± 0.067; P = 4.64E-04, respectively). A statistically significant fold decrease was observed within A549 cells exposed to 2-ME (0.36 ± 0.04; P = 8.10E-05), STX 2895 (0.5 ± 0.06; P = 1.63E-04), STX 3329 (0.47 ± 0.06; P = 5.06E-04), STX 3450 (0.46 ± 0.04; P = 1.57E-04) and STX 3451 (0.46 ± 0.03; P = 5.52E-04). MDA-MB-231 cells revealed a statistically significant fold decrease within cells exposed to 2-ME (0.49 ± 0.14; P = 7.29E-03), STX 2895 (0.7 ± 0.1; P = 1.0E-02), STX 3329 (0.75 ± 0.006; P = 6.93E-06), STX 3450 (0.61 ± 0.1; P = 3.35E-03) and STX 3451 (0.57 ± 0.03; P = 4.96E-05).
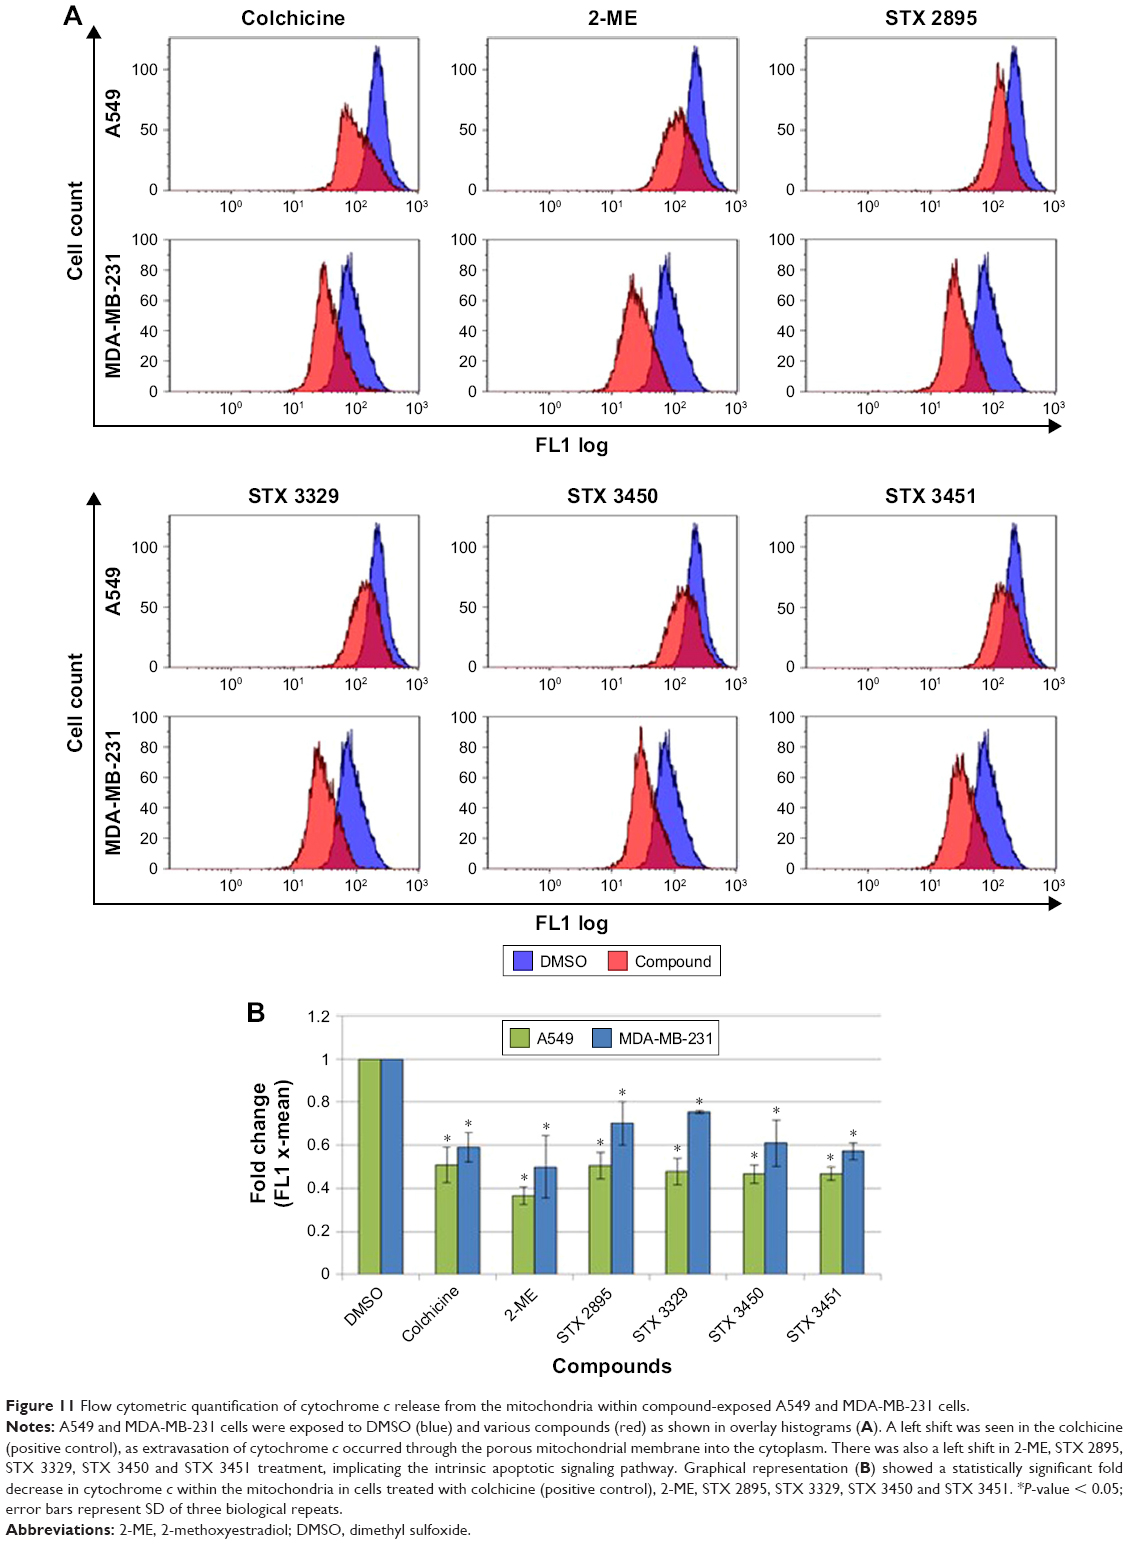 | Figure 11 Flow cytometric quantification of cytochrome c release from the mitochondria within compound-exposed A549 and MDA-MB-231 cells. |
LC3I conversion to LC3II in cells treated with the four compounds
To determine whether exposure to the compounds induced autophagy, Western blot analysis was performed employing microtubule-associated protein 1A/1B LC3. Western blots were used to quantify LC3I, LC3II and total LC3 expression after exposure to the THIQ-based analogs (Figure 12). Protein quantification revealed a statistically significant fold increase in LC3I, LC3II and total LC3 expression when A549 cells were exposed to tamoxifen (as the positive control; 1.62 ± 0.19; P = 0.005 and 3.43 ± 0.29; P = 0.0005 and 2.52 ± 0.28; P = 0.002, respectively), as did the MDA-MB-231 cells (1.61 ± 0.33; P = 0.03 and 2.9 ± 0.62; P = 0.006 and 2.25 ± 0.15; P = 0.0001). No statistically significant increase in LC3I was found for both A549 and MDA-MB-231 cells after exposure to the particular doses of 2-ME (1.19 ± 0.48; P = 0.52 and 1.26 ± 0.70; P = 0.54), STX 2895 (1.25 ± 0.30; P = 0.23 and 0.77 ± 0.15; P = 0.07), STX 3329 (1.39 ± 0.54; P = 0.27 and 0.97 ± 0.22; P = 0.82), STX 3450 (1.08 ± 0.24; P = 0.60 and 0.95 ± 0.21; P = 0.72) and STX 3451 (1.11 ± 0.25; P = 0.47 and 1.07 ± 0.10; P = 0.28). A significant fold increase in LC3II and total LC3 was observed in A549 cells after treatment with 2-ME (1.56 ± 0.22; P = 0.01 and 1.5 ± 0.27; P = 0.04), STX 2895 (2.55 ± 0.63; P = 0.01 and 1.87 ± 0.52; P = 0.05), STX 3329 (2.07 ± 0.45; P = 0.02 and 1.77 ± 0.59; P = 0.09), STX 3450 (1.43 ± 0.45; P = 0.17 and 1.25 ± 0.13; P = 0.02) and STX 3451 (1.45 ± 0.42; P = 0.13 and 1.28 ± 0.10; P = 0.009). An upward trend was observed in LC3II and total LC3 expression in MDA-MB-231 cells after treatment with 2-ME (1.35 ± 0.77; P = 0.45 and 1.47 ± 0.67; P = 0.27), STX 2895 (1.32 ± 0.58; P = 0.39 and 1.21 ± 0.30; P = 0.28), STX 3329 (1.26 ± 0.73; P = 0.56 and 1.3 ± 0.49; P = 0.33), STX 3450 (1.22 ± 0.24; P = 0.18 and 1.15 ± 0.06; P = 0.02) and STX 3451 (1.49 ± 0.42; P = 0.11 and 1.28 ± 0.17; P = 0.5) although mostly without statistical significance at these doses and exposure times.
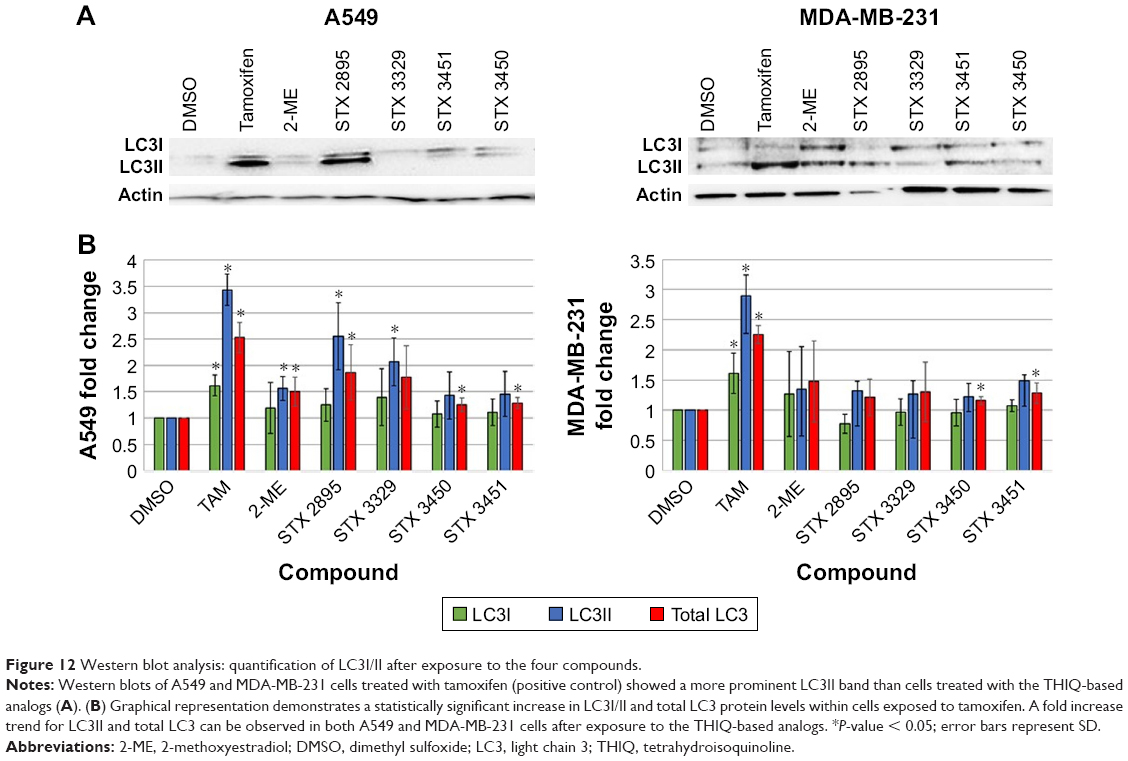 | Figure 12 Western blot analysis: quantification of LC3I/II after exposure to the four compounds. |
Discussion
Derivatives of 2-ME such as STX 3451 and STX 2895 are nonsteroidal chimeric microtubule disruptors which bind to the colchicine binding site leading to microtubule disruption by inhibiting tubulin assembly, which contributes to the compounds’ anti-proliferative effects.21,24 Shen et al21 demonstrated that both STX 3451 and STX 2895 reduced cell viability in ST88 human malignant peripheral nerve sheath tumor cells (MPNST) and induced cell death at a 10-fold lower concentration than 2-ME. Furthermore, STX 3451 treatment not only caused microtubule disruption but also affected the actin-based cytoskeleton through disruption of the long microfilaments and reorganization of actin molecules through depolymerization. STX 3451 exposure increased the activation of caspase-3 in ST88 cells which indicated the induction of the apoptotic cell death pathway.21 In addition, STX 3451 affected the phosphorylation of PI3K and mTOR pathways through inhibiting Akt phosphorylation, a pathway implicated in the induction of apoptosis as well as in the regulation of autophagy.21
Leese et al17 conducted in vitro studies on the anti-proliferative effects of various THIQ derivatives and their growth inhibition effects on DU-145 human prostate cancer cells and MDA-MB-231 human breast cancer cells. The addition of a 3′,4′,5′-trimethoxy group on the D ring conferred optimal anti-proliferative activity, giving GI50 values of 0.297 and 0.329 μM in DU-145 and MDA-MB-231 cells, respectively. Furthermore, replacement of the C7 methoxy group with an ethyl group led to a 10-fold increase in anti-proliferative activity.23,24 STX 3329 decreased cell viability at GI50 values of 50 nM in DU-145 cells and 40 nM in MDA-MB-231 cells. STX 3451 showed a mean activity of 44 nM in the US National Cancer Institute (NCI)-60 cell line panel.24
In this study, cytotoxic assays using spectrophotometric quantification of crystal violet staining were conducted over a 24 h period on MDA-MB-231 breast adenocarcinoma cells and A549 lung epithelial cancer cells. GI50 values were determined for the non-sulfamoylated compounds such as 2-ME and STX 3450 and compared to the sulfamoylated compounds such as STX 2895, STX 3329 and STX 3451. This was performed to explore the effect that sulfamoylation has on the cytotoxicity of THIQ-based analogs. A GI50 of 1.5 μM was determined for 2-ME which was consistent with previously published literature. STX 2895, STX 3329, STX 3450 and STX 3451 decreased cell viability in a dose-dependent manner over 24 h. Cell proliferation was decreased by 50% at nanomolar concentrations of the THIQ compounds in both A549 and MDA-MB-231 cell lines. THIQ-based analogs containing a sulfamoylated group (STX 2895, STX 3329 and STX 3451) yielded a 16-fold increase in cytotoxicity when compared to the analog without the sulfamate group (STX 3450). The activity of the THIQ-based analogs such as STX 2895, STX 3329 and STX 3451 is approximately 30-fold more toxic to the neoplastic cell lines than the parent compound 2-ME.
The cytotoxic effect of the THIQ-based analogs did not result in a statistically significant increase in LDH production. Furthermore, these findings were supported through flow cytometric quantification of PI and annexin V which showed no statistically significant increase in the induction of necrosis. These investigations reflected that A549 and MDA-MB-231 cells did not rupture (as evident in necrotic cell death) after exposure to the THIQ-based analogs. These findings were aligned to previous studies in which no increase in LDH levels was observed in HeLa, MDA-MB-231, SNO and MCF-12A cells after 2-MEbisMATE treatment.25,31
2-ME and its derivative 2-MeE2bisMATE are known mitotic spindle disrupters causing microtubule depolymerization at high concentrations of the drugs. A study conducted by Visagie et al25 demonstrated that 2-MeE2bisMATE treatment in MDA-MB-231 cells led to tubulin depolymerization which was further confirmed through double immunofluorescent microscopy visualization. Furthermore, Dohle et al24 conducted tubulin-based assays and demonstrated that 3′-bromo-4′,5′-dimethoxybenzyl THIQ-based analogs inhibited in vitro tubulin polymerization at 2.4 μM and inhibited colchicine binding to tubulin by 50% at 5 μM. STX 3451 has a disruptive effect on both the actin and tubulin cytoskeleton leading to the rounding of cells, fragmentation of chromatin and multilobed nucleoli and actin filament disruption.21,32 During this in vitro study, A549 and MDA-MB-231 cells were exposed to the determined GI50 values of 2-ME, STX 2895, STX 3329, STX 3451 and STX 3450 for 24 h and thereafter stained with anti-tubulin antibodies. Fluorescent microscopy indicated that the compounds resulted in microtubule abrogation and DNA fragmentation. Furthermore, a decreased cell density was observed together with the presence of rounded and shrunken cells. These observed morphological characteristics confirmed that the nonsteroidal THIQ-based analogs acted as spindle poisons with the ability to cause microtubule depolymerization with a consequent metaphase block and the resultant induction of apoptosis.
Previous studies in our laboratory have shown that exposure to 1 μM 2-ME, the parent compound of 2-MeE2bisMATE, induced a mitotic block in MCF-7 cells.11 Lee et al33 concluded that 10 μM 2-ME induced an irreversible G2/M block in HONE-1 nasopharyngeal carcinoma cells, which correlated with increased levels of inactive p-cdc25C. MDA-MB-231 xenograft mice treated with 2-ME (40 mg/kg), 2-MeE2bisMATE (20 mg/kg) and STX 243 (40 mg/kg) for 21 days induced a cell cycle arrest.34 These results corroborated the results of a previous in vitro study on MDA-MB-231 cells, where 0.5 μM 2-MeE2bisMATE (72 h) resulted in a decreased G1 phase with an increased G2/M phase in MDA-MB-231 cells.34 2-ME treatment (3 μM) of LNCaP and DU-145 prostate cancer cells indicated a twofold increase in the G2/M phase accompanied by increased expression of p21 and p34 cdc2 and accumulation of phosphorylated cdc2.35 In an independent study on urothelial carcinoma cells, 2-ME treatment (2 μM) indicated similar results, reporting a G2/M phase block, upregulation of phosphorylated cdc2 and reduced cyclin D1 levels.8 Activation of cdc2 plays a critical role in the G2/M phase transition; thus, the inhibition of cdc2 by phosphorylation leads to mitotic arrest.9
To further investigate the effects of THIQ-based analogs on the breast and lung cancer cell lines, light microscopy and flow cytometry were employed. PlasDIC images of A549 and MDA-MB-231 cells treated with these nonsteroidal microtubule disrupters showed rounded cells indicative of a mitotic arrest together with morphological hallmarks of apoptosis. Flow cytometric analysis of the cell cycle progression showed a statistically significant increase in mitotic arrest after A549 and MDA-MB-231 cells were treated with STX 2895, STX 3329, STX 3450 and STX 3451. A concurrent decrease in the G1 phase was also observed in the THIQ-treated cells.
PlasDIC micrographs of the THIQ-analog-exposed cells showed the presence of apoptotic bodies, decreased cell density and shrunken cells. When compared to actinomycin D-exposed cells (positive control), these images demonstrated similar characteristic hallmarks of apoptosis. TEM was employed to observe the intracellular ultrastructure of THIQ-analog-exposed A549 and MDA-MB-231 cells. TEM images revealed membrane blebbing, hypercondensed chromatin and apoptotic body formation in treated cells. Quantification of the translocation of PS to the outer membrane of the cell during apoptosis was also performed by quantifying annexin V via flow cytometry. THIQ-exposed cells showed an increase in apoptosis with a decrease in cell viability in both A549 and MDA-MB-231 cells. Furthermore, these results confirmed the cell cycle findings which demonstrated a statistically significant increase in the sub-G1 phase when cells were treated with 2-ME, STX 2895, STX 3329, STX 3450 and STX 3451. Results confirmed that THIQ-based analogs induced apoptotic cell death after a 24 h exposure period, implicating spindle disruption as at least one of the targets.
To elucidate the intracellular signaling involved in apoptosis induction in A549 and MDA-MB-231 cells exposed to THIQ-based analogs, flow cytometric quantification of MitoCapture™ was carried out. A statistically significant increase in the number of cells with a decreased mitochondrial membrane potential was demonstrated. Furthermore, the induction of the intrinsic apoptotic pathway was corroborated through the mitochondrial release of cytochrome c after a 24 h THIQ analog exposure. These findings indicate the involvement of the mitochondria and thus the intrinsic apoptotic pathway.
The results obtained are similar to light and transmission microscopy techniques used to demonstrate the influence of 1 μM 2-ME on MCF-7 cells.10,11 A 24 h exposure to 2-ME induced a significant increase in apoptotic human melanoma cells.36 Stander et al11 demonstrated an increased hydrogen peroxide and cytochrome c release after 1 μM 2-ME treatment of MCF-7 cells. 2-ME-mediated mitochondrial apoptotic pathway activation is mediated by reactive oxygen species (ROS) in acute myeloid leukemia cells.37 Furthermore, Foster et al38 indicated that 1 μM 2-MeE2bisMATE caused loss of mitochondrial membrane potential followed by increased caspase-3 and caspase-7 activation in ovarian carcinoma (A2780), LNCaP and MCF-7 cells.
2-ME has the ability to induce both apoptotic cell death and autophagy in Ewing sarcoma cells, transformed human embryonic kidney cells (HEK293), HeLa cells and SNO cells.39,40 Yang et al41 indicated that 10 μM 2-ME induced autophagosome formation and upregulation of autophagy markers (LC3II and ATG7) and increased protein degradation in osteosarcoma cells (MG63) after 48 h. Furthermore, their findings showed that RNA-dependent protein kinase R is essential for 2-ME-mediated autophagy. However, as a double-edged sword, autophagy can promote either cancer cell survival or induce programmed cell death type II. A study by Reumann et al42 showed that autophagy inhibition by 3-methyladenine (3MA) increased 2-ME-induced cell death via apoptosis in SW1353 chondrosarcoma cells. Conversely, Bonet-Ponce et al43 demonstrated that 3MA reduced cell mortality in retinal pigment epithelial cells (ARPE-19) exposed to 2-ME, indicating that the mechanisms of autophagy are cell line and drug dependent. Experiments conducted by Visagie and Joubert44 and Mqoco and Joubert45 indicated that 2-MeE2bisMATE treatment induced autophagy in both MCF-7 and SNO cells. Thus, the hypothesis was formulated that 2-ME and its derivatives have the ability to influence autophagic processes.
Fluorescent microscopy employing MDC staining was used to assess autophagic processes in this study. These results should be interpreted with caution however, as this dye is not specific for autophagic vacuoles. Rather, it detects acidic vacuoles that could be indicative of autophagy. A549 and MDA-MB-231 cells treated with THIQ-based analogs for a 24 h period showed increased MDC staining. TEM images corroborated these deductions on the effects of STX 2895, STX 3329, STX 3450 and STX 3451 on autophagy induction. Cells exposed to THIQ-based analogs showed similar results to the tamoxifen-exposed cells used as a positive control for autophagy. Images revealed the presence of an increased number of vacuoles, indicative of autophagosomes. Flow cytometry studies were employed to quantify the AAFs, thereby strengthening the concept that autophagy may be involved as seen in the qualitative microscopic experiments. Cells treated with THIQ-based analogs showed a significant increase in aggresome formation when compared to the DMSO (vehicle control). Furthermore, LC3 may be used as a protein marker for autophagic processes with autophagosome formation often quantified via LC3II turnover as detected by Western blotting. An increase in LC3II and total LC3 can be observed as a trend in both A549 and MDA-MB-231 cells after exposure to the THIQ-based analogs. Western blots of A549 and MDA-MB-231 cells treated with the (positive control) tamoxifen showed a statistically significant increase in LC3I/II and total LC3 protein levels within cells. Confirmatory experiments, including gene expression assays, are envisioned for future studies to corroborate the data and to fully elucidate the role of THIQ-analog-induced autophagy.
The detection of both apoptosis and autophagy in cells exposed to THIQ-based analogs suggests that there is a potential cross talk between the two types of cell death. Intricate interrelationships between apoptosis, autophagy and necrosis exist despite their distinct morphological changes and signal transduction pathways. Autophagy and apoptosis are interconnected and share common stimuli for the execution of both pathways. Numerous proteins have dual roles in apoptosis, autophagy and necrosis and could facilitate the cross talk between apoptosis and autophagy. Caspase-8 leads to the activation of the extrinsic apoptotic pathway and inactivates receptor-interacting protein 1 (RIP1) leading to necrosis inhibition.46–48 Activation of caspase-independent cell death such as programmed necrosis and autophagy is regulated by RIP1.49–51 Beclin-1 is an autophagy activator which is regulated by the anti-apoptotic protein Bcl-2.52 Bcl-2 inhibits apoptosis through Bax binding and also inhibits autophagy through beclin-1 binding.53 In addition, beclin-1 is phosphorylated by death-associated protein kinase (DAPK) which also activates the death-inducing signaling complex (DISC) during apoptosis.54 Furthermore, when caspases are inactivated, programmed necrosis that is a caspase-independent cell death is activated as a backup mechanism for failed apoptosis.48 In addition, Wong et al55 reported the induction of noncanonical autophagy and apoptosis by increased ROS formation in various types of cancer cells.
Future investigative techniques would need to differentiate between quantification of the number of autophagic vacuoles (as in this experimental design) and the measurement of autophagic flux which follows autophagy pathways from initiation to completion.56 As the THIQ-based analogs disrupt microtubule and actin dynamics, which are essential for the trafficking of autophagosomes to the lysosomes and degradation therein after fusion, it is conceivable that the observed increase in vacuoles may just represent an accumulation due to a decreased turnover.57 This, however, is contradicted in the reported decrease in mTOR/Akt phosphorylation in a previous publication.21 Thus, the increase in autophagic vacuoles may have a twofold origin, namely increased formation and decreased trafficking. Autophagic protein degradation assays could add value to the current hypothesis together with DNA expression and protein microarrays.58,59
Conclusion
THIQ-based analogs were synthesized by incorporating the essential pharmacophore elements of two steroidal microtubule disrupters, namely 2-ME and 2-MebisMATE (STX 140), into a nonsteroidal THIQ core. This in vitro study revealed that a representative set of these THIQ-based analogs, including the chimeric STX 2895, exert anti-proliferative and antimitotic effects culminating in the induction of apoptosis in both MDA-MB-231 and A549 cell lines at nanomolar concentrations. The study further not only underlines the added potency afforded by sulfamoylation of this class of compound, as shown by the considerably weaker activity of the phenol STX 3450 relative to STX 3451, but also illustrates that such non-sulfamoylated THIQs per se can still mimic the parent steroidal 2-ME and have improved potency. Evidence of the ability of the compounds to deregulate microtubule dynamics through binding to the colchicine binding site was demonstrated through confocal microscopy. Light microscopy and flow cytometric analysis of the cell cycle demonstrated the antimitotic effect of the compounds, quantifying a clear G2/M block followed by the induction of apoptotic cell death. In addition, flow cytometry displayed an elevated sub-G1 population as well as an increased PS flip, indicative of apoptosis. The loss of mitochondrial transmembrane potential as well as the release of cytochrome c from the mitochondria implicated the intrinsic apoptotic signaling pathway. Vacuole formation was demonstrated with fluorescent and transmission microscopy, indicating the possible involvement of autophagic processes, a finding corroborated by the increased AAF in treated cells as well as LC3 protein determination. Further elucidation of the precise role of autophagy in cell death induction in response to the compounds as well as its role in possible tumor resistance will be carried out in future studies. These compounds revealed excellent anticancer pharmaceutical properties and are attractive for further clinical development. In vivo investigations into the efficacy and pharmacokinetics of these anticancer drugs are envisaged.
Acknowledgments
Prof AMJ, Prof BVLP, Dr WD and Dr AET for general support. This study was supported by grants from the Medical Research Council of South Africa, the Cancer Association of South Africa, National Research Foundation and the Struwig-Germeshuysen Cancer Research Trust of South Africa. BVLP is a Wellcome Trust Senior Investigator (grant 101010). The abstract of this paper was presented at the 24 Biennial Congress of the European Association for Cancer Research, July 9–12, 2016, Manchester, UK, and was published in the European Journal of Cancer.
Author contributions
All authors made substantial contributions to conception and design, acquisition of data, or analysis and interpretation of data; took part in drafting the article or revising it critically for important intellectual content; gave final approval of the version to be published; and agree to be accountable for all aspects of the work.
Disclosure
The authors report no conflicts of interest in this work.
References
American Cancer Society [webpage on the Internet]. Lung Cancer. Available from: http://www.cancer.org/cancer/lungcancer-non-smallcell/detailedguide/non-small-cell-lung-cancer-key-statistics. Accessed February 20, 2015. | ||
World Cancer Research Fund [webpage on the Internet]. Breast Cancer Statistics. Available from: http://www.wcrf.org/cancer_statistics/data_specific_cancers/breast_cancer_statistics.php. Accessed July 20, 2014. | ||
American Cancer Society [webpage on the Internet]. Breast Cancer. Available from: http://www.cancer.org/cancer/breastcancer/detailedguide/breast-cancer-key-statistics. Accessed February 22, 2015. | ||
Jordan MA, Kamath K. How do microtubule-targeted drugs work? An overview. Curr Cancer Drug Targets. 2007;7(8):730–742. | ||
Lu Y, Chen J, Xiao M, Li W, Miller DD. An overview of tubulin inhibitors that interact with the colchicine binding site. Pharm Res. 2012;29(11):2943–2971. | ||
Dumontet C, Jordan MA. Microtubule-binding agents: a dynamic field of cancer therapeutics. Nat Rev Drug Discov. 2010;9(10):790–803. | ||
Theron A, Prudent R, Nolte E, et al. Novel in silico-designed estradiol analogues are cytotoxic to a multidrug-resistant cell line at nanomolar concentrations. Cancer Chemother Pharmacol. 2014;75(2):431–437. | ||
Kuo K, Lin W, Ho IL, et al. 2-Methoxyestradiol induces mitotic arrest, apoptosis, and synergistic cytotoxicity with arsenic trioxide in human urothelial carcinoma cells. PLoS One. 2013;8(8):e68703. | ||
Mueck AO, Seeger H. 2-Methoxyestradiol – biology and mechanism of action. Steroids. 2010;75(10):625–631. | ||
Van Zijl C, Lottering M-L, Steffens F, Joubert A. In vitro effects of 2-methoxyestradiol on MCF-12A and MCF-7 cell growth, morphology and mitotic spindle formation. Cell Biochem Funct. 2008;26(5):632–642. | ||
Stander B, Marais S, Vorster C, Joubert A. In vitro effects of 2-methoxyestradiol on morphology, cell cycle progression, cell death and gene expression changes in tumorigenic MCF-7 breast epithelial cell line. J Steroid Biochem Mol Biol. 2010;119(3–5):149–160. | ||
Verenich S, Gerk PM. Therapeutic promises of 2-methoxyestradiol and its drug disposition challenges. Mol Pharm. 2010;7(6):2030–2039. | ||
Thomas MP, Potter BVL. Estrogen O-sulfamates and their analogues: clinical steroid sulfatase inhibitors with broad potential. J Steroid Biochem Mol Biol. 2015;153:160–169. | ||
Leese MP, Leblond B, Smith A, et al. 2-Substituted estradiol bis-sulfamates, multitargeted antitumor agents: synthesis, in vitro SAR, protein crystallography, and in vivo activity. J Med Chem. 2006;49(26):7683–7696. | ||
Elger W, Schwarz S, Hedden A, Reddersen G, Schneider B. Sulfamates of various estrogens are prodrugs with increased systemic and reduced hepatic estrogenicity at oral application. J Steroid Biochem Mol Biol. 1995;55:395–403. | ||
Ireson CR, Chander SK, Purohit A, et al. Pharmacokinetics and efficacy of 2-methoxyoestradiol and 2-methoxyoestradiol-bis-sulphamate in vivo in rodents. Br J Cancer. 2004;90(4):932–937. | ||
Leese M, Jourdan F, Major M, et al. Tetrahydroisoquinolinone-based steroidomimetic and chimeric microtubule disruptors. ChemMedChem. 2014;9(1):85–108. | ||
Stengel C, Newman SP, Leese MP, et al. The in vitro and in vivo activity of the microtubule disruptor STX140 is mediated by Hif-1 alpha and CAIX expression. Anticancer Res. 2015;35(10):5249–5261. | ||
Leese MP, Jourdan F, Dohle W, et al. Steroidomimetic tetrahydroisoquinolines for the design of new microtubule disruptors. ACS Med Chem Lett. 2012;3(1):5–9. | ||
Erba E, Bergamaschi D, Bassano L, et al. Ecteinascidin-743 (ET-743), a natural marine compound, with a unique mechanism of action. Eu J Cancer. 2001;37(1):97–105. | ||
Shen Y-C, Upadhyayula R, Cevallos S, et al. Targeted NF1 cancer therapeutics with multiple modes of action: small molecule hormone-like agents resembling the natural anticancer metabolite, 2-methoxyoestradiol. Br J Cancer. 2015;113(8):1158–1167. | ||
Stengel C, Newman SP, Day JM, et al. In vivo and in vitro properties of STX2484: a novel non-steroidal anti-cancer compound active in taxane-resistant breast cancer. Br J Cancer. 2014;111(2):300–308. | ||
Leese MP, Jourdan F, Kimberley MR, et al. Chimeric microtubule disruptors. Chem Com. 2010;46(17):2907–2909. | ||
Dohle W, Leese MP, Jourdan FL, et al. Optimisation of tetrahydroisoquinoline-based chimeric microtubule disruptors. ChemMedChem. 2014;9(8):1783–1793. | ||
Visagie M, Theron A, Mqoco T, et al. Sulphamoylated 2-methoxyestradial analogues induce apoptosis in adenocarcinoma cell lines. PLoS One. 2013;8(9):e71935. | ||
Schulze-Osthoff K. Cytotoxicity in cell populations. In: Rode H-J, editor. Apoptosis, Cytotoxicity and Cell Proliferation Manual. 4th ed. Mannheim: Roche GmbH Diagnostics; 2008: 92–103. | ||
Krishan A. Rapid flow cytofluorometry analysis of mammalian cell cycle by propidium iodide staining. J Cell Biol. 1975;66:188–193. | ||
Michaels S [webpage on the Internet]. Flow Cytometry and Sorting. 2015. Available from: http://www.stmichaelshospital.com/research/facilities/flow-cytometry-viability-apoptosis.php. Accessed February 27, 2015. | ||
BioVision. MitoCaptureTM Mitochondrial Apoptosis Detection Fluorometric Kit. 2015. Available from: https://www.biovision.com/documentation/datasheets/K250.pdf. Accessed February 15, 2015. | ||
Cruz M, Figueroa C, Robles T, et al. Activation of caspase-dependent apoptosis by intracellular delivery of cytochrome c-based nanoparticles. J Nanobiotechnology. 2014;12(33):1–11. | ||
Visagie M, Joubert A. The in vitro effects of 2-methoxyestradiol-bis-sulfphamate on cell number, membrane integrity and cell morphology, and the possible induction of apoptosis and autophagy in a non-tumorogenic breast epithelial cell line. Cell Mol Biol Lett. 2010;15:564–581. | ||
Dohle W, Jourdan FL, Menchon G, et al. Quinazolinone-based anticancer agents: synthesis, antiproliferative SAR, antitubulin activity, and tubulin co-crystal structure. J Med Chem. 2018;61(3):1031–1044. | ||
Lee Y, Ting C, Cheng Y, et al. Mechanisms of 2-methoxyestradiol-induced apoptosis and G2/M cell-cycle arrest of nasopharyngeal carcinoma cells. Cancer Lett. 2008;268(2):295–307. | ||
Foster PA, Ho YT, Newman SP, et al. 2-MeOE2bisMATE and 2-EtE2bisMATE induce cell cycle arrest and apoptosis in breast cancer xenografts as shown by a novel ex vivo technique. Breast Cancer Res Treat. 2008;111(2):251–260. | ||
Kumar AP, Garcia GE, Slaga TJ. 2-Methoxyestradiol blocks cell-cycle progression at G2/M phase and inhibits growth of human prostate cancer cells. Mol Carcinog. 2001;31(3):111–124. | ||
Dobos J, Tímár J, Bocsi J, et al. In vitro and in vivo antitumor effect of 2-methoxyestradiol on human melanoma. Int J Cancer. 2004;112(5):771–776. | ||
Zhe N, Chen S, Zhou Z, et al. HIF-1α inhibition by 2-methoxyestradiol induces cell death via activation of the mitochondrial apoptotic pathway in acute myeloid leukemia. Cancer Biol Ther. 2016;17(6):625–634. | ||
Foster PA, Ho YT, Newman SP, et al. STX140 and STX641 cause apoptosis via the intrinsic mitochondrial pathway and down-regulate survivin and XIAP expression in ovarian and prostate cancer cells. Anticancer Res. 2009;29(10):3751–3757. | ||
Lorin S, Borges A, Ribeiro Dos Santos L, et al. c-Jun NH-terminal kinase activation is essential for DRAM-dependent induction of autophagy and apoptosis in 2-methoxyestradiol–treated Ewing sarcoma cells. Cancer Res. 2009;69(17):6924–6931. | ||
Azad MB, Chen Y, Gibson SB. Regulation of autophagy by reactive oxygen species (ROS): implications for cancer progression and treatment. Antioxid Redox Signal. 2008;11(4):777–790. | ||
Yang C, Shogren KL, Goyal R, Bravo D, Yaszemski MJ, Maran A. RNA-dependent protein kinase Is essential for 2-methoxyestradiol-induced autophagy in osteosarcoma cells. PLoS One. 2013;8(3):e59406. | ||
Reumann S, Shogren KL, Yaszemski MJ, Maran A. Inhibition of autophagy increases 2-methoxyestradiol-induced cytotoxicity in SW1353 chondrosarcoma cells. J Cell Biochem. 2016;117(3):751–759. | ||
Bonet-Ponce L, Saez-Atienzar S, Casa C, et al. Rotenone induces the formation of 4-hydroxynonenal aggresomes. Role of ROS-mediated tubulin hyperacetylation and autophagic flux disruption. Mol Neurobiol. 2016;53(9):6194–6208. | ||
Visagie MH, Joubert AM. 2-Methoxyestradiol-bis-sulfamate induces apoptosis and autophagy in a tumorigenic breast epithelial cell line. Mol Cell Biochem. 2011;357:343–352. | ||
Mqoco T, Joubert AM. 2-Methoxyestradiol-bis-sulphamate induces apoptosis and autophagy in an oesophageal carcinoma (SNO) cell line. Biomed Res. 2012;23(4):469–474. | ||
Hou W, Han J, Lu C, Goldstein LA, Rabinowich H. Autophagic degradation of active caspase-8. Autophagy. 2010;6(7):891–900. | ||
Fulda S, Debatin K. Extrinsic versus intrinsic apoptosis pathways in anticancer chemotherapy. Oncogene. 2006;25:4791–4811. | ||
Ouyang L, Shi Z, Zhao S, et al. Programmed cell death pathways in cancer: a review of apoptosis, autophagy and programmed necrosis. Cell Prolif. 2012;45(6):487–498. | ||
Yu L, Wan F, Dutta S, et al. Autophagic programmed cell death by selective catalase degradation. Proc Natl Acad Sci U S A. 2006;103(13):4952–4957. | ||
Bonapace L, Bornhauser BC, Schmitz M, et al. Induction of autophagy-dependent necroptosis is required for childhood acute lymphoblastic leukemia cells to overcome glucocorticoid resistance. J Clin Invest. 2010;120(4):1310–1323. | ||
Zhang D, Shao J, Lin J, et al. RIP3, an energy metabolism regulator that switches TNF-induced cell death from apoptosis to necrosis. Science. 2009;325(5938):332–336. | ||
He C, Levine B. The beclin-1 interactome. Curr Opin Cell Biol. 2010;22(2):140–149. | ||
Erlich S, Mizrachy L, Segev O, et al. Differential interactions between beclin 1 and Bcl-2 family members. Autophagy. 2007;3(6):561–568. | ||
Zalckvar E, Berissi H, Mizrachy L, et al. DAP-kinase-mediated phosphorylation on the BH3 domain of beclin 1 promotes dissociation of beclin 1 from Bcl-XL and induction of autophagy. EMBO Rep. 2009;10(3):285–292. | ||
Wong CH, Iskandar KB, Yadav SK, Hirpara JL, Loh T, Pervaiz S. Simultaneous induction of non-canonical autophagy and apoptosis in cancer cells by ROS-dependent ERK and JNK activation. PLoS One. 2010;5(4):e9996. | ||
Klionsky DJ, Abdalla FC, Abeliovich H, et al. Guidelines for the use and interpretation of assays for monitoring autophagy. Autophagy. 2012;8(4):445–544. | ||
Feng Y, He D, Yao Z, Klionsky DJ. The machinery of macroautophagy. Cell Res. 2014;24(1):24–41. | ||
Klionsky DJ, Abdelmohsen K, Abe A, et al. Guidelines for the use and interpretation of assays for monitoring autophagy (3rd edition). Autophagy. 2016;12(1):1–222. | ||
Zhang J, Wang J, Ng S, Lin Q, Shen H-M. Development of a novel method for quantification of autophagic protein degradation by AHA labeling. Autophagy. 2014;10(5):901–912. |
 © 2018 The Author(s). This work is published and licensed by Dove Medical Press Limited. The
full terms of this license are available at https://www.dovepress.com/terms
and incorporate the Creative Commons Attribution
- Non Commercial (unported, 3.0) License.
By accessing the work you hereby accept the Terms. Non-commercial uses of the work are permitted
without any further permission from Dove Medical Press Limited, provided the work is properly
attributed. For permission for commercial use of this work, please see paragraphs 4.2 and 5 of our Terms.
© 2018 The Author(s). This work is published and licensed by Dove Medical Press Limited. The
full terms of this license are available at https://www.dovepress.com/terms
and incorporate the Creative Commons Attribution
- Non Commercial (unported, 3.0) License.
By accessing the work you hereby accept the Terms. Non-commercial uses of the work are permitted
without any further permission from Dove Medical Press Limited, provided the work is properly
attributed. For permission for commercial use of this work, please see paragraphs 4.2 and 5 of our Terms.