Back to Journals » International Journal of Nanomedicine » Volume 13
Modeling the neuron as a nanocommunication system to identify spatiotemporal molecular events in neurodegenerative disease
Authors Banerjee A, Paluh JL ![]() , Mukherjee A
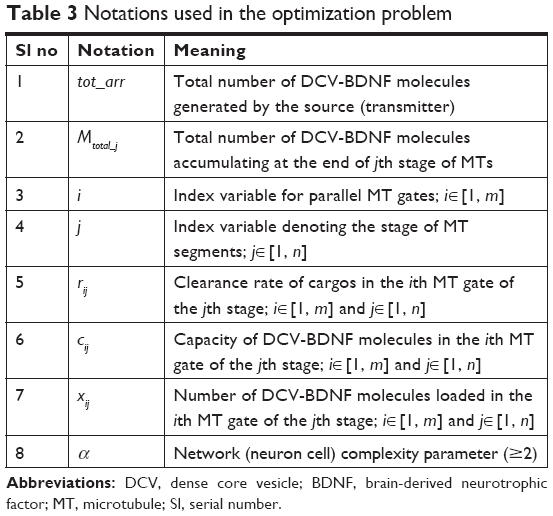
, Mukherjee A ![]() , Kumar KG
, Kumar KG ![]() , Ghosh A, Naskar MK
, Ghosh A, Naskar MK
Received 27 September 2017
Accepted for publication 1 December 2017
Published 25 May 2018 Volume 2018:13 Pages 3105—3128
DOI https://doi.org/10.2147/IJN.S152664
Checked for plagiarism Yes
Review by Single anonymous peer review
Peer reviewer comments 2
Editor who approved publication: Dr Thomas Webster
Arunima Banerjee,1 Janet L Paluh,2 Amitava Mukherjee,3 K Gaurav Kumar,1 Archisman Ghosh,1 Mrinal K Naskar1
1Department of Electronics and Tele-Communication Engineering, Jadavpur University, Kolkata, India; 2College of Nanoscale Science, Nanobioscience Constellation, State University of New York Polytechnic Institute, Albany, NY, USA; 3Globsyn Business School, Kolkata, India
Aim: In tauopathies such as Alzheimer’s disease (AD), molecular changes spanning multiple subcellular compartments of the neuron contribute to neurodegeneration and altered axonal signaling. Computational modeling of end-to-end linked events benefit mechanistic analysis and can be informative to understand disease progression and accelerate development of effective therapies. In the calcium-amyloid beta model of AD, calcium ions that are an important regulator of neuronal function undergo dysregulated homeostasis that disrupts cargo loading for neurotrophic signaling along axonal microtubules (MTs). The aim of the present study was to develop a computational model of the neuron using a layered architecture simulation that enables us to evaluate the functionalities of several interlinked components in the calcium-amyloid beta model.
Methods: The elevation of intracellular calcium levels is modeled upon binding of amyloid beta oligomers (AβOs) to calcium channels or as a result of membrane insertion of oligomeric Aβ1-42 to form pores/channels. The resulting subsequent Ca2+ disruption of dense core vesicle (DCV)-kinesin cargo loading and transport of brain-derived neurotrophic factor (BDNF) on axonal MTs are then evaluated. Our model applies published experimental data on calcium channel manipulation of DCV-BDNF and incorporates organizational complexity of the axon as bundled polar and discontinuous MTs. The interoperability simulation is based on the Institute of Electrical and Electronics Engineers standard association P1906.1 framework for nanoscale and molecular communication.
Results: Our analysis provides new spatiotemporal insights into the end-to-end signaling events linking calcium dysregulation and BDNF transport and by simulation compares the relative impact of dysregulation of calcium levels by AβO-channel interactions, oligomeric Aβ1-42 pores/channel formation, and release of calcium by internal stores. The flexible platform of our model allows continued expansion of molecular details including mechanistic and morphological parameters of axonal cytoskeleton networks as they become available to test disease and treatment predictions.
Conclusion: The present model will benefit future drug studies on calcium homeostasis and dysregulation linked to measurable neural functional outcomes. The algorithms used can also link to other multiscale multi-cellular modeling platforms to fill in molecular gaps that we believe will assist in broadening and refining multiscale computational maps of neurodegeneration.
Keywords: amyloid beta oligomers, AβO pore, calcium hypothesis Alzheimer’s disease, BDNF, kinesin, axonal transport, nanocommunication, simulation
Introduction
The most common cause of dementia, Alzheimer’s disease (AD), is an age-influenced chronic neurodegenerative progression. It is characterized across multiple scales including subcellular molecular changes in axonal transport and tauopathies that alter microtubule (MT) structure, formation of internal and external neurofibrillary plaques or tangles, and disruption of inter-neural signaling leading to gradual loss of brain cognitive function.1,2 The health care costs related to AD both for the patient and caregivers are expected to exceed one trillion dollars by 2050.3 Further, with increasing longevity it is predicted that an astounding one in three individuals reaching 90 years of age will be affected. No broadly effective treatments or cures for AD yet exist for this complex disease and an improved understanding of collective molecular events leading to discrete outcomes underlying neurodegeneration is needed. A causative agent in AD is the disruption of amyloid-β (Aβ) function that results in altered calcium influx and elevated intracellular levels of calcium, and leads to signaling dysregulation for transport of neurotrophic factors, such as the critical brain-derived neurotrophic factor (BDNF).4,5 A new IEEE reference standard and mathematical model framework for Nano, Electrical, Molecular (NEMo) communication6 provides a platform to evaluate multiple interlinked events as a molecular communication network. Communication theory has also been applied to calculate the storage capacity of discrete bounded synapses.7 Our current approach uses a physical layer framework and its stack functions in an end-to-end model that links multiple discrete nano-molecular events to a specific outcome to generate new neurodegenerative disease insights.
The “calcium hypothesis of AD” proposes that aberrant Ca2+ signaling occurs prior to accumulation of MT destabilizing events such as hyper-phosphorylation of the MT-associated protein tau (MAP-tau) and observance of cognitive decline.8 A recent study of BDNF transport defects in neurons revealed a spatiotemporal progression of fast axonal transport (FAT) impairment that correlated with Ca2+ elevation and CaN activation occurring first in dendrites and subsequently in axons consistent with this hypothesis.4 Several membrane receptors with ion channels regulate the influx of Ca2+ into cells, including NMDA (N-methyl-D-aspartate) and AMPA (α-amino-3-hydroxy-5-methyl-isoxazolepropionic acid) glutamate receptors and axonal voltage-gated Ca2+ channels (VGCCs), and are affected by amyloid beta oligomer (AβO) binding.9–11 The increased influx of Ca2+ into neurons also triggers Ca2+-induced release from internal stores, further elevating cytoplasmic levels of Ca2+ and sets into play a cascade of events with CaN, PP1, and GSK3β that ultimately impacts kinesin cargo loading and neurotrophic factor transport and contributes to synapse failure.12–14 These calcium-regulated events target FAT in axons through effects on 1) kinesin cargo binding and its transport and 2) effects on MT structure (MAP-tau hyper-phosphorylation). In this work, we model AβO-directed increase in intracellular Ca2+ levels through AβO action on multiple membrane Ca2+ ion channels (NMDA, AMPA, VGCC) and internally regulated calcium stores (ryanodine receptor; RyR) and including the downstream effect on kinesin cargo loading of BDNF-dense core vesicle (DCV) at the axon initial segment (AIS) and along the axonal MT network as shown in Figures 1 and 2.
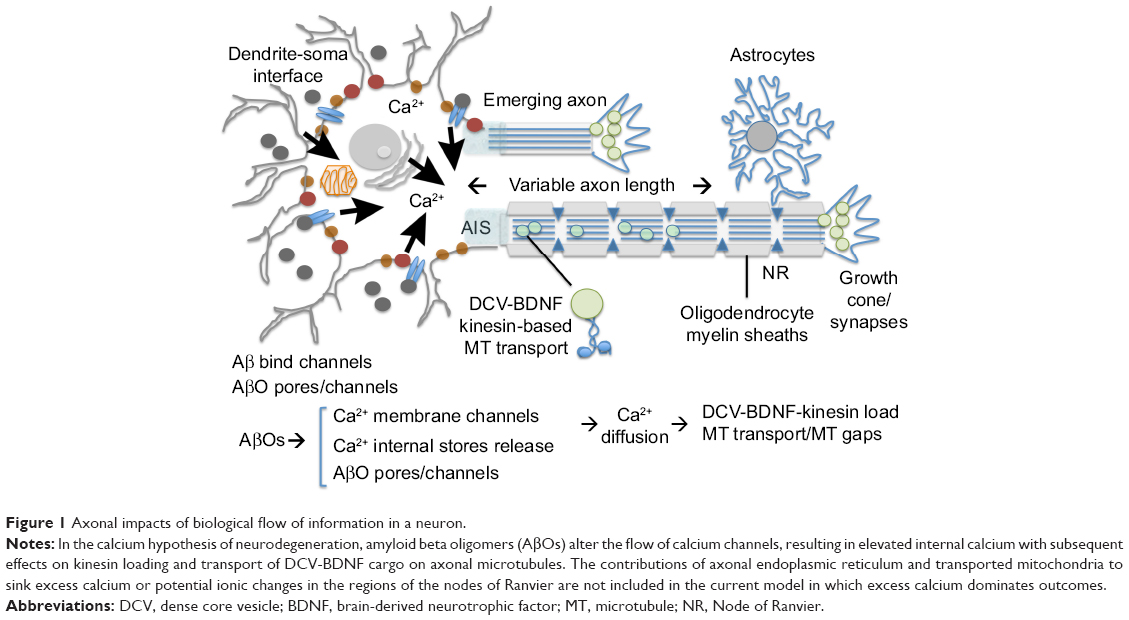 | Figure 1 Axonal impacts of biological flow of information in a neuron. |
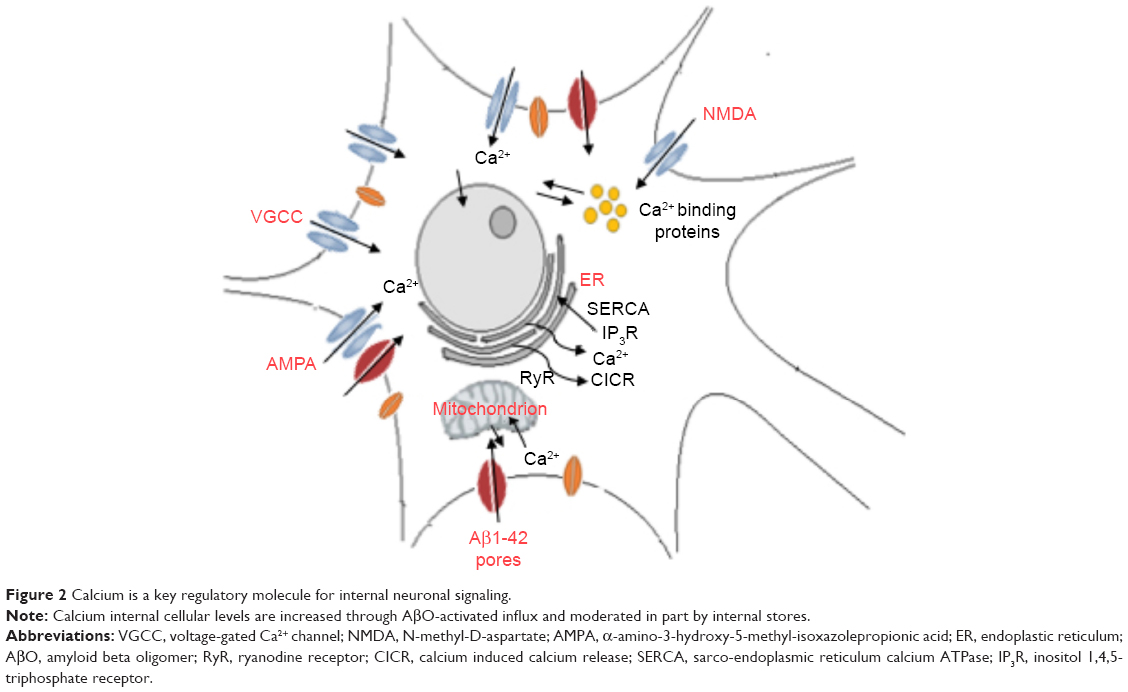 | Figure 2 Calcium is a key regulatory molecule for internal neuronal signaling. |
Two current models are proposed in which AβOs dysregulate Ca2+ entry into neurons and elevate intracellular Ca2+ levels to cause neurodegenerative disease. This includes direct interaction of AβOs with calcium ion channels in neuron membranes to increase influx15–17 as well as the ability of AβOs themselves to integrate into membranes to form small pores or larger channels of variable size and impact on nonspecific ion influx.18–20 AβO pore/channel forming ability and size parameters are influenced by oligomeric form and amino acid sequence and by additional factors such as cholesterol and a-synuclein.21,22 In this study, we additionally evaluate changes in Ca2+ levels that can occur as a result of pore/channel formation by Aβ1-42 oligomers and the effect on DCV-BDNF axonal MT loading and transport. We apply data based on studies of multivariate analysis of pore size formation in vitro17 and single-channel analysis in xenopus oocytes16 that provides permeation and gating properties without the presence of interfering endogenous channels that could interact with AβOs.
In order to provide mechanistic insights relevant to Ca2+–MT spatiotemporal events for axonal transport by kinesins, we consider molecular details of axonal MT cytoskeleton organization that consists of multiple polar MTs and MT end joining gaps created by discontinuous overlapping of MT polar plus and minus ends interacting along the length of axons.23 This better represents the complexity of the axonal MT network in loading and transport dynamics in our communication model. In our simulation, we limit the degree of MT overlap to be minimal, but future simulations can vary gaps or include branching to mimic alternate normal or disease scenarios. The long-term goal is to continue to advance our molecular models of the axon to more fully incorporate the morphological and dynamic complexity as it becomes known, and to continue to compare normal and disease states. This is a bold endeavor as the complexity and computational power required are challenging. Additional axonal MT complexities not modeled here that could be incorporated in future iterations include MT severing and MT dynamic events, MAP regulators, MT organization differences within the axon length, growth cones and synapses, as well as additional ionic regulation at sites such as the nodes of Ranvier or axonal organelles not modeled here. Integration with other neuro-molecular computational models that evaluate discrete events, such as axonal stretch models of MAP-tau in traumatic brain injury,24–26 or in order to predict morphological outcomes such as branching,27 are expected to provide additional synergistic insights and improve multiscale models that depend on a more relevant molecular-nano-microscale simulation of events.
Methods
Mapping to the 1906.1 standard
The IEEE 1906.1 standard was developed by a multidisciplinary team to generate a common framework to aid interdisciplinary research in nanoscale communication networks and applies Shannon’s rules of communication theory to biological events. Communication theory has previously been applied to study the organizing principles of multicellular systems.28 Our model in overview represents the communication signaling system inside a neuron under three basic components: transmitter, channel, and receiver. 1) The transmitter is comprised of two mutually independent sources, which generate calcium ions or BDNF molecules, both following Poisson distribution. These sources might correspond to the dendritic-soma calcium channels and receptors with ion channels or the nucleus, respectively, in a neuron. Ca2+ ions elevated in the neuron cytosol passively diffuse through the soma to the AIS region, whereas BDNF molecules (DCV-BDNF) are assumed to be unlimited in the soma but must be carried over the network of MT segments in DCV–BDNF–kinesin complexes utilizing energy in the form of ATP molecules. 2) The diffusing Ca2+ ions affect BDNF transport in the axons resulting in the disruption of FAT. A network of M/M/1 queues is used to model the BDNF transport along MTs. A modified conventional diffusion equation, taking into consideration the calcium buffering, is used to model Ca2+ diffusion. 3) The DCV-BDNF that will be traversing the MT segments accumulates near the front end of a receiver, defined here as the minus ends of multiple bundled MTs that act as gates for the next stage of MTs. These MT gates can be assumed to be active regions of DCV-BDNF-kinesin-MT loading for transport. It is assumed that the accumulated DCV-BDNF requires efficient clearance out of the AIS region of the neuron for active signaling. An optimization procedure using Lagrangian relaxation and subgradient heuristic is used to optimize the number of gates to minimize the clearance time of DCV-BDNF from the AIS region. In a nutshell, the model is a manifestation of calcium signaling events in the neuron taking into consideration multiple nano- to macroscale biological events with functional impact. In Table 1 we summarize advantages of our model that investigates a larger communication network, versus other models.
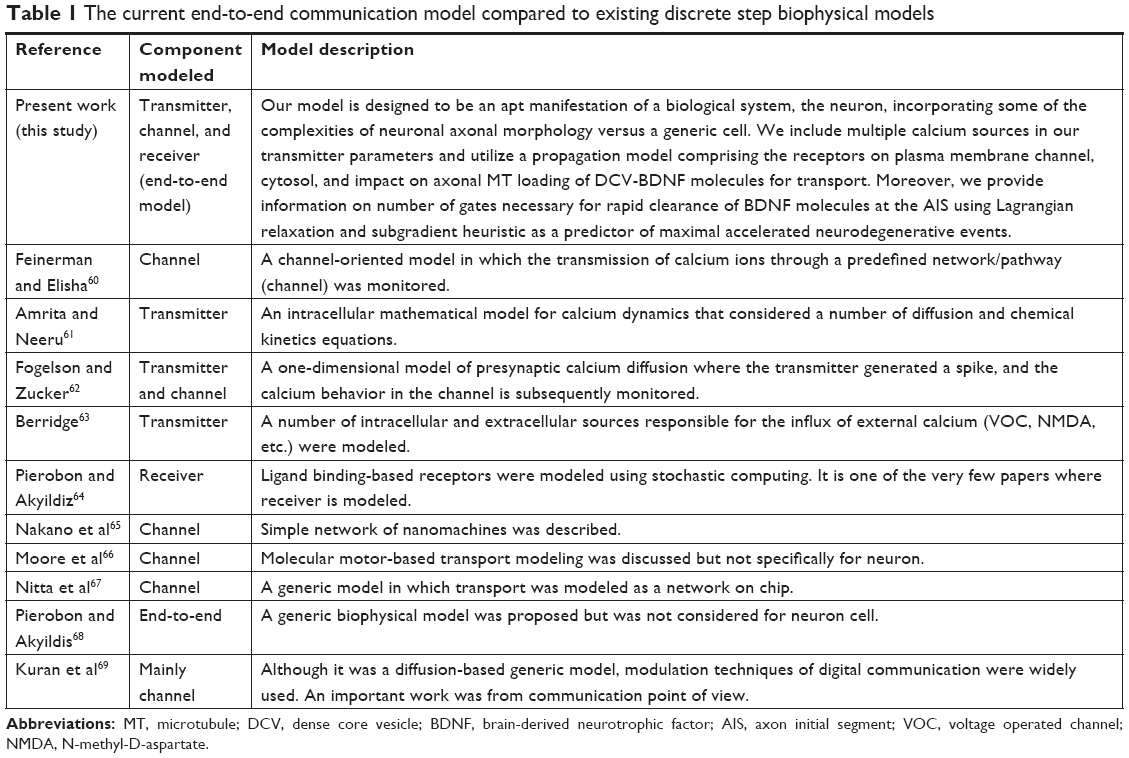 | Table 1 The current end-to-end communication model compared to existing discrete step biophysical models |
Utilizing a priori knowledge of the system description and biological components as described, a neuronal communication system is mapped with the IEEE 1906.1 standard physical layer framework functions as follows:
- Message carrier
In this study, the signaling molecules of interest are the BDNF molecules which are loaded into DCVs and transported by kinesin molecular motors. - Perturbation
The “perturbation” component varies the properties of message carriers to represent a signal.6 Modulation is brought about by aberrant Ca2+ influx triggered by AβO ion channel and receptor binding or Aβ1-42 pore/channel formation. Inside a neuron, there exists internal calcium storage/release control from the ER and external control from surface plasma membrane receptors (AMPA, NMDA, VGCC, etc.) over the net Ca2+ cytosolic levels inside the neuron cells. - Motion
The “motion” component describes movement of the message carrier under a thrust applied to it. Motion provides the necessary potential to transport information through a communication channel.6 For active transport, message carriers generate their own motion using chemical energy of ATP harnessed by molecular motors, and for passive transport, a concentration gradient in the propagation media facilitates transport. Ca2+ ions diffuse across a concentration gradient in the cytosol. Within the axon, DCV–BDNF–kinesin complexes are actively transported in an anterograde motion. - Field
The “field” component is responsible for the organized motion of message carriers. It can be thought of as a virtual waveguide in communications.6 Inside a neuron, MTs assembled in axons act as a sequence of guided media for BDNF transport. MTs are polar filaments with designated plus and minus ends.29 The directional motility of molecular motor proteins on MTs is governed by the field generated by polarized heterodimeric α-/β-tubulin subunits that underlie the MT structural polarity. For example, conventional kinesin and some of the additional kinesin-like protein (Klp) families are plus end-directed motors, whereas Dynein is minus end-directed as are kinesin-14 family members. Thus, the field component includes directional specificity of the motors. - Specificity
The “specificity” component relates to sensing or reception of a message carrier by a target such as interaction of DCV-BDNF with kinesin-MTs.6 The mapping to the 1906.1 standard and the functionalities of the framework components for our model are summarized in Table 2 and Figure 3.
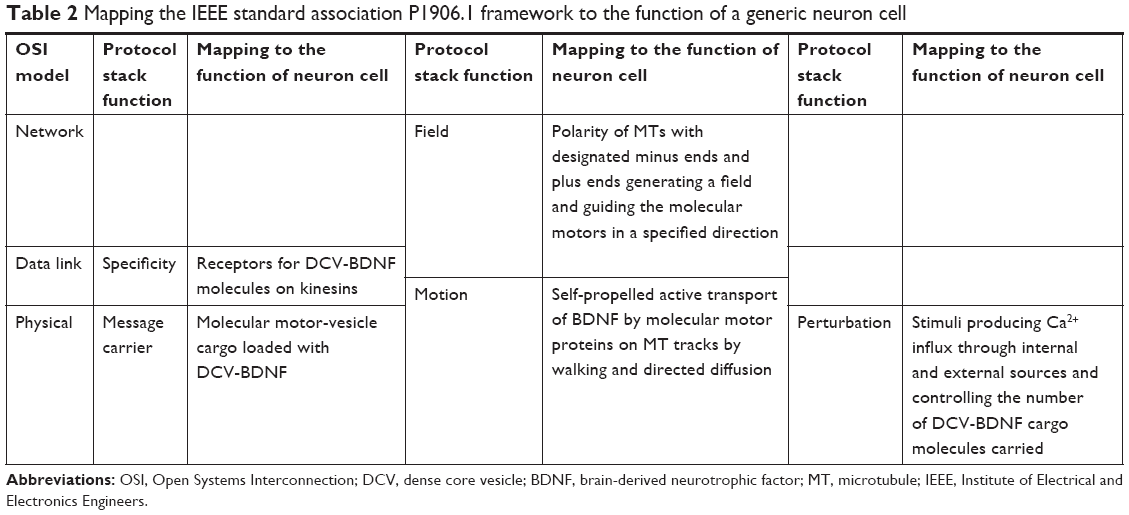 | Table 2 Mapping the IEEE standard association P1906.1 framework to the function of a generic neuron cell |
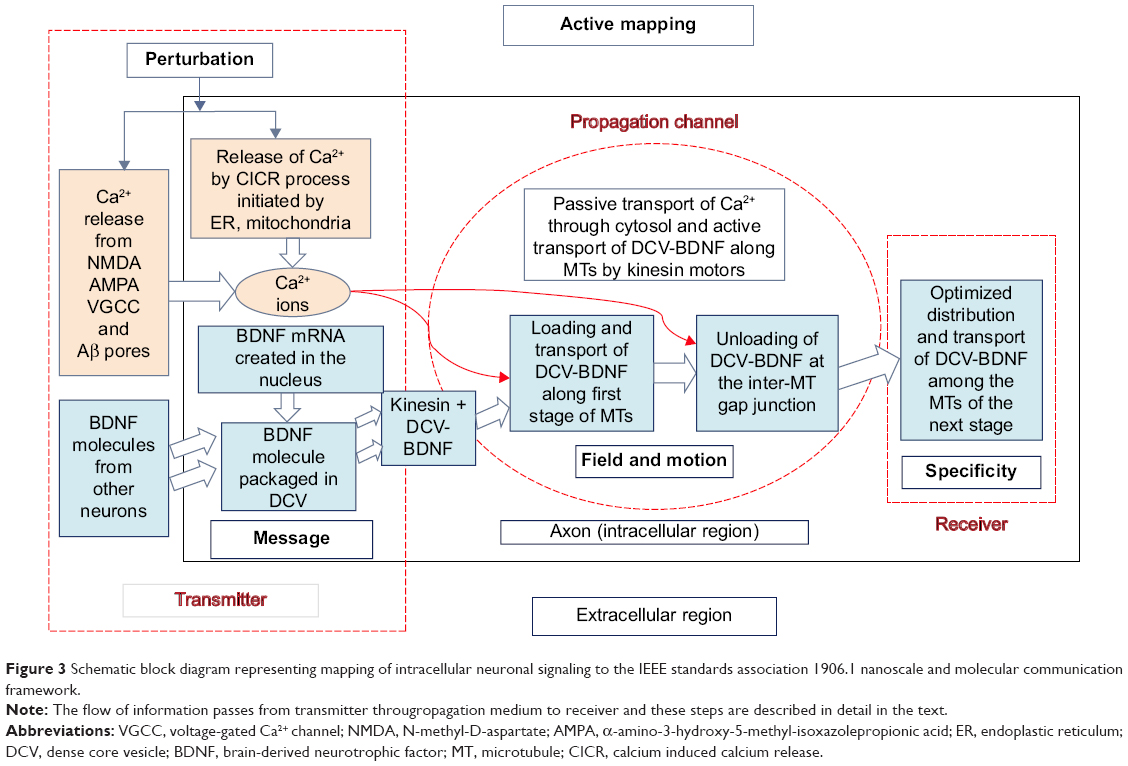 | Figure 3 Schematic block diagram representing mapping of intracellular neuronal signaling to the IEEE standards association 1906.1 nanoscale and molecular communication framework. |
Model description and solution scheme for the transmitter, channel, and receiver components
Transmitter model description
In our model, the signaling components are the calcium ions and DCV-BDNF molecules. As these ions/molecules are independently generated inside a neuron, the transmitter is represented as two mutually independent discrete memoryless sources (DMS).6 The generation of each component in a DMS is independent of previous generations. The generation of Ca2+ ions or DCV-BDNF molecules can be modeled as renewal processes in which ions or molecules are generated randomly in time, and the superimposition of many renewal processes gives a Poisson process. Thus, in a given interval of time, the sources generate streams of Ca2+ ions and DCV-BDNF molecules following a Poisson distribution and the inter-arrival time or the time between successive generations is exponentially distributed.
Assumptions made for the sake of computational simplicity:
- The whole neuron system is confined to a two-dimensional plane. We realize that this may create some bias,30 but is necessary to simplify the current simulation.
- The effects of multiple sources of Ca2+ (RyR as an internal source and AMPA, NMDA, VGCC as sources31) are incorporated in the model by independent Poisson merging (Figure 2). It means that the number of Ca2+ ions generated independently from these sources need to be added together.
- In addition to the dendritic and somatic channels, there also exist additional calcium channels in the nodes of Ranvier all along the axon.32 However, our model focuses on polar MTs in the AIS region, and the contribution of these channels can be neglected in new shorter myelinated axons as shown in Figure 1.
- We evaluate oligomeric Aβ1-42 pore/channel formation only without contributing factors such as cholesterol or α-synuclein. The BDNF referenced study4 also applies oligomeric Aβ1-42.
- We apply single pore/channel flux information from the xenopus oocyte model system that provides permeation and gating properties without the presence of interfering endogenous channels that could interact with AβOs. Influx rates of Aβ1-42 pore/channels of similar diameter are expected to be similar amongst different model in vivo systems.
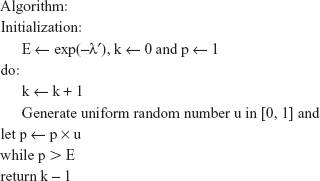
Solution scheme: Poisson-distributed random ion/molecule generation
We use Knuth’s algorithm for generating Poisson-distributed random variables.33 The algorithm uses the fact that the inter-arrival time in Poisson process is exponentially distributed. The “number of arrivals” in an interval is counted by considering the times between arrivals and adding them up until the sum is greater than the time interval. The expected run time of the algorithm is proportional to ion/molecule generation rate λ (incoming rate in ion/nanosecond). Beginning with an average value of the generation rate (obtained from cited literature sources), a random value of ions/molecules is generated. The algorithm is described in the supplementary material (section “Knuth’s algorithm”). To minimize the complexity of the BDNF protein generation and DCV loading for our model, the dynamics of BDNF molecule generation are not considered. A source, nucleus in this case, is considered to release BDNF molecules through the process of translation at fixed intervals of time, which follows Poisson distribution and then loading into DCVs occurs. The calcium ions and DCV-BDNF molecules generated in the transmitter are transported through channels by different mechanisms, which are described in the next section.
Channel and receiver model description
Transport through a molecular communication channel can be categorized into two types: broadcast mode and point-to-point mode. As described in the subsequent sections, both of these modes exist in the axons. Depending on the properties of channel mediums, there can be two types of transport processes. When signaling molecules are transported down a concentration gradient or by motion of the surrounding medium without any expense of energy, the motion is passive. On the contrary, self-propelled motion along a guided path using chemical energy of the cell constitutes active transport.
Ca2+ diffusion
The Ca2+ ions coming from different cytoplasmic membrane sources diffuse through the soma to the AIS through the cytosol (channel) in a Brownian motion following the broadcast mode. The diffusion mechanism is passive, governed primarily by the concentration gradient of Ca2+ ions and no external energy is required. The calcium concentration depends upon the diffusion coefficient (D) and the characteristics of binding with other molecules, that is, Ca2+ buffering. We simply assume that the number of Ca2+ bound (Ca2+bound) molecules is directly proportional to the number of Ca2+ ions generated (Ca2+gen) or present at that instant.34
Ca2+bound= BCa2+gen, where B is the proportionality constant which is defined as the ratio of bound to free calcium ions.
If c′ is the concentration of Ca2+ ions at any point at a distance r′ from the point of generation of the same and at time instant t′, then
|
|
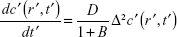
where  is the effective diffusive coefficient and noted as Deff considering calcium buffering in the neuron.
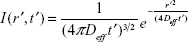
Assuming the transmitter starts releasing Ca2+ ions at t′=0, the impulse function of the solution for the above equation is
|
|
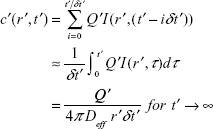
Since the transmitter generates a train of bursts of Ca2+ ions following Poisson distribution, the solution to the above diffusion equation for a train of Ca2+ ion bursts of size Q′ ions spaced by a period δt′ and started at t′ =0 is
|
|
Considering short neurons (excluding regions that have nodes of Ranvier or axonal branching), the concentration gradient guides calcium ions through some distance into the region of the axon at the AIS. Through metabolic pathways described before, these ions affect kinesin motility and cargo binding, and consequently disrupt FAT. The active counterpart of the transport process, namely the ATP-driven transport of BDNF-loaded DCV cargoes by kinesin motors on MTs is modeled by implementing a network of queues that is clearly described in section “Molecular motors, MT organization, and dynamics in the axon”.
Molecular motors, MT organization, and dynamics in the axon
It is known that axonal MTs do not span the entire length of the axon as single continuous long tracks but are instead composed of multiple shorter segments with ends presumed to possess normal MT dynamic characteristics under growth or disease scenarios, capable of undergoing polymerization and depolymerization, as regulated by MAPs.35 In the current model, we consider the MTs to be non-dynamic (capped) although this can be modified in future models in which MAPs (tau, others) or MT severing proteins (such as katanin) may act to contribute to tauopathy disease mechanisms. These MT end junctional points are modeled here for the first time in evaluating transport to improve model predictability of normal and disease states for the current parameters and for future studies of tauopathies and other axonopathies.
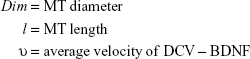
On the MT track, multiple motor proteins are expected to be involved in transport, namely conventional kinesin and Klps, and Dynein.29 Kinesins are diversified into 14 different Klp families36 and harness the chemical free energy released by the hydrolysis of ATP to perform active transport, such as of BDNF.37 Two parameters, namely 1) average forward anterograde velocity and 2) cargo capacity (defined as the maximum number of BDNF molecules that can be accommodated within one DCV cargo) are defined in this model. For simplicity, we consider only one type of kinesin motor protein so that the directional motility and velocity remain identical for all. Current reviews38 highlight that the movement of the cargoes driven by the molecular motor proteins on the MT track could be modeled as a random process consisting of random memoryless forward and reverse steps. The cumulative effects of the steps produce a resultant average forward velocity (v) of typically 800 nm/s in the case of the motor protein Klp-1 (conventional kinesin).29 During anterograde motion, the motor performs a power stroke by harnessing the energy from ATP that results in active transport. The typical length (l) units of MT segments in the model are defined on the order of micrometers. MTs are oriented in the axon with their minus ends toward the soma of the neuron and AIS and their plus ends distal to the axonal body and terminal synapse. We assume that the length of each polar MT segment from the minus end to plus end is finite, where the arriving molecular motors can be accumulated and distributed accordingly with the appropriate rates.
DCV-BDNF transport and modulation due to calcium signaling
The BDNF molecules, generated by the transmitter, are loaded into DCVs and picked up by molecular motors at the AIS region. They arrive at the first MT segment following a Poisson distribution with an average arrival rate of λ packets/s where packets represent the DCV carrying BDNF molecules. As stated previously, MTs are polar filaments, each one having minus- and plus-end domains on either side across which anterograde motors traverse. The DCV-BDNF cargoes are actively transported along the length of the MTs by kinesin motors and are unloaded from the motors at the MT end junctions from where they diffuse into the inter-tubular space. After traversing each stage of MTs, the DCV-BDNF cargoes have been assumed to accumulate in the inter-MT space where an optimization formulation aims to minimize the average clearance time taken by the DCV-BDNF molecules for loading onto the next stage of tubules (Figure 4).
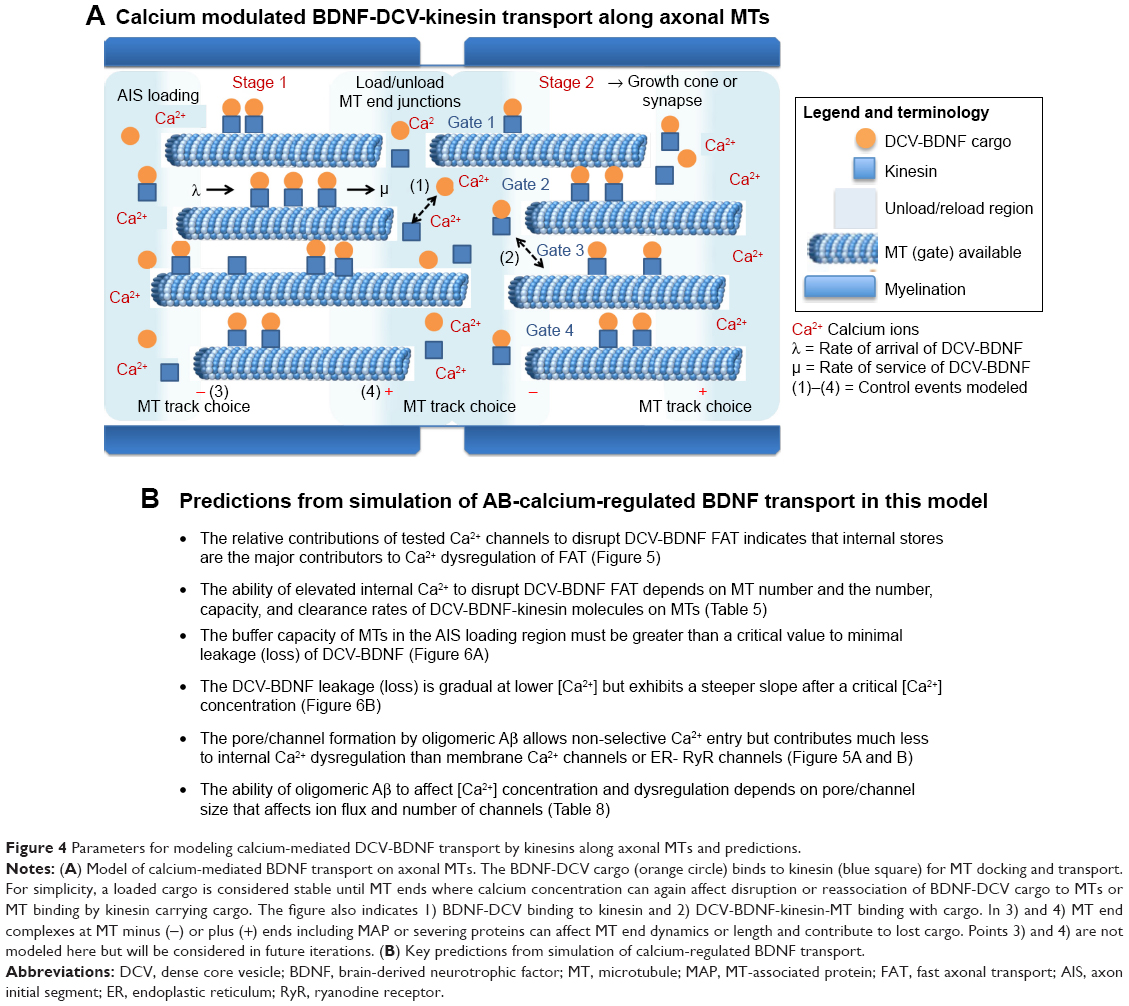 | Figure 4 Parameters for modeling calcium-mediated DCV-BDNF transport by kinesins along axonal MTs and predictions. |
Assumptions made to model the transport of DCV-BDNF by kinesin molecules along axonal MTs are as follows:
- Kinesin motors move in a single file along a MT protofilament.
- At the minus end of the MT, the DCV-BDNF cargos are loaded onto new kinesin motors.
- At the plus end of the MT, the DCV-BDNF cargo detaches from the motor and diffuses in the area of the inter-MT space, that is, the MT end junctions of all MTs in that region.
- The arrival of cargoes at the plus or minus end of MT domains constitutes memoryless processes.
Based on these assumptions, the loading and unloading of DCV-BDNF molecules at the ends of the MTs are modeled using an M/M/1 queuing system where the system is characterized by single service and single arrivals.
One of the major mechanisms by which Ca2+ ions disrupt axonal transport of proteins is by interfering with the kinesin–cargo binding process.4 To incorporate this effect, it is assumed that Ca2+ ion concentration affects the loading and unloading of DCV-BDNF molecules in the queue. The average time (t) taken by DCV-BDNF molecules to move across an MT segment is given by  where l is the length of the MT and υ is the average anterograde velocity of the kinesin motors carrying cargo (DCV-BDNF molecules). The effective service rate (μ) of the cargoes in the M/M/1 queue is defined as
|
|

where  is the rate at which the cargoes traverse the MT segment and arrive at the plus end and
  using Equation (3), where k′ is a proportionality constant.
In the M/M/1 queuing system, the probability of having k DCV-BDNF in the system is given by
|

where ρij is the utilization factor of the queue in the ith MT of the jth stage (Figure 4). Therefore, the average number of DCV-BDNF molecules in the ith MT of the jth stage is given by
|
|

From Little’s law, the average system delay (sum of average service time and average waiting time) in the ith MT of the jth stage can be given by
|
|

For a model having m number of equilength parallel MT tracks and n such stages of MTs, the total system time for all queues is given by
|
|
Thus, for all interconnected segments of the multisegmented axonal MT track, the same regional model and sequence of transport mechanisms are followed periodically. Thus, the number of cargoes accumulating at the inter-tubular space between the jth and (j+1)th stage of MTs is equal to
|
|
The typical diameter of an axonal MT is 25 nm and the inter-MT gap is modeled as much smaller (order of nanometer) than the MT length (order of micrometer).29 Taking the value of diffusion coefficient and time lapse of diffusion within a considerable range and the distances between parallel MTs in the range of a few nanometers, a loss of about 3%–5% is obtained in the inter-tubular regions.39
Theoretically, the M/M/1 queuing system40 consists of an infinite “buffer capacity” which is impractical to test in simulation and in a real-life environment. We consider a finite “buffer capacity” to make the percentage of BDNF unrealized less than 4% when traversing the region between two MT segments.
Problem formulation for optimization at the inter-MT gap junctions
Assuming that the DCV-BDNF cargos accumulating at the inter-MT gap junctions have access to all the MTs (represented as “gates”) of the next stage, the DCV-BDNF cargos get selectively loaded onto the MTs of the next stage. The access to MT gates can be qualified and quantified using two parameters, namely 1) the total loading capacity of each MT and 2) clearance rate. Capacity of a gate (MT) is defined as the maximum number of DCV-BDNF molecules it can load and is given by the product of the capacity of each DCV and the number of DCV getting loaded, while the clearance rate is the number of molecules cleared through a gate per unit of time. The model design is proposed in a way that the DCV-BDNF cargoes arriving at the front end of each stage get selectively loaded onto the MTs of the next stage such that the time taken to clear the cargos through the gates is minimized. The aim of the optimization problem is to reduce the transportation delays that are not caused by AβO-induced calcium elevation mechanisms. That is, the optimization has been assumed to be a part of the efficient DCV-BDNF transport mechanism existing in normal cells.
To transfer Mtotal number of DCV-BDNF molecules through the gates, the total clearance time Gj at the jth stage can be calculated using the following equation:
|
|
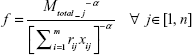
The notations used in the expression are defined in Table 3. Practically, all biological systems are nonlinear in nature. To incorporate this nonlinear behavior and fit the optimization problem into a convex framework, modifications are made to the above equation by introducing a network parameter, that is, neuronal cell complexity parameter α. If we consider α=2 in mathematical analysis and simulation, the function G represents a second-degree nonlinear system which is partially differentiable with respect to xij. Therefore, the modified expression f of the total clearance time is given as
|
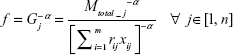
 | Table 3 Notations used in the optimization problem |
Thus, the problem can be restated as follows:
Minimize:
|
|
Subject to:
|
|
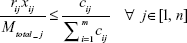
|
|
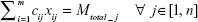
|
|
Equation (10a): At any junction the fraction of total DCV-BDNF molecules that can be cleared by the ith gate at any given time must be less than or equal to the relative capacity of DCV in that gate, that is,
|
Equation (10b): The total number of DCV-BDNF molecules cleared by the MT gates must be equal to the number of DCV-BDNF molecules accumulating in the gap junction.
|
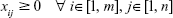
Equation (10c): As xij is the number of DCV-BDNF molecules loaded in the ith MT gate, it has a non-negative value, that is,
|
Solution scheme
The optimization problem had been solved using Lagrangian relaxation and subgradient heuristic.41 This optimization scheme was chosen since it is one of the best methods available for finding the solution of any nonlinear problem. In this method, we relax the set of constraints using Lagrangian relaxation and solve the relaxed form of problem using subgradient heuristic. The possibility of solving the problem by linear programming by piecewise linearization of the problem is not considered. The primary reason is that such relaxed problems are very large and solving them requires considerable computational effort and would have generated fractional solutions. The subgradient heuristic is discussed in Supplementary Material (section “Lagrangian relaxation subgradient optimization algorithm”). Through this heuristic, we obtain a tight lower bound on minimal expected traversal time of DCV-BDNF molecules through neurons as well as a set of feasible solutions for the problem.
Metrics
In this section, we define metrics to analyze the system’s performance and discuss their impact upon the system. The metrics have been tabulated in Table 4.
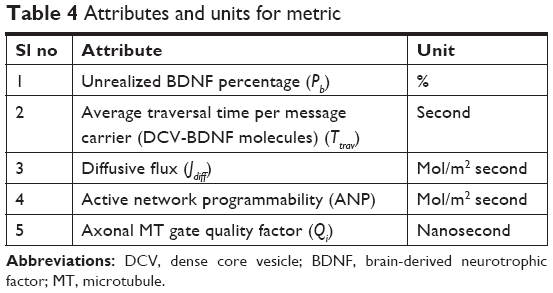 | Table 4 Attributes and units for metric |
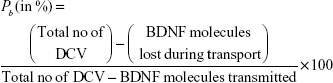
Unrealized DCV-BDNF percentage (Pb)
This is defined as the percentage of DCV-BDNF molecules lost during neuronal transport. For normal cell conditions, this leakage should be very nominal, but for a diseased cell this may be very high. BDNF leakage consists of BDNF molecules lost during the transport due to finite buffer capacity at MT minus-end queuing regions and due to effects of calcium dysregulation. The following expression gives the mathematical formulation:
|
|
Message deliverability (MD) measures whether a BDNF molecule survives long enough to accumulate at the intended receiver (gate). Deliverability is defined as the ability of the transmitter to increase the amount of BDNF molecules received at the receivers (successive MT stages). This is measured as a probability that the BDNF can be delivered to the gates before it leaks during transport.6
|
|

Average traversal time per BDNF molecule (Ttrav)
This metric is eventually a measure of latency or response time of a system. In the context of our model, this metric is defined as the average time one message carrier takes to traverse the compartment of a neuron (ie, the time gap between the two events, namely the arrival of DCV-BDNF molecules inside the cell from different sources and reception of those molecules by the MT gates). The average traversal time has two components as follows.
- The average time taken due to diffusion (Tdiff)
This delay (time taken) is a function of the distance between the point of consideration and generation and the diffusion coefficient and is given by:
(13)
For diffusion delay, we only consider diffusion from the source to the minus end of first MT. The inter-MT diffusion time is negligible for very short distances. Here, (x, y) is the position of consideration and D is the diffusion coefficient of DCV-BDNF molecules at the minus end point of the MT segments of the first stage. In our model, this component yields a constant value as the MT segments have been assumed to remain static. - Average clearance time of BDNF through MT gates (Tgate)
The gate selection should occur in such a manner as to minimize this component, already discussed in the problem the “Formulation for optimization at the inter-MT gap junctions” section.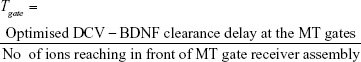
(14)
This is the variable delay component depending on the distribution of DCV-BDNF on the MT gates.
Finally, the total traversal time per DCV-BDNF,
|
|

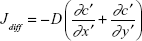
Diffusive flux (Jdiff)
Diffusive flux is the rate of flow of BDNF molecules through the cross-sectional juncture area of each MT due to a concentration difference.6
Diffusion equations along x and y directions are given by:
|
|
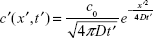
|
|
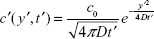
where c′(x′, t′) and c′(y′, t′) are the concentrations of BDNF molecules for one-dimensional diffusion along x′ and y′ directions, respectively, c0′ is the initial concentration of BDNF molecules, and D is the diffusion coefficient of BDNF molecules.
Since this metric is a scalar quantity, the diffusive flux at any point located at (x′, y′) is the sum of flux at that point along x axis and along y axis. The expression of diffusive flux is given by
|
|
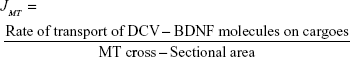
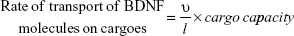
Active network programmability (ANP)
DCV-BDNF molecules change the media component as they transport information from the soma cytosol to MT. ANP is defined as the change in BDNF “flux” due to these two media component changes.6 Flux in cytosol is diffusive in nature (Jdiff), while flux on the MT (JMT) is dependent upon the velocity of the vesicles, and the length and diameter of MT. If DCV-BDNF molecules do not change the underlying media component, then the value of this metric is zero. Equation (19) gives the mathematical expression of ANP of BDNF molecules for neuronal transport.
|
|
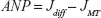
where Jdiff is already discussed as the previous metric and JMT can be calculated as follows.
|
|
and
|
|
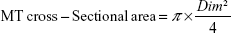
where
|
Results of simulation
The simulation environment for the neuronal system has been defined with proper parameter values and necessary assumptions discussed in the “Methods” section. The performance of our solution schemes is tested in a simulation environment built in C++. The code and documentation developed for our simulation environment are available in the public website Github as detailed and referenced in the “Discussion and conclusion” section.
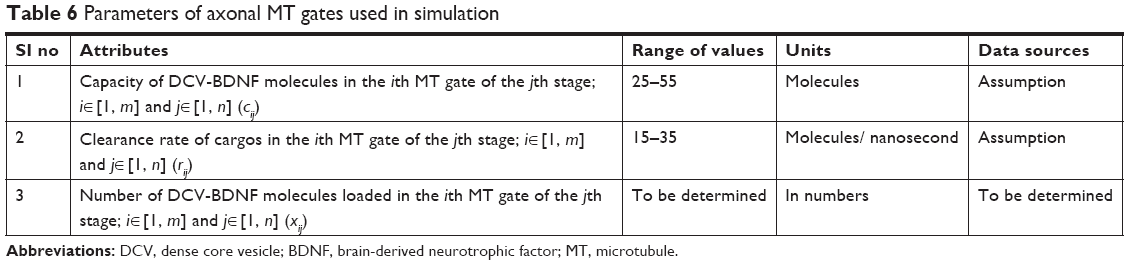
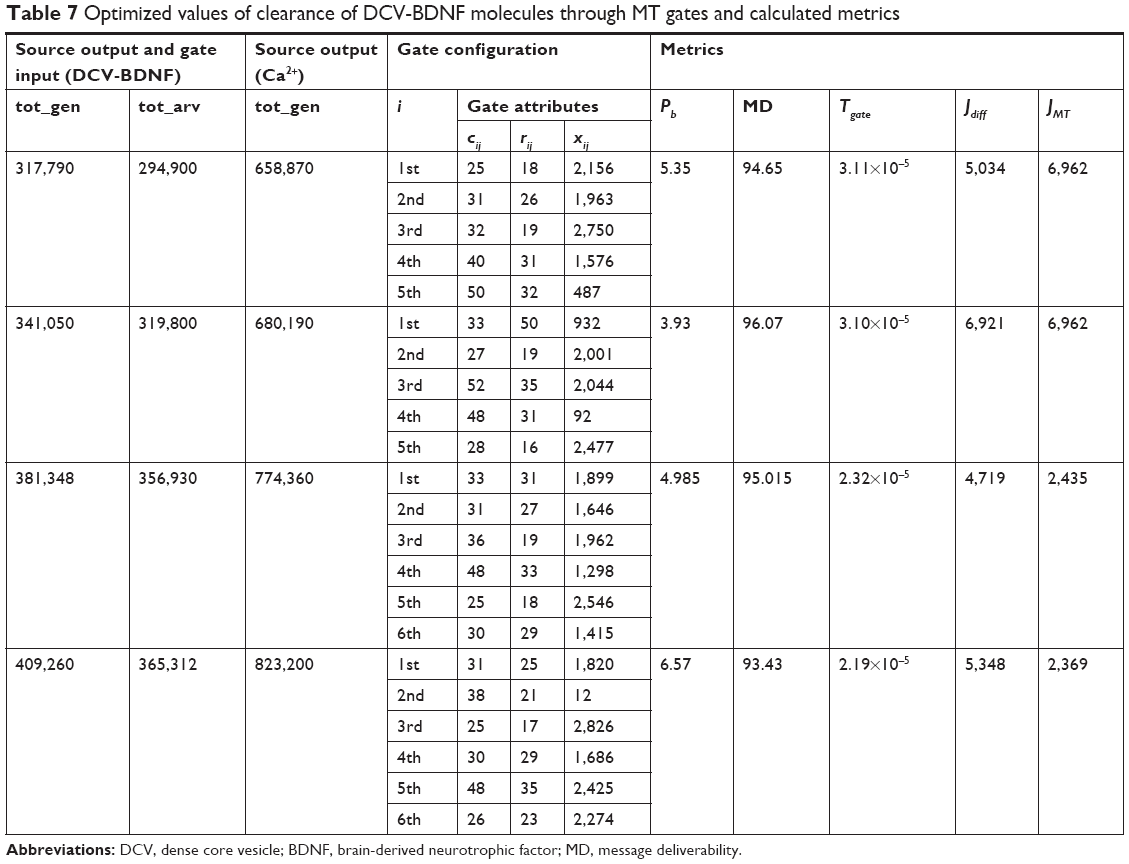
The data set and the range of gate parameters used for the simulation are given in Tables 5 and 6. In this section, we show a set of results corresponding the metrics with the parameters given in Tables 3 and 4.4,29,31 Table 7 shows the complete system performance using our solution schemes while Figures 5 and 6A–E graphically plot the results.
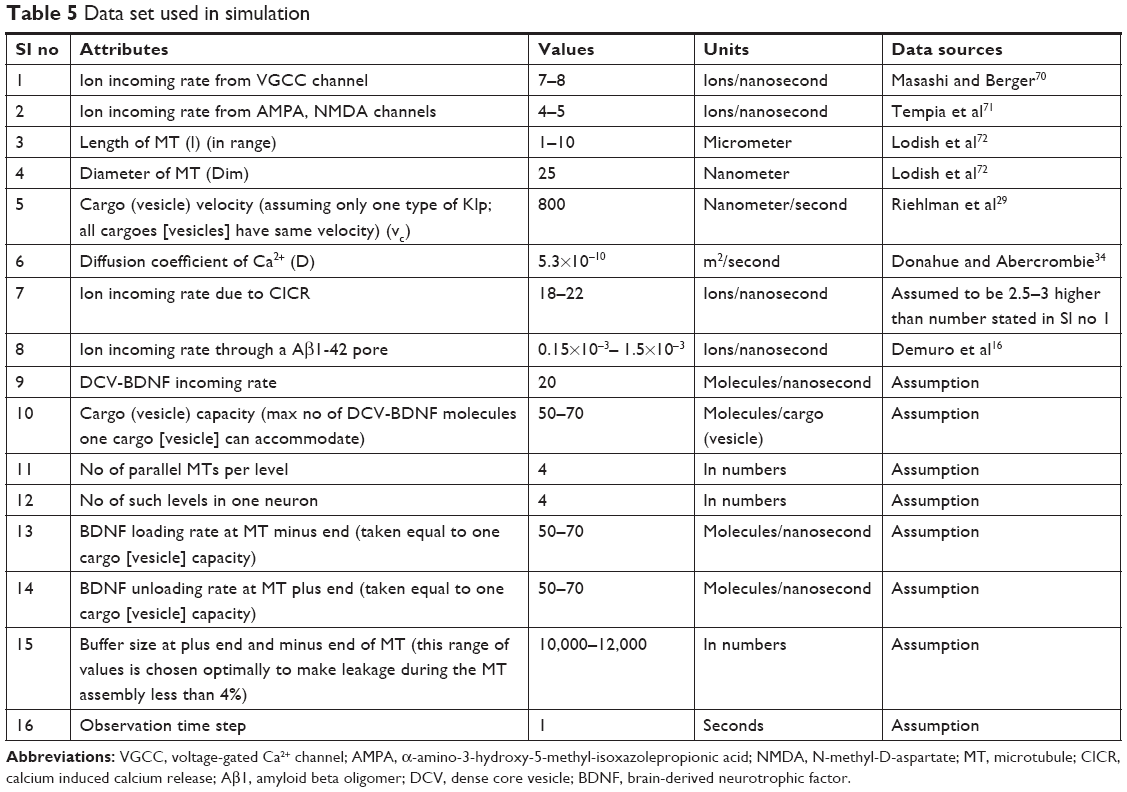 | Table 5 Data set used in simulation |
 | Table 6 Parameters of axonal MT gates used in simulation |
 | Table 7 Optimized values of clearance of DCV-BDNF molecules through MT gates and calculated metrics |
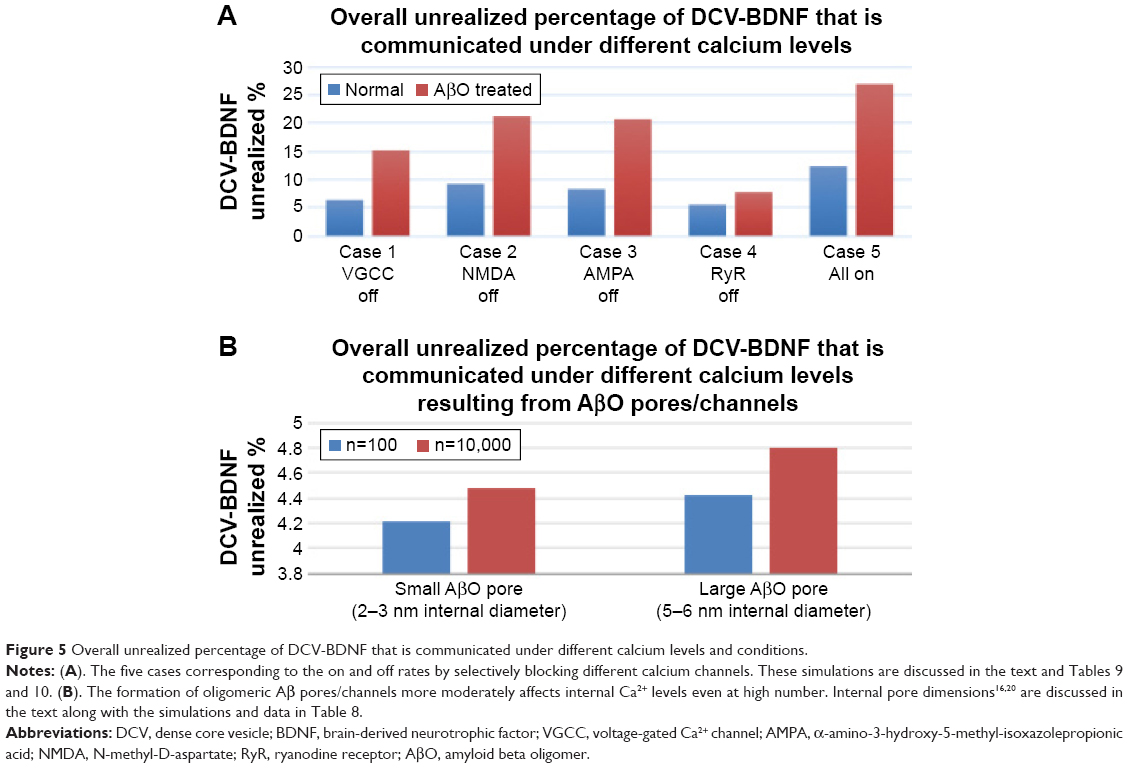 | Figure 5 Overall unrealized percentage of DCV-BDNF that is communicated under different calcium levels and conditions. |
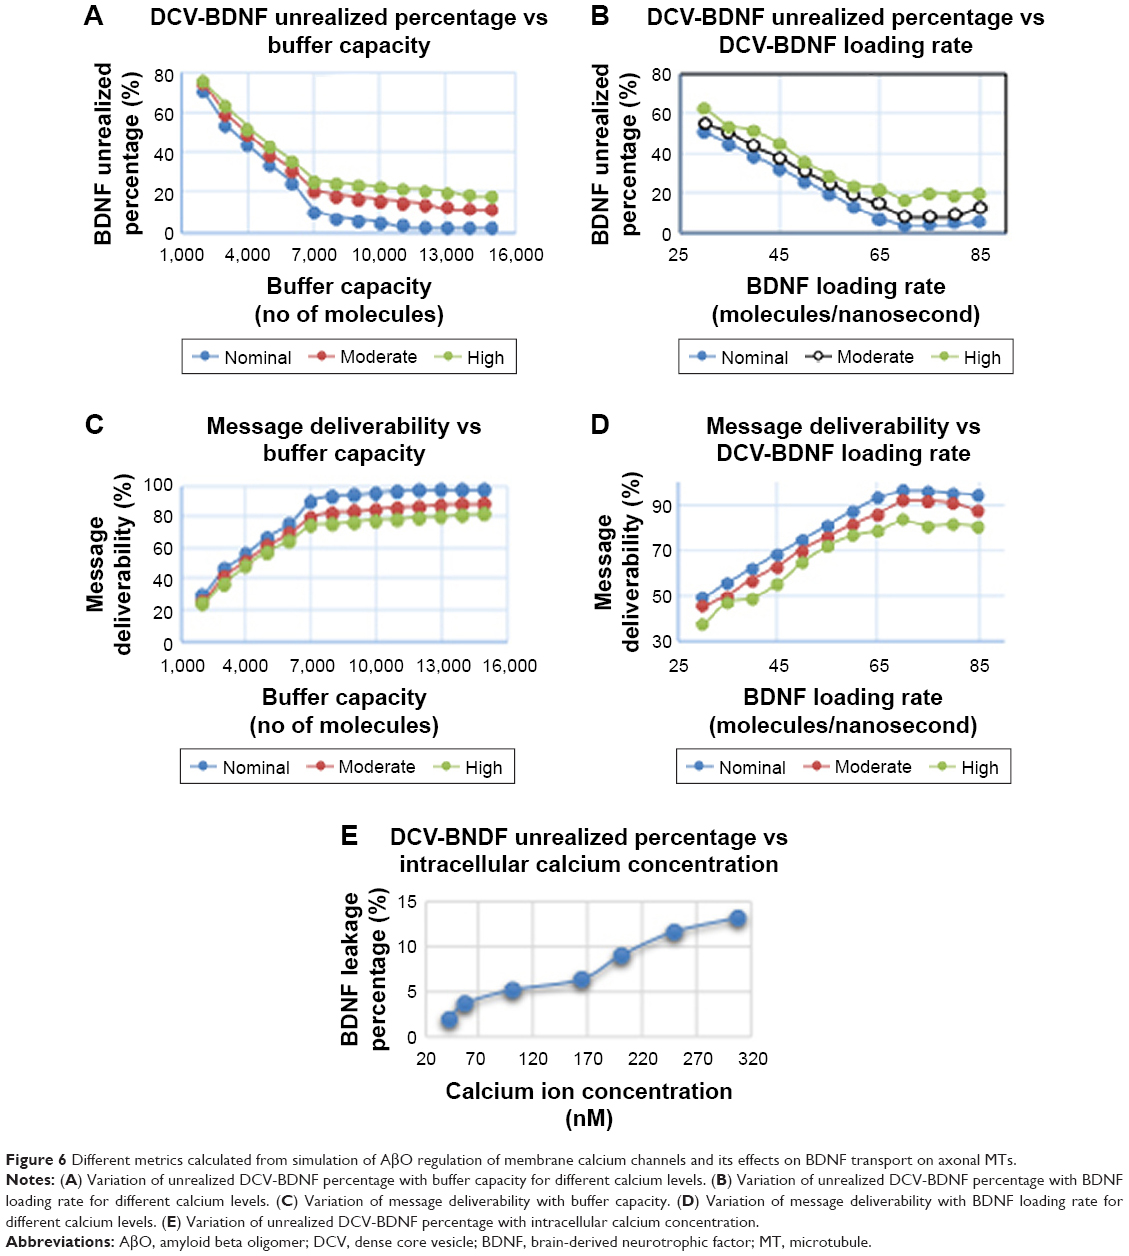 | Figure 6 Different metrics calculated from simulation of AβO regulation of membrane calcium channels and its effects on BDNF transport on axonal MTs. |
In Table 7, “tot_gen” denotes the total number of DCV-BDNF molecules generated by the transmitter and “tot_arv” is the total number of DCV-BDNF molecules reaching the vicinity of the MT gates. For each pair of values (ie, for tot_gen and tot_arv), the values of cij and rij are taken in the range defined in Table 6 and optimized number of DCV-BDNF molecules (xij) loaded in the ith MT gate of the jth stage where i∈[1, m] and j∈[1, n] is found. With the increase of the number of segments in each axonal MT, the number of constraints in the optimization problem increases (Equations 10a, 10b, and 10c). Consequently, the Lagrange multipliers become higher in number and the dimension of the solution space increases which, in turn, makes the computation complex for large number of MT segments. The number of MT gates included is restricted to six in this simulation since the issues of scalability and complexity of optimization come into effect. In Table 7, we run the simulation corresponding to five and six MT gates. The simulation can be extended for higher number of MT gates using higher-end computing platform.
Effect of varying calcium levels due to interaction of AβOs with membrane calcium channels
Table 8 describes the effect of varying calcium levels on the number of DCV-BDNF molecules reaching the MT ends, that is, variation of BDNF unrealized percentage (Pb) with the concentration of Ca2+ ions. Our results infer that the leakage of DCV-BDNF molecules in the queues increases with increase in cytosolic calcium concentration, which decreases the number of DCV-BDNF molecules reaching the front end of gates. Our result is in accord with biological phenomenon of effect of Ca2+ concentration on BDNF molecules in axon.4
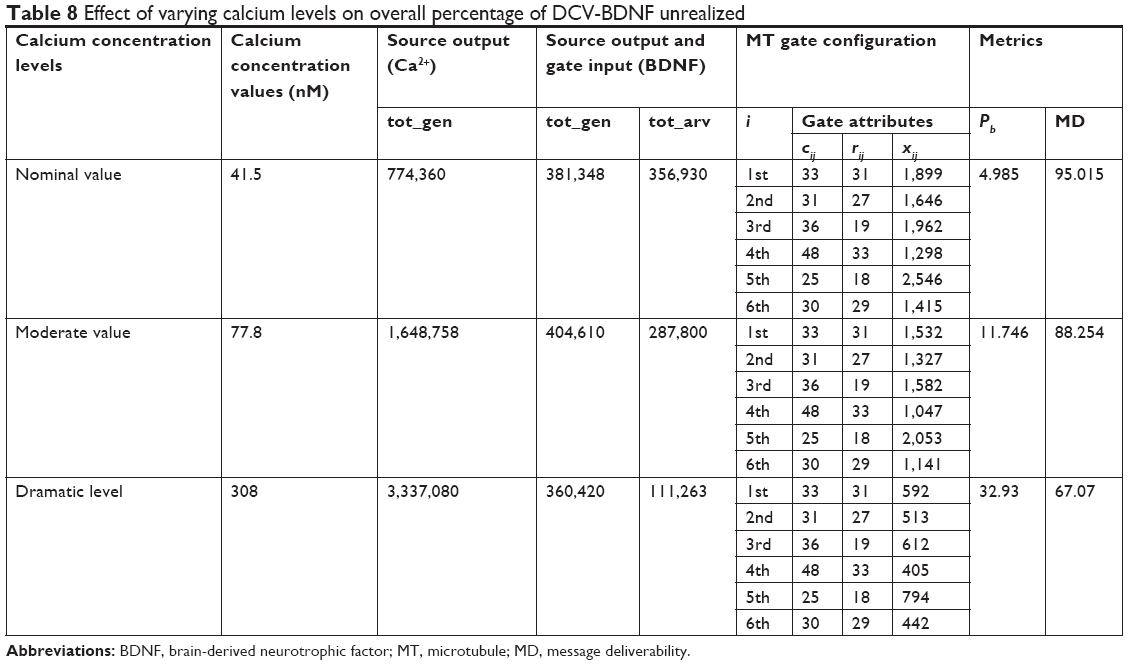 | Table 8 Effect of varying calcium levels on overall percentage of DCV-BDNF unrealized |
It is known that Ca2+ influx through the channels increases in the presence of AβO. This perturbation increases the cytosolic Ca2+ concentration in the neuron, which ultimately results in disruption of FAT. In a study by Gan and Silverman,4 it was observed that after 5 hours of AβO presence, there was a significant increase in fluorescence resonance energy transfer (FRET) between the M13-cp Venus acceptor and the calmodulin–cyan fluorescent protein (CFP) donor in the neuron, as compared to normal condition. FRET ratios had doubled after 13 hours of AβO presence (Figure 2 of Gan and Silverman’s article4). In the study by Miyawaki et al,42 it was shown that the emission ratio for different acceptor–donor pairs doubles as the calcium concentration increases by 103 M. Using these results, we have mapped the effect of presence of AβO on the Ca2+ generation rates of the dendritic-soma channels. The Ca2+ generation rate of the channels has been assumed to increase fourfold after 13–18 hours with a projected increase of fivefold after 18 hours when AβO is present. Table 9 shows the modified generation rate for each receptor in the presence of AβO.
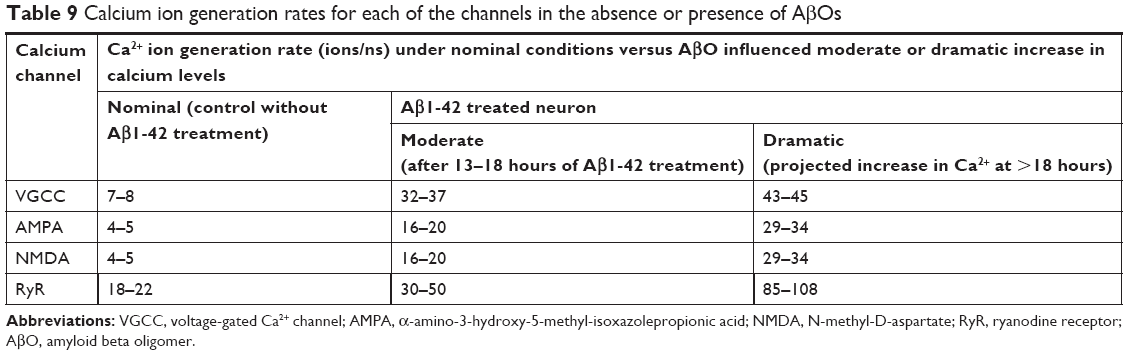 | Table 9 Calcium ion generation rates for each of the channels in the absence or presence of AβOs |
From Figure 6E, we observe that when the concentration of Ca2+ is nominal, unrealized BDNF percentage is very low, representing a healthy condition of cells. If we increase Ca2+ concentration over normal levels, the concentration of unrealized BDNF molecules increases gradually at lower Ca2+ levels but exhibits a steeper slope after a critical Ca2+ concentration.
Effect of calcium influx through AβO pores
Aβ has the ability to form aggregates of calcium-permeable pores that can vary in size and exhibit multiple conduction states.20 Table 10 simulates the effect of calcium influx through oligomeric Aβ1-42 pores/channels having two different conductance values.16
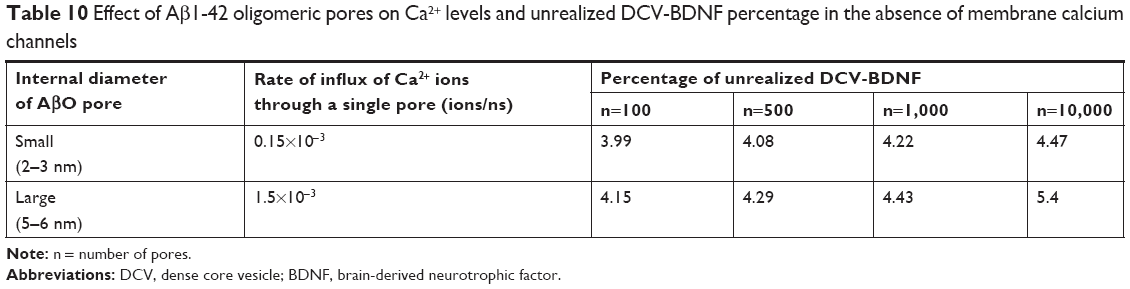 | Table 10 Effect of Aβ1-42 oligomeric pores on Ca2+ levels and unrealized DCV-BDNF percentage in the absence of membrane calcium channels |
A variation in the number of oligomeric Aβ1-42 pores/channels from 100 to 10,000 resulted in a very small change in the percentage of unrealized BDNF molecules. Moreover, a larger number of pores (or larger pore size as in some mutant forms of AβOs) are required to produce disruptive effects of similar magnitude as seen with other calcium channels analyzed here (Figure 5). This result is consistent with a model in which oligomeric Aβ1-42 pores/channels contribute to chronic long-term outcomes and exacerbate other Ca2+ channel dysregulation mechanisms rather than being responsible alone for acute changes leading to neurodegenerative effects such as changes in DCV-BDNF transport. We only evaluated DCV-BDNF transport, but it is expected that the disruption of Ca2+ homeostasis over several years leads to several target effects before evoking an acute neurodegenerative response.18
On/off signaling of calcium channels
The ON-OFF signaling of calcium channels is also simulated in our model. It involves simulation carried under some constrained conditions, which, in this case, implies blocking of one or more dendritic-soma calcium channels. Such findings can help direct the value of targeting specific receptors by using appropriate blockers in targeted drug delivery applications.
Tables 11 and 12 tabulate the response of the model for different combinations of the receptor states and different levels of Ca2+. A comparison is made between the percentage of unrealized BDNF in normal conditions and in the presence of AβO. Five different combinations of receptors’ state are modeled where each receptor can be in either of the two states, ON or OFF. The simulation is run for several times, varying the number of DCV-BDNF molecules generated in each case, and the corresponding results are noted. By varying the number of DCV-BDNF molecules generated in the range from 299,000 to 330,000, the behavior of the model is observed. It is observed that internal stores of Ca2+ such as the RyR channels on the endoplasmic reticulum (ER) play a significant role in increasing the percentage of unrealized BDNF molecules.
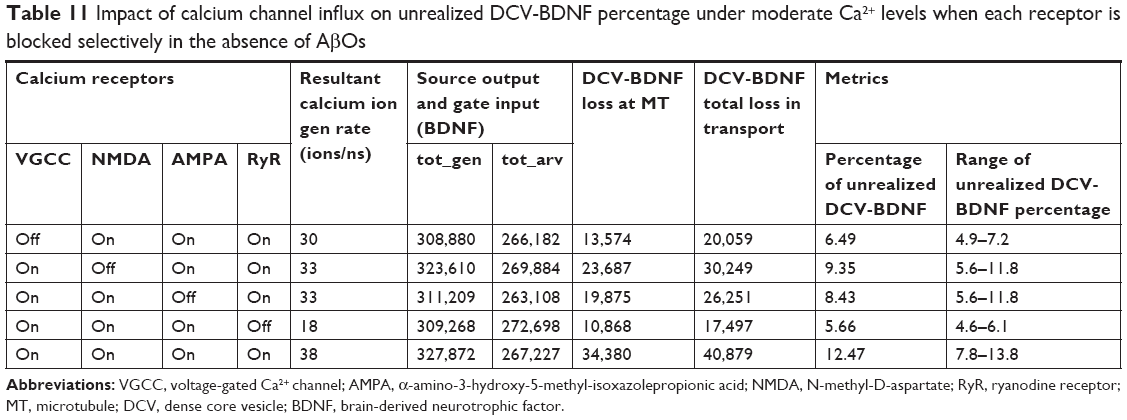 | Table 11 Impact of calcium channel influx on unrealized DCV-BDNF percentage under moderate Ca2+ levels when each receptor is blocked selectively in the absence of AβOs |
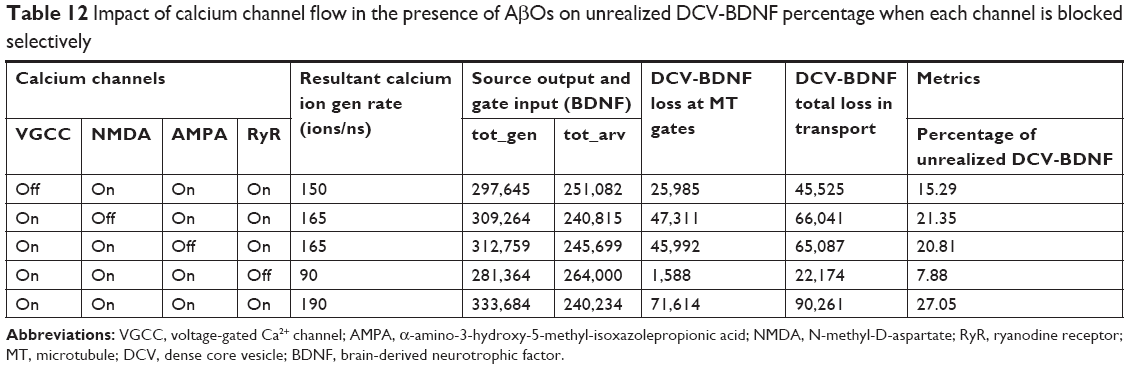 | Table 12 Impact of calcium channel flow in the presence of AβOs on unrealized DCV-BDNF percentage when each channel is blocked selectively |
Figure 5 shows the BDNF unrealized percentage for each of the ON/OFF cases under the normal and AβO treated cases based on the results tabulated in Tables 11 and 12.
Optimal buffer capacity of MTs
Biologically, the buffer capacity can be interpreted as the number of BDNF molecules that can be stored near the MT ends. From Figure 6A, we observe that the variation of the percentage of unrealized DCV-BDNF molecules decreases almost linearly with increase in buffer capacity. For a normal neuron, the leakage percentage must be low. From the graph, it is observed that for a buffer capacity greater than 11,000 molecules, leakage becomes asymptotically constant. Hence, “optimal” buffer capacity is taken in the range of 11,000–12,000 molecules in our simulation.
In Figure 6C, the variation of DCV-BDNF deliverability with buffer capacity for different calcium levels is shown. It is observed that for a buffer capacity in the range of 11,000–12,000 molecules, the number of BDNF molecules received at the MT gates is maximum. The message deliverability reaches a saturation level upon further increase of buffer capacity.
Optimal loading rate of DCV-BDNF on MTs
In Figure 6B, the variation of the BDNF leakage versus loading rate for different calcium levels is shown, keeping the buffer capacity at 11,000 ions (optimal) and average generation (arrival) rate as 20 molecules/ns. From this figure, we observe that the nature of the curve is convex and that the leakage of BDNF molecules is minimum when the average loading rate of BDNF, that is, the rate at which the BDNF molecules are transferred in the cargoes, is kept at around thrice the average rate at which the BDNF molecules are transmitted. It can also be observed that for a fixed loading rate, the unrealized BDNF molecules increase with increase in calcium levels in neuron.
In Figure 6D, the variation of message deliverability with loading rate for different calcium levels is shown, keeping the buffer capacity at optimal value (11,000–12,000 molecules) and average BDNF incoming rate from multiple sources as 20 molecules/ns. From this plot, we once again infer that the average loading rate of DCV-BDNF molecules in the cargo must be around thrice the average rate of BDNF transmission to ensure a high percentage of message deliverability.
Limitations of the study
To better understand normal development, aging, and complex neurodegenerative disease states, new models are needed at the level of a single neuron that enable detailed molecular subcellular events to be simulated in end-to-end communication scenarios in order to reveal molecular events that correlate with multilevel CNS disease outcomes. Modeling of dysregulation of calcium in neurodegenerative tauopathies and other axonopathies is expected to bring new insights into disease mechanisms of shared or distinct pathologies of neurodegeneration from initiation to progression that will be expandable to the clinic. Such models could then be useful to distinguish AD patients versus age-related no AD patients (controls), as well as provide new information on AD disease progression helping to identify and evaluate linked biomarkers for diagnostic and prognostic abilities. The current model applies concepts generated in the recent IEEE Standard Association 1906.1-2015 Recommended Practice for Nanoscale and Molecular Communication Framework in a layered architecture framework to analyze end-to-end events linking AβO dysregulation of calcium ion influx, elevated intracellular calcium levels, and disruption of axonal transport of DCV-BDNF by kinesin on bundled discontinuous axonal MT tracks. Levels of AβOs, oligomer sequence, intracellular calcium levels, and BDNF levels together may be more prognostic as clinical indicators of AD, whereas BDNF alone has resulted in mixed findings, although more recent studies correlate reduced levels with disease progression.43–45 Here, we summarize limitations of the current study specifically as well as needed advances.
- Need for additional experimental details on axonal MT cytoskeleton organization and mechanisms. MT-based mechanisms are generally conserved between dividing cells and neurons but with additional functional specialization in neurons. Informed structural analysis often requires high-resolution TEM46 or for live cells high-throughput analysis of axonal functions by a combination of microfluidic devices along with super-resolution time-lapse microscopy.47 In development of the current model, parameters were kept restricted to limit complexity but can be adjusted in future iterations to include additional layers of detail for alternate cargos, vesicle size, loading capacity, kinesin processivity, capacity of MT tracks affected by cross-linking proteins or minus- and plus-end complexes, as well as ability of cargo to move in between adjacent MTs to avoid end complexes. This will depend on questions asked and ability to get experimental data or to extrapolate data from other models.23,48
- Interaction of MT and actin axonal cytoskeletons. The current model does not evaluate transfer of BDNF vesicles to actin filaments and delivery to the plasma membrane.49 Since this is important for synaptic release of BDNF, future models would benefit with this extension of the end-to-end communication pathway.
- Need for additional detailed membrane channel data at the molecular level. Single-molecule analysis of channels is possible although not widely applied with analysis of ion influx rates. No studies currently compare directly the calcium channel regulation by Aβ with Aβ pore formation, although both have now been separately analyzed. A challenge to such comparisons is to precisely calculate the number of calcium channels and Aβ pores (and monitor internal pore size) present along with kinetics of the AβO interactions and consistency of ionic influx.
- RyR channel data and AβO interactions. The ability of AβO to regulate RyR channels on the ER can occur by direct interactions or indirectly through the activation of G-protein-coupled receptors.50 It is reasonable to expect that oligomeric Aβ pore size will directly impact monomeric and oligomeric Aβ entry into cells. Here we evaluated oligomeric Aβ1-42 pores of 24 nm external diameter and 2–6 nm internal pore size that could potentially provide access to AβOs and monomers (1×3.5 nm)16,20 into the cytoplasm and gain access to RyR channels whereas smaller pores would not.
- Need for human disease models of neurodegeneration. Human-induced pluripotent stem cell biology and clustered regulatory interspaced short palindromic repeats technologies are being applied to develop isogeneic and epigenetically near-identical control and disease neuron cell type-specific models that will aid in iterative computational-experimental testing.
- Need to develop biomarkers to quantify Aβ-regulated calcium channels versus membrane Aβ pores. For in vivo analysis of patients, a noninvasive challenge requires developing traceable molecules that might be able to distinguish calcium channels versus Aβ pore ratios if future experimentation and models warrant ratios in disease scenarios.
- Need to develop intracellular biomarkers to track end-to-end events. In vitro models can implicate links in molecular events leading to neurodegeneration that may impact clinical studies. An end-to-end scenario has the advantage of identifying communication-linked biomarkers that may be more disease relevant in combination than when evaluated individually.
Discussion and conclusion
Neurons communicate information through chemical signaling, which traverses not only extracellular space but also multiple intracellular specialized compartments that utilize distinct molecular mechanisms. Intracellular disruption of axonal transport by changes to MT dynamics or organization within the axon, or by altered action of MT motor proteins with cargo on MTs (such as kinesins and DCV-BDNF modeled here) as well as altered homeostasis of key regulators such as calcium are all believed to contribute to progression of neurodegenerative disorders such as Alzheimer’s disease. New mathematical models capable of looking at nanoscale communication events with greater detail and which can link multiple processes to specific outcomes will better reflect the intracellular biological complexity and improve overall neurodegenerative disease modeling. In the current study, we make use of a new mathematical modeling platform designed to investigate communication events at the nano- to microscale, referred to as the Nano, Electrical, Molecular (NEMo) communication, to link for the first time multiple events in a nanocommunication network that includes calcium influx through multiple membrane-bound channels and AβO pores/channels and the elevated calcium concentration effects on DCV-BDNF loading and transport by kinesins, including the complex axonal architecture of bundled and gapped discontinuous MT tracks within the axon. As a communication network, the model provides spatiotemporal information and makes predictions on efficiencies in various steps of intracellular neuronal signaling.
We have defined the underlying communication system in neuronal cells regarding message, message carrier, receiver, transmitter, and medium, concepts developed in the IEEE standard model NEMo communication platform.6,54 The NEMo platform is ideal for modeling intracellular nano-molecular events and has not previously been applied to neurons. It uses a physical layer protocol framework to map communication systems. In our model, we proposed that the Ca2+ ion concentration in axons is affected primarily by cytoplasmic soma delivery following membrane channel influx. Calcium ion movement through the cytosol of the soma is modeled by passive diffusion. In addition, diffusion parameters are considered at the discontinuous gaps for connecting MT end junctions in the axon. To quantify entry of DCV-BDNF molecules into the axon, we applied a memoryless distributed queuing network where the corresponding arrival and service rates are practically associated with the parameters of neuron components. We have formulated a convex nonlinear optimization problem to determine the optimal number of channels required to minimize the transportation time of BDNF molecules. We determined Ca2+ ion concentration distributions within the soma-axonal MT cargo loading region on polarized MTs and in relation to a bundled MT structure and axonal kinesin-cargo transport capabilities. We defined a set of metrics through which we could show performance of the model and analyzed these metrics to draw inferences on axonal transport of DCV-BDNF cargo. The ability to link the end-to-end events resulting from Ca2+ influx to a specific outcome of DCV-BDNF transport provides information that will direct future experimentation in regard to the “calcium hypothesis of AD” while also allowing further downstream events that are MT based to be analyzed in future iterations. During our analysis that included published experimental results,4 we used this platform to sequentially simulate multiple events in the transport of Ca2+ ions including influx at the cell body/soma through Ca2+ channels or Aβ1-42 pores/channels, diffusion of the Ca2+ ions toward the proximal MT segments in the AIS region, DCV–BDNF–kinesin interactions and MT loading, MT transport along polarized MTs from the minus-end to the plus-end region, and unloading/reloading at discontinuous MT end junctions. Within the axon, all the necessary queuing operations are simulated dynamically in the presence of all events for MT segments as a bundle in tandem that contribute to the initial BDNF-vesicle transport events proximal to the soma and are needed to occur successfully before eventually reaching the vicinity of the distal growth cone/future forming synapses.
No current model exists that considers the entire structural, morphological, dynamic, or temporal complexity of intracellular communication within neurons, which is a tremendous challenge. Here too we restrict our model, focusing on polarized MTs in the region of the neuronal AIS for loading and one cargo type and kinesin transporter. We evaluate bundled MTs and gapped regions of discontinuous MTs within the axon; however, more complex axonal features can be added in future iterations to consider gaps in myelination of axons providing distal ionic regulation at specialized nodes of Ranvier, distribution of axonal mitochondria or ER and MT organization changes from branching, axonal growth or retraction, and synaptogenesis. In regard to calcium signaling homeostasis or dysregulation along the axon length, the ability of internal calcium stores to contribute to calcium ion regulation (within soma and along axon), as well as the complex balance of chemical and ionic signaling at nodes of Ranvier55,56 can be added to expand the depth of our model. In addition, the number of MTs within an axon, axon length, and MT polarity are not static and can vary during developmental maturation, dynamic retraction, and disease.57,58 Also of high importance is the role of additional MAPs that are motile connectors that allow sliding or immotile spacers such as MAP-tau that can stabilize dynamics as well as affect viscoelasticity in axonal stretching24,25 and have been evaluated in torsional models.26 As well, different dendrite and axonal branching morphologies exist for different neuronal types allowing for different calcium signaling configurations and requiring integration of morphological simulations.59 The computational complexity of the neuron is staggering and the detailed biological data are often not available or limited in ability to describe and model all physiological or signaling events. Yet models critically help to identify gaps in experimentation and enable rapid testing of new theories to reiteratively guide future experimentation to fill these knowledge gaps.
In our approach, because the calcium-linked events involve conveying a message from a transmitting party to a receiving party, we have chosen to define these events as a communication network and model it in accordance with the definitions given in the IEEE Recommended Practice for Nanoscale and Molecular Communication Framework. The IEEE p1906.1-2015 standard applies Shannon’s rules of communication theory for systems with nanoscale components even if they operate multiscale from nanoscale over larger scales.6,54 The NEMo software is designed to apply the IEEE standard framework. Some of the current limitations of the model relate to the need for more detailed information and as such may help to drive this type of experimental discovery. The model consists of two types of motion, passive and active and means that the saltatory motion of kinesin motors cannot be described by a fluid flow model, hence the idea of queuing theory was chosen. We define kinesin motors as “packets” carrying vesicles in an abstract sense and considered defining headers based on the structural information of vesicles. However, more biological information is needed to consider precise analogies. The availability to map biological systems to communication systems is expected to be beneficial in eventually linking these nanoscale events to micro- and macroscale neural signaling in the brain.
Our propagation model provides an end-to-end communication scenario, membrane channels to axonal MT-based transport, that allows us to evaluate channel input to calcium dysregulation and the queuing and clearance parameters of DCV-BDNF molecules transported by kinesin along axonal MTs.73 By modeling the selective blocking of different calcium channels as well as evaluating oligomeric Aβ1-42 pores/channels, our model indicates that the internal source of calcium is the major calcium contributor during dysregulation, followed by calcium channels and then oligomeric Aβ1-42 pores/channels. As well, our simulation indicates that there exists an optimal capacity and loading rate of DCV-BDNF onto MTs. In our queuing model, we evaluate calcium ion concentration affecting the service process of motors. That is, we show mathematically how the effect of calcium ions on the binding of motors to cargoes creates substantial differences in the transported flux. The cargo-motor binding mechanism can serve as the primary method for calcium ions to impact BDNF transport in diseased cells. Identification of the primary impact sites of calcium dysregulation in the neuron and the manner in which calcium ions (or complexes generated by downstream pathways) further dysregulate communication events can pave future paths for introducing technologies to internally monitor the calcium levels at multiple key functional sites. Our model is a step in this direction. Biological validation through extensive experimentation coupled with relevant computational models that can process the additional details are required to develop more accurate predictor models that will advance our understanding of neural development and neurodegeneration. For future researchers wanting to develop drugs to block AβO through identification of calcium action sites and mechanisms, this work stands as a novel approach to unify the domains of modeling and experimentation.
Acknowledgments
The work was supported by internal funding. An abstract related to this work was presented as a poster with interim findings at the Annual Multiscale Modeling Consortium meeting of the Interagency Modeling and Analysis Group Multiscale Modeling and Analysis (IMAG MSM) meeting held at the National Institutes of Health, March 22–24, 2017. The abstract was published with meeting proceedings on the IMAG MSM wiki webpage.
Disclosure
The authors report no conflicts of interest in this work.
References
Burns A, Iliffe S. Alzheimer’s disease. BMJ. 2009;338(b1):585. | ||
World Health Organization. Dementia Fact Sheet N°362; 2015. Available from: http://www.who.int/mediacentre/factsheets/fs362/en/. | ||
Alzheimer’s Association. Changing the Trajectory of Alzheimer’s Disease: How a Treatment by 2025 Saves Lives and Dollars; 2009. Available from: https://alz.org/documents_custom/trajectory.pdf. | ||
Gan KJ, Silverman MA. Dendritic and axonal mechanisms of Ca2+ elevation impair BDNF transport in Aβ oligomer-treated hippocampal neurons. Mol Biol Cell. 2015;26(6):1058–1071. | ||
Numakawa T, Suzuki S, Kumamaru E, Adachi N, Richards M, Kunugi H. BDNF function and intracellular signaling in neurons. Histopathol. 2010;25(2):237–258. | ||
Bush SF, Paluh JL, Piro G, et al. P1906.1/D2.1 Recommended Practice for Nanoscale and Molecular Communication Framework. New York, NY: IEEE Standards Association; 2015. | ||
Barrett AB, van Rossum MCW. Optimal learning rules for discrete synapses. PLoS Comput Biol. 2008;4(11):1–7. | ||
Berridge MJ. Calcium hypothesis of Alzheimer’s disease. Pflugers Arch. 2010;459(3):441–449. | ||
Ferreira ST, Klein WL. The Abeta oligomer hypothesis for synapse failure and memory loss in Alzheimer’s disease. Neurobiol Learn Mem. 2011;96(4):529–543. | ||
DeFelice FG, Velasco PT, Lambert MP, et al. Abeta oligomers induce neuronal oxidative stress through an N-methyl-D-aspartate receptor-dependent mechanism that is blocked by the Alzheimer drug memantine. J Biol Chem. 2007;282:11590–11601. | ||
Alberdi E, Sánchez-Gómez MV, Cavaliere F, et al. Amyloid beta oligomers induce Ca2+ dysregulation and neuronal death through activation of ionotropic glutamate receptors. Cell Calcium. 2010;47(3):264–272. | ||
Paula-Lima AC, Adasme T, SanMartin C, et al. Amyloid beta-peptide oligomers stimulate RyR-mediated Ca2+ release inducing mitochondrial fragmentation in hippocampal neurons and prevent RyR-mediated dendritic spine remodeling produced by BDNF. Antioxid Redox Signal. 2011;14(7):1209–1223. | ||
Reese LC, Taglialatela G. A role for calcineurin in Alzheimer’s disease. Curr Neuropharmacol. 2011;9:685–669. | ||
Morfini G, Szebenyi G, Elluru R, Ratner N, Brady ST. Glycogen synthase kinase 3 phosphorylates kinesin light chains and negatively regulates kinesin-based motility. Embo J. 2002;21:281–293. | ||
Lashuel HA, Hartley D, Petre BM, Walz T, Lansbury PT Jr. Amyloid pores from pathogenic mutations. Nature. 2002;418(6895):291. | ||
Demuro A, Smith M, Parker I. Single channel Ca2+ imaging implicates Ab1-42 amyloid pores in Alzheimer’s disease pathology. J Cell Biol. 2011;195:515–524. | ||
Prangkio P, Yusko EC, Sept D, Yang J, Mayer M. Multivariate analyses of amyloid-beta oligomer populations indicate a connection between pore formation and cytotoxicity. PLoS One. 2012;7(10):e47261. | ||
Demuro A, Mina E, Kayed R, Milton SC, Parker I, Glabe CG. Calcium dysregulation and membrane disruption as a ubiquitous neurotoxic mechanism of soluble amyloid oligomers. J Biol Chem. 2005;280:17294–17300. | ||
Schauerte JA, Wong PT, Wisser KC, Ding H, Steel DG, Gafni A. Simultaneous single-molecule fluorescence and conductivity studies reveal distinct classes of AB species on lipid bilayers. Biochem. 2010;49:3031–3039. | ||
Bode DC, Baker MD, Viles JH. Ion channel formation of amloid-β42 oligomers but not amyloid-β40 in cellular membranes. J Biol Chem. 2017;292(4):1404–1413. | ||
Di Scala C, Troadec J-D, Lelivre C, Garmy N, Fantini J, Chahinian H. Mechanism of cholesterol-assisted oligomeric channel formation by a short Alzheimer β-amyloid peptide. J Neurochem. 2014;128(1):186–195. | ||
Di Scala C, Yahi N, Boutemeur S, et al. Common molecular mechanism of amyloid pore formation by Alzheimer’s b-amyloid peptide and alpha-synuclein. Sci Rep. 2016:6:28781. | ||
Matamoros AJ, Baas PW. Microtubules in health and degenerative disease of the nervous system. Brain Res Bull. 2016;126(Pt 3):217–225. | ||
Ahmadzadeh H, Smith DH, Shenoy VB. Viscoelasticity of Tau proteins leads to strain rate-dependent breaking of microtubules during axonal stretch injury: predictions from a mathematical model. Biophys J. 2014;106(5):1123–1133. | ||
Ahmadzadeh H, Smith DH, Shenoy VB. Mechanical effects of dynamic binding between Tau proteins on microtubules during axonal injury. Biophys J. 2015;109(11):2328–2337. | ||
Lazarus C, Soheilypour M, Mofrad MRK. Torsional behaviour of axonal microtubule bundles. Biophy J. 2015;109(2):231–239. | ||
Ledderose J, Sención L, Salgado H, Arias-Carrión O, Treviño M. A software tool for the analysis of neuronal morphology data. Int Archives Med. 2014;7:6. | ||
Mian IS, Rose C. Communication theory and multicellular biology. Integr Biol. 2011;3(4):350–367. | ||
Riehlman TD, Olmsted ZT, Paluh Janet L. Molecular motors (Chapter 4). In: Xie Y (editor). The Nanobiotechnology Handbook. Boca Raton, FL: CRC Press; 2012:73–111. | ||
Dupont A, Gorelashvili M, Schüller V, et al. Three-dimensional single-particle tracking in live cells: news from the third dimension. New J Phys. 2013;15:1–17. | ||
Grienberger C, Konnerth A. Imaging calcium in neurons. Neuron. 2012;73(5):862–885. | ||
Lyons DA, Talbot WS. Targeting mechanisms in myelinated axons: not all nodes are created equal. Dev Cell. 2012;22(1):7–9. | ||
Knuth D. The Art of Computer Programming. 3rd ed. Boston, MA: Addion Wesley; 1997:2. | ||
Donahue BS, Abercrombie RF. Free diffusion coefficient of ionic calcium in cytoplasm. Cell Calcium. 1987;8(6):437–448. | ||
Dubey J, Ratnakaran N, Koushika SP. Neurodegeneration and microtubule dynamics: death by a thousand cuts. Front Cell Neurosci. 2015;9(9):1–15. | ||
Olmsted ZT, Colliver AG, Paluh JL. The kinesin–tubulin complex: considerations in structural and functional complexity. Cell Health Cytoskelet. 2015;7:83–97. | ||
Bustamante C, Chemia YR, Forde NR, Izhaky D. Mechanical processes in biochemistry. Annu Rev Biochem. 2004;73:705–748. | ||
Bush SF. Nanoscale Communication Networks. 1st ed. Norwood, MA: Artech House; 2010. | ||
Mudrakola HV, Zhang K, Cui B. Optically resolving individual microtubules in live axons. Structure. 2009;17(11):1433–1441. | ||
Kleinrock L. Queueing Systems Theory. Vol 1. Hoboken, NJ: Wiley & Sons; 1975. | ||
Gavish B, Hantler SL. An algorithm for optimal route selection networks in SNA Networks. IEEE Trans Commun. 1983;31(10):1154–1161. | ||
Miyawaki A, Llopis J, Heim R, et al. Fluorescent indicators for Ca2+ based on green fluorescent proteins and calmodulin. Nature. 1997;388(6645):882–887. | ||
Laske C, Stransky E, Leyhe T, et al. Stage-dependent BDNF serum concentrations in Alzheimer’s disease. J Neural Transm. 2006;113(9):1217–1224. | ||
O-Bryant SE, Hobson V, Hall JR, et al. Brain-derived neurotrophic factor levels in Alzheimer’s Disease. J Alzheimers Dis. 2009;17(2):337–341. | ||
Qin X-Y, Cao C, Cawley NX, et al. Decreased peripheral brain-derived neurotrophic factor levels in Alzheimer’s disease: a meta-analysis study (N=7277). Molec Psychiatry. 2017;22(2):312–320. | ||
Hirokawa N, Shiomura Y, Okabe S. Tau proteins: the molecular structure and mode of binding on microtubules. J Cell Biol. 198;107(4):1449–1459. | ||
Zhang K, Osakada Y, Vrljic M, Chen L, Mudrakola HV, Cui B. Single molecule imaging of NGF axonal tansport in microfluidic devices. Lab Chip. 2010;10(19):2566–2573. | ||
Penazzi L, Bakota L, Brandt R. Microtubule dynamics in neuronal development, plasticity, and neurodegeneration. Int Rev Cell Mol Biol. 2016;321:89–169. | ||
Smith MA, Zhang LX, Lyons WE, Mamounas LA. Anterograde transport of endogenous brain-derived neurotrophic factor in hippocampal mossy fibers. Neuroreport. 1997;8(8):1829–1834. | ||
Del Prete D, Checler F, Chami M. Ryanodine receptors: physiological function and deregulation in Alzheimer’s disease. Mol Neurodegener. 2014;9:21–36. | ||
Kayad R, Pensalfini A, Margol L, et al. Annular protofibrils are a structurally and functionally distinct type of amyloid oligomer. J Biol Chem. 2009;284(7):4230–4237. | ||
Verma M, Vats A, Taneja V. Toxic species in amyloid disorders: oligomers or mature fibrils. Ann Indian Acad Neurol. 2015;18(2):138–145. | ||
Prangkio P, Yusko EC, Sept D, Yang J, Mayer M. Multivariate analyses of amyloid-beta oligomer populations indicate a connection between pore formation and cytotoxicity. PLoS One. 2012;7(10):e47261. | ||
Bush SF, Paluh JL, Piro G, Rao V, Prasad RV, Eckford A. Defining communication at the bottom. IEEE Trans Mol, Biol Multi-Scale Commun. 2015;1(1):90–97. | ||
Yu W, Baas PW. Changes in microtubule number and length during axon differentiation. J Neurosci. 1994;14(5):2818–2829. | ||
Sheng Z, Cai Q. Mitochondrial transport in neurons: impact on synaptic homeostasis and neurodegeneration. Nat Rev Neurosci. 2012;13(2):77–93. | ||
Simons TB. Calcium and neuronal function. Neurosurg Rev. 1998;11:9–129. | ||
Debanne D. Information processing in the axon. Nat Rev. 2004;5(4):304–316. | ||
Ledderose J, Sención L, Salgado H, Arias-Carrión O, Treviño M. A software tool for the analysis of neuronal morphology data. Int Arch Med. 2014;7(6):1–9. | ||
Feinerman O, Elisha M. Transport of information along unidimensional layered networks of dissociated hippocampal neurons and implications for rate coding. J Neurosci. 2006;26(17):4526–4534. | ||
Amrita T, Neeru A. Finite-volume method to study calcium diffusion in neuron involving JRyR, JSERCA and JLEAK. J Comput. 2011;3(11):41–47. | ||
Fogelson AL, Zucker RS. Presynaptic calcium diffusion from various arrays of single channels. Biophys J. 1985;48(6):1003–1017. | ||
Berridge MJ. Neuronal calcium signalling review. Neuron. 1998;21(7):13–26. | ||
Pierobon M, Akyildiz IF. A physical end-to-end model for molecular communication in nanonetworks. IEEE JSAC. 2010;28(4):602–611. | ||
Nakano T, Suda T, Moore M, Egashira R, Enomoto A, Arima K. Molecular communication for nanomachines using intercellular calcium signaling. In: Fifth IEEE Conference on Nanomachines; July 15, 2005; Japan. | ||
Moore M, Enomoto A, Nakano T, Suda T. Simulation of a molecular motor based communication network. In: Proceedings of the 1st International Conference on Bio-Inspired Models of Network, Information and Computing Systems; Cavalese, Italy; December 11–13, 2006. | ||
Nitta T, Tanahashi A, Hirano M, Hess H. Simulating molecular shuttle movements: Towards computer-aided design of nanoscale transport systems. Lab Chip. 2006;6:881–885. | ||
Pierobon M, Akyildiz IF. Noise analysis in ligand-binding reception for molecular communication in nanonetworks. IEEE Trans Sig Process. 2011;59(9):4168–4182. | ||
Kuran MS, Yilmaz HB, Tugcu T. Modulation techniques for communication via diffusion in nanonetworks. In: 2011 IEEE Conference on Computer Communications Workshops; Kyoto, Japan; June 5–9, 2011. | ||
Masashi U, Berger AJ. Properties and function of low- and high-voltage-activated Ca2+ channels in hypoglossal motoneurons. J Neurosci. 1994;14(9):5652–5660. | ||
Tempia F, Kano M, Schneggenburger R, et al. Fractional calcium current through neuronal AMPA-receptor channels with a low calcium permeability. J Neurosci. 1996;76(2):456–466. | ||
Lodish H, Berk A, Zipursky SL, et al. Microtubule structures (Section 19.1). In: Molecular Cell Biology. 4th ed. New York, NY: W. H. Freeman; 2000. | ||
GitHub, Inc. Available from: https://github.com/Gaurav111195/nano_com. |
Supplementary materials
Knuth’s algorithm
Table S1 summarizes the notations used for the algorithm.
|
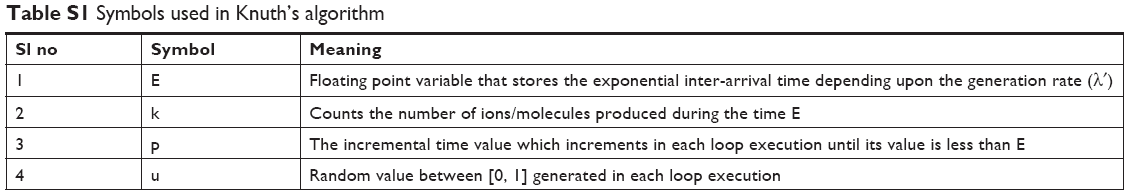 | Table S1 Symbols used in Knuth’s algorithm |
Lagrangian relaxation subgradient optimization algorithm
Table S2 summarizes the notations used for optimization problem.
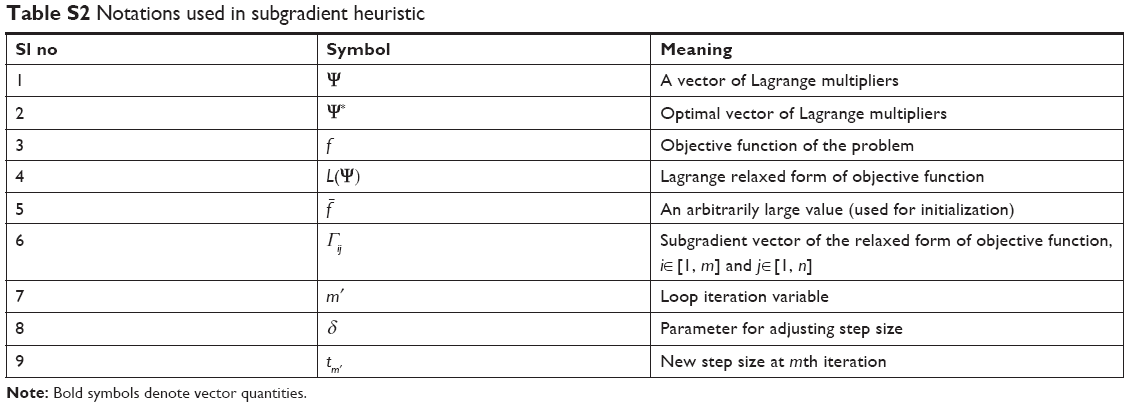 | Table S2 Notations used in subgradient heuristic |
- Lagrangian relaxation
Given an objective function and a set of constraints, the Lagrangian relaxation is used to eliminate several constraints of the problem. In this technique, we multiply the constraints by several non-positive Lagrange multipliers, Ψij, where i∈[1, m], and j∈[1, n], add them to the objective function to get Lagrangian relaxed form of the problem given by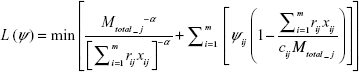
(S1)
Subject to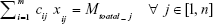
and
The set of feasible solutions for the problem IP is indeed the subset of the set of feasible solutions for Lagrange relaxation of problem IP.1 Then positive values of Ψ ensure that in any feasible solution for problem IP, the expression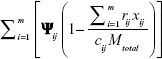 evaluated is non-positive, the value of the Lagrangian in Equation (S1) is never greater than the value of the objective function in problem IP. Thus, whenever the optimization problem IP has a feasible solution, L(Ψ)≤f. For each value of multiplier, L(Ψ) is the lower bound of f. The best possible bound for such a procedure is given by the vector of multipliers Ψ* that satisfies L(Ψ*) = maxΨ≤0L(Ψ).
 - Subgradient heuristic
Various methods are present in literature to produce a vector of optimal Lagrange multipliers for combinatorial optimization problems. The subgradient heuristic is a method to heuristically solve a Lagrangian problem. It iteratively adjusts the Lagrangian multipliers to find values that produce the best or nearly the best lower or upper bound. This was the motivation for using this subgradient procedure.
Let xi(Ψ) be the optimal solution for a specific Lagrange vector Ψ. A subgradient is a vector with coordinates,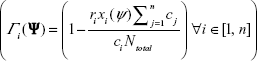
(S2)
Let Ψ* be the optimal Lagrange vectors for the problem. It is shown that when the multipliers are updated using the iterative formula,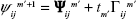
(S3)
then converges to Ψ* if tm′ converges to 0 and
  diverges. The value of tm′ can be updated by the following equation:2,3
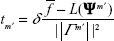
(S4)
It can be shown that if 0 < δ ≤ 2 and  , the sequence in Equation (S2) converges to Ψ*. With
  , tm′ is computed iteratively.
The steps involved in subgradient heuristic are described in detail in a work by Gavish and Hantler.4
References
Riehlman TD, Olmsted ZT, Paluh Janet L. Molecular motors (Chapter 4). In: Xie Y (editor). The Nanobiotechnology Handbook. Boca Raton, FL: CRC Press; 2012:73–111. | ||
Held M, Karp RM. The travelling salesman problem and minimum spanning trees: Part 11. Math Program. 1971;1:6–25. | ||
Held M, Wolfe P, Crowder H. Validation of subgradient optimization. Math Program. 1974;6:62–88. | ||
Gavish B, Hantler SL. An algorithm for optimal route selection networks in SNA Networks. IEEE Trans Commun. 1983;31(10):1154–1161. |
 © 2018 The Author(s). This work is published and licensed by Dove Medical Press Limited. The
full terms of this license are available at https://www.dovepress.com/terms
and incorporate the Creative Commons Attribution
- Non Commercial (unported, 3.0) License.
By accessing the work you hereby accept the Terms. Non-commercial uses of the work are permitted
without any further permission from Dove Medical Press Limited, provided the work is properly
attributed. For permission for commercial use of this work, please see paragraphs 4.2 and 5 of our Terms.
© 2018 The Author(s). This work is published and licensed by Dove Medical Press Limited. The
full terms of this license are available at https://www.dovepress.com/terms
and incorporate the Creative Commons Attribution
- Non Commercial (unported, 3.0) License.
By accessing the work you hereby accept the Terms. Non-commercial uses of the work are permitted
without any further permission from Dove Medical Press Limited, provided the work is properly
attributed. For permission for commercial use of this work, please see paragraphs 4.2 and 5 of our Terms.