Back to Journals » The Application of Clinical Genetics » Volume 12
Mitochondrial DNA D-loop sequencing reveals obesity variants in an Arab population
Authors Eaaswarkhanth M ![]() , Melhem M
, Melhem M ![]() , Sharma P, Nizam R, Al Madhoun A
, Sharma P, Nizam R, Al Madhoun A ![]() , Chaubey G
, Chaubey G ![]() , Alsmadi O, AlOzairi E
, Alsmadi O, AlOzairi E ![]() , Al-Mulla F
, Al-Mulla F ![]()
Received 17 December 2018
Accepted for publication 13 April 2019
Published 24 May 2019 Volume 2019:12 Pages 63—70
DOI https://doi.org/10.2147/TACG.S198593
Checked for plagiarism Yes
Review by Single anonymous peer review
Peer reviewer comments 2
Editor who approved publication: Prof. Dr. Martin Maurer
Muthukrishnan Eaaswarkhanth,1,* Motasem Melhem,1,* Prem Sharma,1 Rasheeba Nizam,1 Ashraf Al Madhoun,1 Gyaneshwer Chaubey,2 Osama Alsmadi,3 Ebaa AlOzairi,1 Fahd Al-Mulla1
1Genetics and Bioinformatics Department, Dasman Diabetes Institute, Dasman, 15462, Kuwait; 2Cytogenetics Laboratory, Department of Zoology, Banaras Hindu University, Varanasi, India; 3Department of Cell Therapy & Applied Genomics, King Hussein Cancer Center, Amman, Jordan
*These authors contributed equally to this work
Background: The association of mitochondrial DNA (mtDNA) variations with obesity has been investigated in diverse populations across the world. However, such obesity-associated mtDNA examinations are rarely conducted in Arab populations.
Materials and methods: We re-sequenced mtDNA displacement loop (D-loop) region of 395 Arab individuals of Kuwait. We categorized the individuals based on their BMI scores as obese (n=232; BMI ≥30 kg/m2), overweight (n=110; BMI ≥25 kg/m2 and <30 kg/m2), and lean (n=53; BMI <25 kg/m2). We performed all the statistical tests by combining obese and overweight individuals in one group. Association analyses were conducted applying Fisher’s exact test and logistic regression model.
Results: We identified that the mtDNA variations m.73A>G, and m.523delAC were positively correlated with obesity, while m.310T>C, and m.16318A>T were negatively associated. All these variants, except m.16318A>T, remain statistically significant after adjusting for age and gender. We found that the variant m.73A>G increases the likelihood of being obese by 6-fold, whereas haplogroup H decreases the probability of being obese in Arab individuals of Kuwait. Haplotype analysis revealed that a haplotype, A263G-C309CT-T310C, defining the H2a clade of H haplogroup, reduces the probability of being obese.
Conclusion: Our study reports, for the first time, the obesity-related mtDNA variants in Arabs of Kuwait. Based on the mtDNA D-loop region variations, we detected particular variants and haplogroup that are related with increased and decreased probability of being obese in the Kuwait Arab population.
Keywords: obesity, mitochondrial DNA, D-loop, haplogroup, haplotype, SNVs
Introduction
Obesity is a disorder defined by the accumulation of surplus body fat, resulting in adverse effects on health. In Kuwait, more than 37% of the adults are obese, which is three times higher than the world average obesity rate (13%).1 It has been shown that obesity increases the risk of comorbid health burdens like diabetes, cardiovascular disease, and cancer among Kuwaiti individuals.1 These alarming health risks could be attributed to constant physical inactivity or sedentary lifestyle, and the high consumption of a calorie-rich diet. Biologically, both these stemming factors lead to improper energy balance in the body, affecting the regular mitochondrial energy metabolism.2 A recent study has shown that obesity could possibly be passed from a mother to her child through the mitochondria.3 Mitochondria are the powerhouses of the cell involved in many biological processes and essential for life. Considering the inimitable characteristic features of mitochondrial genome – such as high copy number, high mutation rate, and maternal inheritance – it is not surprising that both inherited and acquired mitochondrial variations and their association with common complex diseases have been widely studied. However, few studies have shown the association between impaired mitochondrial function and obesity.4,5
The human mitochondrial genome consists of 37 genes to maintain energy production and storage, encoding 13 mRNA, 2 rRNA, and 22 tRNA.6 The non-coding control region of the circular mitochondrial DNA (mtDNA) is about 1,200 base pairs in length and known as the displacement loop (D-loop) region. The D-loop region comprises three hypervariable regions, namely HVS-I, HVS-II, and HVS-III, and regulates mtDNA transcription and replication.7 The mtDNA variations and haplogroups are maternally inherited ancient polymorphisms which classify the different geographical origins of populations. Since haplogroups are defined by the accumulation of variants, which may cause amino acid changes and rates of mtDNA replication and transcription, they are thought to affect mitochondrial function.8 Indeed, several mtDNA variants and haplogroups have reportedly been associated with obesity in different ethnic populations.9–14 For example, D-loop variants m.16292C>T and m.16189T>C were reported to be associated with obesity in a German cohort.9 The mitochondrial haplogroup T has been reported to increase the obesity risk in Austrian Caucasian10 and Southern Italian11 populations. Similarly, haplogroups IWX are also found to be associated with increased obesity risk in North American populations.12 On the contrary, haplogroup X has been associated with lower fat body mass in Caucasians of Northern Europe.13 Amongst several association studies, Grant and colleagues found no relation between mitochondrial variations and obesity in European-American and African-American children.15 It is to be noted that these observations varied from study to study and were based mostly on European populations. As such, Arab populations are underrepresented in such mitochondrial studies. Though several mtDNA variation-based studies explored the maternal lineages and genetic diversity of Arab populations,16–22 to the best of our knowledge, obesity-related investigations are scarce or non-existing. Thus, we analyzed mtDNA D-loop region sequences of obese, overweight, and lean Arab individuals living in Kuwait and characterized D-loop region variants and haplogroups in order to identify a potential link with obesity in this population.
Materials and methods
Study subjects
The 395 Arab samples analyzed in this study were a subset from a larger set collected for genome-wide association study on obesity. All participants were recruited after obtaining written informed consent under protocols approved by the Scientific and Ethics Advisory Boards at the Dasman Diabetes Institute, Kuwait. The participant recruitment, sample collection, and related procedures were conducted in accordance with the Declaration of Helsinki and detailed elsewhere.23,24 On categorizing the study subjects based on BMI scores, we ended up with 232 obese (BMI≥30 kg/m2), 110 overweight (BMI≥25 kg/m2 and <30 kg/m2), and 53 lean (BMI<25 kg/m2) individuals. For all analyses, we combined obese and overweight individuals in a single group. Though the lean group sample size is small, the 53 individuals in the group were well distributed in all the categorical variables and thus were considered to be acceptable for a valid statistical analysis.
mtDNA D-loop region re-sequencing
About 1,200 bp of mtDNA D-loop region was sequenced using primers listed in Table 1. Genomic DNA (25 ng) was subjected to PCR amplification in a final volume of 25 μL using GoTaq® Green Master Mix, 2X (Promega, USA) and 5 pmol of each primer in the corresponding amplification reactions. The reaction was performed using Veriti® Thermal Cyclers (Applied Biosystems, USA) with the following conditions: 5 mins at 95°C initial denaturation for 1 cycle, 35 cycles of 45 sec at 95°C, 45 sec at 58°C and 72°C for 1 min, followed by a final cycle for complete extension for 7 mins at 72°C. Reactions were allowed to stay at 4°C hold step prior to either agarose gel analysis for product QC assessment or for the proceeding sequencing steps. For sequencing, amplified products were purified using ExoSAP-IT (Affymetrix Inc., USA). Then, DNA sequencing reactions were performed using the Big Dye terminator cycle sequencing kit (Applied Biosystems, USA). Each purified product was sequenced from both directions. The sequencing products were cleaned to remove the unincorporated dye terminators using DyeEx 2.0 Spin Kit (Qiagen Inc., Germany). Denaturation steps were carried out on the samples at 95°C for 5 mins prior to loading on the ABI Prism 3730XL Genetic Analyzer (Applied Biosystems, USA) for generation of the sequence reads. The resulting sequences were aligned against the revised Cambridge Reference Sequence (r-CRS)25 using Chromas Pro software (Technelysium Pty Ltd., Australia). The alignment was saved in FASTA format for further analysis.
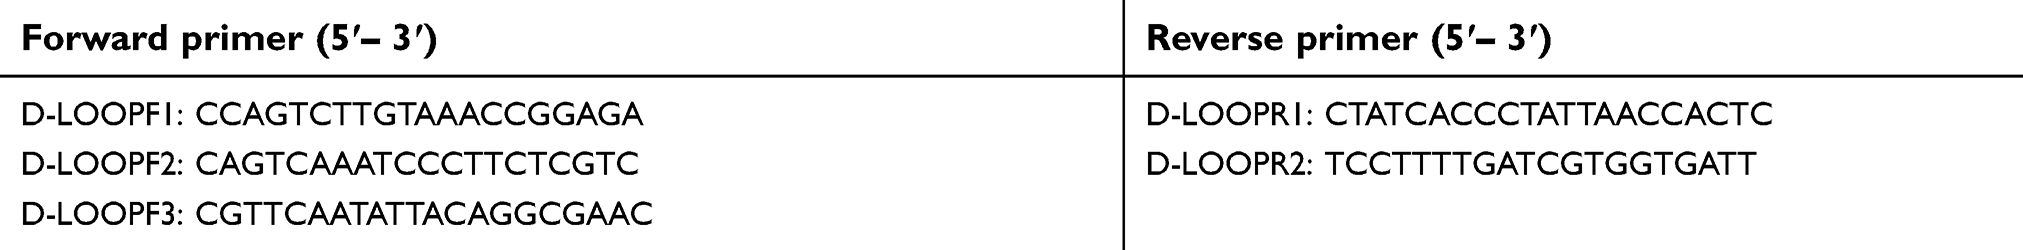 | Table 1 List of primers used for sequencing mtDNA D-loop region |
mtDNA D-loop sequence analysis
The web API option of the Mitomaster tool26 was implemented through perl script for variant calling, annotation, and haplogroup assignment. Mitomaster calls variants relative to r-CRS of the human mtDNA,25 annotates variants based on Mitomap,26 and define haplogroups based on Phylotree build 17.27 All the sequences were aligned online using Clustal Omega.28 The number of variable sites, the haplotype diversity, and nucleotide diversity were determined using DnaSP v6.29 Median-Joining network for H2a haplogroup lineage was drawn using Network version 530 available at
Statistical analysis
All the statistical analysis was carried out using SPSS version 25.0 (IBM Corp, Armonk, NY, USA). The descriptive statistics has been presented as number and percentages for categorical variables. The quantitative variables were ascertained for normal distribution assumption, applying the Kolmogorov–Smirnov test, and presented as mean±standard deviation (SD) as well as median and interquartile (IQ). Chi-square or Fisher’s exact test was applied to find any association or significant differences between categorical variables. Age and anthropometric parameters were compared between lean and obese/overweight groups using non-parametric Mann–Whitney U test, data being skewed. Analysis of variance (ANOVA) with post hoc tests for multiple comparison using Bonferroni correction was applied to see if there was any difference in statistical significance keeping three groups (lean, overweight, obese) or two groups (lean and overweight/obese). Similar results were observed; hence, further analyses were carried out and presented with two groups. The presence of different variants in lean and obese/overweight groups was compared with Chi-square or Fisher’s exact test and found odds ratio (OR) with 95% confidence interval (CI). Logistic regression model was applied to find the odds for the variants influencing obesity, while adjusting for age and gender. The two-tailed probability value p<0.05 was considered statistically significant.
Results
Study population
We re-sequenced and analyzed mtDNA D-loop region of 395 Arab individuals, of which 342 (86.6%) were obese or overweight and 53 (13.4%) lean (Table 2). In the study population, there was a higher proportion of females than males, and the majority of individuals were Kuwaiti nationals. We found no significant differences between lean and obese/overweight individuals with regards to gender or nationality status. However, the mean age was significantly higher in the obese/overweight group compared with the lean group (p<0.001) and included individuals aged between 14 and 92 years old. No significant difference in height was found between the two groups, though weight, BMI, and waist circumference were significantly higher in the obese/overweight group compared with the lean group (p<0.001).
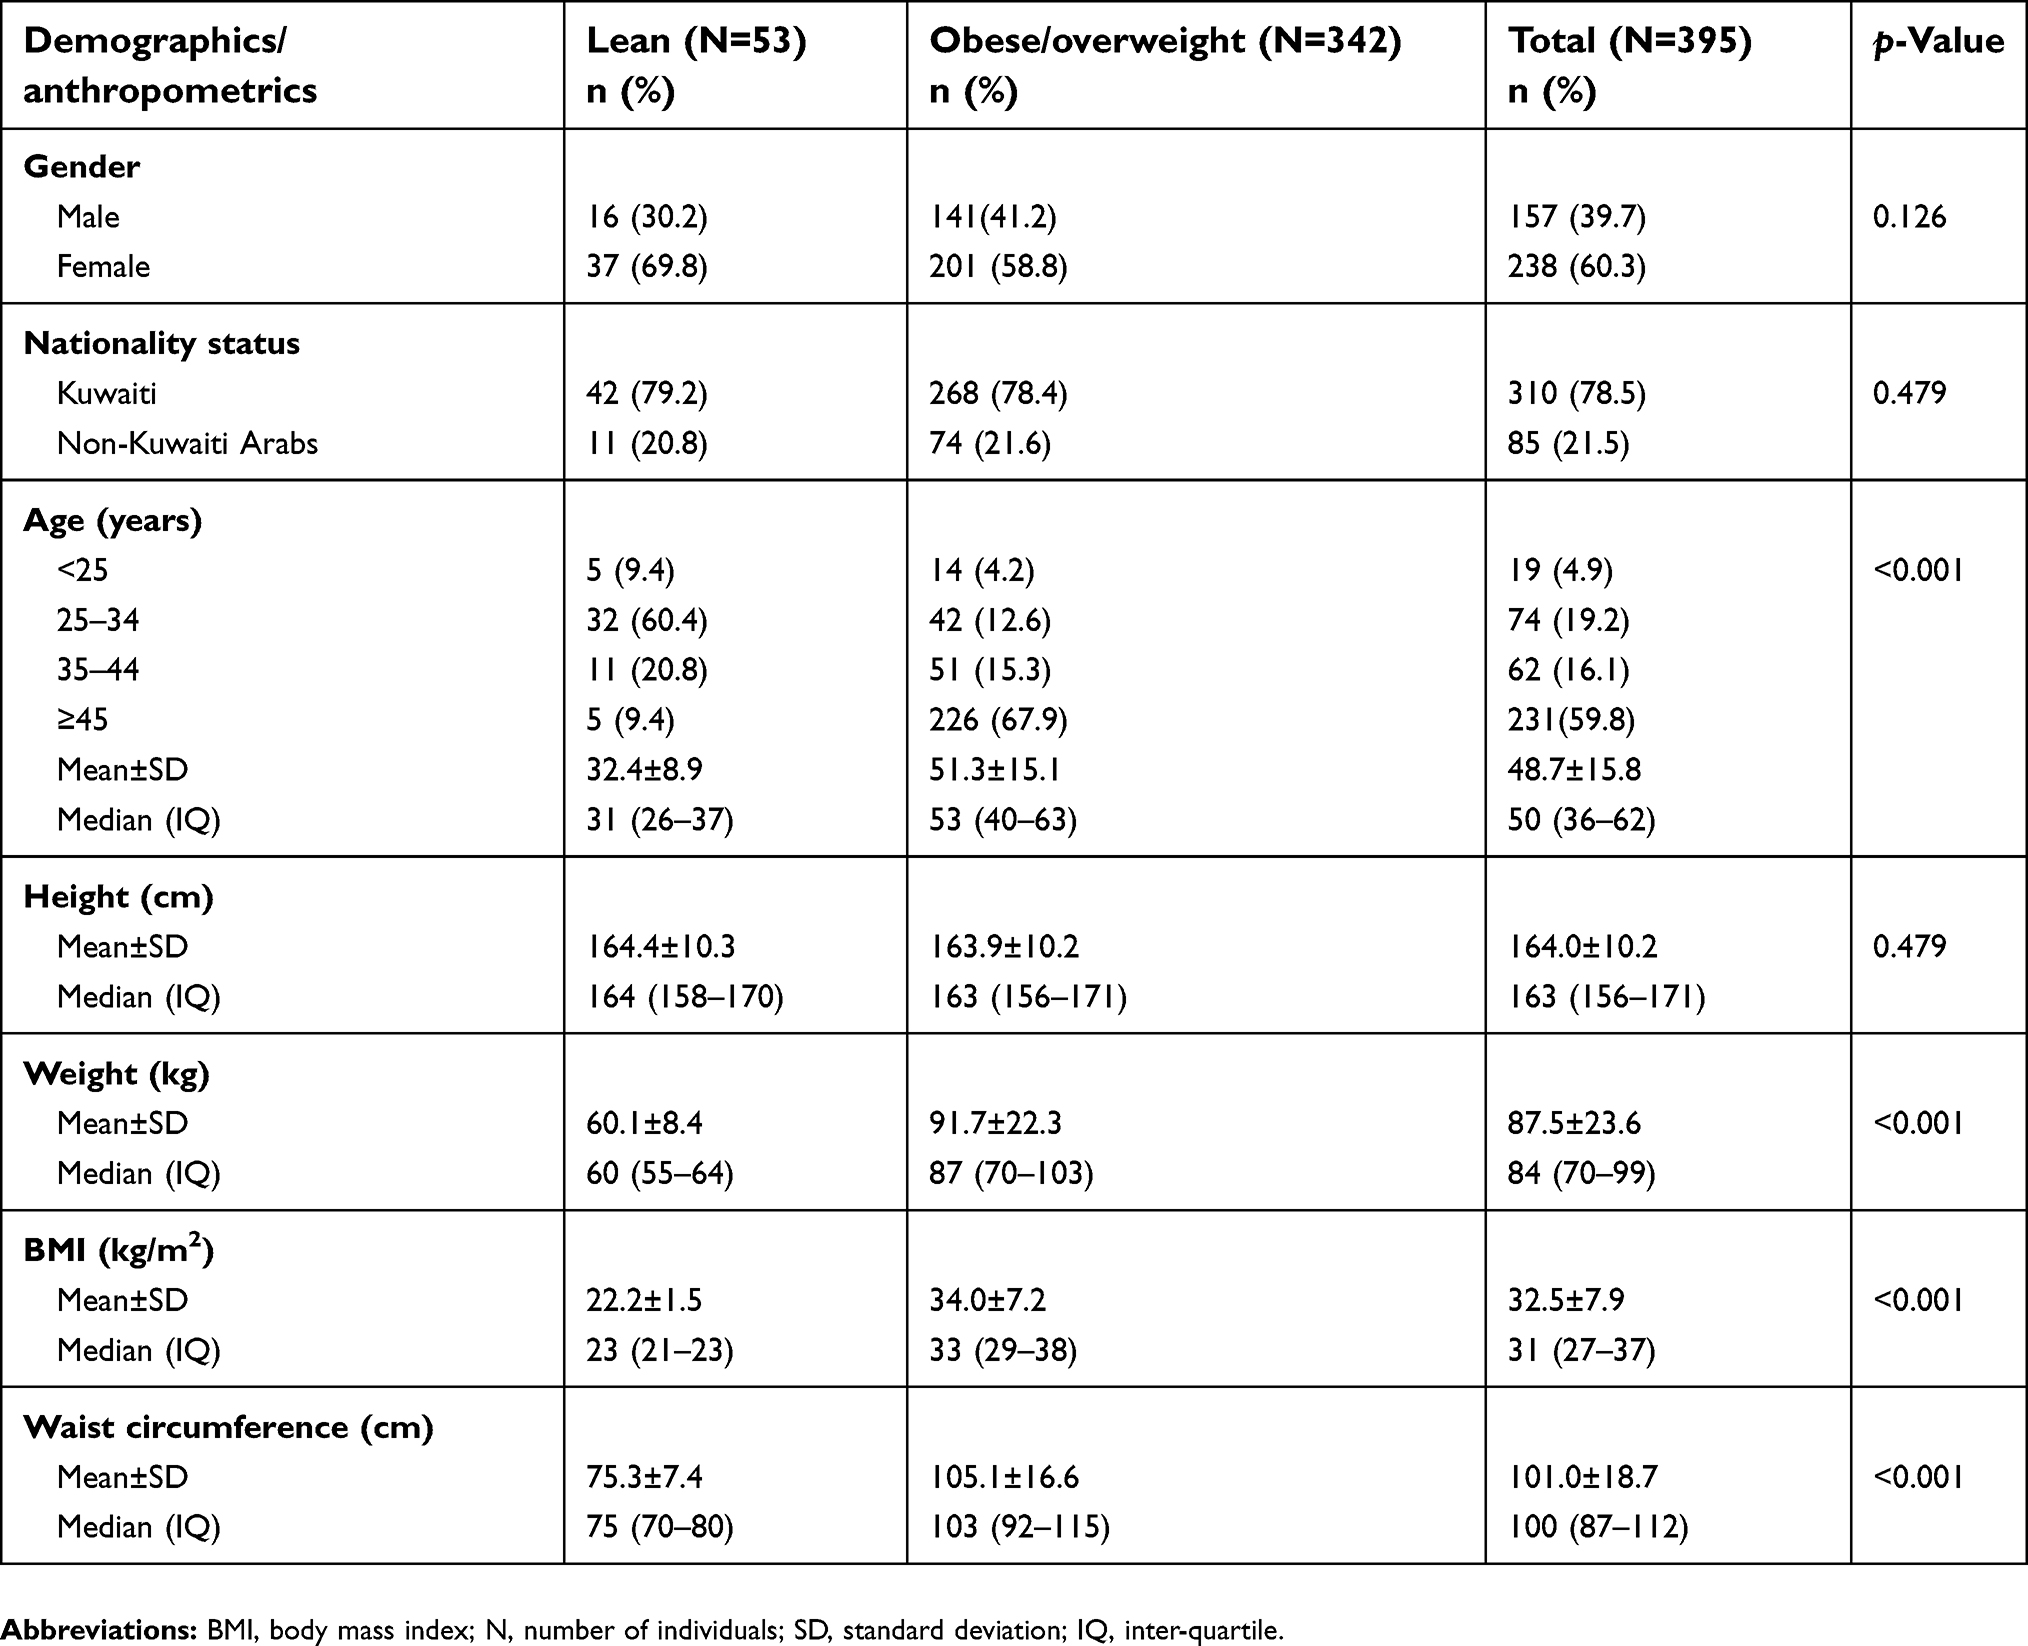 | Table 2 Demographics and anthropometric parameters of the study population |
mtDNA D-loop variation
Single-nucleotide variants (SNVs)
We analyzed the mtDNA D-loop region sequences for single-nucleotide variants (SNVs) and detected 319 SNVs, of which 302 were found in obese/overweight individuals and 99 were found in lean individuals, with a nucleotide diversity (π) of 0.019. We observed a high frequency (>50%) of specific variants in lean individuals, including: m.263A>G (96.23%), m.310T>C (86.8%), and m.16519T>C (56.6%). Variants found at high frequency in obese/overweight individuals included: m.263A>G (98.54%), m.73A>G (75.15%), m.310T>C (67.8%) and m.16519T>C (57.31%) (
Insertions and deletions (INDELs)
We have also investigated the presence of insertions and deletions (INDELs) in the D-loop region of mtDNA and identified 84 INDELs (51 insertions and 33 deletions) in the study population. Of these, 16 insertions and 10 deletions were found in lean individuals, while 49 insertions and 27 deletions were found in obese/overweight individuals (
Haplogroup diversity
We defined 94 mtDNA haplogroups in our study population, based on 337 highly diverse (Hd=0.999) haplotypes (
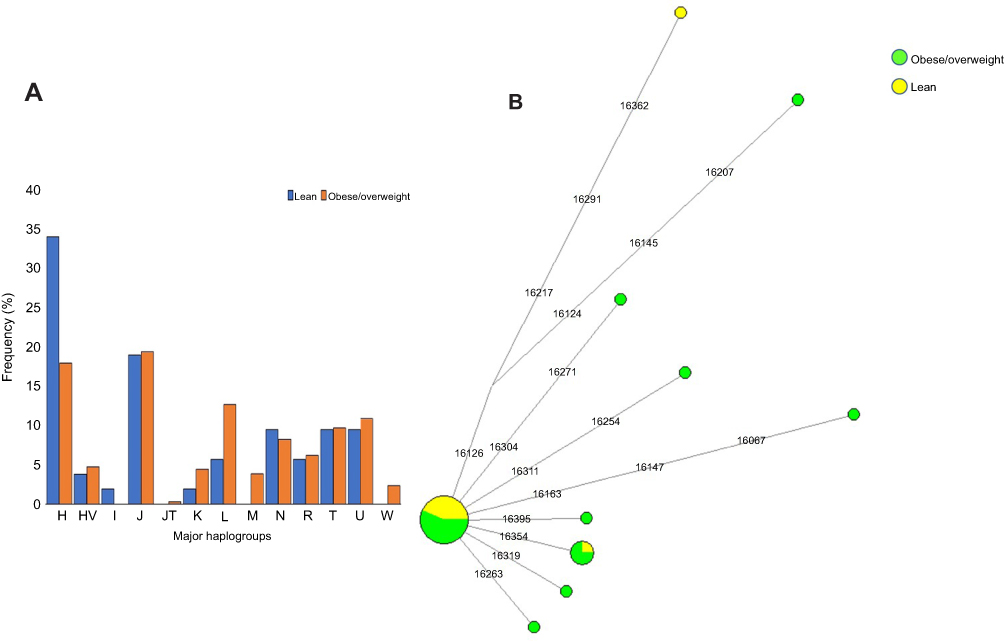 | Figure 1 (A) Distribution of major mitochondrial DNA haplogroups in lean and obese/overweight groups. (B) Median-Joining network tree constructed for H2a haplogroup based on the mitochondrial DNA hypervariable segment I (HVS-I) region. |
mtDNA D-loop variants associated with obesity
We tested the association of mtDNA D-loop variants with obesity risk in lean and obese/overweight individuals. Logistic regression analysis revealed that the variants m.73A>G (OR=4.989, 95% CI: 2.718–9.156) and m.523delAC (OR=3.381, 95% CI: 1.019–11.724) positively correlated with obesity (Table 3). After adjusting for age and gender, individuals who had the variants m.73A>G and m.523delAC were six and four times more likely of being obese, respectively. The variants m.310T>C (OR=0.321, 95% CI: 0.140-0.734; p=0.007) and m.16318A>T (OR=0.219, 95% CI: 0.060–0.803; p=0.022) were found to be negatively associated with obesity but statistical significance after adjusting for age and gender remained only in m.310T>C. These variants showed similar associations with obesity when tested overweight and obese groups separately, ie, lean vs overweight and lean vs obese (
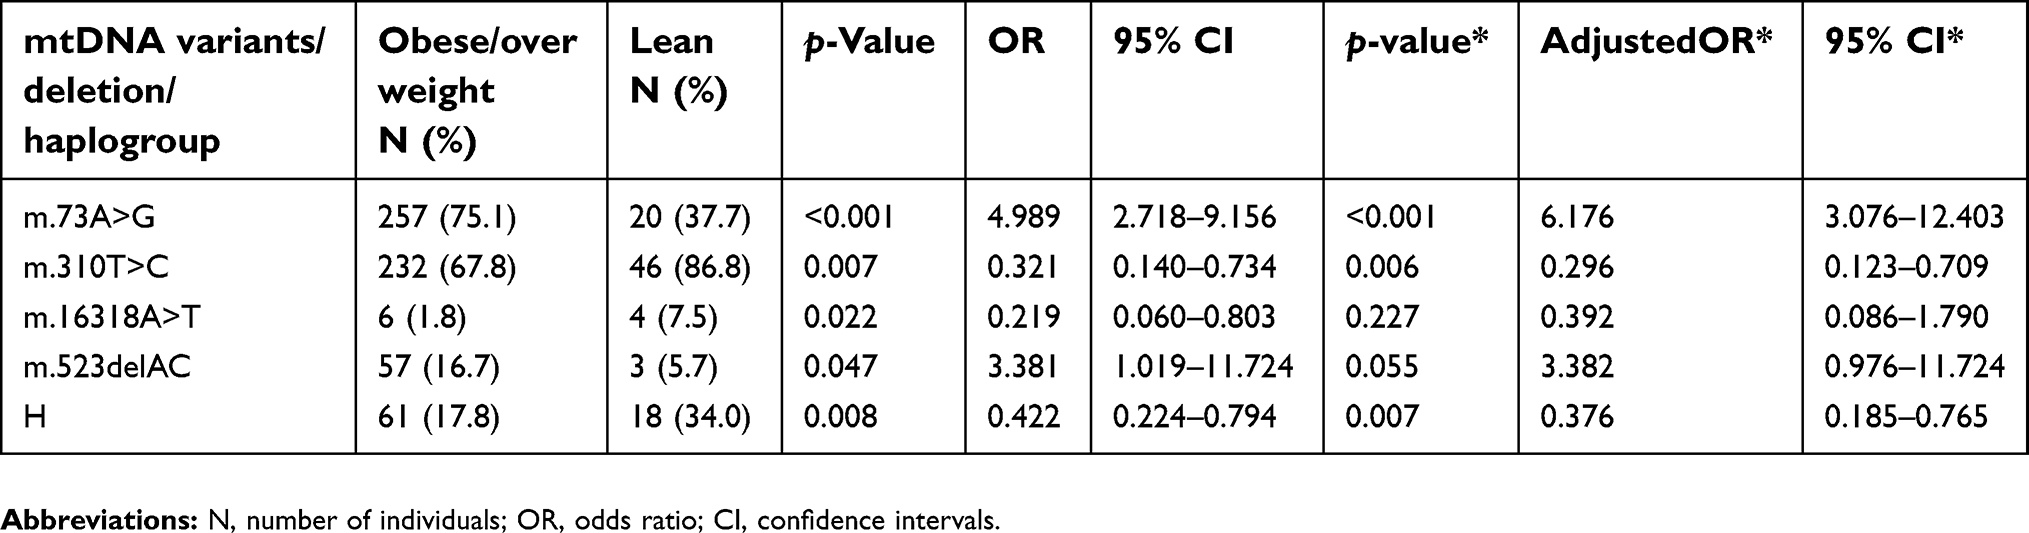 | Table 3 Selected mitochondrial D-loop variants and haplogroup in the study population |
Discussion
A number of studies explored mtDNA haplogroups and variants associated with obesity in diverse global populations.9–14 However, populations from the Arabian Peninsula region have not been subjected to such investigations. Our study reports the obesity-related mtDNA variants in Arabs living in Kuwait. We observed high haplotype diversity (Hd=0.999) and low nucleotide diversity (π=0.019). We found a significantly higher frequency of haplogroup H in lean individuals when compared with obese/overweight individuals. Thus, this indicates that Arab individuals of Kuwait with mtDNA haplogroup lineage H are less likely to be obese. While another study13 on Northern Europeans reported a strong association between haplogroup lineage X and lower BMI and body fat mass. Population-specific observations are common in such mitochondrial haplogroup-based association studies. Generally, in genome-wide disease association studies (GWAS), significance is confirmed after adjusting for confounding factors including age, gender, population stratification, and genetic ancestry. In our association analysis, age and gender were only adjusted as all study individuals belong to Arab ethnicity and their population structure has been well-defined in our previous genome-wide association studies.24,31,32 Since all three groups (lean, overweight, and obese) are only of Arabian descent, their haplogroup distribution should be similar to that of the Middle Eastern region.
Interestingly, the variant m.73A>G, which is present in almost all lineages nested under mtDNA major haplogroup R but absent in haplogroup H, occurs significantly more frequently in obese/overweight than in lean individuals. Therefore, we could infer that Arab individuals of Kuwait carrying the mtDNA variant m.73A>G have six times higher probability of being obese. Similarly, individuals with m.523delAC variant were four times more likely to be obese.
It is intriguing to speculate that individuals belonging to the H haplogroup and those not carrying m.73A>G variant have reduced probability of being obese. Most of the H lineage individuals from this study belonged to H2a clade (35.44%), defined by 28 haplotypes. Only 4 of these 28 haplotypes were shared among individuals of the H2a haplogroup, while the remaining 24 were unique. Among the four shared haplotypes, two were common within obese individuals, one within lean individuals, and the other one was shared between lean and overweight individuals (Figure 1B). The H2a maternal lineage has been reported to be common in Saudi Arabia population.33,34 Our comprehensive haplotype analysis revealed a specific haplotype of the H2a haplogroup carried only by lean individuals (A263G-C309CT-T310C) that likely reduces the probability of being obese in the study individuals. Notably, we detected a negative association between the variant m.310T>C and obesity. Thus, our observation that individuals who belong to an H2a haplogroup defined by the haplotype A263G-C309CT-T310C containing the variant m.310T>C are mostly lean, may pinpoint an anti-obesity mtDNA variation in the Arab population living in Kuwait. Therefore, individuals who belong to the common Middle Eastern maternal lineage H are more likely to be lean. On the other hand, it is important to consider that the sedentary lifestyle common in the region increases the risk of obesity in the population, which in turn affects mitochondrial metabolism, and possibly impact the mtDNA genetic variation as well.4,5 Further studies are needed to understand how population-specific mtDNA variation influences the differential energy balancing process and metabolism.35,36
This study has a limitation with respect to the resolution of mitochondrial haplogroup classification. In this study, we only re-sequenced the D-loop region of the mitochondrial genome that allows samples to be broadly classified into haplogroups, with relatively few SNPs that define subclades of the major haplogroups. Our future large-scale study plan includes sequencing the complete mitochondrial genome to obtain finer resolution for the in-depth understanding of the association between mitochondrial genome variation and energy balance in the population of Kuwait.
Conclusion
Our study is the first to provide an overview of obesity-related mtDNA variants prevalent in the Kuwait Arab population. Making use of the mtDNA D-loop region variation, we identified specific variants and haplogroups which associated with increased and decreased likelihood of being obese in Arab individuals of Kuwait. We propose that along with genetic predisposition, lifestyle, and environmental factors, mtDNA variation should also be considered as an important risk factor for obesity and associated complications.
Acknowledgments
We are thankful to all the participants for providing blood samples to conduct the present study. This study was supported by Kuwait Foundation for the Advancement of Sciences. We highly acknowledge the editorial support provided by Diana Marouco. Also, we acknowledge the members of the National Dasman Diabetes BioBank Core Facility for sample processing and DNA extraction.
Disclosure
The authors report no conflicts of interest in this work.
References
1.
2. Putti R, Sica R, Migliaccio V, Lionetti L. Diet impact on mitochondrial bioenergetics and dynamics. Front Physiol. 2015;6:109. doi:10.3389/fphys.2015.00098
3. Saben JL, Boudoures AL, Asghar Z, et al. Maternal metabolic syndrome programs mitochondrial dysfunction via germline changes across three generations. Cell Rep. 2016;16(1):1–8. doi:10.1016/j.celrep.2016.05.065
4. Bournat JC, Brown CW. Mitochondrial dysfunction in obesity. Curr Opin Endocrinol Diabetes Obes. 2010;17(5):446–452. doi:10.1097/MED.0b013e32833c3026
5. de Mello AH, Costa AB, Engel JDG, Rezin GT. Mitochondrial dysfunction in obesity. Life Sci. 2018;192:26–32. doi:10.1016/j.lfs.2017.11.019
6. Anderson S, Bankier AT, Barrell BG, et al. Sequence and organization of the human mitochondrial genome. Nature. 1981;290(5806):457–465.
7. Greenberg BD, Newbold JE, Sugino A. Intraspecific nucleotide sequence variability surrounding the origin of replication in human mitochondrial DNA. Gene. 1983;21(1–2):33–49.
8. Kenney MC, Falatoonzadeh P, Atilano SR, et al. African-origin mitochondrial DNA variants as a contributing factor to susceptibilities for diabetes and age-related diseases. Int J Diabetes Res Clin Pract. 2016;3(1). doi:10.23937/2377-3634/1410053
9. Knoll N, Jarick I, Volckmar A-L, et al. Mitochondrial DNA variants in obesity. PLoS One. 2014;9(5):e94882. doi:10.1371/journal.pone.0094882
10. Ebner S, Mangge H, Langhof H, et al. Mitochondrial haplogroup T is associated with obesity in Austrian juveniles and adults. PLoS One. 2015;10(8):e0135622. doi:10.1371/journal.pone.0135622
11. Nardelli C, Labruna G, Liguori R, et al. Haplogroup T is an obesity risk factor: mitochondrial DNA haplotyping in a morbid obese population from southern Italy. Biomed Res Int. 2013;2013:631082. doi:10.1155/2013/631082
12. Veronese N, Stubbs B, Koyanagi A, et al. Mitochondrial genetic haplogroups and incident obesity: a longitudinal cohort study. Eur J Clin Nutr. 2018;72(4):587–592. doi:10.1038/s41430-018-0097-y
13. Yang T-L, Guo Y, Shen H, et al. Genetic association study of common mitochondrial variants on body fat mass. PLoS One. 2011;6(6):e21595. doi:10.1371/journal.pone.0021595
14. Flaquer A, Baumbach C, Kriebel J, et al. Mitochondrial genetic variants identified to be associated with BMI in adults. PLoS One. 2014;9(8):e105116. doi:10.1371/journal.pone.0105116
15. Grant SFA, Glessner JT, Bradfield JP, et al. Lack of relationship between mitochondrial heteroplasmy or variation and childhood obesity. Int J Obes. 2012;36(1):80–83. doi:10.1038/ijo.2011.206
16. Abu-Amero KK, Larruga JM, Cabrera VM, González AM. Mitochondrial DNA structure in the Arabian Peninsula. BMC Evol Biol. 2008;8:45. doi:10.1186/1471-2148-8-45
17. Theyab JB, Al-Bustan S, Crawford MH. The genetic structure of the Kuwaiti population: mtDNA Inter- and intra-population variation. Hum Biol. 2012;84(4):379–403. doi:10.3378/027.084.0403
18. Fernandes V, Triska P, Pereira JB, et al. Genetic stratigraphy of key demographic events in Arabia. PLoS One. 2015;10(3):e0118625. doi:10.1371/journal.pone.0118625
19. Al-Rashedi NAM, Jebor MA, Mousa TAH. Mitochondrial DNA markers in Arabic Iraqi population. Eur J Forensic Sci. 2016;3(3):1.
20. Černý V, Čížková M, Poloni ES, Al-Meeri A, Mulligan CJ. Comprehensive view of the population history of Arabia as inferred by mtDNA variation. Am J Phys Anthropol. 2016;159(4):607–616. doi:10.1002/ajpa.22920
21. Gandini F, Achilli A, Pala M, et al. Mapping human dispersals into the Horn of Africa from Arabian Ice Age refugia using mitogenomes. Sci Rep. 2016;6:25472. doi:10.1038/srep25472
22. Elkamel S, Boussetta S, Khodjet-El-Khil H, Benammar Elgaaied A, Cherni L. Ancient and recent Middle Eastern maternal genetic contribution to North Africa as viewed by mtDNA diversity in Tunisian Arab populations. Am J Hum Biol. 2018;30(3):e23100. doi:10.1002/ajhb.v30.3
23. Alsmadi O, Melhem M, Hebbar P, et al. Leptin in association with common variants of MC3R mediates hypertension. Am J Hypertens. 2014;27(7):973–981. doi:10.1093/ajh/hpt285
24. Hebbar P, Alkayal F, Nizam R, et al. The TCN2 variant of rs9606756 [Ile23Val] acts as risk loci for obesity-related traits and mediates by interacting with Apo-A1: TCN2 Variant as Risk Loci for Waist Circumference. Obesity. 2017;25(6):1098–1108. doi:10.1002/oby.21826
25. Andrews RM, Kubacka I, Chinnery PF, Lightowlers RN, Turnbull DM, Howell N. Reanalysis and revision of the Cambridge reference sequence for human mitochondrial DNA. Nat Genet. 1999;23(2):147. doi:10.1038/70539
26. Lott MT, Leipzig JN, Derbeneva O, et al. mtDNA variation and analysis using mitomap and mitomaster. Curr Protoc Bioinformatics. 2013;44(1.23):1–26.
27. van Oven M. PhyloTree build 17: growing the human mitochondrial DNA tree. Forensic Sci Int Genet Suppl Ser. 2015;5:e392–e394.
28. Sievers F, Higgins DG. Clustal Omega, accurate alignment of very large numbers of sequences. Methods Mol Biol. 2014;1079:105–116.
29. Rozas J, Ferrer-Mata A, Sánchez-DelBarrio JC, et al. DnaSP 6: DNA sequence polymorphism analysis of large data sets. Mol Biol Evol. 2017;34(12):3299–3302. doi:10.1093/molbev/msx248
30. Bandelt HJ, Forster P, Röhl A. Median-joining networks for inferring intraspecific phylogenies. Mol Biol Evol. 1999;16(1):37–48. doi:10.1093/oxfordjournals.molbev.a026036
31. Alsmadi O, Thareja G, Alkayal F, et al. Genetic substructure of Kuwaiti population reveals migration history. PLoS One. 2013;8(9):e74913. doi:10.1371/journal.pone.0074913
32. Hebbar P, Elkum N, Alkayal F, John SE, Thanaraj TA, Alsmadi O. Genetic risk variants for metabolic traits in Arab populations. Sci Rep. 2017;7:40988. doi:10.1038/srep40988
33. Loogväli E-L, Roostalu U, Malyarchuk BA, et al. Disuniting uniformity: a pied cladistic canvas of mtDNA haplogroup H in Eurasia. Mol Biol Evol. 2004;21(11):2012–2021. doi:10.1093/molbev/msh209
34. Roostalu U, Kutuev I, Loogväli E-L, et al. Origin and expansion of haplogroup H, the dominant human mitochondrial DNA lineage in West Eurasia: the Near Eastern and Caucasian perspective. Mol Biol Evol. 2007;24(2):436–448. doi:10.1093/molbev/msl173
35. Tranah GJ, Manini TM, Lohman KK, et al. Mitochondrial DNA variation in human metabolic rate and energy expenditure. Mitochondrion. 2011;11(6):855–861. doi:10.1016/j.mito.2011.04.005
36. Pichaud N, Ballard JWO, Tanguay RM, Blier PU. Naturally occurring mitochondrial DNA haplotypes exhibit metabolic differences: insight into functional properties of mitochondria. Evolution. 2012;66(10):3189–3197. doi:10.1111/j.1558-5646.2012.01683.x
 © 2019 The Author(s). This work is published and licensed by Dove Medical Press Limited. The
full terms of this license are available at https://www.dovepress.com/terms
and incorporate the Creative Commons Attribution
- Non Commercial (unported, 3.0) License.
By accessing the work you hereby accept the Terms. Non-commercial uses of the work are permitted
without any further permission from Dove Medical Press Limited, provided the work is properly
attributed. For permission for commercial use of this work, please see paragraphs 4.2 and 5 of our Terms.
© 2019 The Author(s). This work is published and licensed by Dove Medical Press Limited. The
full terms of this license are available at https://www.dovepress.com/terms
and incorporate the Creative Commons Attribution
- Non Commercial (unported, 3.0) License.
By accessing the work you hereby accept the Terms. Non-commercial uses of the work are permitted
without any further permission from Dove Medical Press Limited, provided the work is properly
attributed. For permission for commercial use of this work, please see paragraphs 4.2 and 5 of our Terms.