Back to Journals » OncoTargets and Therapy » Volume 11
miRNA-543 promotes cell migration and invasion by targeting SPOP in gastric cancer
Authors Xu J, Wang F, Wang X, He Z ![]() , Zhu X
, Zhu X
Received 2 January 2018
Accepted for publication 20 March 2018
Published 21 August 2018 Volume 2018:11 Pages 5075—5082
DOI https://doi.org/10.2147/OTT.S161316
Checked for plagiarism Yes
Review by Single anonymous peer review
Peer reviewer comments 3
Editor who approved publication: Dr Ingrid Espinoza
Junfei Xu,1,2 Feiran Wang,2 Xi Wang,3 Zhixian He,2 Xinguo Zhu1
1Department of General Surgery, First Affiliated Hospital, Soochow University, Suzhou, People’s Republic of China; 2Department of General Surgery, Affiliated Hospital, Nantong University, Nantong, People’s Republic of China; 3Medical College of Nantong University, Nantong, People’s Republic of China
Background/purpose: Given the emerging role of microRNA (miRNA) in cancer progression, we investigated the role and mechanism of miRNA-543 (miR-543) in gastric cancer (GC).
Materials and methods: Real-time quantitative polymerase chain reaction was conducted to quantify the expression of miR-543. Luciferase reporter assay was used to confirm the association between speckle-type POZ protein (SPOP) and 3'-UTR. Moreover, the role of miR-543 and SPOP in GC was detected using transwell assays. In addition, we investigated the function of miR-543 in the epithelial–mesenchymal transition (EMT) progression.
Results: miR-543 was upregulated in GC. We identified SPOP as a direct target of miR-543, revealing its expression to be inversely correlated with miR-543 expression in GC tissues. Moreover, restoration of SPOP could inhibit miR-543-induced GC cell migration and invasion, whereas downregulation of miR-543 inhibited cell migration and invasion, which was partly abrogated by SPOP knockdown. Furthermore, our data also showed that miR-543 induced EMT of GC cells.
Conclusion: Our results demonstrated that miR-543 functions as a crucial oncogenic miRNA in GC. It exerts strong tumor-promoting effects through targeting SPOP in GC cell migration and invasion.
Keywords: gastric cancer, miR-543, SPOP, EMT, invasion and migration
Introduction
Gastric cancer (GC) is the fourth most common cancer and the second leading cause of cancer mortality in the world.1 The high rate of mortality may be due to difficulties in diagnosing it at an early stage and lack of effective treatments for patients with an advanced or recurrent disease. Therefore, determining the precise molecular mechanisms underlying the development and progression of GC can provide the basis for molecular treatment strategies.2
MicroRNAs (miRNAs) are small single-stranded noncoding RNAs that regulate gene expression at the posttranscriptional level by binding to the 3′-UTR (untranslated region) of the target mRNA, thereby causing translational repression or degradation.3 miRNAs play important roles in diverse biological processes, including those involved in development and cell growth, differentiation, and apoptosis.4 An increasing number of studies have demonstrated that miRNAs can function as oncogenes or tumor suppressors. Moreover, aberrant miRNA expression has been frequently observed in various types of human tumors.5 Recent studies indicate that miRNA-543 (miR-543) promotes GC cell proliferation and cell cycle progression by directly targeting SIRT1.6 However, the role of miR-543 and speckle-type POZ protein (SPOP) in the regulation of invasive phenotype of GC cells remains unclear.
In the present study, we found that miR-543 is significantly upregulated in GC tissues. We further identified SPOP as a target gene of miR-543. Our data also showed that SPOP apparently abrogated the effect of miR-543 on GC cell migration and invasion. Furthermore, we identified a mechanism by which miR-543 induced epithelial–mesenchymal transition (EMT) of GC cells. Collectively, our study demonstrated that miR-543 may represent a new potential therapeutic target for GC by targeting SPOP.
Materials and methods
Tissue specimens, cell culture, and transfection
A total of 36 pairs of human GC and adjacent non-tumor tissues were collected between 2015 and 2016 at Affiliated Hospital of Nantong University. Tissue samples were immediately snap-frozen in liquid nitrogen. Both tumor tissues and adjacent non-tumor tissues were histologically examined. All patients provided written informed consent, and this project was approved by the Institute Research Ethics Committee at the Affiliated Hospital of Nantong University.
Human GC cell lines (MKN45 and AGS cells) were purchased from Cell Bank of Chinese Academy of Sciences (Shanghai, People’s Republic of China). All cell lines were maintained in Dulbecco’s Modified Eagle’s Medium (Thermo Fisher Scientific, Waltham, MA, USA) supplemented with 10% fetal bovine serum and were maintained in a humidified incubator at 37°C with 5% CO2.
For transfection, cells were seeded at 50% confluence, and 16 h later, were transfected with miR-543 mimics/inhibitor or pcDNA-3.1-SPOP plasmids with Lipofectamine 2000 (Thermo Fisher Scientific) according to the manufacturer’s instruction. The scramble miRNA or pcDNA-3.1 plasmid was used as negative controls. Cells were harvested after 48 h for the subsequent experiments.
Real-time quantitative polymerase chain reaction (qPCR)
Total RNA was extracted from cells or frozen tissues using Trizol, and then cDNA was synthesized with TaqMan MicroRNA Reverse Transcription Kit (Thermo Fisher Scientific)/PrimeScript RT Master Mix (Perfect Real Time; TaKaRa) according to the manufacturer’s instructions. Reaction mixture was used for qPCR with TaqMan 2× Universal PCR Master Mix (Applied Biosystems) under the following conditions: preliminary denaturation at 96°C for 2 min, followed by 40 cycles of denaturation at 96°C for 15 s, annealing at 60°C for 1 min, and elongation at 60°C for 1 min. The primers used for real-time qPCR were as follows: miR-543: forward primer: 5′-TGGCAAAGGAGCAGATTAGTAGG-3′, reverse primer: 5′-CTGCCACAAGCCACTAGAGGATAAGA-3′; SPOP: forward primer: 5′-TGACCACCAGGTAGACAGCG-3′, reverse primer: 5′-CCCGTTTCCCCCAAGTTA-3′. The relative expression levels of each gene were calculated and normalized using the 2−ΔΔCt method relative to U6 or β-actin. All of the reactions were run in triplicate.
Western blot analysis
Cells were lysed with RIPA buffer (Bio-Rad). Lysates were separated by sodium dodecyl sulfate polyacrylamide gel electrophoresis, followed by transferring to polyvinylidene difluoride membranes (EMD Millipore, Billerica, MA, USA). After blocking with 5% nonfat dry milk in tris-buffered saline/Tween (TBST) buffer at room temperature for 1 h, the membranes were incubated overnight at 4°C with primary antibodies. After washing with TBST, the membranes were incubated with secondary antibodies at room temperature for 1 h. Protein bands were visualized with the electrochemiluminescence detection system. β-Actin was used as a loading control.
Luciferase reporter assay
For the luciferase reporter assay, the pGL3 plasmid encoding a luciferase reporter gene was purchased from Promega (Madison, WI, USA). Recombinant plasmid of pGL3-SPOP-3′-UTR (wild-type) or pGL3-SPOP-3′-UTR-mut (mutant type) was constructed in our laboratory. GC cells (1–2×10⁵ cells/well) were seeded in a 24-well plate and cotransfected with 40 nM of either miR-543 mimics or miRNA control, 20 ng of either pGL3-SPOP-3′-UTR or pGL3-SPOP-3′-UTR-mut, and 2 ng of pRL-TK (Promega) by using Lipofectamine 2000. The pRL-TK vector was used as a normalization control. Luciferase activity was measured 48 h later with a dual-luciferase assay system (Promega). Luciferase activity ratios were presented as firefly luciferase values/Renilla luciferase values.
Cell migration and invasion assay
Cells were starved in serum-free DMEM (Thermo Fisher Scientific) for 24 h after transfection of 48 h, and then culturing was performed using 6.5 mm transwell chambers with 8 μm pores (Corning Incorporated, Corning, NY, USA). In brief, the bottom surface of each membrane was coated with fibronectin. Then, GC cell (1×10⁵ cells) suspension was seeded into the upper chambers, and 600 μL of complete medium was added into the lower chambers. After incubating at 37°C for 24 h, the upper surface of each membrane was cleaned with a cotton swab. Cells adhering to the bottom surface of each membrane were fixed with 4% paraformaldehyde in phosphate-buffered saline and stained with 0.1% crystal violet. The migrated and invaded cells were counted and photographed at ×200 magnification in five random fields of view, and mean ± SD was calculated accordingly.
Statistical analysis
All statistical analyses were performed using SPSS 18.0 (SPSS Inc., Chicago, IL, USA). All data were analyzed using the Student’s t-test, and all the tests performed were two-sided. Correlation of miR-543 expression with SPOP expression was analyzed using Pearson correlation test. P<0.05 was considered to indicate a statistically significant difference. All data are presented as the mean ± SD from at least three independent replicates.
Results
miR-543 is upregulated in GC tissues and cell lines
The expression level of miR-543 in a total of 36 matched GC tissues and adjacent normal tissues was analyzed using qPCR. miR-543 level was found to be higher in GC tissues compared to paired normal tissues (P<0.001; Figure 1A). Moreover, we performed qPCR to measure the expression of SPOP mRNA in 36 freshly collected GC tissues and adjacent non-tumorous tissues. Compared with matched non-tumorous tissues, GC tissues exhibited lower expression levels of SPOP mRNA (P<0.001; Figure 1B). A significant inverse correlation was confirmed between the levels of miR-543 and SPOP mRNA expression (r2 =0.3871, P<0.001; Figure 1C).
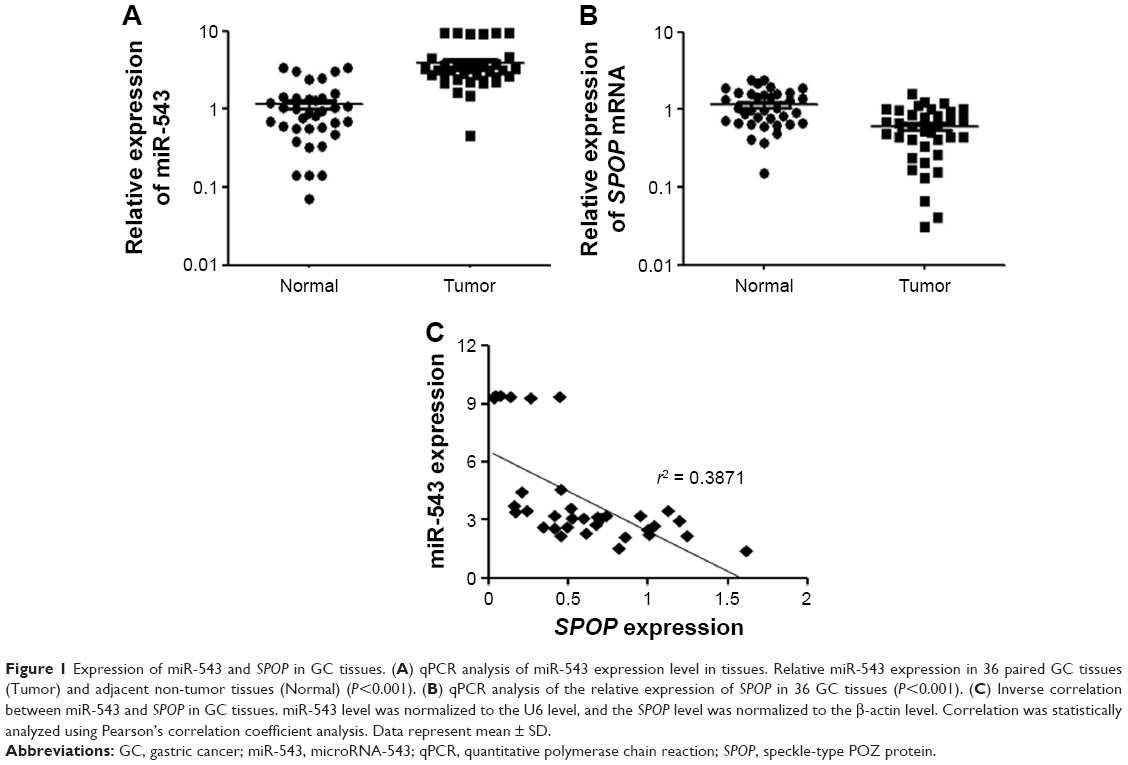 | Figure 1 Expression of miR-543 and SPOP in GC tissues. (A) qPCR analysis of miR-543 expression level in tissues. Relative miR-543 expression in 36 paired GC tissues (Tumor) and adjacent non-tumor tissues (Normal) (P<0.001). (B) qPCR analysis of the relative expression of SPOP in 36 GC tissues (P<0.001). (C) Inverse correlation between miR-543 and SPOP in GC tissues. miR-543 level was normalized to the U6 level, and the SPOP level was normalized to the β-actin level. Correlation was statistically analyzed using Pearson’s correlation coefficient analysis. Data represent mean ± SD. |
SPOP is a direct target of miR-543
To understand the molecular mechanism for the function of miR-543 in GC, several computational methods were used to identify miR-543 targets, and the predicted correlation between the 3′-UTR of SPOP and miR-543 is shown in Figure 2A. To further investigate whether SPOP was a direct target of miR-543, a luciferase reporter assay was conducted. The results revealed that miR-543 inhibited the activity of the firefly luciferase with the wild-type 3′-UTR of SPOP. On the contrary, miR-543 exhibited no effect on the activity of the firefly luciferase with mutant type 3′-UTR of SPOP. miR-543 mimics did reduce the activity of the luciferase reporter gene fused to the wild-type SPOP 3′-UTR (P<0.05; Figure 2B), indicating that miR-543 targets SPOP through translational inhibition. Then, qPCR analysis detected that the expression of miR-543 in MKN45 and AGS cells transfected with miR-543 mimic was higher than those in the control (NC) group (P<0.05; Figure 2C). In accordance with these results, transfection of miR-543 mimic resulted in significant reduction of SPOP mRNA and protein expression in the MKN45 and AGS cells as analyzed by western blot (P<0.05; Figure 2D and E).
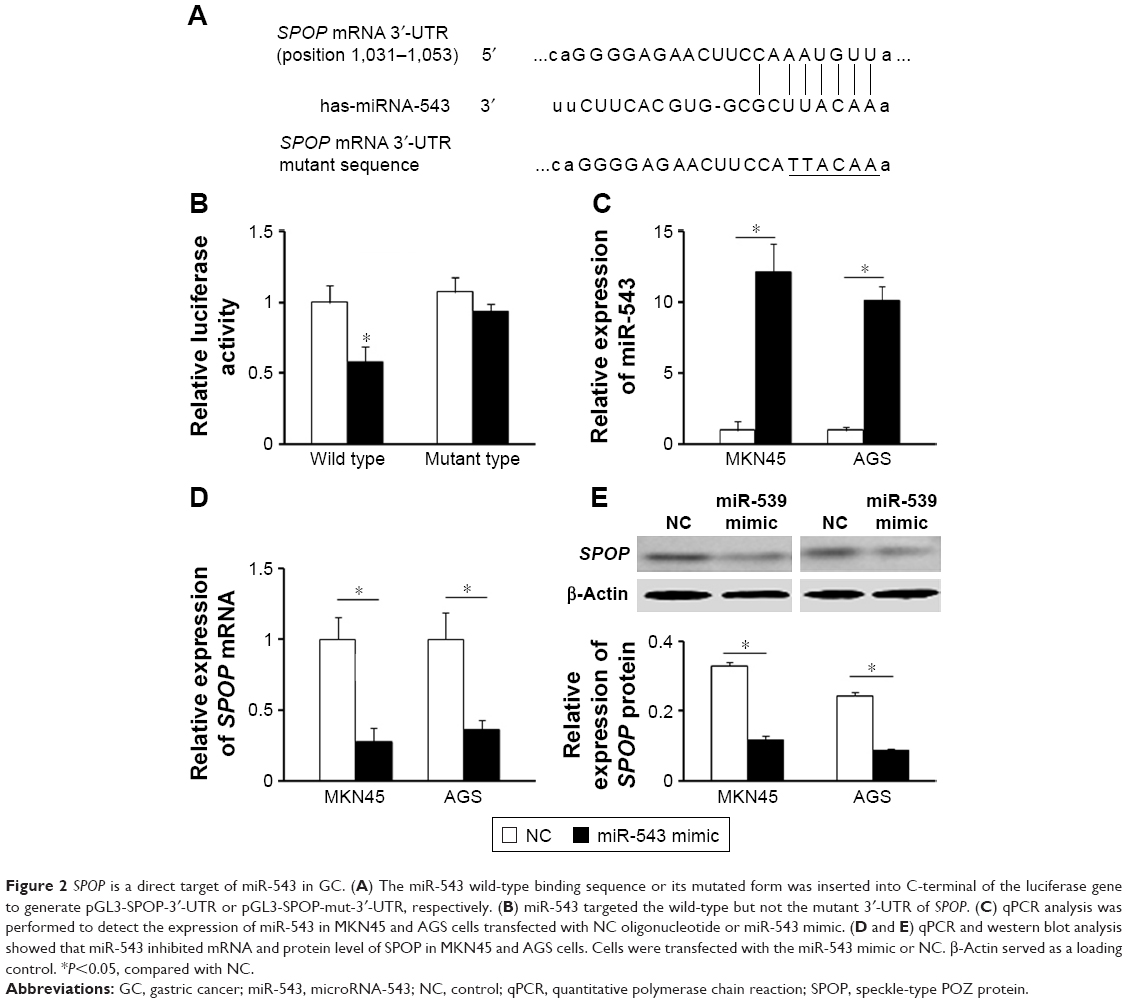 | Figure 2 SPOP is a direct target of miR-543 in GC. (A) The miR-543 wild-type binding sequence or its mutated form was inserted into C-terminal of the luciferase gene to generate pGL3-SPOP-3′-UTR or pGL3-SPOP-mut-3′-UTR, respectively. (B) miR-543 targeted the wild-type but not the mutant 3′-UTR of SPOP. (C) qPCR analysis was performed to detect the expression of miR-543 in MKN45 and AGS cells transfected with NC oligonucleotide or miR-543 mimic. (D and E) qPCR and western blot analysis showed that miR-543 inhibited mRNA and protein level of SPOP in MKN45 and AGS cells. Cells were transfected with the miR-543 mimic or NC. β-Actin served as a loading control. *P<0.05, compared with NC. |
We further detected the expression of miR-543 in MKN45 and AGS cells transfected with miR-543 inhibitor using qPCR analysis. The results showed that miR-543 expression was reduced in GC cells transfected with miR-543 inhibitor, compared with the control group (P<0.05; Figure 3A). Moreover, qPCR and western blot analysis showed that miR-543 knockdown upregulated the mRNA and protein expression level of SPOP in MKN45 and AGS cells (P<0.05; Figure 3B and C). Collectively, these results showed that miR-543 could regulate SPOP expression.
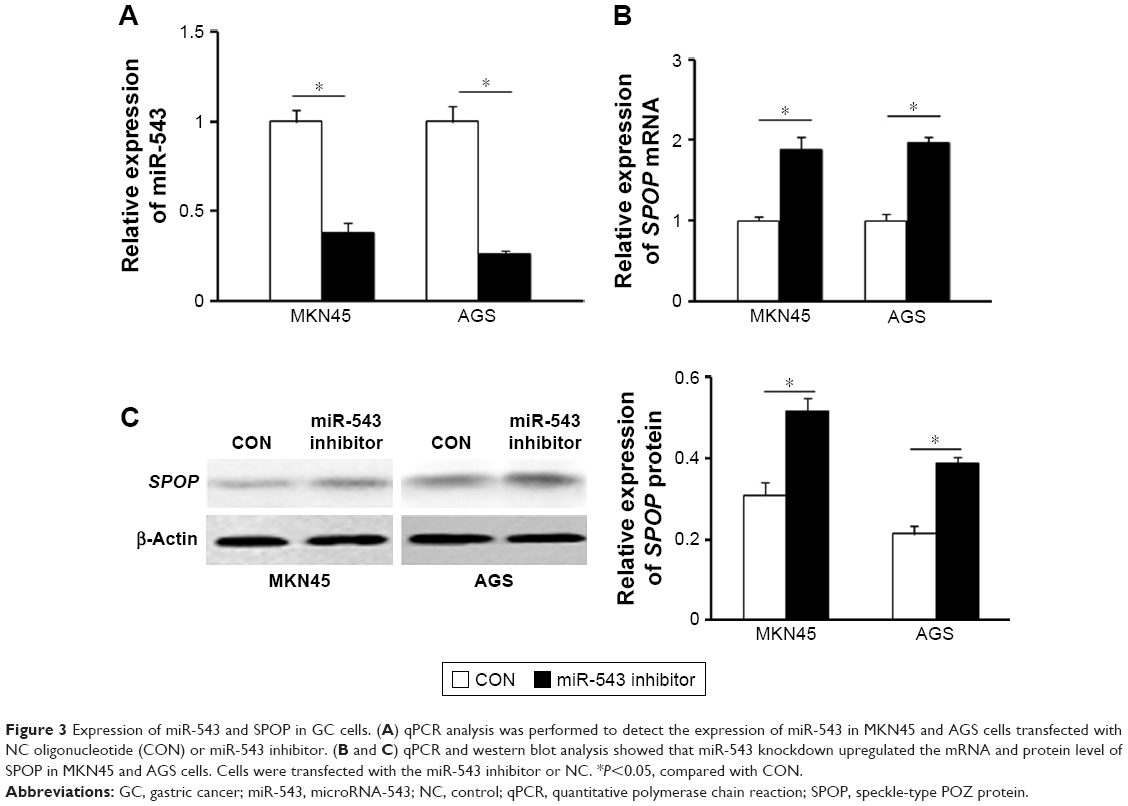 | Figure 3 Expression of miR-543 and SPOP in GC cells. (A) qPCR analysis was performed to detect the expression of miR-543 in MKN45 and AGS cells transfected with NC oligonucleotide (CON) or miR-543 inhibitor. (B and C) qPCR and western blot analysis showed that miR-543 knockdown upregulated the mRNA and protein level of SPOP in MKN45 and AGS cells. Cells were transfected with the miR-543 inhibitor or NC. *P<0.05, compared with CON. |
Effect of miR-543 on the migration and invasion of GC cells
In contrast to the NC group, cell migration and invasion were evidently increased in the miR-543 mimics group (both P<0.05), but were lower in the miR-543 mimics + SPOP overexpression group compared to the miR-543 mimics group (both P<0.05; Figure 4A and B). Furthermore, cell migration and invasion were significantly decreased in the miR-543 inhibitor group in comparison to the control group (both P<0.05), but were elevated in the miR-543 inhibitor + SPOP siRNA group than the miR-543 inhibitor group (P<0.05; Figure 5A and B).
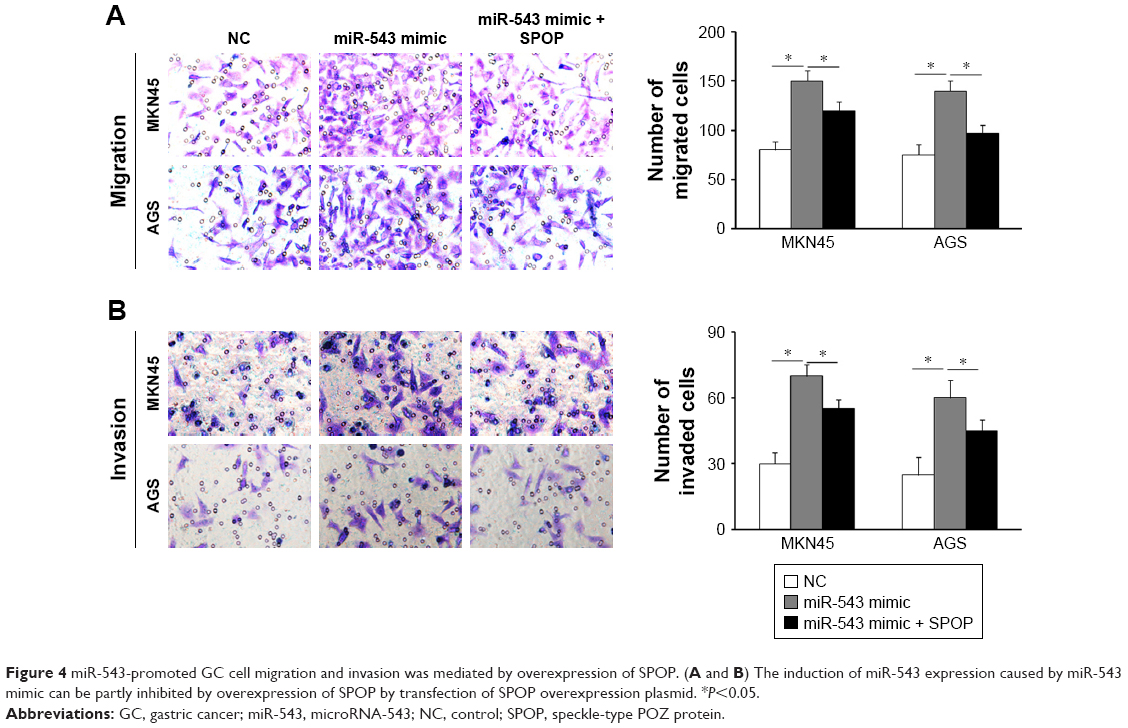 | Figure 4 miR-543-promoted GC cell migration and invasion was mediated by overexpression of SPOP. (A and B) The induction of miR-543 expression caused by miR-543 mimic can be partly inhibited by overexpression of SPOP by transfection of SPOP overexpression plasmid. *P<0.05. |
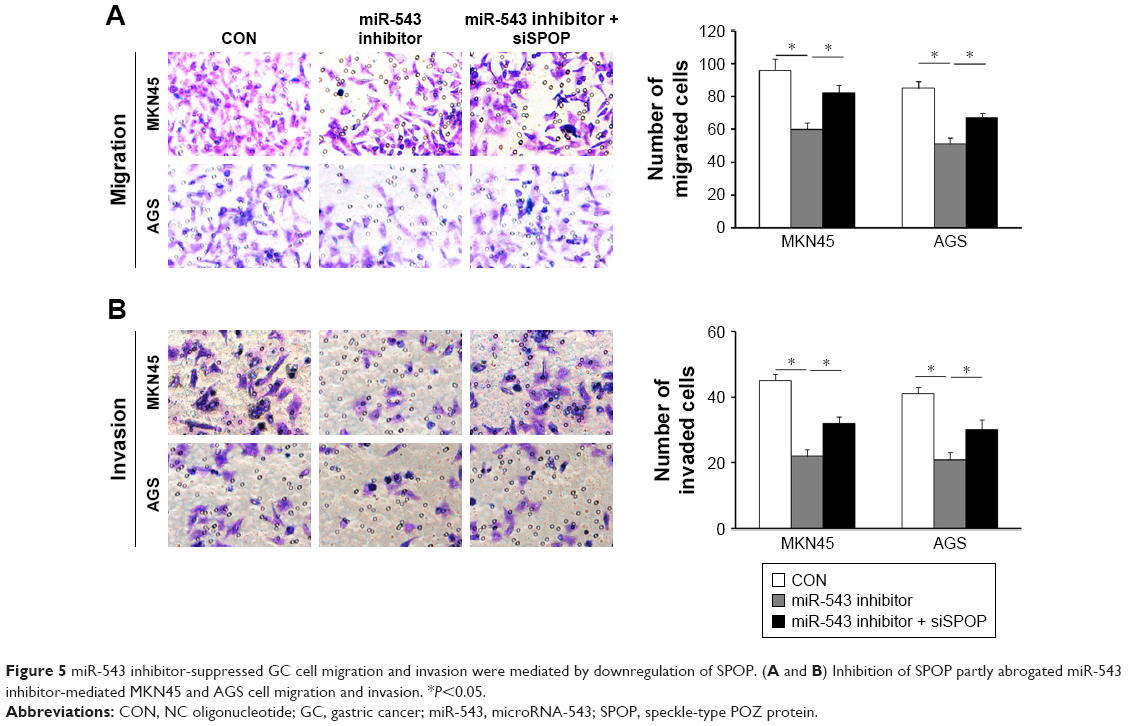 | Figure 5 miR-543 inhibitor-suppressed GC cell migration and invasion were mediated by downregulation of SPOP. (A and B) Inhibition of SPOP partly abrogated miR-543 inhibitor-mediated MKN45 and AGS cell migration and invasion. *P<0.05. |
miR-543-induced EMT phenotypes
To investigate the function of miR-543 in the EMT progression of GC and the role of SPOP in miR-543-induced EMT phenotypes, MKN45 and AGS cells were transfected with miR-543 mimics, miR-543 inhibitor, or NC, respectively. Western blot analysis revealed a reduction in SPOP and E-cadherin expression and upregulation of vimentin protein levels in GC cells transfected with miR-543 mimics (Figure 6A). Moreover, an increase in SPOP and E-cadherin and a concomitant decrease in vimentin levels were observed with the transfection of miR-543 inhibitor in GC cells (Figure 6B). These findings suggest that miR-543 induced EMT of GC cells.
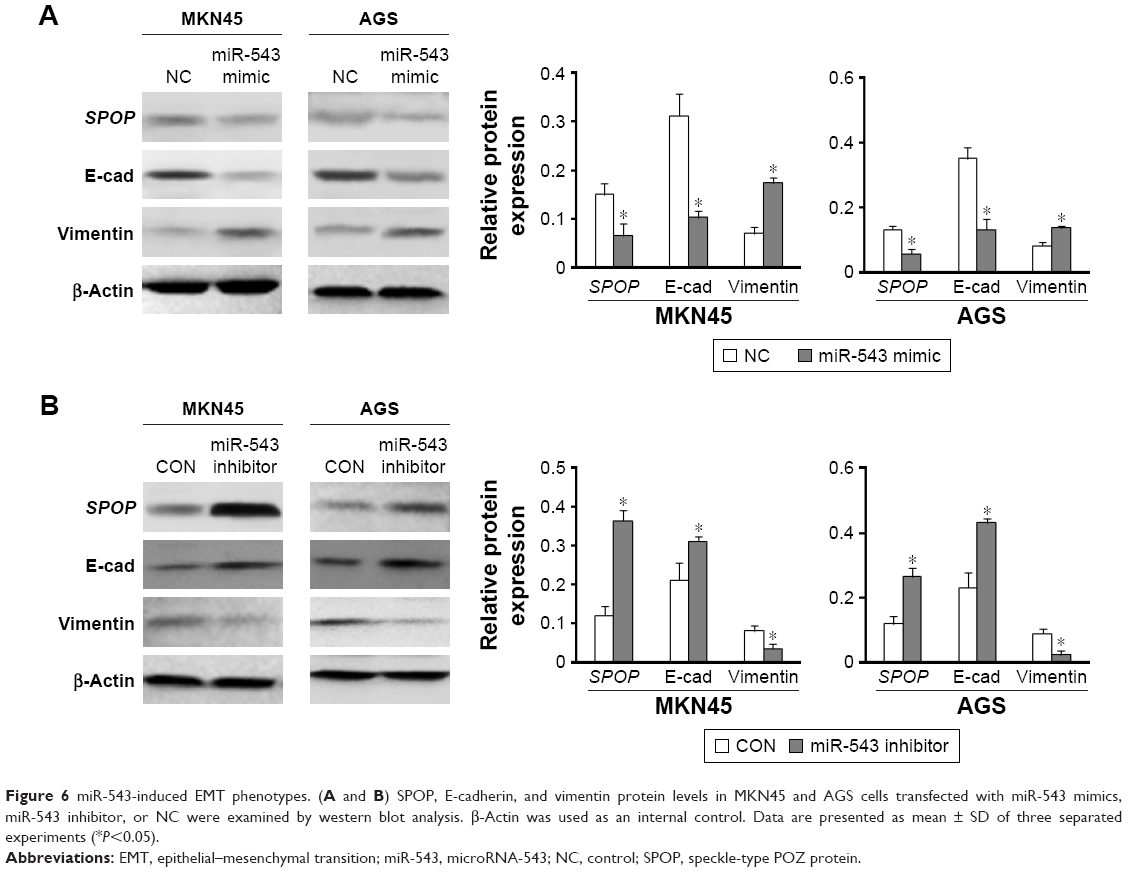 | Figure 6 miR-543-induced EMT phenotypes. (A and B) SPOP, E-cadherin, and vimentin protein levels in MKN45 and AGS cells transfected with miR-543 mimics, miR-543 inhibitor, or NC were examined by western blot analysis. β-Actin was used as an internal control. Data are presented as mean ± SD of three separated experiments (*P<0.05). |
Discussion
Many studies have reported that miRNA-associated transcriptionally regulated gene expression plays a crucial role in the initiation, development, and progression of GC. Recent studies have indicated that abnormal miRNA expression is a hallmark of cancer, suggesting that miRNAs may act as oncogenes or tumor suppressors.7 miR-543 is thought to target the hallmarks of cancer in some way, regulating multiple genes involved in the pathway, leading to the development of the cancer phenotype. For example, miR-543 was found to act as a tumor suppressor by repressing the EMT through inhibiting TWIST1 in breast cancer.8 Previous reports demonstrated that miR-543 could act as a tumor suppressor and repress tumorigenesis and metastasis in ovarian cancer and endometrial cancer by targeting several genes.9,10 Furthermore, a recent study has also reported that miR-543 suppressed tumor growth and metastasis in colorectal cancer by targeting various genes.11 In addition, recent research has also shown that miR-543 functions as an oncogene in some tumors. It has been reported that miR-543 promoted the proliferative and invasive potential of hepatocellular carcinoma.12 A recent study has also demonstrated that miR-543 promotes the proliferation and metastasis of prostate cancer via targeting RKIP.13 In our study, we showed that miR-543 is upregulated in GC tissues. Then, we explored the mechanism by which miR-543 influences the carcinogenesis of GC. Our results showed a reduction in E-cadherin expression and upregulation of vimentin protein levels in GC cells transfected with miR-543 mimics. Meanwhile, transfection of miR-543 inhibitor led to an opposite effect. These above results indicated that miR-543 induced EMT of GC cells. Moreover, we reported a new target gene of miR-543. To find a novel target through which miR-543 exerts its effects in GC, we employed an integrated approach using public bioinformatics tools. SPOP was predicted as a direct target of miR-543 using bioinformatics algorithms.
SPOP is an adaptor of the Cul3-based ubiquitination process and has been implicated in the carcinogenesis process.14 SPOP has roles in maintaining normal cellular growth and development as indicated by the high incidence of both SPOP gene overexpression and SPOP gene copy loss in a number of human cancers.15 A recent report has indicated a tumor suppressor role for SPOP in part through mediating the proteolysis of the oncogenic steroid receptor SRC-3.16 We also found that SPOP was highly expressed in 99% of human clear cell renal cell carcinoma.17 Additionally, we demonstrated that SPOP protein expression is often downregulated in prostate tumors18 and inhibits androgen receptor-mediated prostate cancer proliferation. Moreover, SPOP negatively regulates breast cell proliferation and invasion.16 Similarly, it has been reported that SPOP overexpression suppressed the proliferation and migration of colorectal cancer and liver cancer cells.19,20 Functionally, we demonstrated that SPOP suppresses cancer cell proliferation and migration partly through negatively regulating the stability of HDAC6.21 In this report, using luciferase reporter assay, we identified SPOP as a novel, direct target of miR-543. Our results showed that SPOP expression was upregulated in GC tissues at the mRNA levels using qPCR. This result was confirmed by the fact that miR-543 overexpression impaired whereas miR-543 knockdown increased SPOP mRNA and protein expression in GC cells. Moreover, we observed that the expression of miR-543 correlated inversely with SPOP expression in GC tissues. Furthermore, our data showed that restoration of SPOP can inhibit miR-543-induced GC cell migration and invasion, whereas downregulation of miR-543 inhibited cell migration and invasion which was partly abrogated by SPOP knockdown. Collectively, our work shed light on the understanding of the roles that miR-543 plays in GC by targeting SPOP, and thus indicates that miR-543 can be a more powerful target for cancer therapy.
In summary, we found that the expression of SPOP and miR-543 is negatively correlated in GC tissues and they have antagonistic effects on the migration and invasion of GC cells. Additionally, we also demonstrated that miR-543 induced EMT of GC. The newly identified SPOP/miR-543 axis will help further elucidate the molecular mechanism of GC progression and suggests that ectopic expression of miR-543 is a potentially new therapeutic regimen against GC tumorigenesis.
Acknowledgment
This study was supported by a grant from the Science Foundation of Nantong National Health and Family Planning Commission (WQ2016068, WQ2016039).
Disclosure
The authors report no conflicts of interest in this work.
References
Jemal A, Bray F, Center MM, Ferlay J, Ward E, Forman D. Global cancer statistics. CA Cancer J Clin. 2011;61(2):69–90. | ||
Xie L, Zhang Z, Tan Z, et al. MicroRNA-124 inhibits proliferation and induces apoptosis by directly repressing EZH2 in gastric cancer. Mol Cell Biochem. 2014;392(1–2):153–159. | ||
Lytle JR, Yario TA, Steitz JA. Target mRNAs are repressed as efficiently by microRNA-binding sites in the 5′ UTR as in the 3′ UTR. Proc Natl Acad Sci U S A. 2007;104(23):9667–9672. | ||
Bartel DP. MicroRNAs: genomics, biogenesis, mechanism, and function. Cell. 2004;116(2):281–297. | ||
Ryan BM, Robles AI, Harris CC. Genetic variation in microRNA networks: the implications for cancer research. Nat Rev Cancer. 2010;10(6):389–402. | ||
Li J, Dong G, Wang B, Gao W, Yang Q. miR-543 promotes gastric cancer cell proliferation by targeting SIRT1. Biochem Biophys Res Commun. 2016;469(1):15–21. | ||
Esquela-Kerscher A, Slack FJ. Oncomirs – microRNAs with a role in cancer. Nat Rev Cancer. 2006;6(4):259–269. | ||
Haga CL, Phinney DG. MicroRNAs in the imprinted DLK1-DIO3 region repress the epithelial-to-mesenchymal transition by targeting the TWIST1 protein signaling network. J Biol Chem. 2012;287(51):42695–42707. | ||
Song N, Liu H, Ma X, Zhang S. Placental growth factor promotes metastases of ovarian cancer through MiR-543-regulated MMP7. Cell Physiol Biochem. 2015;37(3):1104–1112. | ||
Bing L, Hong C, Li-Xin S, Wei G. MicroRNA-543 suppresses endometrial cancer oncogenicity via targeting FAK and TWIST1 expression. Arch Gynecol Obstet. 2014;290(3):533–541. | ||
Fan C, Lin Y, Mao Y, et al. MicroRNA-543 suppresses colorectal cancer growth and metastasis by targeting KRAS, MTA1 and HMGA2. Oncotarget. 2016;7(16):21825–21839. | ||
Yu L, Zhou L, Cheng Y, et al. MicroRNA-543 acts as an oncogene by targeting PAQR3 in hepatocellular carcinoma. Am J Cancer Res. 2014;4(6):897–906. | ||
Du Y, Liu XH, Zhu HC, Wang L, Ning JZ, Xiao CC. MiR-543 promotes proliferation and epithelial-mesenchymal transition in prostate cancer via targeting RKIP. Cell Physiol Biochem. 2017;41(3):1135–1146. | ||
Huang CJ, Chen CY, Chen HH, Tsai SF, Choo KB. TDPOZ, a family of bipartite animal and plant proteins that contain the TRAF (TD) and POZ/BTB domains. Gene. 2004;324:117–127. | ||
Errington WJ, Khan MQ, Bueler SA, Rubinstein JL, Chakrabartty A, Prive GG. Adaptor protein self-assembly drives the control of a cullin-RING ubiquitin ligase. Structure. 2012;20(7):1141–1153. | ||
Li C, Ao J, Fu J, et al. Tumor-suppressor role for the SPOP ubiquitin ligase in signal-dependent proteolysis of the oncogenic co-activator SRC-3/AIB1. Oncogene. 2011;30(42):4350–4364. | ||
Liu J, Ghanim M, Xue L, et al. Analysis of Drosophila segmentation network identifies a JNK pathway factor overexpressed in kidney cancer. Science. 2009;323(5918):1218–1222. | ||
Kim MS, Je EM, Oh JE, Yoo NJ, Lee SH. Mutational and expressional analyses of SPOP, a candidate tumor suppressor gene, in prostate, gastric and colorectal cancers. APMIS. 2013;121(7):626–633. | ||
Xu J, Wang F, Jiang H, Jiang Y, Chen J, Qin J. Properties and clinical relevance of speckle-type POZ protein in human colorectal cancer. J Gastrointest Surg. 2015;19(8):1484–1496. | ||
Huang Y, Tan N, Jia D, et al. Speckle-type POZ protein is negatively associated with malignancies and inhibits cell proliferation and migration in liver cancer. Tumour Biol. 2015;36(12):9753–9761. | ||
Tan Y, Ci Y, Dai X, et al. Cullin 3 SPOP ubiquitin E3 ligase promotes the poly-ubiquitination and degradation of HDAC6. Oncotarget. 2017;8(29):47890–47901. |
 © 2018 The Author(s). This work is published and licensed by Dove Medical Press Limited. The
full terms of this license are available at https://www.dovepress.com/terms
and incorporate the Creative Commons Attribution
- Non Commercial (unported, 3.0) License.
By accessing the work you hereby accept the Terms. Non-commercial uses of the work are permitted
without any further permission from Dove Medical Press Limited, provided the work is properly
attributed. For permission for commercial use of this work, please see paragraphs 4.2 and 5 of our Terms.
© 2018 The Author(s). This work is published and licensed by Dove Medical Press Limited. The
full terms of this license are available at https://www.dovepress.com/terms
and incorporate the Creative Commons Attribution
- Non Commercial (unported, 3.0) License.
By accessing the work you hereby accept the Terms. Non-commercial uses of the work are permitted
without any further permission from Dove Medical Press Limited, provided the work is properly
attributed. For permission for commercial use of this work, please see paragraphs 4.2 and 5 of our Terms.