Back to Journals » Cancer Management and Research » Volume 12
miR106a Promotes the Growth of Transplanted Breast Cancer and Decreases the Sensitivity of Transplanted Tumors to Cisplatin
Authors You F, Li J, Zhang P, Zhang H, Cao X
Received 17 September 2019
Accepted for publication 7 December 2019
Published 13 January 2020 Volume 2020:12 Pages 233—246
DOI https://doi.org/10.2147/CMAR.S231375
Checked for plagiarism Yes
Review by Single anonymous peer review
Peer reviewer comments 2
Editor who approved publication: Dr Eileen O'Reilly
Faping You, 1–5 Junhui Li, 1–4 Peijin Zhang, 1–4 Hui Zhang, 1–4 Xuchen Cao 1–4
1First Department of Breast Cancer, Tianjin Medical University Cancer Institute and Hospital, National Clinical Research Center for Cancer, Tianjin 300060, People’s Republic of China; 2Key Laboratory of Cancer Prevention and Therapy, Tianjin 300060, People’s Republic of China; 3Tianjin’s Clinical Research Center for Cancer, Tianjin 300060, People’s Republic of China; 4Key Laboratory of Breast Cancer Prevention and Therapy, Tianjin Medical University, Ministry of Education, Tianjin 300060, People’s Republic of China; 5Shengli Oilfield Central Hospital, Dongying, Shandong Province 257034, People’s Republic of China
Correspondence: Xuchen Cao
First Department of Breast Cancer, Tianjin Medical University Cancer Institute and Hospital, National Clinical Research Center for Cancer, Huan-Hu-Xi Road, Hexi District 300060 Tel +86 22 23340123 2071
Email [email protected], Tianjin, People’s Republic of China
Objective: To explore the effect of miR106a on the growth of breast cancer xenografts and the sensitivity of chemotherapeutic agents.
Methods: Breast cancer cell lines (MDA-MB231 and MCF7) were transfected with an miR106 mimic and miR106a inhibitor. BALB/c female nude mice were selected to construct a transplanted-tumor model. Cisplatin treatment was performed 2 weeks after inoculation. After 5 weeks, tumor tissue was weighed. Apoptosis of tumor cells was detected by TUNEL staining. The expression of these proteins (Ki67, β-catenin, cyclin D1 and cMyc) was detected by immunohistochemistry. The contents of P53, RUNX3, ABCG2, β-catenin, BAX, and BCL2 mRNA were detected by qRT-PCR.
Results: The miR106a mimic (MM) group’s tumor volume and weight were significantly bigger than those of the model group. miR106a mRNA content was higher than the blank control group, and β-catenin and Ki67 protein were strongly positive. β-catenin, BCL2, and ABCG2 mRNA content was were increased. P53, BAX, and RUNX3 mRNA content was decreased. The number of positive cells on TUNEL staining was significantly lower in the miR106a inhibitor (MI) group. After cisplatin treatment, inhibition of tumor growth was most obvious in the MI+DDP (cisplatin) group. Compared with the MM group, tumor growth in the MM+FH535 (Wnt-pathway inhibitor) group was significantly lower, and Wnt-pathway activity was decreased.
Conclusion: Overexpression of miR106a can promote the growth of transplanted breast cancer and decrease the sensitivity of transplanted tumors to cisplatin. The mechanism may be related to abnormal activation of the Wnt-signaling pathway.
Keywords: miR106a, breast cancer transplantation tumor, MDA-MB231, MCF7, chemotherapeutic drug sensitivity
Introduction
In recent years, the incidence of breast cancer (BC) and a trend toward younger sufferers has become stronger and stronger.1 Treatment methods for breast cancer include surgery, radiochemotherapy, endocrine therapy, molecularly targeted therapy, and a combination of multiple methods, but there remains a great challenge in the clinical setting, curative efficacy in advanced breast cancer is still poor. The main causes of treatment failure are primary tumor metastasis, relapse after treatment, and drug resistance, so understanding the molecular mechanisms of recurrence and metastasis is the key to improve long-term survival. Cisplatin (DDP) and carboplatin are the most important chemotherapeutic agents for breast cancer, but cisplatin increases the level of glutathione in tumor cells very easy, reduces drug sensitivity, leads to drug resistance, and limits clinical application.2
miRNAs are noncoding small RNA molecules that are capable of causing translational inhibition or degradation of mRNA by pairing with the 3ʹ untranslated region of the target gene. Recent studies have found that miRNA106a is closely related to the invasion and metastasis of tumor cells, shows high expression in such cancers as esophageal, liver, and cervical, and plays an important role in the regulation of tumor-cell proliferation, differentiation, and apoptosis.3 With the rapid development of antitumor targeting drugs, treatment efficiency for breast cancer patients has been greatly improved; however, invasion and recurrence is one of the important causes of poor prognosis and death of breast cancer patients. It is urgent that the mechanisms of breast cancer invasionand targets that can predict or reverse invasion be elucidated.4 For the treatment of breast cancer, chemotherapy is the basic treatment means.5 Cisplatin is a broad-spectrum anticancer drug, and has been found to be effective against a variety of cancers.6
The Wnt–β-catenin signaling pathway has been a hot research field in recent years.7 It has been proved that it is related to the occurrence, invasion, metastasis, and prognosis of many kinds of malignant tumors, such as liver cancer, pancreatic cancer, stomach cancer, and prostate cancer,8 but there has been less research on breast cancer.9 This study focused on the expression of miR106a in breast cancer tissue the enhancement of chemosensitivity for cisplatin in breast cancer cells, and the relationship between this process and the Wnt-signaling pathway.
Methods
Cell Lines and Research Subjects
The breast cancer cell lines MDA-MB231 (ATCC HTB26) and MCF7 (ATCC HTB22) were selected.10 Sixty BALB/c male nude mice (7–8 weeks old, 20±2g, purchased from Jinan Pengyue Experimental Animal Breeding, license SCXK [Lu] 2014–0007) were kept in a well-ventilated, quiet SPF animal laboratory at room temperature 22°C–24°C and relative humidity 50%–60%. They were free to eat and drink. Animal testing followed NIH guidelines (publication 85–23, revised 1996) and was approved by the Animal Protection and Use Committee of Tianjin Medical University Cancer Institute and Hospital, National Clinical Research Center for Cancer.
Cell Culture
MDA-MB231 and MCF7 cells were cultured in DMEM containing 10% FBS (Sigma-Aldrich, St Louis, MO, USA)at 37°C, 5% CO2 in an incubator (Thermo Fisher Scientific, Waltham, MA, USA). Cells in the logarithmic growth stage were cultured and tested.
Cell Processing and Grouping
Cells in the logarithmic growth stage were digested with 0.25% trypsin, and 2×10⁵ cells were selected and inoculated on six orifice plates. After 24 hours, cell growth was observed with inverted microscopy. When cell density had reached 30%–50%, miR106a mimic (MM), miR106a mimic control, miR106a inhibitor (MI), and miR106a inhibitor control were transfected into cells with Lipofectamine 2000 (Thermo Fisher Scientific). Cell transfection was assessed by qRT-PCR. Mice were divided into five groups: blank control (BC; MM — cells transfected with miR106a analogue (miR 10000103-1-5); negative control (NM) — cells transfected with miR106a-mimic negative-control reagent (miR 01101-1-5); MI — cells transfected with miR 20000103-1-5; and egative control (NI) — cells transfected with miR106a-inhibitor negative-control reagent (miR 02101-1-5).
Construction and Grouping of Nude Mouse Xenograft Models
MDA-MB231 cells and MCF7 cells in the logarithmic growth stage were digested with trypsin into cell suspensions and cell concentration adjusted to 1×10⁷ mL. Male nude mice (n=6) were inoculated with 200 μL cell suspension under the subcutaneous tissue of the right lower extremity. A transplanted tumor model was created. Cisplatin (3 mg/kg) was injected daily 2 weeks after transfection and maintained for 7 days. The noncisplatin group was injected with the same amount of saline. The experiment was divided into ten groups: model — inoculation of normal breast cancer cell suspension; MM — inoculation of breast cancer cell suspension transfected with mir106a mimic; NM — breast cancer cell suspension transfected with miR106a mimic negative control; MI — breast cancer cell suspension transfected with miR106a inhibitor; NI — breast cancer cell suspension transfected with miR106a inhibitor negative control; model + cisplatin intervention treatment (model + DDP); MM + cisplatin intervention treatment (MM+DDP); NM + cisplatin intervention treatment (NM+DDP); MI + cisplatin intervention therapy (MI+DDP); and NI + cisplatin intervention therapy (NI+DDP).
Detection of Tumor Growth
Tumor growth was observed weekly, and volume measured with vernier caliper. Tumor volume was calculated as V=a×b2/2 (a, length; b, short diameter). The growth curve of tumors was drawn within 5 weeks. After 5 weeks, nude mice were anesthetized with sodium pentobarbital (50 mg/kg) intraperitoneally. Some tumor tissue samples were fixed by soaking in 4% polyformaldehyde solution for subsequent TUNEL and immunohistochemistry experiments. Other samples were transferred into liquid nitrogen and stored in the refrigerator at −80°C for qRT-PCR and Western blot detection.
TUNEL Detects Tumor-Cell Apoptosis
Tumor tissue fixed in 4% polyformaldehyde solution was used in paraffin-embedded serial sections (4 μm), and five slices were cut in each specimen (biotissue paraffin-embedding machine, paraffin slicer, Leica). After routine dewaxing with xylene and dehydration with gradient ethanol, apoptotic tumor cells were detected quantitatively by TUNEL using a cell apoptosis–detection kit (ZK-8005, Beijing Zhongshan Jinqiao Biotechnology). Tormal nuclei were blue and apoptosis-positive cells brown-yellow.
Immunohistochemical Detection of Ki67 and β-Catenin Protein Expression
Ki67 (anti-Ki67 antibody, 1:200, AB 15580; Abcam) and β-catenin (anti-β-catenin antibody, 1:100, AB 16051; Abcam) expression was detected by immunohistochemistry. Tumor tissue fixed in 4% polyformaldehyde solution was sliced with the paraffin-sectioning machine, stained with an SABC immunohistochemistry kit, and then sealed with neutral gum after dehydration of gradient ethanol solution and transparent treatment of xylene. Positive cells were counted under 400× optical microscopy.
qRT-PCR Detection of P53, RUNX3, ABCG2, β-Catenin, BAX, and BCL2 mRNA Levels
Tissue samples were ground and then centrifuged at 10,000 rpm for 10 minutes at 4°C. Total RNA was extracted using Trizol (OD 260/OD; 280 indicates RNA purity is acceptable between 1.8 and 2.0). RNA was transcribed into cDNA with a reverse-transcription kit (Applied Biosystems, Waltham, MA, USA). qRT-PCR was performed using a MasterCycler Nexus X2 (Eppendorf, Hamburg, Germany). Conditions were 95°C for 10 minutes, 95°C for 15 seconds, and 60°C for 60 seconds for 40 cycles. Data were processed using 2–ΔΔCt and the relative expression of GAPDH mRNA calculated. The sequence of primers (Shanghai Bioengineering Technology Service) used in this study was: P53, forward 5′-TGGGACGGGACAGCTTTGAG-3′, reverse 5′-GTTTACGCCCGCGGATCTTG-3′; ABCG2, forward 5′-TCAATCAAAGTGCTTCTTTTTTATG-3′, reverse 5′-TTGTGGAAGAATCACGTGGC-3′; RUNX3, forward 5′-GATGGCAGGCAATGACGA-3′, reverse 5′-TGCTGAAGTGGCTTGTGGT-3′; β-catenin, forward 5′-TCAAGACCATCACTATCCTG-3′, reverse: 5′-CATCGGCGTCTTCAGGTGCT-3′; BAX, forward 5′-TCATGGGCTGGACATTGGAC-3′, reverse 5′-GAGACAGGGACATCAGTCGC-3′; BCL2, forward: 5′-ACAGGGTACGATAACCGGGA-3′, reverse 5′-GGGCCGTACAGTTCCACAAA-3′; GAPDH, forward: 5′-AGAAGGCTGGGGCTCATTTG-3′, reverse 5′- AGGGGCCATCCACAGTCTTC-3′.
Mechanism of miR106a on Breast Cancer Xenografts
To verify further whether the effect of miR106a on transplanted breast cancer tumors is related to the Wnt pathway, we added the Wnt signaling–pathway inhibitor FH535 (HY-15721, MedChemexpress) to treat cells. FH535 was prepared with DMSO at a concentration of 5 mg/mL and diluted with DMSO:DMEM (1:1). Thirty female BALB/c nude mice (n=6) were selected to construct the nude mouse transplanted tumor model according to the method. Experiments were grouped as: model — inoculated with normal breast cancer cell suspension, intraperitoneal injection of 100 µL DMSO:DMEM (1:1) solution; MM — breast cancer cell suspension transfected with mir106a mimic inoculated and 100 mL DMSO:DMEM (1:1) solution injected intraperitoneally; MI — breast cancer cell suspension transfected with miR106a inhibitor inoculated and 100 µL DMSO:DMEM (1:1) solution injected intraperitoneal; Wnt signaling-pathway inhibitor (FH535) — inoculated with normal breast cancer cell suspension and intraperitoneal injection of FH535 solution (25 mg/kg bw); miR106a mimic + Wnt signaling-pathway inhibitor (MM+FH535) — inoculated breast cancer cell suspensions transfected with miR106a mimic and intraperitoneal injection of FH535 solution (25 mg/kg bw).
Western Blot Analysis of p53, Runx3, ABCG2 and Wnt Signaling–Pathway Proteins β-Catenin, Cyclin D1, and cMyc Protein-Expression Levels
Protein concentration was measured by with a BCA protein assay kit, Thermo Fisher Scientific). Samples (40 μg) from each group were separated by SDS-PAGE, blocked for 30 minutes with a TBST solution containing 5% defatted milk powder for 1 hour, and then incubated with the primary antibodies diluted by TBST solution containing 3% FBS. Primary antibodies were anti-p53 (1:1,000, ab131442; Abcam), anti-Runx3 (1:1,000, ab49117; Abcam), anti-ABCG2 (1:1,000, ab16051; Abcam), anti-β-catenin (1:1,000, ab226977; Abcam), anti-cyclin D1 (1:1,000, ab226977; Abcam), anti-cMyc (1:1,000, ab39688; Abcam), and β-actin (1:1,000, ab8227; Abcam). Next, samples were incubated with goat antirabbit IgG (1:2,000, ab6721; Abcam) for 1 hour. The signal on the membrane was detected by ECL, protein expression standardized by β-actin, and the gray scale scanned and quantified by ImageJ software.
Statistical Analysis
Data were analyzed with SPSS 19.0. Results are expressed as means ± SD. Data of multiple groups were analyzed by ANOVA, and subsequent analysis was performed with LSD tests. P<0.05 indicates significance.
Results
qRT-PCR Detection of Cell Transfection
The efficiency of miR106a transfected breast cancer cells was detected by qRT-PCR (Figure 1). Contents of the BC, NM, and NI groups were similar (P>0.05), while the difference between the MM (elevated) group and MI (decreased) group was significantly higher than the BC group (P<0.05). After transfection of the miR106a inhibitor for 48 hours in the MI group, miR106a content in cells was significantly lower than in the control group (P<0.05). After the same treatment in the MM group, the of miR106a content was significantly higher than the former (P<0.05).
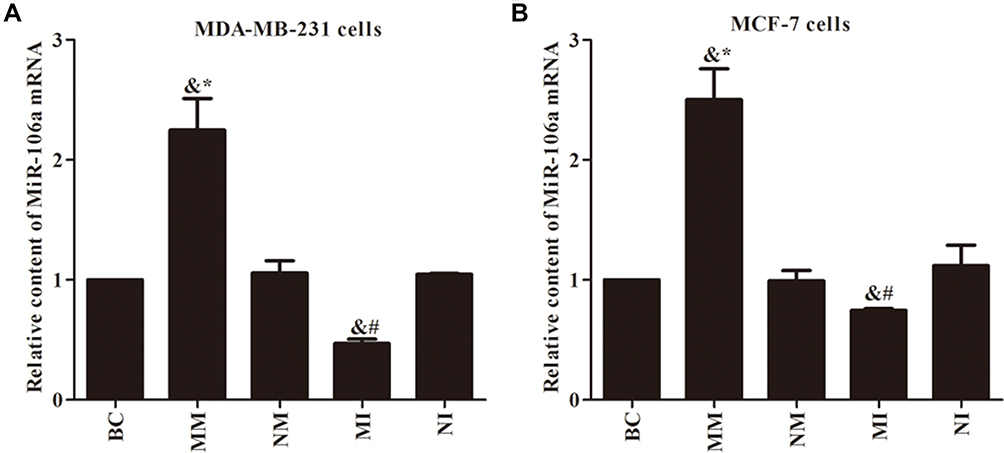 |
Figure 1 Transfection efficiency of qRT-PCR assay for miR106a. (A) Relative content of miR106a mRNA in MDA-MB231 cells; (B) relative content of miR106a mRNA in MCF7 cells. &P<0.05 compared to BC group; *P<0.05 compared to NM group; #P<0.05 compared to NI group. |
Effect of miR106a on Growth and Chemotherapy Sensitivity of Xenografted Tumors in Nude Mice
After subcutaneous inoculation of MDA-MB231 cells and MCF7 cells, nude mice in themodel group were stable and the tumorigenesis rate 100%. There was no significant difference in tumor growth between the NM group and the NI group in comparison with the model group (P>0.05), but there was between the MM group and MI group (P<0.05). Compared with the NM group, tumorigenesis and tumor growth in the MM group was faster and tumor volume and weight larger (P<0.05). Compared with the NI group, the growth rate and volume of tumors in the MI group were inhibited, and tumor size decreased obviously (P<0.05).
After cisplatin treatment, tumor growth and weight were inhibited in all groups. Compared with the MM group, the MM+DDP group had the least tumor-growth inhibition and and tumor weight and drug resistance. Compared with the MI group, inhibition of tumor growth was most obvious in the MI+DDP group, the volume and recurrence of tumors decreased (P<0.05), and cisplatin treatment was effective. miR106a reduced cisplatin sensitivity in transplanted breast cancer tumors Figure 2).
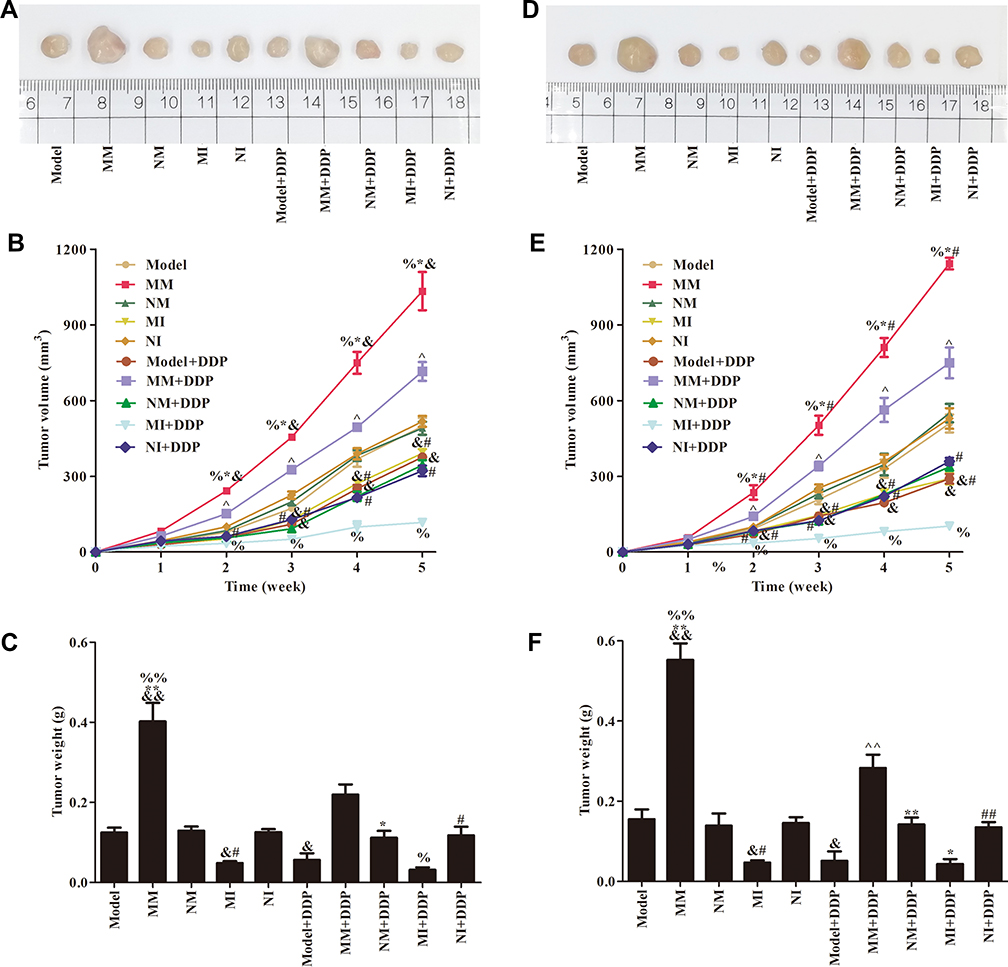 |
Figure 2 Growth of transplanted tumors in nude mice. Images (A), volume (B), and weight (C) of transplanted tumors after MDA-MB231 cell inoculation. Images (D), volume (E), and weight (F) of transplanted tumors after MCF7 cell inoculation. &P<0.05, &&P<0.01 compared to model group; *P<0.05, P<0.01 compared to NM group; #P<0.05, ##P<0.01 compared to NI group; ^P<0.05, ^^P<0.01 compared to NM group; %P<0.05, %%P<0.01 compared to MI group. |
TUNEL Detection of Tumor-Cell Apoptosis
From the results of TUNEL staining, tumor cells in the model group showed a small amount of necrosis. Apoptosis of the tumor cells in the NM and the NI groups showed no significant difference (P>0.05), while the MM and MI groups were evidently different (P<0.05). There was almost no apoptosis in tumor cells of the NM and MM groups. The number of positive cells in these two groups decreased significantly (P<0.05). The number of TUNEL-stained positive cells in the MI group increased significantly (P<0.05). Figure 3 shows that inhibition of miR106a expression can induce apoptosis in tumor cells.
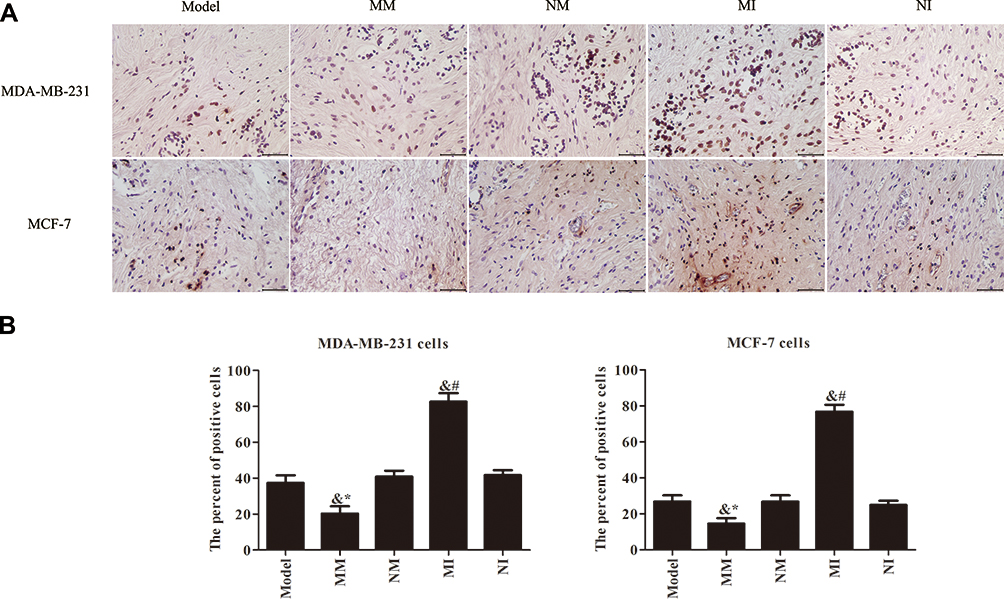 |
Figure 3 Apoptosis of tumor cells detected by TUNEL method (400×). (A) The results of apoptosis analysis; (B) apoptosis numbers among transplanted tumor cells. &P<0.05 compared to model group; *P<0.05 compared to MM group; #P<0.05 compared to NI group. |
Immunohistochemistry to Detect Expression of Ki67 and β-Catenin
Immunohistochemistry was used to detect expression levels of β-catenin and Ki67 proteins. As shown in Figure 4, β-catenin was positive in cytoplasm and nuclei. Expression levels of various proteins in the model, NM, and NI groups were not much different (P>0.05), but the MM and MI groups were significantly different (P<0.05). Positive expression of β-catenin and Ki67 proteins in the MM group was stronger than the NM group (P<0.05). Compared to the Ni group, β-catenin and Ki67 proteins were weakly positive in the MI group and the number of positive cells decreased significantly (P<0.05). Inhibition of miR106a expression resulted in decreased expression levels of β-catenin and Ki67 proteins.
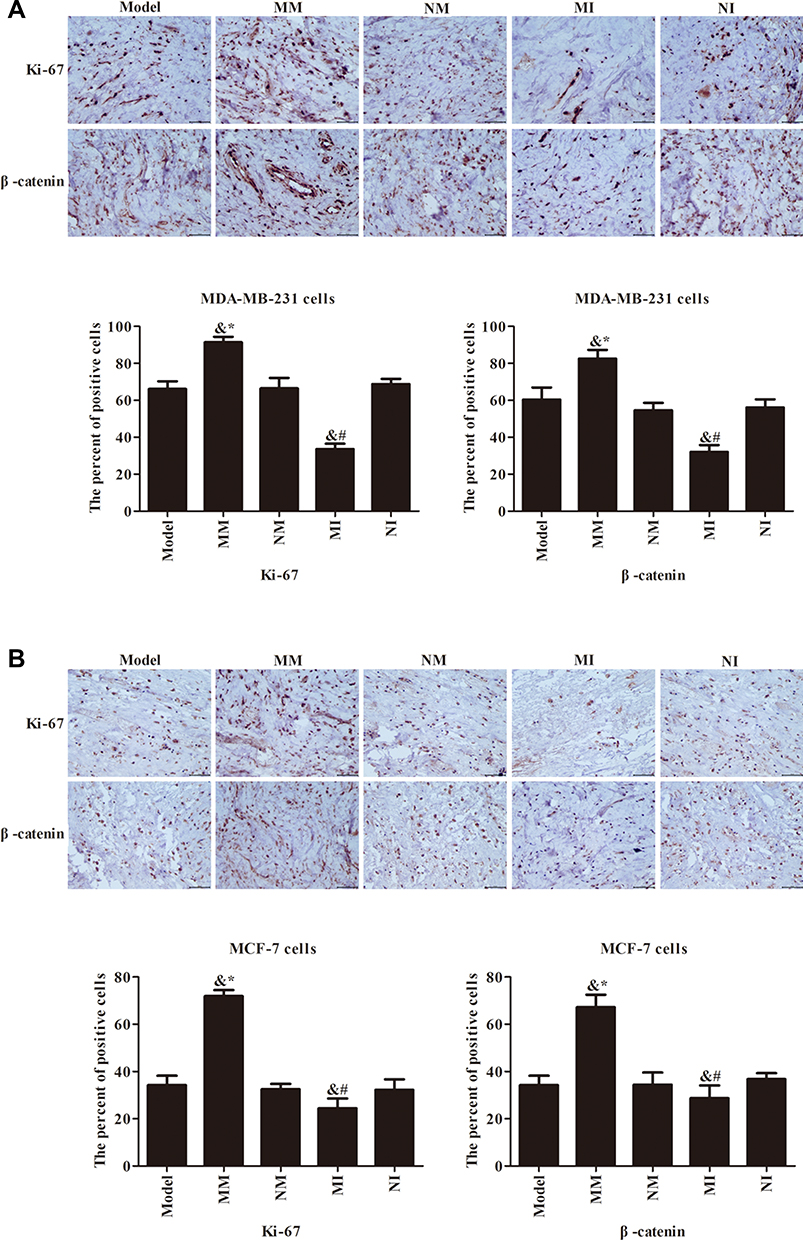 |
Figure 4 Expression of β-catenin and Ki67 protein detected by immunohistochemistry (400×). (A) Immunohistochemical pattern and quantitative analysis of positive cell numbers in MDA-MB231 cells. (B) Immunohistochemical pattern and quantitative analysis of positive cell numbers in MCF7 cells. &P<0.05 compared to model group; *P<0.05 compared to MM group; #P<0.05 compared to NI group.. |
qRT-PCR Detection of P53, RUNX3, ABCG2, β-Catenin, BAX, and BCL2 mRNA Levels
Expression levels of various proteins in the model, NM, and NI groups were not much different (P>0.05), while groups MM and MI were obviously different (P<0.05). The content of β-catenin, BCL2 and ABCG2 mRNA in the MM group increased compared with the NM group, and contents of P53, BAX, and RUNX3 mRNA decreased (P<0.05). P53, BAX, and RUNX3 mRNA contents increased in the MI group compared with the Ni group, and the β-catenin, BCL2, and ABCG2 mRNA decreased (P<0.05, Figure 5).
 |
Figure 5 qRT-PCR detection of related gene expression in MDA-MB231 cell (A) and MCF7 cell (B). &P<0.05 compared to model group; *P<0.05 compared to MM group; #P<0.05 compared to NI group. |
Wnt Signaling–Pathway Inhibitor FH535 Attenuated Tumor Growth–Promoting Effect of miR106a
To verify further whether the effect of miR106a on transplanted breast cancer tumors may be related to the Wnt pathway, we added the Wnt signaling–pathway inhibitor FH535 to treat cells. As shown in Figure 6, tumor growth was more rapid in the MM group than the Model group and tumor growth inhibited in the MI group (P<0.05). After FH535 treatment, tumor growth in the MM+FH535 group was significantly reduced compared with the MM+FH535 group. FH535 inhibited tumor growth and weight, induced apoptosis of tumor cells, though its effect was not obvious within the MI group (P<0.05).
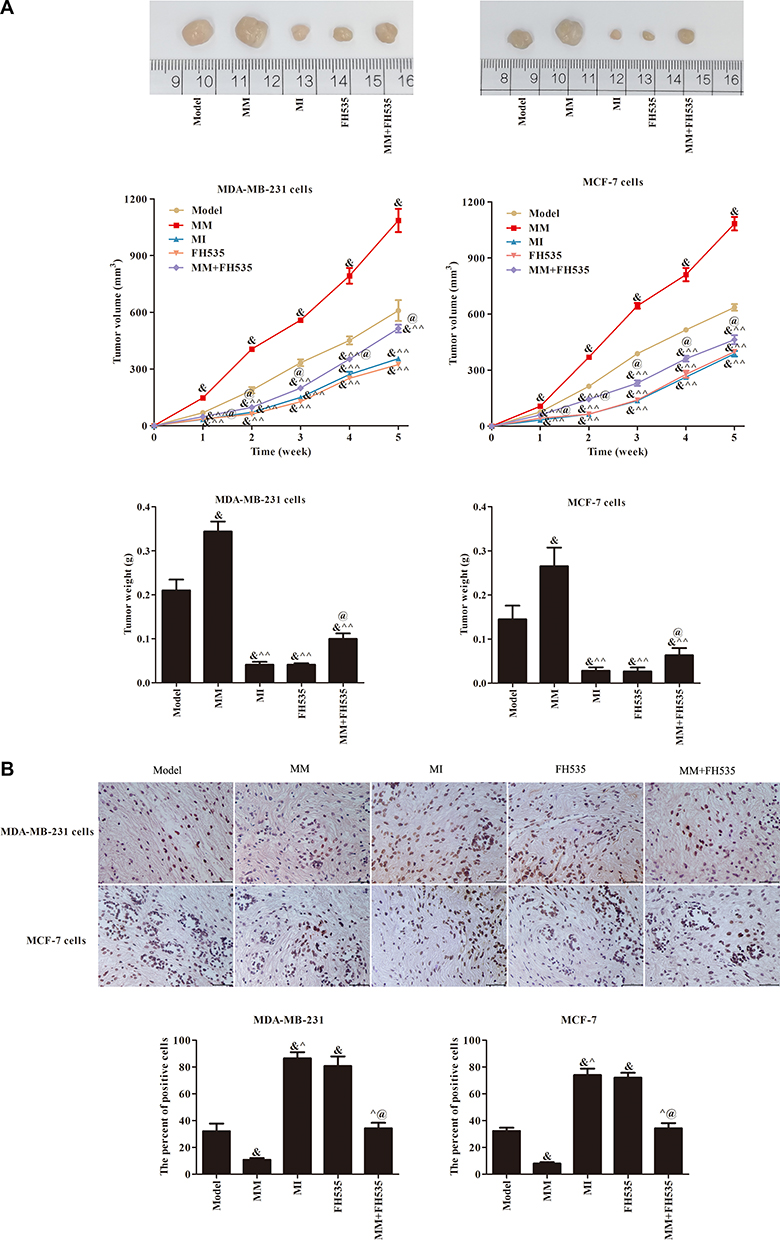 |
Figure 6 Growth and apoptosis of transplanted tumor cells in nude mice. (A) The picture, volume and weight of transplanted tumor after cells inoculation; (B) Quantitative analysis of apoptosis morphology and apoptosis number of transplanted tumor cells after inoculation. &P<0.05 compared to model group; ^P<0.05, ^^P<0.01 compared to MM group; @P<0.05 compared to FH535 group. |
As seen in Figure 7, positive expression of these two proteins (β-catenin and Ki67) in the MM+FH535 group was lower, but that in the MM+FH535 group was different (P<0.05). Positive expression of β-catenin and Ki67 in the FH535 group was inhibited compared with the model group, and positive cell numbers decreased significantly (P<0.05). qRT-PCR results are shown in Figure 8. After FH535 treatment, P53, BAX, and RUNX3 mRNA contents in the MM+FH535 group were increased, but the of BCL2 and ABCG2 mRNA contents were decreased (P<0.05). The contents of these five mRNAs (P53, BAX, RUNX3, BCL2, and ABCG2) in the FH535 group were significantly increased over the model group (P<0.05). Western blot results are shown in Figure 9. After treatment with FH535, expression of p53 and Runx3 resistance–related proteins in the MM+FH535 group was higher than the MM group and expression of ABCG2 protein decreased (P<0.05). Expression of p53 and Runx3 proteins increased significantly in the FH535 group compared with the model group, and the content of ABCG2 protein decreased (P<0.05). Expression levels of the Wnt signaling pathway proteins (β-catenin, cyclin D1, and cMyc) were further examined. Expression levels of the three pathway proteins (β-catenin, cyclin D1, and cMyc) in FH535 group were significantly lower than the Model group (P<0.05). Expression levels of these three pathway proteins in the MM+FH535 group were also lower than the MM group and pathway activity inhibited.
 |
Figure 7 Expression of β-catenin and Ki67 protein detected by immunohistochemistry (400 ×). (A) Immunohistochemical pattern and Quantitative analysis of positive cell numbers in MDA-MB231 cell. (B) Immunohistochemical pattern and Quantitative analysis of positive cell numbers in MCF7 cell. &P<0.05 compared to model group; ^P<0.05 compared to MM group; @P<0.05 compared to FH535 group. |
 |
Figure 8 qRT-PCR detection of related gene expression in MDA-MB231 (A) and MCF7 cell (B) cells. &P<0.05 compared to model group; ^P<0.05 compared to MM group; @P<0.05 compared to FH535 group. |
 |
Figure 9 Western blot detection of related protein expression in MDA-MB231 (A) and MCF7 (B) cells. &P<0.05 compared to model group; ^P<0.05 compared to MM group; @P<0.05 compared to FH535 group. |
Discussion
Pemetrexed and cisplatin were found to be effective in the treatment of asymptomatic brain metastases from breast cancer.11 It was also suggested that DDP can inhibit breast cancer activity, promote apoptosis of MCF7 cells, induce DNA double-strand breakage, and upregulate apoptosis-associated proteins.12 In the MI group transfected with the miR106a inhibitor, miR106a expression decreased, tumor-growth rate and volume were inhibited, tumor size decreased, and the number of TUNEL-positive cells in the MI group increased significantly. In the MM group transfected with the miR106a mimic, miR106a expression increased obviously, tumor cells showed little apoptosis, and the number of TUNEL-positive cells decreased obviously, indicating that the miR106a inhibitor effectively inhibited the expression of miR106a, thus inhibiting the growth of tumor cells and inducing apoptosis of tumor cells.
With the development of research, it has been found that changes in DNA and gene expression can also affect the sensitivity of cancer to cisplatin. It has been found that cisplatin sensitivity is associated with the expression of certain genes, and inhibition of these genes can increase the sensitivity of cisplatin to gastric cancer cells.13 After cisplatin treatment, tumor-growth inhibition degree, tumor weight, and drug resistance in the MM+DDP group were minimal in all groups. Inhibition of tumor growth was most obvious in the MI+DDP group: the volume and recurrence of tumors were decreased, and the therapeutic effect of cisplatin was obvious. The results showed that when miR106a expression was high, and the therapeutic effect of MI+DDP was not obvious, even when DDP was used. High expression of miR106a reduced cisplatin sensitivity in transplanted breast cancer tumors.
Expression levels of β-catenin and Ki67 proteins were detected by immunohistochemistry, and positive expression of both was found in the MM group. These proteins were weakly positive in the MI group, and the number of positive cells decreased significantly. It has been shown that abnormal expression of β-catenin may be involved in malignant progression of tumors.14 This study found that inhibiting the expression of miR106a reduced expression levels of β-catenin and Ki67 proteins, thus inhibiting tumor growth.
Abnormal expression of the β-catenin, BCL2, ABCG2, P53, BAX, and RUNX3 genes can affect cell apoptosis, cell proliferation, membrane transport proteins, DNA repair, gene transcription and translation, and cell adhesion, invasion, and metastasis.15 mRNA levels of β-catenin, BCL2, and ABCG2 increased in the MM group, and P53, BAX, and RUNX3 mRNA levels were decreased after qRT-PCR (P<0.05), In the MI group, mRNA levels of P53, BAX, and RUNX3 increased and β-catenin, BCL2, and ABCG2 decreased (P<0.05). This suggests that high expression of miR106a inhibits the expression of P53, BAX, and RUNX3 and promotes expression of β-catenin, BCL2, and ABCG2. Recent studies have found that β-catenin, BCL2, and ABCG2 are involved in the formation of tumor resistance, and high levels of expression of these genes are associated with inhibition of apoptosis induced by various chemotherapeutic agents.16 When these genes are overexpressed, they may modulate the antioxidant pathway, act on the apoptosis process, reduce cell mortality, and counter the effects of chemotherapy drugs. BCL2 family is an important regulatory gene of apoptosis, which is at the end of the regulatory mechanism in the process of apoptosis. These genes play an important role in maintaining the physiological differentiation, development, and dynamic balance of cell numbers. With overexpression of antiapoptotic genes in breast cancer cells, these genes may participate in the process of breast cancer resistance by inhibiting apoptosis, prolonging survival of tumor cells, and promoting proliferation of tumor cells.
It has been found that abnormal expression of β-catenin can promote cell proliferation and division by inhibiting apoptosis, leading to tumor formation.17 This theory has been validated in this study. The addition of Wnt signal–pathway inhibitor FH535 showed that tumor growth in the MM+FH535 group was significantly reduced, the tumor growth–promoting effect of miR106a weakened, the positive expression of β-catenin and Ki67 proteins decreased, and the number of positive cells obviously decreased. They ncreased P53, BAX, and RUNX3 mRNA levels, decreased BCL2 and ABCG2 mRNA levels, increased expression of P53 and RUNX3, and decreased ABCG2. This suggests that FH535 can significantly inhibit tumor growth and weight and induce apoptosis of tumor cells, but this effect was not obvious in the MI group. The expression of mRNA (P53, BAX, RUNX3, BCL2, and ABCG2) was regulated by Wnt-signaling pathway. FH535 and MM+FH535 were further detected, and expression levels of the Wnt signaling–pathway proteins β-catenin, cyclin D1, and cMyc were significantly lower and channel activity inhibited. There are studies that confirm this.18 When β-catenin accumulates to a certain level, it can enter the cell nucleus directly, join TCF4/LEFS, activate downstream CD44, cMyc and cyclin D1 gene expression and transcription, and lead to abnormal cell proliferation.19
Conclusion
Overexpression of miR106a can promote the growth of transplanted breast cancer tumors in nude mice and decrease the sensitivity of transplanted tumors to cisplatin. This illustrates the potential therapeutic value of miR106a in breast cancer and provides new targets and research directions for breast cancer prevention, diagnosis, and treatment.
Disclosure
The authors report no conflicts of interest in this work.
References
1. Chi Y, Huang S, Peng H, et al. Critical role of CDK11p58 in human breast cancer growth and angiogenesis. BMC Cancer. 2015;15(1):701. doi:10.1186/s12885-015-1698-7
2. Wang L, Shang X, Feng Q. LncRNA TATDN1 contributes to the cisplatin resistance of non-small cell lung cancer through TATDN1/miR-451/TRIM66 axis. Cancer Biol Ther. 2019;20(3):261–271. doi:10.1080/15384047.2018.1529091
3. Shin S, Park S, Hwang B, et al. MicroRNA-106a suppresses proliferation, migration, and invasion of bladder cancer cells by modulating MAPK signaling, cell cycle regulators, and Ets-1-mediated MMP-2 expression. Oncol Rep. 2016;36(4):2421–2429. doi:10.3892/or.2016.5015
4. Noël A, Gilles C, Foidart J-M. Invasion and metastatic dissemination in breast cancer: mechanisms. Rev Med Liege. 2011;66(5–6):274–278.
5. Yan C, Huang P, Shentu W, et al. Value of double contrast-enhanced ultrasound qontraXt three-dimensional pseudocolor quantitative analysis to therapeutic effect evaluation of preoperative neoadjuvant chemotherapy in advanced gastric cancer patients. Chin J Oncol. 2018;40(11):857–863.
6. Atkinson CJ, Kawamata F, Liu C, et al. EGFR and prion protein promote signaling via FOXO3a-KLF5 resulting in clinical resistance to platinum agents in colorectal cancer. Mol Oncol. 2019;13(4):725–737. doi:10.1002/mol2.2019.13.issue-4
7. Clevers H, Loh KM, Nusse R. An integral program for tissue renewal and regeneration: wnt signaling and stem cell control. Science. 2014;346(6205):1248012. doi:10.1126/science.1248012
8. Sun Y, Zhu Q, Zhou M, et al. Restoration of miRNA-148a in pancreatic cancer reduces invasion and metastasis by inhibiting the Wnt/β-catenin signaling pathway via downregulating maternally expressed gene-3. Exp Ther Med. 2019;17(1):639–648. doi:10.3892/etm.2018.7026
9. Cui X, Han L. Expression of Wnt2 gene in human breast cancer tissue and effects of targeted suppression gene expression on proliferation, migration and invasion of breast cancer cell line MCF-7. Pract J Cancer. 2018;33(7):1053–1056.
10. Gao C, Yuan X, Jiang Z, et al. Regulation of AKT phosphorylation by GSK3β and PTEN to control chemoresistance in breast cancer. Breast Cancer Res Treat. 2019;176(2):291–301. doi:10.1007/s10549-019-05239-3
11. Li P, Xu Q, Zhang D, et al. Upregulated miR-106a plays an oncogenic role in pancreatic cancer. FEBS Lett. 2014;588(5):705–712. doi:10.1016/j.febslet.2014.01.007
12. Yi D, Xu L, Wang R, Lu X, Sang J. miR-381 overcomes cisplatin resistance in breast cancer by targeting MDR1. Cell Biol Int. 2019;43(1):12–21. doi:10.1002/cbin.v43.1
13. Zhu W, Li J, Wu S, et al. Triptolide cooperates with cisplatin to induce apoptosis in gemcitabine-resistant pancreatic cancer. Pancreas. 2012;41(7):1029–1038. doi:10.1097/MPA.0b013e31824abdc0
14. Fahim Golestaneh A, Lecker LSM, Schlegel J, et al. Large scale in vivo micro-RNA loss of function screen identified miR-29a, miR-100 and miR-155 as modulators of radioresistance and tumor-stroma communication. Int J Cancer. 2019;144(11):2774–2781.
15. Yeung J, Esposito MT, Gandillet A, et al. β-catenin mediates the establishment and drug resistance of MLL leukemic stem cells. Cancer Cell. 2010;18(6):606–618. doi:10.1016/j.ccr.2010.10.032
16. Akiyama T. Wnt/β-catenin signaling. Cytokine Growth Factor Rev. 2000;11(4):273–282. doi:10.1016/S1359-6101(00)00011-3
17. Ben-Ze’ev A, Shtutman M, Zhurinsky J. The integration of cell adhesion with gene expression: the role of β-catenin. Exp Cell Res. 2000;261(1):75–82. doi:10.1006/excr.2000.5045
18. Li C, Jiao G, Wu W, et al. Exosomes from bone marrow mesenchymal stem cells inhibit neuronal apoptosis and promote motor function recovery via the Wnt/β-catenin signaling pathway. Cell Transplant. 2019;28(11):0963689719870999.
19. Yeung KT, Yang J. Epithelial–mesenchymal transition in tumor metastasis. Mol Oncol. 2017;11(1):28–39. doi:10.1002/1878-0261.12017
 © 2020 The Author(s). This work is published and licensed by Dove Medical Press Limited. The
full terms of this license are available at https://www.dovepress.com/terms
and incorporate the Creative Commons Attribution
- Non Commercial (unported, 3.0) License.
By accessing the work you hereby accept the Terms. Non-commercial uses of the work are permitted
without any further permission from Dove Medical Press Limited, provided the work is properly
attributed. For permission for commercial use of this work, please see paragraphs 4.2 and 5 of our Terms.
© 2020 The Author(s). This work is published and licensed by Dove Medical Press Limited. The
full terms of this license are available at https://www.dovepress.com/terms
and incorporate the Creative Commons Attribution
- Non Commercial (unported, 3.0) License.
By accessing the work you hereby accept the Terms. Non-commercial uses of the work are permitted
without any further permission from Dove Medical Press Limited, provided the work is properly
attributed. For permission for commercial use of this work, please see paragraphs 4.2 and 5 of our Terms.