Back to Journals » OncoTargets and Therapy » Volume 13
MiR-935/HIF1α Feedback Loop Inhibits the Proliferation and Invasiveness of Glioma
Authors Huang G ![]() , Chen J, Liu J, Zhang X, Duan H, Fang Q
, Chen J, Liu J, Zhang X, Duan H, Fang Q
Received 1 January 2020
Accepted for publication 12 August 2020
Published 23 October 2020 Volume 2020:13 Pages 10817—10828
DOI https://doi.org/10.2147/OTT.S244409
Checked for plagiarism Yes
Review by Single anonymous peer review
Peer reviewer comments 2
Editor who approved publication: Dr Arseniy Yuzhalin
Guangjing Huang,1,2 Jie Chen,2 Jing Liu,2 Xiaoyan Zhang,2 Haijie Duan,2 Qian Fang3,4
1Department of Biomedicine, Medical College of Guizhou University, Guiyang, Guizhou, 550000, People’s Republic of China; 2Anesthesiology Department, Guizhou Provincial People’ s Hospital, Guiyang, Guizhou, 550000, People’s Republic of China; 3Medical College of Guizhou University, Guiyang, Guizhou, 550000, People’s Republic of China; 4Nursing Department, Guizhou Provincial People’s Hospital, Guiyang, Guizhou, 550000, People’s Republic of China
Correspondence: Qian Fang Email [email protected]
Objective: The biological functions and molecular mechanisms of miR-935 have been widely investigated in various types of cancer. The aim of the present study was to explore the function of miR-935 in glioma.
Methods: Bioinformatic analysis and quantitative real-time fluorescent PCR (qRT-PCR) were used to determine the expression of miR-935 in glioma tissues and glioma cell lines. Chi-square test was performed to analyze the relationship between the expression of miR-935 and clinical traits. CCK-8 assay, colony formation assay, cell cycle analysis and subcutaneous tumorigenesis model in nude mice were conducted to determine the effects of miR-935 on the proliferation of glioma cells both in vitro and in vivo. Wound healing and transwell assays were used to detect the effects of miR-935 on the migration and invasion of glioma cells in vitro. The relationship between miR-935 and HIF1α was analyzed using bioinformatics, luciferase reporter assay and Western blotting.
Results: The expression of miR-935 was lower in glioma tissues than in the adjacent tissues, and in cell lines than in the normal human astrocytes (NHAs), and the low expression levels of miR-935 predicted a poor outcome. Exogenous overexpression of miR-935 inhibited the proliferation of glioma cells both in vitro and in vivo, and suppressed the migration and invasion of glioma cells in vitro. HIF1α was identified as the target of miR-935, whereas miR-935 overexpression decreased the expression of HIF1α and its target genes VEGF, MCL1 and GLUT1. Strikingly, overexpression of HIF1α significantly decreased the expression of miR-935, whereas silencing HIF1α increased the expression of miR-935. Similarly, HIF1α overexpression remarkably reversed the inhibitory effects of miR-935 on the proliferation, migration and invasion of glioma cells.
Conclusion: Overall, present study reveals the presence of miR-935/HIF1α feedback loop in glioma, which inhibits the development of glioma. This feedback loop may be a potential target for the treatment of glioma.
Keywords: glioma, miR-935, HIF1α, proliferation, migration
Introduction
Glioma is identified as the most common type of cancer of the central nervous system according to the pathological classification of the World Health Organization.1 Despite performing radical operation plus postoperative radiotherapy2 and chemotherapy,3 the overall survival rate of patients who suffer from glioma is still low.4 Therefore, it will be imperative to explore the potential mechanisms involved in the development of glioma, as well as investigating the novel biomarkers for diagnosis and treatment targets.
MicroRNA (miRNA) is a type of noncoding RNAs (~22 nt), which can directly bind to their target genes and inhibit their expression, consequently affecting various biological processes of the cell including proliferation,5 differentiation6 and metastasis.7 Previous studies have revealed that dysregulation of miRNAs is a principal factor in the development of glioma. Peng et al established that miR-25-3p increased the proliferation and migration ability of glioma cells by inhibiting FBXW7 and DKK3.8 Zhang et al demonstrated that miR-490-3p may function as a tumor-suppressive miRNA in glioma by suppressing expression of the high-mobility group AT-hook 2.9 Pan indicated that miR-374b can be a novel biomarker for the diagnosis of glioma and act as a tumor-suppressor for glioma.10 In addition, Zhang et al revealed that let-7b expression decreased in glioma tissues thus predicting a poor outcome.11 Furthermore, Zhang J et al revealed that miR-767-5p promoted the proliferation and metastasis of glioma cells by decreasing the expression of SUZ12.12 However, the functions of miRNAs in the progression of glioma remain unknown. Therefore, a clear understanding of the effects and related molecular mechanisms of miRNAs will contribute to the identification of novel biomarkers for the diagnosis of glioma, and finding potential targets for treatment.
Cancer cells such as glioma cells tend to consume more oxygen than the normal cells and produce ATP via glycolysis rather than the tricarboxylic acid cycle.13 This phenomenon known as Warburg effect was first reported by Warburg Otto, and cancer cells can generate sufficient energy for proliferation and metastasis through this metabolic reprogramming.14 Hypoxia-inducible factors (HIFs) are the principal factors that initiate a cascade of events causing the Warburg effect. HIF1α is a key member of the HIFs family that can regulate Warburg effect by enhancing the transcription of target genes.15 Han et al demonstrated that HIF1α promoted the expression of PKM2 (the primary enzyme of glycolysis) and increased glycolysis, proliferation and mobility of glioma cells.16 Lehman et al indicated that pharmacologic inhibition of HIF1α suppressed glycolysis and proliferation of glioma cells by modulating the expression of Glut1.17 Previous studies have exhibited the effects of several microRNAs on migration and proliferation via targeting metabolic genes in glioma. Overexpression of miR-329-3p enhances radiosensitivity in glioma cells by inhibiting NEK2 induced glycolysis.18 MiR-338-3p inhibited the expression of metabolism-related gene PKM2 and decreased proliferation in glioma cells.18 Similarly, miR-326 can potentially inhibit PKM2-induced glycolysis and suppress the proliferation in glioma cells.19
In the present study, the biological functions and potential mechanisms of miR-935 in glioma were analyzed. This study revealed that miR-935 was significantly down-regulated in glioma tissues and six cell lines in comparison with adjacent tissues and normal human astrocytes. MiR-935 overexpression can inhibit the proliferation ability of glioma cells both in vitro and in vivo, and suppress mobility by interacting with HIF1α. Thus, miR-935 may serve as tumor-suppressive miRNA for glioma, and has the potential of being used as a biomarker for the diagnosis of glioma and as an effective therapeutic target.
Materials and Methods
Bioinformatic Analysis
RNA sequencing data and corresponding clinical data for 325 glioma samples were collected from the Chinese Glioma Genome Atlas (CGGA) RNA sequencing database (http://www.cgga.org.cn). We initially analysed the expression of miR-935 in different grade of the tumor. Afterwards, a median expression value (profile value of 3769.654 in the CGGA database) was set as the cut-off point distinguishing between the high- and low-expression cohorts of patients in the CGGA database. The relationship between miR-935 expression and patient prognosis was analyzed using information from the CGGA glioma database.
Patients and Tissue Collection
A total of 93 glioma tissues and adjacent non-tumor tissues were obtained from the Renmin Hospital of Guizhou Province. The tissue samples were collected from glioma patients who have signed written informed consent. The study was approved by the Ethics Committee of Renmin Hospital of Guizhou Province and was performed in accordance with the principles embodied in the Declaration of Helsinki. All samples were stored in liquid nitrogen before performing experiments.
Cell Culture and Lentivirus Transfection
Six glioma cell lines (T98, U87, U251, U118, A172 and LN229) and primary normal human astrocytes (NHAs) were purchased from the American Type Culture Collection (ATCC, Manassas, VA, USA). All cell lines were cultured in Dulbecco’s Modified Eagle’s Medium (DMEM; Gibco, USA) containing 10% fetal bovine serum (FBS) (Gibco, USA) in a humidified environment with 5% CO2. Human lentiviruses with overexpressed miR-935 (LV-miR-935), the corresponding negative control (NC) lentiviruses of LV-miR-935, sh-HIF1α, sh-scramble, human lentiviruses with overexpressed HIF1α (LV-HIF1α) and the corresponding empty vector lentiviruses of HIF1α were obtained from GeneCopoeia (Guangzhou, China). The entire transfection process was performed according to the manufacturer’s instructions. The sequence of sh-HIF1α used in the present study was AGTCGACACAGCCTCGATATG.
Quantitative Real-Time PCR (qRT-PCR)
Total RNA in cells or tissues was extracted using Trizol reagent (Takara, Japan) according to the manufacturer’s instructions. cDNAs of mRNAs were generated through reverse-transcription of total RNA using Prime Script RT Master Mix (Yeasen, Shanghai, China), whereas miRNAs were reverse transcribed using the miRNA First Strand cDNA Synthesis Kit (Yeasen Biotech Co., Ltd., Shanghai, China). Finally, the expression levels of target miRNAs and mRNAs were measured using SYBR reagent (Yeasan, Shanghai, China), β-actin was used as a reference gene for the target miRNA, and U6 was set as a reference gene for miR-935. Relative expression levels of genes were analysed using the 2−ΔΔCT method. Primers used included:
MCL1 Forward sequence: TGCTTCGGAAACTGGACATCA,
MCL1 Reversed sequence: TAGCCACAAAGGCACCAAAAG;
Glut1 Forward sequence: ATTGGCTCCGGTATCGTCAAC,
Glut1 Reversed sequence: GCTCAGATAGGACATCCAGGGTA;
VEGF Reversed sequence: AGGGCAGAATCATCACGAAGT,
VEGF Forward sequence: AGGGTCTCGATTGGATGGCA;
U6 Forward sequence: 5′-GCTTCGGCAGCACATATACTAAAAT-3′,
U6 Reverse sequence: 5′-CGCTTCACGAATTTGCGTGTCAT-3′;
β-actin Forward sequence: CATGTACGTTGCTATCCAGGC,
β-actin Reverse sequence: CTCCTTAATGTC ACGCACGAT.
Cell Counting Kit-8 (CCK 8) Assay
A total of 5х103 cells were seeded into 96-well plates, with each group having 6 replicates. Finally, 10 μL CCK-8 solution (Boster, Wuhan, China) was added to each well at different time intervals (0, 24, 48, 72 and 96 hours) and incubated for 2 hours in a humidified environment with 5% CO2. Absorbance of cells was measured at a wavelength of 450 nm using Varioskan LUX microplate reader (Thermo Fisher Scientific, USA).
Colony Formation Assay
Cells were seeded into 6-well plates at a density of 5×10² cells per well and cultured in DMEM media containing 10% FBS. After continuous culturing of cells for 2 weeks, the media were replaced every 4 days. Cells were subsequently stained using 1% crystal violet after being fixed in 4% paraformaldehyde for 15 minutes. The number of colonies formed was counted and photographed.
Cell Cycle Distribution
A total of 1×10⁵ cells were treated with DMEM culture without FBS for 24 hours to synchronize cell cultures. The culture medium was then substituted with DMEM culture medium which contained 10% FBS. Cells were harvested after 48 hours and fixed in 75% ethanol at −20°C for 24 hours. Afterwards, cells were rinsed in PBS three times, rehydrated and resuspended in propidium iodide (PI)-RNase A solution (Invitrogen, USA) at 37°C for 30 minutes. Cell cycle was analyzed with a FACSCalibur flow cytometer (Biosciences, San Jose, CA, USA).
Wound-Healing Assay
The T98 and U87 cells were plated into 6-well plates at 1×10⁶ cells per well and incubated at 37°C for 24 hours. The cells were serum-starved for 24 hours at 100% confluence. Cell monolayer was then scraped with a 200-μL sterile pipette tip to form a central linear wound. Cells were washed in PBS three times, and cultured in DMEM medium without FBS at 37°C and 5% CO2. The stained cells were then observed under an optical microscope (magnification of ×40) (Olympus, Japan) and the wound closure rate was recorded after 24 hours. The average clearance of the wound was considered 100% at 0 hours. The relative migration rate was calculated according to the formula: Relative migration rate = (Streat-0h – Streat-24h)/(SNC-0h – SNC-24h) × 100%, where Streat-0h and Streat-24h were the areas of the scratch at 0 h and 24 hours, respectively, in the treatment group, SNC-0h and SNC-24h were the areas of the scratch at 0 h and 24 hours, respectively, in the NC group.
Transwell Invasion Assay
A total of 2×10⁴ T98 and U87 cells were resuspended in serum-free DMEM and placed into the upper chamber of transwell inserts (Invitrogen; USA) with 8-μm pores, which had been pre-coated with matrigel (Becton, Dickinson and Company; USA) at 37°C. DMEM containing 10% FBS was placed in the lower chamber as a chemical attractant, and the inserts incubated at 37°C and 5% CO2 for 24 hours. The cells were fixed with 4% paraformaldehyde for 15 min after removing the non-invasive cells on the membrane surface, stained with 0.5% crystal violet for 30 min, counted and photographed under an optical microscope fitted with a digital camera (magnification, ×40). Invasive cells were counted in five randomly selected fields for each sample.
Western Blotting
Total proteins were extracted using RIPA buffer (Boster, Wuhan, China) with a protease inhibitor PMSF (Boster, Wuhan, China). BCA method was used to determine the protein levels in cells. Subsequently, the protein samples were separated using 10% SDS-PAGE and transferred onto a PVDF membrane. This was followed by blocking with 5% fat-free milk (Servicebio, Wuhan, China) at room temperature for 2 hours, and incubation of membranes overnight at 4°C with the following primary antibodies diluted at 1:1000: anti-HIF1α, anti-MCL1, anti-VEGF, anti-Glut1 and β-actin (Proteintech, Wuhan, China). The membranes were rinsed in TBST three times, and then incubated with horseradish peroxidase (HRP) conjugated rabbit or mouse secondary antibodies for 2 hours. Densitometric quantification was performed using the Image J software (version 1.50i) to analyse intensity of the protein bands.
Animal Experiments
Ten female BALB/C nude mice (4–6 weeks; weight, 16~17g) were purchased from the Beijing Vital River Laboratory Animal Technology Co Ltd (Beijing, China). We first constructed the T98 cells with overexpressed miR-935 and normal control cells. Afterwards, a total of 1×10⁷ T98 cells with overexpressed miR-935 and normal control T98 cells were implanted into the subcutaneous tissues of the right upper flank of mice. The volume of tumor tissues was measured on a weekly basis and calculated using the following formula: Volume (mm3) = (Length×Width2)/2. All mice were euthanized after 5 weeks and the weight of tumors was measured. All animal experiments in the present study were approved by the Ethics Committee of Renmin Hospital of Guizhou Province Medical University (Guizhou, China) and were performed in compliance with the National Institutes of Health Guide for the Care and Use of Laboratory Animals.
Prediction of miRNA Targets
Potential targets of miR-935 were predicted using the online resource, TargetScan (http://www.targetscan.org/). Target genes with absolute values of cumulative weighted context++ score >0.6 were considered credible.
Dual Luciferase Reporter Assays
A dual-luciferase reporter assay was conducted to verify whether miR-935 binds to HIF1α and regulates its expression. The wild type (Wt) and mutant (Mut) type 3ʹ-UTR of HIF1α, which contains supposed binding sites of miR-935, were synthesized and sub-cloned into the psiCHECK-2 luciferase reporter vector (Promega Corporation, USA). After culturing for 24 hours, a total of 1×10⁴ T98 and U87 cells were co-transfected with Wt or Mut types of HIF1α luciferase reporter vector, with miR-935 mimics or miR-935 negative control vector. Finally, a Dual-Luciferase Reporter Assay System (Promega, USA) was used to measure luciferase activities. Lipofectamine 2000 (Invitrogen, USA) was used during the entire process of transient transfection.
Statistical Analyses
Statistical analyses were conducted using SPSS statistical software version 21.0. Statistical analysis of the difference in means between two groups was conducted using a two-tailed Student’s t-test, whereas differences between multiple groups were analysed by one-way analysis of variance (ANOVA) followed with Dunnett’s post hoc test. P<0.05 was considered statistically significant.
Results
MiR-935 Expression Was Down-Regulated in Glioma
Analysis of miR-935 expression using the CGGA online database revealed that low expression of miR-935 predicted a poor outcome in patients with glioma (Figure 1A). The expression of miR-935 in glioma tissues of patients in stage IV was significantly lower than in patients of stages II and III (Figure 1B). We then detected the expression of miR-935 in additional glioma tissues (n=93) and adjacent non-tumor tissues (n=93). Results demonstrated that the expression of miR-935 was decreased significantly in glioma tissues (P<0.01) (Figure 1C). The expression of miR-935 was significantly lower in glioma tissues obtained from patients in stages III and IV than patients in stages I and II (P<0.01) (Figure 1D). Similarly, an assessment of the overall survival time of these glioma patients revealed that the expression of miR-935 was positively correlated with overall survival rate (P<0.05) (Figure 1E). In addition, we established that the expression of miR-935 was negatively correlated with tumor size, tumor stage, and local invasion (Table 1). We observed that the expression of miR-935 decreased significantly (P<0.001) in 6 glioma cell lines (T98, U87, U251, U118, A172 and LN229) in comparison with normal human astrocytes (NHAs) (Figure 1F).
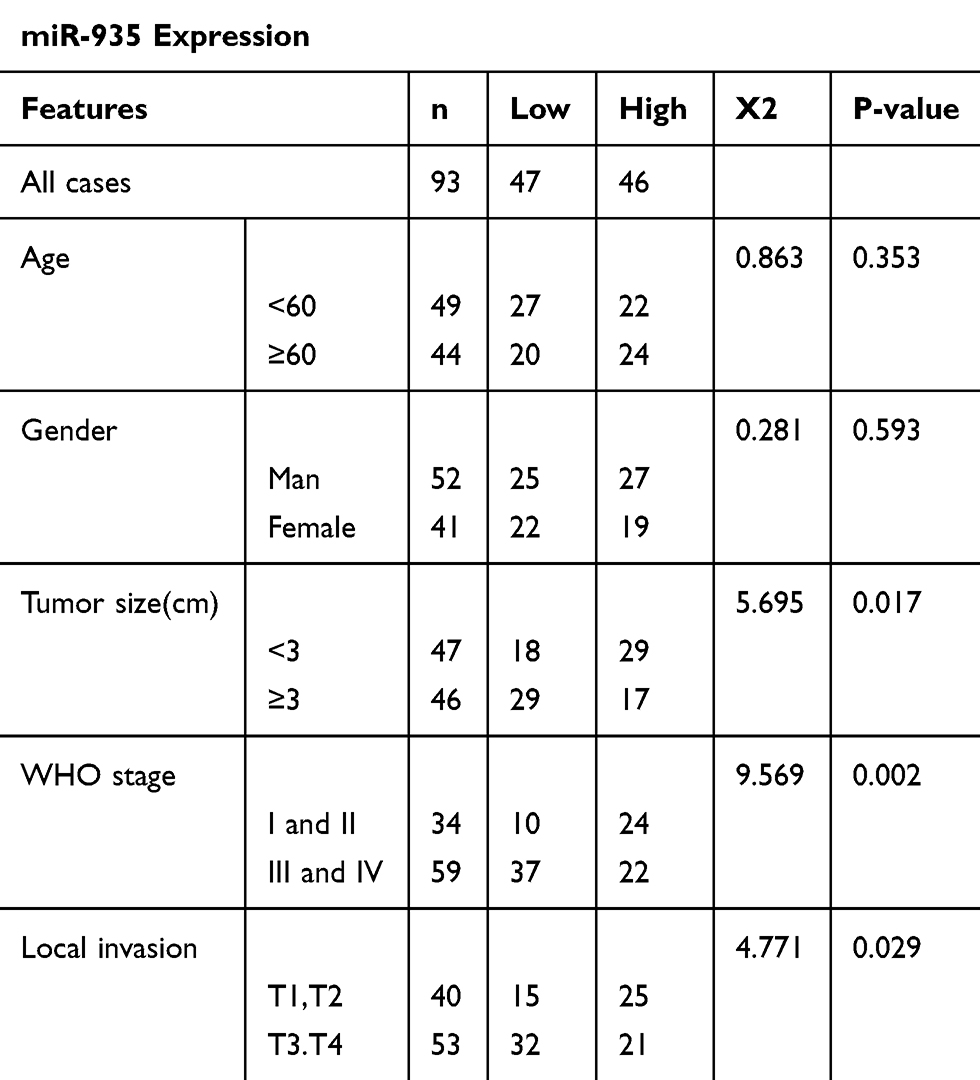 |
Table 1 Chi-Square Analysis for the Relationship Between the Expression of miR-935 and Clinical Traits |
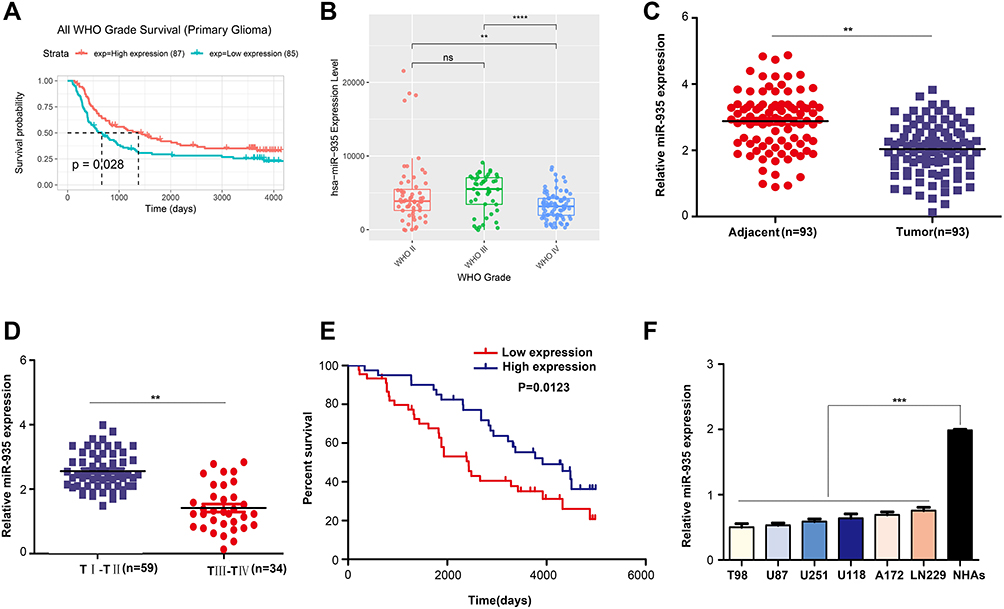 |
Figure 1 Expression of miR-935 was significantly down-regulated in glioma. (A) The median expression value (profile value= 3769.654 from the CGGA database) was set as the cut-off point for distinguishing between the high and low-expression cohorts of patients in the CGGA database. Bioinformatic analysis revealed low expression of miR-935 in patients with glioma, which predicted low survival rate. (B) The expression of miR-935 in glioma tissues obtained from patients in stages II, III and IV of glioma based on the CGGA database. (C) The expression of miR-935 was detected in the additional 93 glioma and 93 adjacent tissues using quantitative reverse-transcription PCR. (D) The expression of miR-935 in patients with stage I–II and III–IV glioma detected using qRT-PCR. (E) The 93 patients with glioma were divided into low (red) and high (blue) expression groups using the median expression value of miR-935 (relative expression =1.937) as a cut-off point. Kaplan-Meier curve indicating the survival rate in the miR-935 high expression and low expression groups. (F) The expression of miR-935 in glioma cell lines T98, U87, U251, U118, A172 and LN229, and detection of the primary normal human astrocytes (NHAs) using quantitative reverse-transcription PCR. **P<0.01; ***P<0.001, ****P<0.0001. |
MiR-935 Overexpression Inhibited Proliferation of Glioma Cells in vitro
We constructed T98 and U87 cells with stably over-expressed miR-935 to identify the biological functions of miR-935 in glioma (Figure 2A). CCK-8 assay results indicated that the proliferation ability of T98 and U87 cells decreased significantly (P<0.05) while miR-935 was over-expressed (Figure 2B). The colony numbers in the group with overexpressed miR-935 were significantly lower (P<0.01) than in the NC group (Figure 2C). The cell cycle analysis revealed that overexpression of miR-935 in T98 and U87 cells was considerably blocked in the G1 phase (Figure 2D). These results indicated that miR-935 overexpression suppressed the proliferation of glioma cells in vitro.
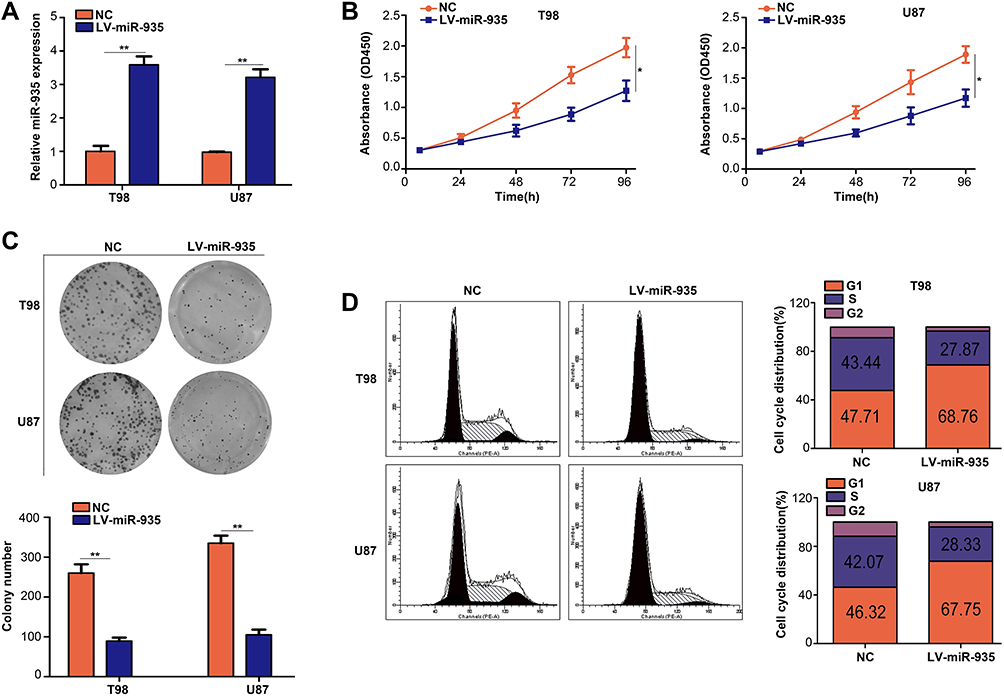 |
Figure 2 MiR-935 overexpression suppressed proliferation of glioma cells in vitro. (A) Detection of transfection efficiency of lentiviruses with miR-935 overexpression (LV-miR-935) and negative control lentiviruses (NC) using quantitative reverse-transcription PCR. (B) Detection of the effect of miR-935 overexpression on glioma cell proliferation using CCK-8 assay. (C) The effect of miR-935 overexpression on the viability of glioma cell colony formation detected using colony formation assays. (D) Effects of miR-935 overexpression on cell cycle progression in glioma cells. *P<0.05, **P<0.01. |
MiR-935 Overexpression Suppressed Migration and Invasion of Glioma Cells in vitro
The results of wound-healing assays revealed that miR-935 overexpression significantly decreased the migration rates of T98 (P<0.001) and U87 (P<0.01) cell lines within 48 hours (Figure 3A). Results of the transwell assays indicated that the invasion ability of T98 (P<0.001) and U87 (P<0.01) cell lines was significantly decreased, while the expression of miR-935 was increased (Figure 3B).
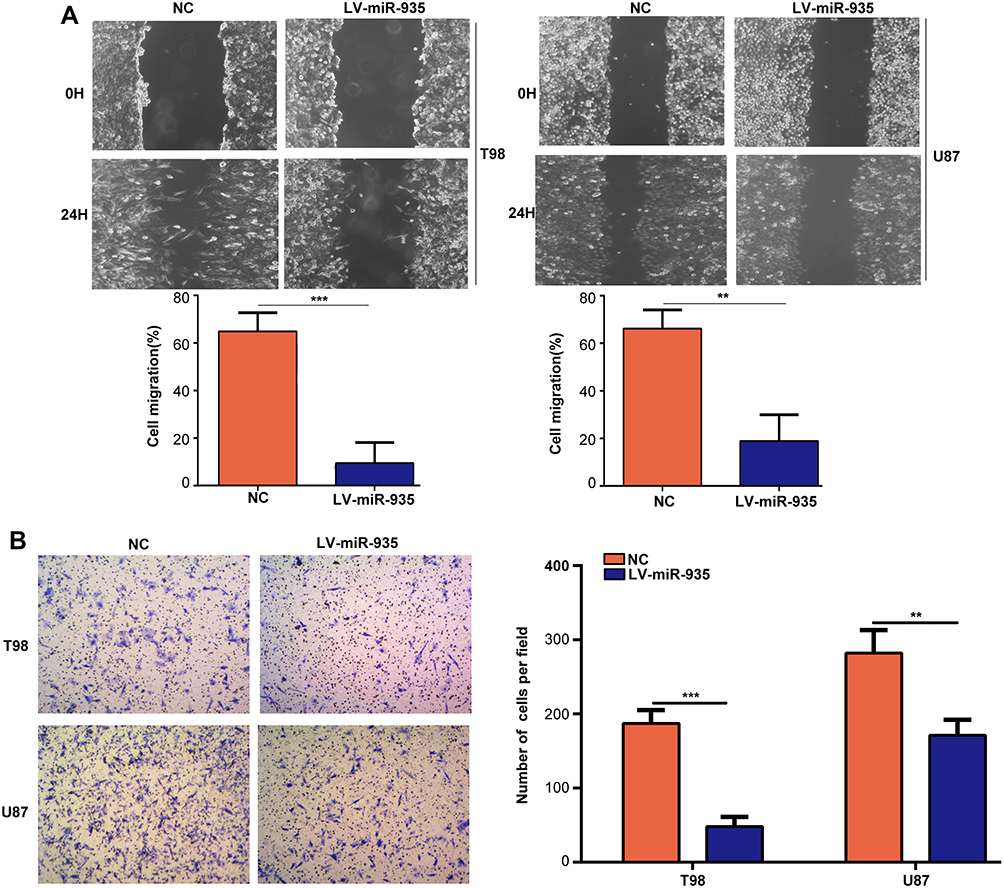 |
Figure 3 MiR-935 overexpression suppressed glioma cells migration and invasion. (A) Detection of the effect of miR-935 overexpression on migration of T98 and U87 cell lines using wound-healing assay. (B) Detection of the effect of miR-935 overexpression on invasion of T98 and U87 cell lines using transwell assay. **P<0.01, ***P<0.001. |
MiR-935 Suppressed Glioma Cell Growth in vivo
We assessed the effects of miR-935 using in vivo experiments based on the evidence that miR-935 overexpression can inhibit the proliferation of glioma cells in vitro. Results revealed that overexpression of miR-935 suppressed glioma tumor growth in comparison with the NC group (P<0.05) (Figure 4A–C). Furthermore, weight loss in nude mice with overexpressed miR-935 was more gradual than in the NC group (P<0.05) (Figure 4D). These results demonstrated that miR-935 inhibited the growth of glioma cells in vivo.
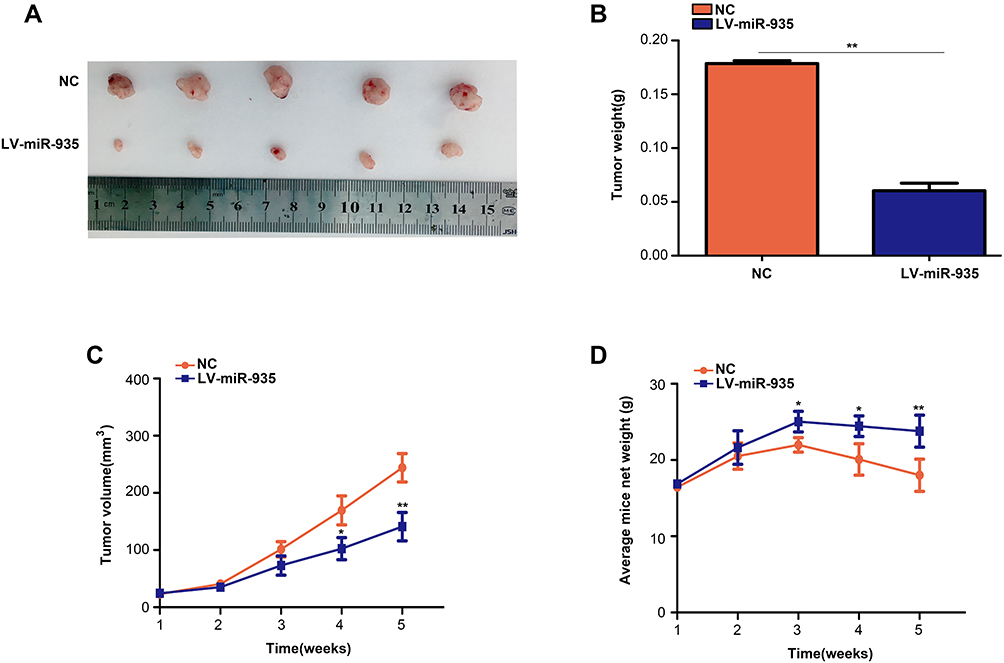 |
Figure 4 MiR-935 inhibited tumor growth in glioma cells in vivo. (A) Images representing subcutaneous tumors of the miR-935 overexpression and control groups. (B) The weight of tumor tissues in the miR-935 overexpression and control groups. (C) T98 cells with stably expressed miR-935 or miR-NC were injected into the subcutaneous tissues of nude mice, and tumor growth was monitored for five weeks. (D) Weekly measurements of the weight of mice in the miR-935 overexpression and miR-NC groups. *P<0.05, **P<0.01. |
HIF1α is a Direct Target of miR-935
According to the prediction results of TargetScan, HIF1α was identified as a direct target gene of miR-935 with high reliability (Figure 5A). Dual-luciferase reporter assays were conducted to verify prediction results of TargetScan and the findings demonstrated that luciferase activity reduced in cells that were co-transfected with the Wt of HIF1α plasmid and miR-935 mimics but not in cells transfected with Mut of HIF1α plasmid and miR-935 mimics (Figure 5B). The increased expression of miR-935 in T98 and U87 cells decreased both mRNA and protein levels of HIF1α (Figure 5C and D). In addition, we established that the expression of HIF1α increased in glioma tissues and reversely co-expressed with the expression of miR-935 (Figure 5E and F). Overall, these findings indicated that HIF1α was a direct target of miR-935.
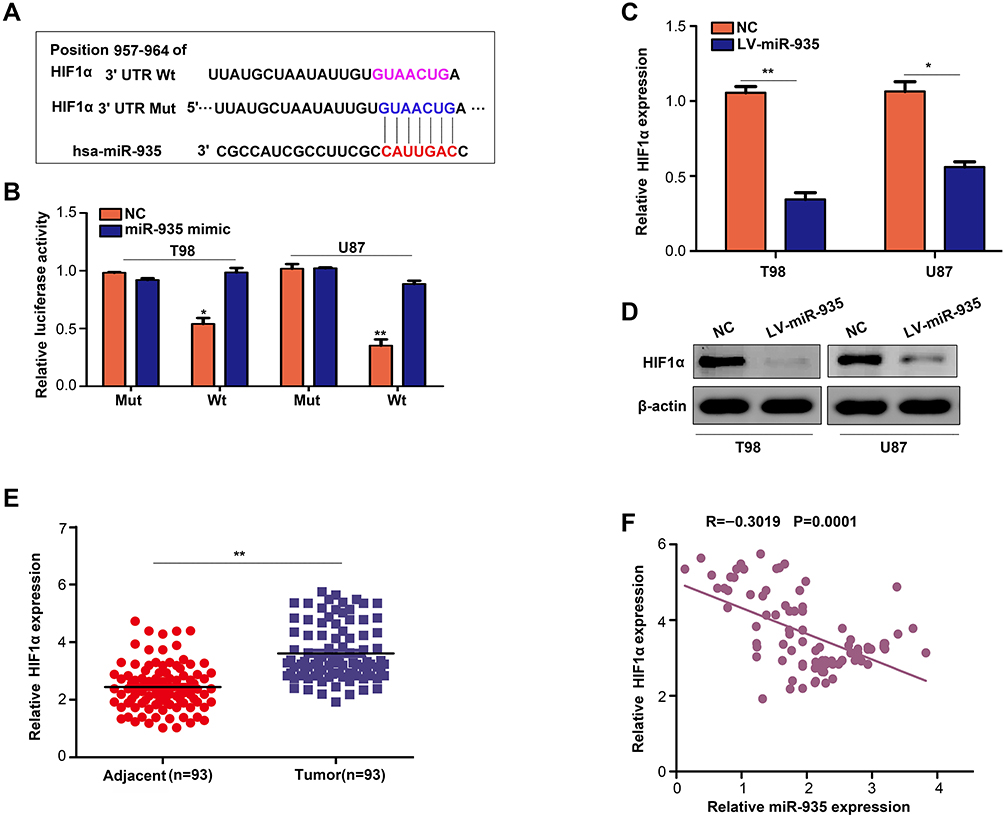 |
Figure 5 HIF1α as a target of miR-935 in glioma. (A) A presentation of the binding sites between miR-935 and HIF1α. (B) The miR-935 mimics inhibited luciferase activity in glioma cells whereas a mutant 3′-UTR HIF1α mRNA reversed this effect. (C, D) Overexpression of miR-935 decreased the mRNA and protein expression levels of HIF1α in T98 and U87 cells. (E) Detection of the expression of HIF1α in glioma and adjacent tissues using qRT-PCR. (F) The expression of miR-935 was negatively correlated with HIF1α in glioma tissues. *P<0.05, **P<0.01. |
MiR-935 and HIF1α Formed a Feedback Loop
We restored the expression of HIF1α in cells with overexpressed miR-935 (Figure 6A and B). Restoration of HIF1α in cells with overexpressed miR-935 significantly increased the mRNA and protein levels of the target genes of HIF1α including VEGF, MCL1 and Glut1 in comparison with miR-935 overexpression in T98 and U87 cells (P<0.01) (Figure 6C and D). Strikingly, we established that the expression of miR-935 was significantly decreased (P<0.05) under hypoxia coupled with an increased expression of HIF1α (Figure 6E and F). Therefore, we speculated that miR-935 was a hypoxia-related miRNA regulated by HIF1α. We then knocked down and overexpressed HIF1α in T98 and U87 cells, and the results indicated that knocking down HIF1α significantly increased the expression of miR-935, whereas HIF1α overexpression decreased the expression of miR-935 (P<0.05) (Figure 6G). These results demonstrated that there was an interconnection between miR-935 and HIF1α.
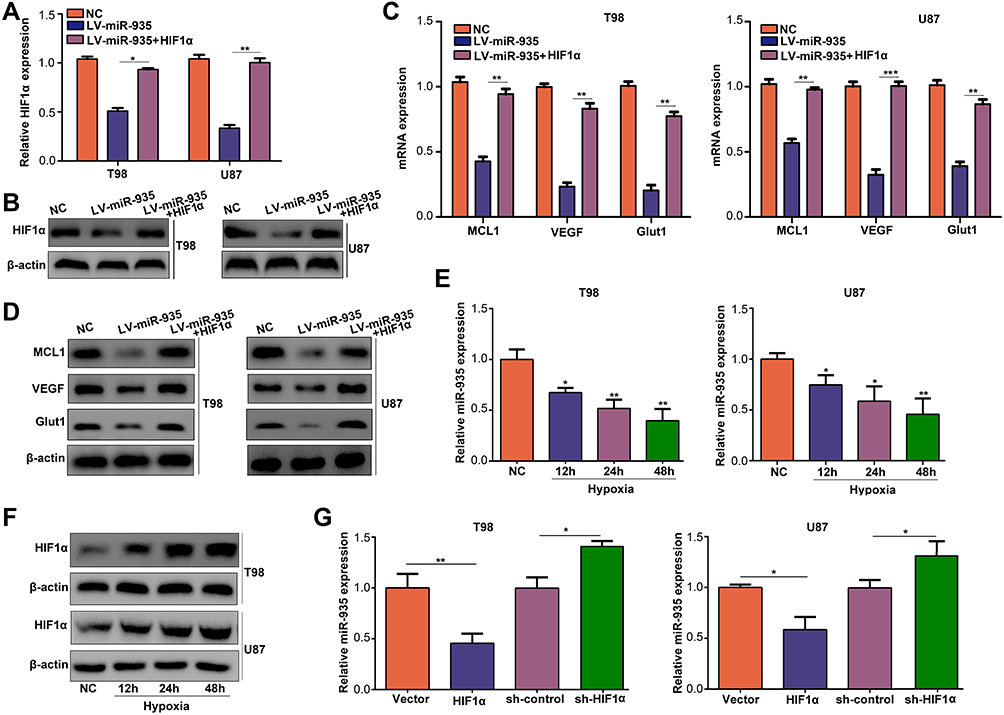 |
Figure 6 MiR-935 and HIF1α formed a feedback loop. (A, B) qRT-PCR and Western blotting results indicating the expression of HIF1α in NC, miR-935 overexpression and co-overexpression of miR-935 and HIF1α in cells. (C, D) The mRNA and protein levels of MCL1, VEGF and Glut1 in NC, miR-935 overexpression, and co-overexpression of miR-935 and HIF1α in cells. (E) Detection of the expression of miR-935 in T98 and U87 cells using RT-qPCR under hypoxic conditions. (F) Detection of the expression of HIF1α in T98 and U87 cells using Western blotting under hypoxic conditions. (G) Detection of the expression of miR-935 using RT-qPCR in NC, HIF1α knockdown and HIF1α overexpression in cells. *P<0.05, **P<0.01, ***P<0.001. |
Restoration of HIF1α Decreased the Inhibitory Effects of miR-935
CCK-8 assays indicated that HIF1α restoration in T98 and U87 cells significantly decreased the inhibitory effects of miR-935 overexpression (Figure 7A). The colony formation ability of cells with both miR-935 and HIF1α overexpression was significantly higher than that of cells with only miR-935 overexpression (Figure 7B). Furthermore, wound-healing assays demonstrated that restoration of HIF1α decreased the inhibitory effects of miR-935 on cell migration (Figure 7C).
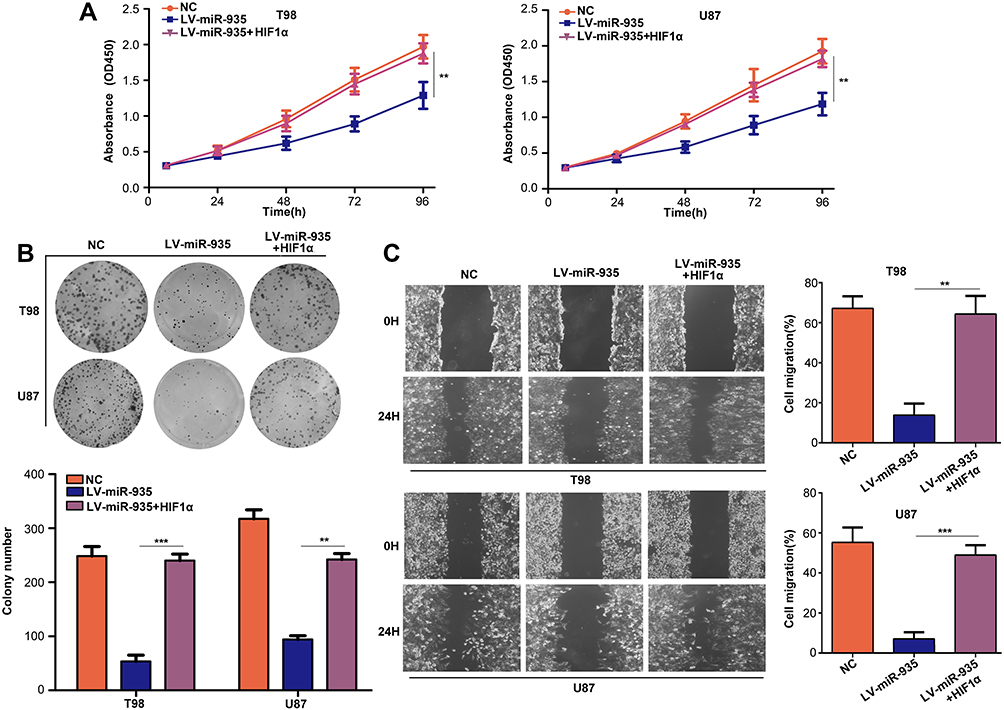 |
Figure 7 Restoration of HIF1α decreased the inhibitory effects of miR-935 overexpression. Cells were divided into three groups and subjected to different treatments: Negative control (NC), miR-935 overexpression (LV-miR-935) and miR-935-HIF1α co-overexpression (LV-miR-935+HIF1α). (A) Detection of cell proliferation in each group using CCK-8 assay. (B) Detection of the colony formation ability in each group using colony formation assay. (C) Detection of cell migration in each group using wound-healing assay. **P<0.01, ***P<0.001. |
Discussion
The complex biological functions of miR-935 in various cancer types have been extensively investigated. In gastric signet ring cell carcinoma, miR-935 functioned as a suppressor and inhibited the proliferation of cells by targeting Notch1.20 MiR-935 exhibited a low expression in lung cancer, predicting a poor outcome in patients with lung cancer.21 However, in colorectal cancer, miR-935 served as an onco-miRNA, promoting proliferation and migration of colorectal cells.22 The expression of miR-935 increased in hepatocellular carcinoma tissues thus predicting a poor outcome in patients.23
The present study explored the expression and the relationship between miR-935 and clinical traits of patients with glioma for the first time. Bioinformatic and qRT-PCR analyses revealed that the expression of miR-935 significantly decreased in glioma tissues in comparison with adjacent tissues. The expression of miR-935 in glioma tissues obtained from patients in Phase III and IV was also substantially lower than that of patients in Phase I and II. Lower expression levels of miR-935 in patients with glioma predicted reduced survival rate. Similarly, analysis of the relationship between the expression of miR-935 and clinical traits revealed that the expression of miR-935 was negatively correlated with tumor size, tumor stage and local invasion. Furthermore, overexpression of miR-935 significantly decreased proliferation, induced cell cycle arrest in glioma cells, and suppressed cell migration and invasion. These findings indicated that miR-935 can act as a suppressor in glioma and increased expression of miR-935 in glioma may inhibit its progression.
MiRNAs directly bind with target genes and regulate their expression, thereby altering proliferation,24,25 migration26 and invasion of cells.27 HIF1α is key member of the hypoxia-inducible factors family that regulates cellular response to hypoxia.28–30 Several studies have demonstrated that HIF1α functions as an oncogene in glioma.31–33 High expression of HIF1α in glioma predicted a poor outcome. HIF1α increases autophagy and development of glioma through regulation of the miR-224-3p/ATG pathway.34,35 HIF1α increases drug resistance in glioma cells under hypoxic conditions by inducing the stem cell phenotypes.35,36 In the present study, HIF1α was identified as a target gene of miR-935. MiR-935 overexpression significantly decreased the expression of HIF1α, and the target genes of HIF1α (VEGF, MCL1 and Glut1). Remarkably, we established that miR-935 is a hypoxia-related miRNA, which is regulated by HIF1α. Moreover, this study revealed that restoration of HIF1α significantly decreased the inhibitory effects of miR-935 overexpression on cell proliferation and migration.
Conclusion
This is the first study to prove that miR-935 and HIF1α form a feedback loop to inhibit the proliferation and migration of glioma cells. The increased expression of miR-935 can improve the treatment of glioma, and miR-935 and HIF1α can be potential biomarkers for the diagnosis of glioma.
Author Contributions
All authors made substantial contributions to the conception and design, acquisition of data, analysis and interpretation of data; contributed to drafting of the article and critically revised the manuscript for important intellectual content; gave final approval of the version to be published; and agreed to be accountable for all aspects of the work.
Funding
The authors received no specific funding for this work.
Disclosure
The authors report no conflicts of interest for this work.
References
1. Yi S, Choi S, Kim SH. In reply: impact of H3.3 K27M mutation on prognosis and survival of grade iv spinal cord glioma on the basis of new 2016 WHO health organization classification of the central nervous system. Neurosurgery. 2018;83(4):E195–E197. doi:10.1093/neuros/nyy348
2. Milbury K, Li J, Weathers SP, et al. Pilot randomized, controlled trial of a dyadic yoga program for glioma patients undergoing radiotherapy and their family caregivers. Neurooncol Pract. 2019;6(4):311–320. doi:10.1093/nop/npy052
3. Lawrie TA, Gillespie D, Dowswell T, et al. Long-term neurocognitive and other side effects of radiotherapy, with or without chemotherapy, for glioma. Cochrane Database Syst Rev. 2019;8:D13047.
4. Chico-Ponce DLF, Perezpena-Diazconti M. Pontine glioma. Pediatric gliomas and the new World Health Organization classification of tumors of the central nervous system. Bol Med Hosp Infant Mex. 2017;74(2):147–153. doi:10.1016/j.bmhimx.2017.02.001
5. Li Z, Gong X, Zhang W, et al. Inhibition of miRNA-34a promotes triple negative cancer cell proliferation by promoting glucose uptake. Exp Ther Med. 2019;18(5):3936–3942. doi:10.3892/etm.2019.8017
6. de Souza LI, Schiavinato J, Paulino LS, et al. High-content screen in human pluripotent cells identifies miRNA-regulated pathways controlling pluripotency and differentiation. Stem Cell Res Ther. 2019;10(1):202. doi:10.1186/s13287-019-1318-6
7. Sun Q, Yang Z, Li P, et al. A novel miRNA identified in GRSF1 complex drives the metastasis via the PIK3R3/AKT/NF-kappaB and TIMP3/MMP9 pathways in cervical cancer cells. Cell Death Dis. 2019;10(9):636. doi:10.1038/s41419-019-1841-5
8. Peng G, Yang C, Liu Y, Shen C. miR-25-3p promotes glioma cell proliferation and migration by targeting FBXW7 and DKK3. Exp Ther Med. 2019;18(1):769–778. doi:10.3892/etm.2019.7583
9. Zhang F, Wu A, Wang Y, Liu J. miR-490-3p functions as a tumor suppressor in glioma by inhibiting high-mobility group AT-hook 2 expression. Exp Ther Med. 2019;18(1):664–670. doi:10.3892/etm.2019.7606
10. Gao J, Bai S, Wang Y, Zhao S, He Z, Wang R. MiR-374b targets GATA3 to promote progression and development of glioblastoma via regulating SEMA3B. Neoplasma. 2019;66(4):543–554. doi:10.4149/neo_2018_180830N659
11. Zhang W, Zhao W, Ge C, et al. Decreased let-7b is associated with poor prognosis in glioma. Medicine (Baltimore). 2019;98(22):e15784. doi:10.1097/MD.0000000000015784
12. Zhang J, Xu S, Xu J, et al. miR7675p inhibits glioma proliferation and metastasis by targeting SUZ12. Oncol Rep. 2019;42(1):55–66. doi:10.3892/or.2019.7156
13. Lu B, Wang Z, Ding Y, et al. RIP1 and RIP3 contribute to shikonin-induced glycolysis suppression in glioma cells via increase of intracellular hydrogen peroxide. Cancer Lett. 2018;425:31–42. doi:10.1016/j.canlet.2018.03.046
14. Liu X, Zhu Q, Guo Y, Xiao Z, Hu L, Xu Q. LncRNA LINC00689 promotes the growth, metastasis and glycolysis of glioma cells by targeting miR-338-3p/PKM2 axis. Biomed Pharmacother. 2019;117:109069. doi:10.1016/j.biopha.2019.109069
15. Siddiqui FA, Prakasam G, Chattopadhyay S, et al. Curcumin decreases Warburg effect in cancer cells by down-regulating pyruvate kinase M2 via mTOR-HIF1alpha inhibition. Sci Rep. 2018;8(1):8323. doi:10.1038/s41598-018-25524-3
16. Han D, Wei W, Chen X, et al. NF-kappaB/RelA-PKM2 mediates inhibition of glycolysis by fenofibrate in glioblastoma cells. Oncotarget. 2015;6(28):26119–26128. doi:10.18632/oncotarget.4444
17. Lehman JA, Hauck PM, Gendron JM, et al. Serdemetan antagonizes the Mdm2-HIF1alpha axis leading to decreased levels of glycolytic enzymes. PLoS One. 2013;8(9):e74741. doi:10.1371/journal.pone.0074741
18. Guan Y, Cao Z, Du J, Liu T, Wang T. Circular RNA circPITX1 knockdown inhibits glycolysis to enhance radiosensitivity of glioma cells by miR-329-3p/NEK2 axis. Cancer Cell Int. 2020;20(1):80. doi:10.1186/s12935-020-01169-z
19. Kefas B, Comeau L, Erdle N, Montgomery E, Amos S, Purow B. Pyruvate kinase M2 is a target of the tumor-suppressive microRNA-326 and regulates the survival of glioma cells. Neuro Oncol. 2010;12(11):1102–1112. doi:10.1093/neuonc/noq080
20. Yan C, Yu J, Kang W, Liu Y, Ma Z, Zhou L. miR-935 suppresses gastric signet ring cell carcinoma tumorigenesis by targeting Notch1 expression. Biochem Biophys Res Commun. 2016;470(1):68–74. doi:10.1016/j.bbrc.2015.12.116
21. Wang T, Chen Y, Nie H, Huang Y, Zhao Y, Yang J. IL-27 inhibits non-small-cell lung cancer cell metastasis by miR-935 in vitro. Onco Targets Ther. 2019;12:1447–1454. doi:10.2147/OTT.S173207
22. Huang Y, Xiao W, Jiang X, Li H. MicroRNA-935 acts as a prognostic marker and promotes cell proliferation, migration, and invasion in colorectal cancer. Cancer Biomark. 2019;26(2):229–237. doi:10.3233/CBM-190183
23. Liu X, Li J, Yu Z, Li J, Sun R, Kan Q. miR-935 promotes liver cancer cell proliferation and migration by targeting SOX7. Oncol Res. 2017;25(3):427–435. doi:10.3727/096504016X14747300207374
24. Fragiadaki M, Zeidler MP. Ankyrin repeat and single KH domain 1 (ANKHD1) drives renal cancer cell proliferation via binding to and altering a subset of miRNAs. J Biol Chem. 2018;293(25):9570–9579. doi:10.1074/jbc.RA117.000975
25. Gurvits N, Autere TA, Repo H, et al. Proliferation-associated miRNAs-494, −205, −21 and −126 detected by in situ hybridization: expression and prognostic potential in breast carcinoma patients. J Cancer Res Clin Oncol. 2018;144(4):657–666. doi:10.1007/s00432-018-2586-8
26. Tang W, Cai P, Huo W, et al. Suppressive action of miRNAs to ARP2/3 complex reduces cell migration and proliferation via RAC isoforms in hirschsprung disease. J Cell Mol Med. 2016;20(7):1266–1275. doi:10.1111/jcmm.12799
27. Bao B, Wang Z, Ali S, et al. Metformin inhibits cell proliferation, migration and invasion by attenuating CSC function mediated by deregulating miRNAs in pancreatic cancer cells. Cancer Prev Res (Phila). 2012;5(3):355–364. doi:10.1158/1940-6207.CAPR-11-0299
28. Yu H, Yu W, Liu Y, Yuan X, Yuan R, Guo Q. Expression of HIF1alpha in cycling stretch induced osteogenic differentiation of bone mesenchymal stem cells. Mol Med Rep. 2019;20(5):4489–4498. doi:10.3892/mmr.2019.10715
29. Geng H, Hao L, Cheng Y, et al. Interaction between CA repeat microsatellites and HIF1alpha regulated the transcriptional activity of porcine IGF1 promoter. J Appl Genet. 2019.
30. Bommi PV, Chand V, Mukhopadhyay NK, Raychaudhuri P, Bagchi S. NER-factor DDB2 regulates HIF1alpha and hypoxia-response genes in HNSCC. Oncogene. 2019.
31. Liang C, Guo S, Yang L. Effects of alltrans retinoic acid on VEGF and HIF1alpha expression in glioma cells under normoxia and hypoxia and its antiangiogenic effect in an intracerebral glioma model. Mol Med Rep. 2014;10(5):2713–2719. doi:10.3892/mmr.2014.2543
32. Wang P, Wan W, Xiong S, et al. HIF1alpha regulates glioma chemosensitivity through the transformation between differentiation and dedifferentiation in various oxygen levels. Sci Rep. 2017;7(1):7965. doi:10.1038/s41598-017-06086-2
33. Qiu S, Chen X, Pang Y, Zhang Z. Lipocalin-2 protects against renal ischemia/reperfusion injury in mice through autophagy activation mediated by HIF1alpha and NF-kappab crosstalk. Biomed Pharmacother. 2018;108:244–253. doi:10.1016/j.biopha.2018.09.023
34. Yang XS, Xu ZW, Yi TL, et al. Ouabain suppresses the growth and migration abilities of glioma U87MG cells through inhibiting the Akt/mTOR signaling pathway and downregulating the expression of HIF1alpha. Mol Med Rep. 2018;17(4):5595–5600. doi:10.3892/mmr.2018.8587
35. Huang S, Qi P, Zhang T, Li F, He X. The HIF1alpha/miR2243p/ATG5 axis affects cell mobility and chemosensitivity by regulating hypoxia induced protective autophagy in glioblastoma and astrocytoma. Oncol Rep. 2019;41(3):1759–1768. doi:10.3892/or.2018.6929
36. Wang P, Lan C, Xiong S, et al. HIF1alpha regulates single differentiated glioma cell dedifferentiation to stem-like cell phenotypes with high tumorigenic potential under hypoxia. Oncotarget. 2017;8(17):28074–28092. doi:10.18632/oncotarget.15888
 © 2020 The Author(s). This work is published and licensed by Dove Medical Press Limited. The
full terms of this license are available at https://www.dovepress.com/terms
and incorporate the Creative Commons Attribution
- Non Commercial (unported, 3.0) License.
By accessing the work you hereby accept the Terms. Non-commercial uses of the work are permitted
without any further permission from Dove Medical Press Limited, provided the work is properly
attributed. For permission for commercial use of this work, please see paragraphs 4.2 and 5 of our Terms.
© 2020 The Author(s). This work is published and licensed by Dove Medical Press Limited. The
full terms of this license are available at https://www.dovepress.com/terms
and incorporate the Creative Commons Attribution
- Non Commercial (unported, 3.0) License.
By accessing the work you hereby accept the Terms. Non-commercial uses of the work are permitted
without any further permission from Dove Medical Press Limited, provided the work is properly
attributed. For permission for commercial use of this work, please see paragraphs 4.2 and 5 of our Terms.