Back to Journals » OncoTargets and Therapy » Volume 12
miR-92b-3p Functions As A Key Gene In Esophageal Squamous Cell Cancer As Determined By Co-Expression Analysis
Authors Wang W ![]() , Fu S, Lin X
, Fu S, Lin X ![]() , Zheng J, Pu J
, Zheng J, Pu J ![]() , Gu Y, Deng W, Liu Y, He Z, Liang W, Wang C
, Gu Y, Deng W, Liu Y, He Z, Liang W, Wang C
Received 26 June 2019
Accepted for publication 30 August 2019
Published 14 October 2019 Volume 2019:12 Pages 8339—8353
DOI https://doi.org/10.2147/OTT.S220823
Checked for plagiarism Yes
Review by Single anonymous peer review
Peer reviewer comments 2
Editor who approved publication: Prof. Dr. Takuya Aoki
Wanpeng Wang,1,* Sengwang Fu,2,* Xiaolu Lin,3,* Jinhui Zheng,3 Juan Pu,1 Yun Gu,4 Weijun Deng,4 Yanyan Liu,1 Zhongxiang He,1 Wei Liang,3 Chengshi Wang1
1Department of Radiotherapy, Lianshui County People’s Hospital, Kangda College of Nanjing Medical University, Huai’an City, JiangSu, People’s Republic of China; 2Department of Gastroenterology and Hepatology, Shanghai General Hospital, Shanghai Jiao Tong University School of Medicine, Shanghai, People’s Republic of China; 3Department of Digestive Endoscopy, Fujian Provincial Hospital, Provincial Clinic Medical College, Fujian Medical University, Fuzhou, People’s Republic of China; 4Department of Thoracic Surgery, Lianshui County People’s Hospital, Kangda College of Nanjing Medical University, Huai’an City, JiangSu, People’s Republic of China
*These authors contributed equally to this work
Correspondence: Juan Pu
Department of Radiotherapy, Lianshui County People’s Hospital, Kangda College of Nanjing Medical University, No.1, Redsun Road, Huai’an City 223400, JiangSu, People’s Republic of China
Tel (+86)13915120038
Email [email protected]
Wei Liang
Department of Digestive Endoscopy, Fujian Provincial Hospital, Provincial Clinic Medical College, Fujian Medical University, No.134 East Street, Fuzhou 350001, People’s Republic of China
Tel (+86)18120888996
Email [email protected]
Background: Esophageal squamous cell carcinoma (ESCC) is a highly aggressive malignancy. The aims of the present study were to screen the critical miRNA and corresponding target genes that related to development of ESCC by weighted gene correlation network analysis (WGCNA) and investigate the functions by experimental validation.
Methods: Datasets of mRNA and miRNA expression data were downloaded from GEO. The R software was used for data preprocessing and differential expression gene analysis. The differentially expressed protein-coding genes (DEGs) and miRNAs (DEMs) were selected (FDR <0.05 or |Fold Change (FC)| >1.5). Meanwhile, 81 expression data of ESCC patients in TCGA combined with clinic information were applied by WGCNA to create networks. The correlational analyses between each module and clinical parameters were conducted, and enrichment analyses of GO and KEGG were subsequently performed. Then, a series of experiments were conducted in ESCC cells by use of miRNA mimics.
Results: In total, 4,023 DEGs and 328 DEMs were screened. After checking good genes and samples, 3,841 genes (3,696 DEGs and 145 DEMs) were used for WGCNA. As a consequence, altogether 11 gene modules were found. Among them, the brown modules were found to be strongly inversely associated with pathological grade. Meanwhile, has-mir-92b, the only miRNA in brown module, had a positive correlation with grade and negatively correlated with potential target gene (KFL4 and DCS2) in the same module. Furthermore, an increased expression of miR-92b-3p and down-regulated KLF4 and DSC2 protein was detected in the ESCC clinical samples. Up-regulated miR-92b-3p shortened G0/G1 phase and promote ESCC cells invasion and migration. Furthermore, we verified that DSC2 and KFL4 was target genes of miR-92b-3p by luciferase report assay.
Conclusion: WGCNA is an efficient approach to system biology. By this procedure, miR-92b-3p was identified as an ESCC-promoting gene by target KLF4 and DCS2.
Keywords: esophageal squamous cell carcinoma, ESCC, bioinformatics, weighted gene co-expression network analysis, WGCNA, mir-92b, KLF4, DSC2
Introduction
Esophageal cancer (EC) is a worldwide disease which is the sixth leading cause of cancer death and the eighth most commonest cancer,1 which has two main histologic types: esophageal squamous cell carcinoma (ESCC) and esophageal adenocarcinoma.2 Of which, the proportion of ESCC reached more than 90 percent of all EC in China.3 Although considerable progress has been made in diagnosis, radical esophagectomy as well as chemoradiotherapy, ESCC remains a dreaded malignant tumor due to its late diagnosis and rapid progression with the overall 5-year survival rate of patients for EC is approximately 10–41%.4 Therefore, early diagnosis and management of the risk factors for ESCC play an important role to develop more accurate diagnosis and optimal therapeutic design in ESCC patients.5 However, currently, there are no biomarkers for early detection and follow-up of the disease. Therefore, molecular targeted therapy is the best choice of non-surgical treatment for ESCC.
MicroRNAs (miRNA) are small, non-coding RNAs, which are usually 21–23 nucleotides long and negatively regulate gene expression by binding to the 3′ untranslated region (UTR) of target mRNAs. Increasing evidence suggests that miRNAs can act as oncogenes or tumor suppressors in multiple tumor through participating in biological processes, such as cell proliferation, differentiation, and cell invasion.6,7 However, few miRNAs have been reported to be associated with pathological grade of ESCC. Therefore, understanding the potential regulation of miRNAs and mRNAs expression is critical for revealing novel therapeutic targets and prognostic factors in management of ESCC.8,9
With the emergence of microarray technologies, transcriptome analysis can provide an objective description of gene expression changes in multiple diseases and has been widely used and promoted in molecular mechanism research of ESCC.10 Meanwhile, the Gene Expression Omnibus (GEO) provides the largest public repository of microarray data in existence. Therefore, effective integration of ESCC GEO datasets may lead to identification of differentially expressed miRNAs and mRNAs at transcription level, which provide a better research method for ESCC diagnosis, treatment, and prognosis.
Traditional molecular biology studies the function of individual genes or protein. However traditional molecular biology can only explain the local part of the biological system, and difficult to make comprehensive exploration of the whole biological system in the disease. For this reason, weighted gene correlation network analysis (WGCNA) is more and more applied in medical research. By applying this method, gene co-expression or correlation modules can be reconstructed and summarized by use of module eigengene (ME) or hub genes.11 In present work, as showed in Supplementary Figure S1 (the flowchart), a computational strategy was used to conduct systematic research on differentially expressed genes (DEGs) and miRNAs (DEMs) of ESCC based on ten datasets. Then DGEs and DEMs were used for WGCNA based on the Cancer Genome Atlas (TCGA) dataset which included 81 expression profiles of ESCC patients. The results of WGCNA combined with DAVID were used to identify the specific module which associated with the pathological parameters of ESCC, and the hub genes were detected through intramodular connectivity. Finally, miRNA mimics were used to validate the function of the hub miRNAs in ESCC cell lines.
Methods
Datasets Collection
The ten microarray datasets were retrieved from the GEO database (https://www.ncbi.nlm.nih.gov/geo/) in November 2017. Of these, GSE77861, GSE100942, GSE45670, GSE26886, and GSE17351 were based on the platform of the GPL570 (Affymetrix Human Genome U133Plus 2.0 arrays, including 53 patients and 46 normal controls in total; GSE38129, GSE33426, GSE29001, and GSE20347 based on GPL571 (Affymetrix Human Genome U133A 2.0 Array), including 127 patients and 83 normal controls in total; GSE23400 based on GPL96 or GPL97 (Affymetrix Human Genome U133A or U133B 2.0 Array), and included 53 patients and 53 normal controls for GPL96, and 51 patients and 51 normal controls based on GPL97 platform. All of these datasets were applied to analyze the differentially expressed protein-coding genes (DEGs) in ESCC patients. For differentially expressed miRNAs (DEMs), the datasets GSE55857 were used, which was generated by Affymetrix Multispecies miRNA-2 Array (GPL14613) and contained 108 ESCC sample and 108 normal control. The details of all datasets used in present study are show in Supplementary Table S1.
Raw Data Set Preprocessing And Identification Of DEGs
For DEGs analysis, background correction, quantile normalization, and pro summarization of raw data, based on the Affymetrix platforms, were conducted with the affy package (R language, version 3.2.2). The sva package was used to remove the batch effects of data based on the same platform (GPL570 or GPL571). For the miRNA microarray dataset (GSE55857), the processed data were downloaded and used for the subsequent analyses. The LIMMA package in Bioconductor was used for identification of DEGs or DEMs by making a comparison of genes expression value for each group. The corresponding p-value after two independent sample t-test was defined as adjusted p-value (FDR), and cut-off criteria of DEGs as follows: p-value<0.05, |fold change (FC)|≥1.5.
Weight mRNA-miRNA Co-Expression Network Analysis
WGCNA is a systematic biological method to describe the gene-related patterns in microarray or RNA sequence data, which is an algorithm for finding highly correlated gene modules and identifying phenotypic related modules or gene clusters.11 In this work, expression data profile of DEGs and DEMs was used for construction of the weight mRNA-miRNA co-expression network. After testing whether the samples and genes are good or not, we used the “WGCNA” package in R language to construct the mRNA-miRNA co-expression network of these genes.12,13 First, the Pearson correlation matrix analysis was performed for all paired genes. Then the weighted adjacency matrix was constructed by using the power function connection strength = |correlation|β. β was a soft-thresholding parameter which could convert strong correlations between genes to weak correlations. After the adjacency matrix was transformed into topological overlap matrix (TOM), the network connectivity of a gene was calculated by do sums of its adjacency with all other genes. Finally, genes with similar expression patterns were classified into gene modules with a minimum size of 30. After each module was generated, we performed Gene Ontology (GO) enrichment analysis, and the Kyoto Encyclopedia of Genes and Genomes (KEGG) pathway enrichment analysis on gene modules to characterize modules related to Clinical information of ESCC.
Human ESCC Tissue Samples And Cell Line
Thirty ESCC patients and adjacent normal tissue samples were collected from Lianshui County People’s Hospital. All patients had provided written informed consent, which was conducted in accordance with the Declaration of Helsinki and approved by the Ethics Committee of Lianshui County People’s Hospital. The human ESCC cell line (ECA-109) was purchased by American Type Culture Collection (ATCC). ECA-109 cells were cultured in RPMI 1640 medium with 10% fetal bovine serum in a humidified incubator with 5% CO2 at 37°C.
RNA Extraction And Real-Time RT-PCR
Trizol reagent (Invitrogen, USA) was used to extract total RNA from ESCC tissue or ECA-109 cells. The expression level of miR-92-3p was detected by Taqman-based miRNA assay. Briefly, total 200ng RNA from tissue samples or cells were used for measurement of miR-92-3p. U6 was used as an internal control. Then 1.67μL total RNA was mixed with 1μL primers, 0.33μL MultiScribe Reverse Transcriptase, 0.05μL dNTPs, 0.5μL 10× reverse transcription buffer, 0.05μL RNase inhibitor; and made up to 5μL with Rnase-free H2O. Conditions of reverse transcription were as follows: 30 minutes at 16°C, 30 minutes at 42°C, and 5 minutes at 85°C. Then resulting cDNA was kept at −80°C until use. PCR was carried out by use of the TagMan Universal Master Mix II (Applied Biosystems) according to the manufacture’s instruction. The relative expression of miRNA was normalized to control and calculated using the 2−ΔΔCT threshold cycle method.
Protein Analysis Of The ESCC Cell Line
Western blotting was used for analysis for proteins of KLF4 and DSC2. In short, after RIPA buffer (Thermo Fisher Scientific, USA) was used to lyse the ECA-109 cells, Western blotting was conducted in accordance with the standard steps. KLF4 Rabbit Polyclonal (Proteintech Group, China) and DSC2 rabbit polyclonal antibody (Abcam, USA) were used as primary antibodies; The secondary antibodies were anti-rabbit horseradish peroxidase-conjugated (HRP) antibodies and purchased from Proteintech Group, Inc. The immune labeled proteins were identified by use of enhanced chemiluminescence (Beyotime Biotechnology, China); The expression of proteins was also confirmed by fluorescence confocal microscopy, the operation procedure as follows: Cells cultured on the coverslip were immobilized with 4% paraformaldehyde and then infiltrated with 0.3% Triton X-100. The slides were incubated with primary antibody at room temperature for 2 hours and incubated with the corresponding Alexa Fluor goat anti-rabbit IgG (Invitrogen). Staining images of each antibody under the same light were obtained by confocal laser scanning microscope (Zeiss Lsm510 Meta, Jena, Germany). Photographs stained with each antibody were randomly selected and analyzed by a person who was not aware of the research group.
Plasmids And Luciferase Reporter Assay
Nucleotide sequences corresponding to the portion of the wild type or mutant human KLF4 and DSC2 3ʹ-UTR fragments were synthesized by Sangon Biotech (Shanghai, China), and the predicted binding sites (seed sequences) for mir-92b-3p were included. Then the nucleotide fragments were inserted into an appropriate restriction cloning site of psi-CHECK-2 (Promega, USA) vector. 293T cells were used to be co-transfected with the vectors and miR-92b-3p mimics or negative control (NC) mimics. After 48 hours, the Dual-Luciferase Reporter Assay System (Promega, Madison, WI, USA) was used to assess relative luciferase activity.
Results
Identification Of DEGs And DEMs In ESCC
After batch correction of microarray data for each platform, The DEGs were analyzed using the LIMMA package for each platform. Using cut-off criteria, a total of 2,678 DEGs were identified by comparing gene expression patterns between ESCC patients and normal controls, including 1,447 upregulated genes and 1,231 downregulated genes based on GPL570 (Figures 1A and B; Supplementary Table S2). The DEGs are shown in the volcano map (Figure 1A), and the top 50 up- and down-regulated DEGs with minimum p-value are also visualized on a heatmap (Figure 1B). Based on the Affymetrix Human Genome U133A 2.0 Array (GPL571), 2,297 DEGs were identified, including 1,370 up and 927 down (Figures 1C and D; Supplementary Table S3). For GSE23400, which is based on GPL96 and GPL97, a total of 1,844 DEGs were found, of which 995 were increased and 849 were decreased (Figures 1E–H, Supplementary Tables S4 and S5). For all the expressed DEGs, 821 DEGs (451 up-regulated and 370 down-regulated) show differential expression in transcriptome analyses based on all three platforms (co.DEGs) (Figures 1I and J). Meanwhile, the dataset GSE55857, based on the Affymetrix Multispecies miRNA-2 Array (GPL14613), was used for analysis of the differential expressed microRNAs (DEMs). The data show that there are 328 human miRNAs which are significantly differently expressed in ESCC patients compared to adjacent mucosa, including 251 up-regulated DEMs and 77 down DEMs (Figures 1K and L, Supplementary Table S6).
 |
Figure 1 Identification of differently expressed genes (DEGs) and microRNA (miRNA) in ESCC. Volcano map of differently expressed genes or miRNA between ESCC and normal tissues based on GPL570 (A), GPL571 (C), GPL96 (E), GPL97 (G), and GPL14613 (K). Heatmap of the top 50 up-regulated and 50 down-regulated genes or miRNA based on GPL570 (B), GPL571 (D), GPL96 (F), GPL97 (H), and GPL14613 (L). The Venn plot of up-regulated expressed protein-coding genes (I) and down-regulated expressed protein-coding genes (J). |
GO And KEGG Enrichment Analysis
To further detect the molecular biological effect of the DEGs and DEMs in ESCC, we imported co-DEGs and DEMs to the online tool DAVID to explore GO terms and KEGG pathways. Figure 2A lists the significantly enriched GO terms (FDR <0.05). The results show that the co-DEGs and DEMs were enrichment in G1/S transition of mitotic cell cycle, cell division, and collagen catabolic process and extracellular matrix organization. This is consistent with the knowledge that defective function of cell division or cycle is a main cause for ESCC development and progression, and these GO terms also have been reported to play a crucial part in the process of ESCC occurrence, progression, and treatment.14,15 Five significantly enriched signaling pathways were identified and are illustrated in Figure 2B. It can be seen that most genes were enriched in the pathway of the MicroRNAs in cancer and Cell cycle. This result suggests that the differently expressed miRNAs are closely associated with development of ESCC.
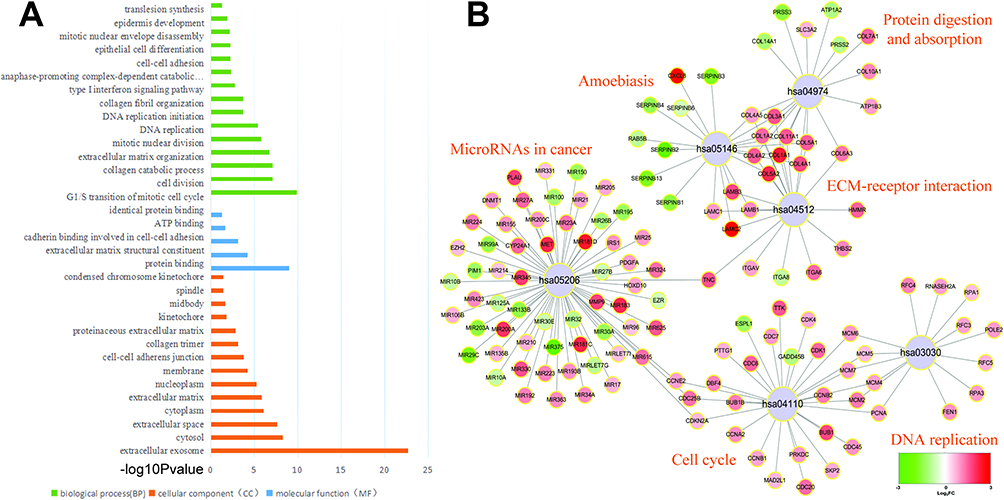 |
Figure 2 GO and KEGG enrichment analysis of co.DEGs and DEMs. (A) The GO terms in the enrichment analysis of the co.DEGs and DEMs. (B) The KEGG pathways in the enrichment analysis of the co.DEGs and DEMs. |
Construction Of WGCNA
WGCNA has been triumphantly devoted to several studies of neoplastic disease.11,16 In this work, WGCNA was used to explore the potential mechanisms of ESCC progression through mRNA and miRNA expression profile data of TCGA, which included 81 ESCC samples. Through the above-mentioned analyzing, a total of 4,023 DEGs and 328 DEMs were explored, based on more than one platform, then three DEGs were removed, which up-regulated in one platform but down-regulated in anther platform compared to controls. Furthermore, we only retained the genes on the basis of the criterion of FPKM >0 in more than 80% of the total samples, in order to reduce the false positive as much as possible and maintain a high expression level of genes in downstream analysis. Consequently, 3,841 genes (3,696 DEGs and 145 DEMs) were kept for subsequent study. Figure 3A shows the cluster of the 81 ESCC samples and clinic information of the patients, and no abnormal sample was found. Soft threshold (β) =6 was set according to Figure 3B for the purpose of a scale-free topology (R2>0.9), based on the topological overlap measure (TOM), was used to identify gene modules through a dynamic tree-cutting algorithm11 was used to detectgene co-expression modules based on a dissimilarity matrix. All modules were assigned to the corresponding color (Figure 3C). Our analysis shows that the 3,139 genes were eventually divided into 11 modules, with sizes ranging from 54 to 820 genes, and each module was assigned to a unique color. Meanwhile, 702 genes couldn’t be divided into any of the 11 modules, which are denoted as grey (Table 1; Figure 3C). The details of the gene in every module are listed in Supplementary Table S7.
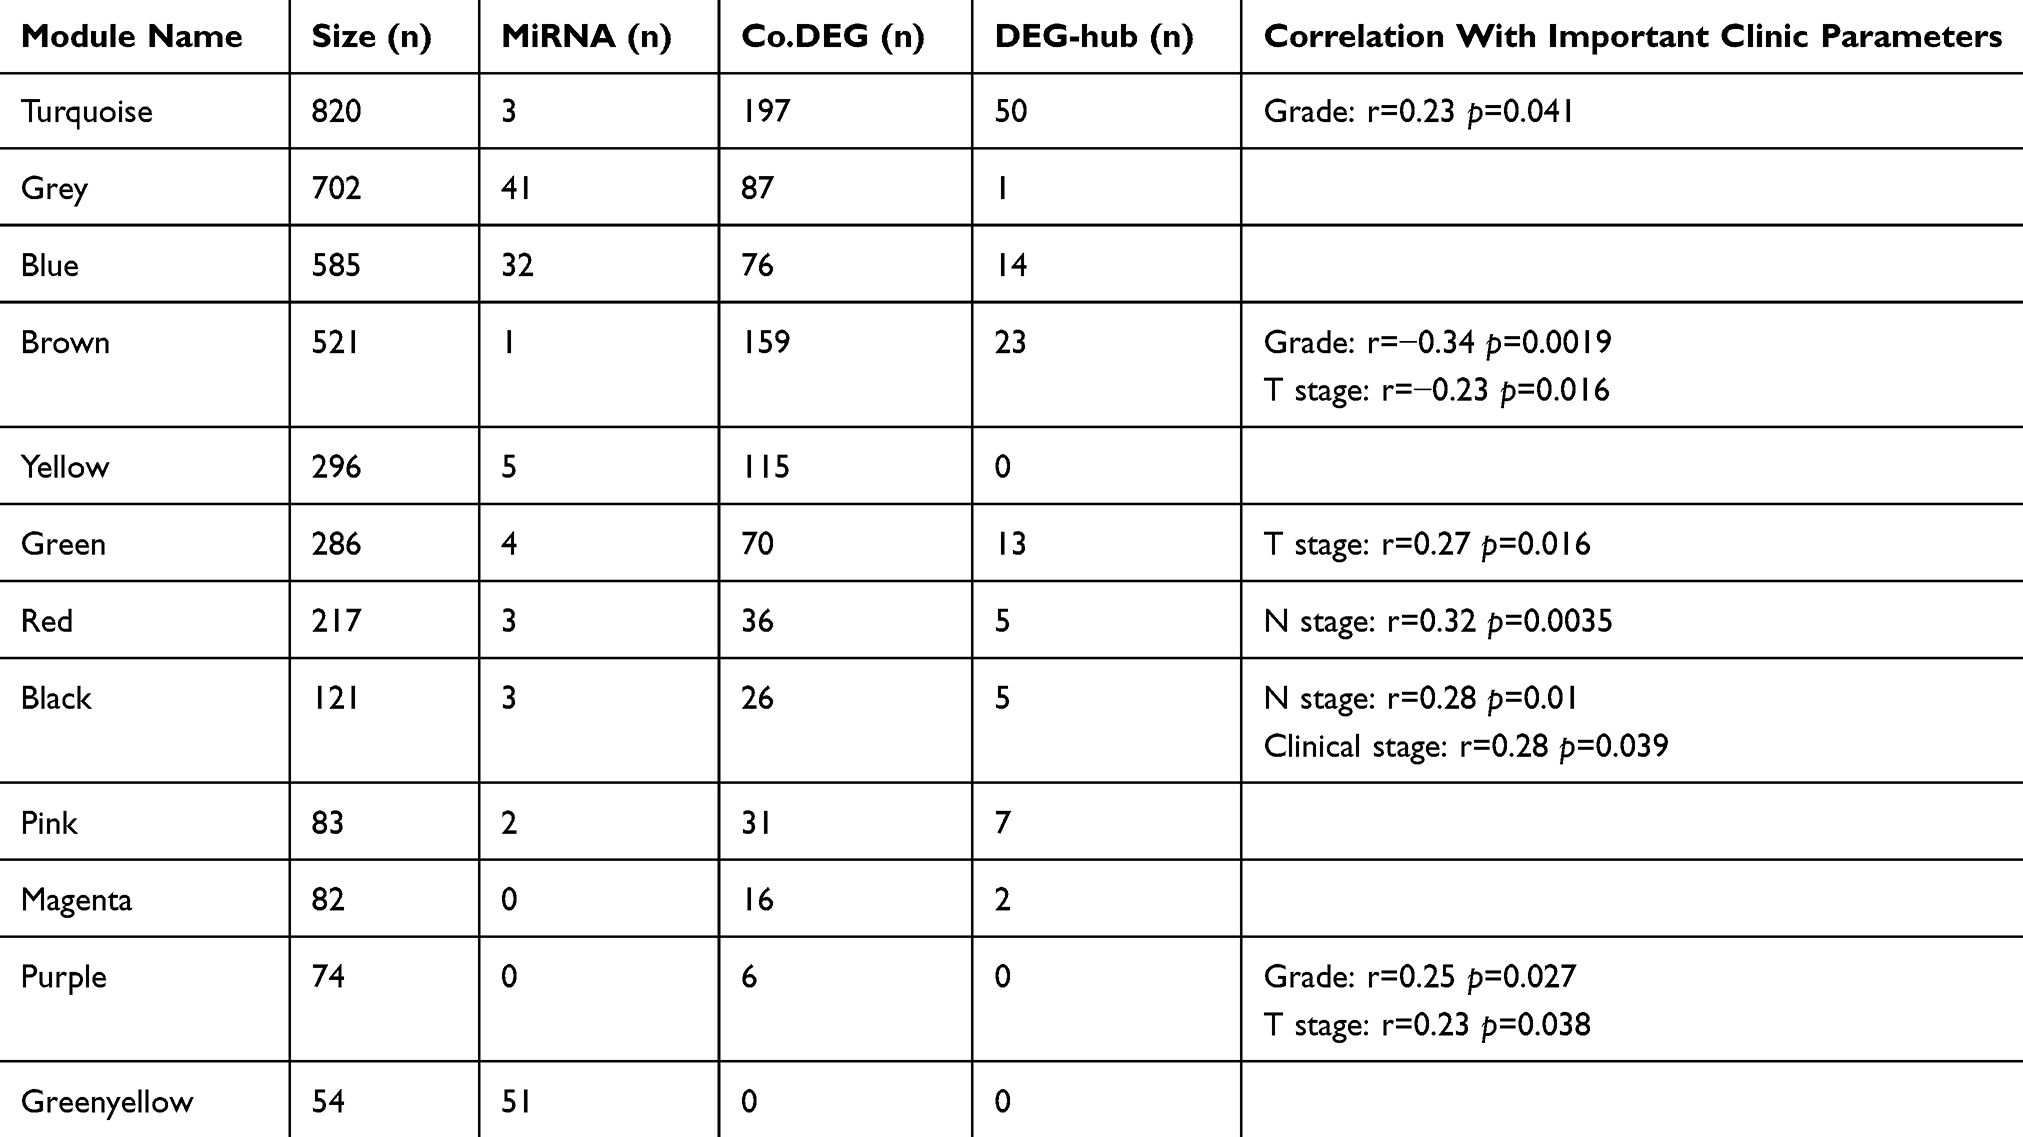 |
Table 1 Overview Of 11 Modules And Grey Module (Including Genes That Can’t Be Assigned To Any Modules) Constructed By WGCNA |
 |
Figure 3 WGCNA of esophageal squamous cell carcinoma. (A) Cluster result and clinic information of data samples. (B) Determination of soft threshold β of the adjacency function in the WGCNA algorithm. The left panel shows the scale-free topology fitting index (R2, y-axis) as a function of the soft-thresholding power (x-axis). The right panel displays the mean connectivity (degree, y-axis) as a function of the soft-thresholding power (x-axis). Red Arabic numerals in the panels denote different soft-thresholds. The red line in left panel means R2=0.9. There is a trade-off between maximizing scale-free topology model fit (R2) and maintaining a high mean number of connections. Thus, we set β=6. (C) Construction of the gene co-expression network. Each color represents a certain gene module. (D) Clustering tree based on the module eigengenes of modules. |
WGCNA identifies critical modules correlating with pathological parameters.
The co-expression network had three large modules (turquoise, blue, and brown) as well as some small modules, suggesting that the gene expression changes of most genes were strongly relevant. We explored the relationship between modules and clinical parameter containing pathological grade, TNM stage, and clinical stage as important clinical measurements. As shown in Figure 3D, pathological grade, TNM stage, and clinical stage did not gather together, but rather gathered with other different modules, suggesting deviation between these clinical arguments. Then correlation value of the eigengenes of each module were calculated to further analyze the relationship between each module and pathological parameters. The results showed that some modules were significantly correlated with certain clinical parameters, such as turquoise (p=0.041) and purple (p=0.027) module, which positively associated with tumor grade, while a significantly negative correlation was found between brown module and grade (p=0.0019); The green module was significantly correlated with Pathological T stage (p=0.016), and there is a strong positive correlation between red module and Pathological N stage (Figure 4A; Table 1). Interestingly, we have found that the green yellow and blue modules, which contained more miRNA than other modules, did not show any correlation with pathological parameters. It might be because most miRNA negatively regulate gene expression of other modules in posttranscriptional level.
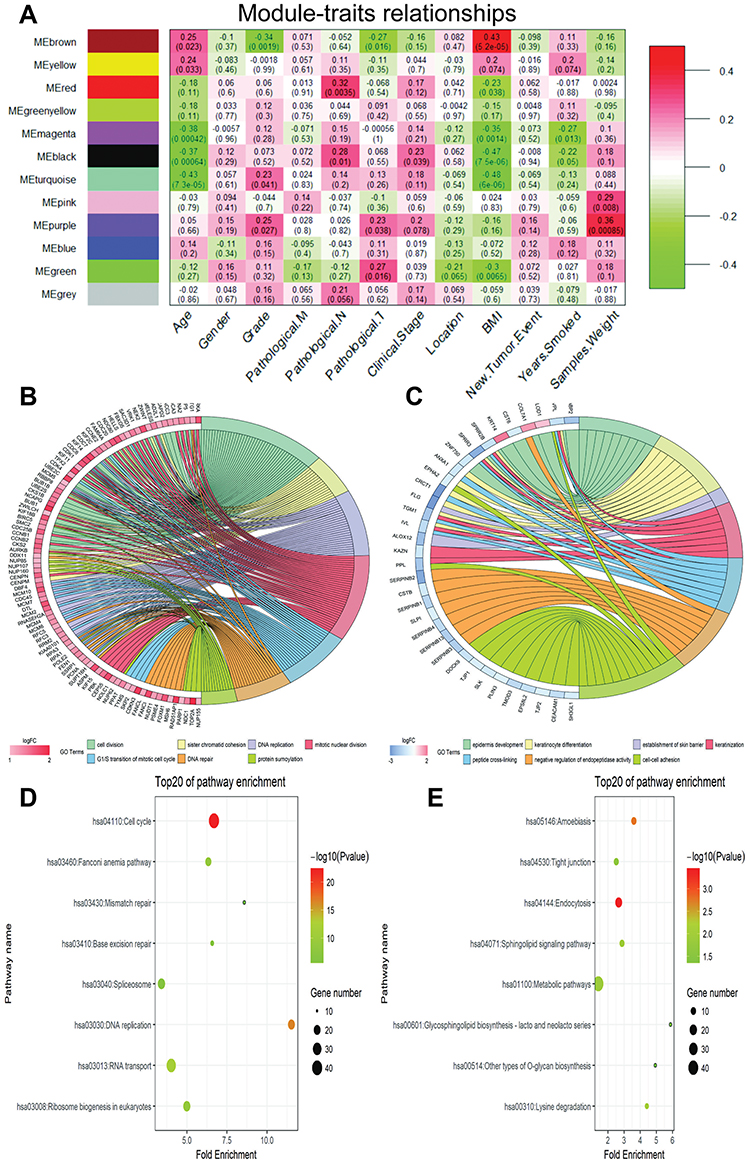 |
Figure 4 WGCNA identified critical modules correlating with pathological parameters. (A) Correlation between modules and traits. The upper number in each cell refers to the correlation efficient of each module in the trait, and the lower number is the corresponding p-value. The top seven Gene Ontology (GO) biological process (BP) terms in the enrichment analysis of genes in the turquoise (B) and brown modules (C), the gene symbol listed in the figures were co.DEGs included in specific BP term; the top eight Kyoto Encyclopedia of Genes and Genomes (KEGG) pathways in the enrichment analysis of genes in the turquoise (D) and brown modules (E). |
Including the most genes, turquoise and brown modules show significantly correlation with pathological grade. To deeply explore the molecular biological effects and pathways of these genes in both of them, enrichment analyses of GO terms and KEGG pathway were conducted. Figures 4B and C display the top seven GO BP terms for turquoise and brown modules, respectively. The turquoise module, which was the largest module and contains 197 co.DEGs, shows functional enrichment in cell division, sister chromatid cohesion, and so on (Figure 4B; Supplementary Table S8). Pathway analysis has reached similar results which are enriched in Cell cycle, DNA replication, RNA transport, and so on (Figure 4D; Supplementary Table S9). For the brown module, which showed a significantly negative correlation with grade, genes in the module are significantly enriched in processes like epidermis development, keratinocyte differentiation, and establishment of skin barrier (Figure 4C; Supplementary Table S8), and significant KEGG pathways enriched in the brown module included Endocytosis, Amoebiasis and Metabolic pathways (Figure 4E; Supplementary Table S9).
Hub-Based Analysis
Since the turquoise and brown modules were identified as strongly associated with grade, the correlation coefficient between gene significance (GS) and module membership (MM) were calculated. As shown in Figures 5A and B, a very significant correlation was found between the GS and MM, suggesting that the genes in the turquoise or brown module were inclined to be significantly correlation with grade. It is widely accepted that the hub nodes with a high level of connectivity are the core to the network architecture11 and the genes more concentrated in networks tend more to be key drivers to specific molecular biological function than peripheral genes.17 In the present work, the hub genes of each module were defined as the top 10% genes with the highest intramodular connectivity.18 Figures 5C and D showthe weighted co-expression networks of the turquoise or brown module, which displayed only connections with weight (w) above 0.1. It can be found that the trend of the relative expression of most hub genes (Figures 5C and D, diamond nodes) are consistent and can display high connectivity with adjacent genes whose functions are the same as analysis results of GO and KEGG.
 |
Figure 5 Hub-based analysis. (A, B) scatter plots of gene significance (GS) for pathological grade versus the module membership (MM) in the turquoise (A) and brown (B) modules. (C, D) The cytoscape network visualization of genes in turquoise (C) and brown (D) modules, in which only edges with weight (W) above a threshold of 0.1 are displayed, respectively. The diamond nodes denote the hub genes which were the 10% of genes with the highest connectivity. The nodes with turquoise border denote the differentially expressed genes based all platforms (co.DEG), the color of nodes represent the log2 Fold Change (FC) value. (E–H) The correlation between pathology grade and has-let-7i (E), has-mir-181c (F), has-mir-181d (G), or has-mir-92b (H); (I–L) top 50 significantly inverse correlated genes with has-let-7i (I), has-mir-181c (J), has-mir-181d (K), and has-mir-92b (L). Brown nodes denote the genes included in brown module, the blue nodes denote the genes classified to the other modules. |
It is well known that miRNAs widely participate in the development and progression of multiple tumor diseases. In the present work, we aimed to explore the key miRNAs and their regulatory mechanism in ESCC, Therefore, four miRNAs included in the turquoise and brown modules were worthy of our attention and selected to further analyze: has-let-7i, has-mir-181c, has-mir-181d, and has-mir-92b. First the correlation analyses between each miRNA and grade were conducted, as shown in Figures 5E–H, the three miRNAs (has-let-7i, has-mir-181c, and has-mir-181d) included in turquoise module positively related to grade which is in accord with the turquoise module. Nevertheless has-mir-92b, included in the brown module, also positively correlated with pathological grading which is the opposite of the brown module. To further explore the regulation mechanism of these miRNAs, the top 50 negatively associated genes of these four miRNAs were identified. As shown in Figures 5I–L, there were many genes included in the brown module (brown node) which may regulated by these miRNAs, especially hsa-mir-92b, the only miRNA in brown. Therefore, it is reasonable to hypothesize that hsa-mir-92b may be a candidate biomarker in the diagnosis and involved in ESCC development by regulated genes in the brown module.
Expression And Role Of Oncogenic miRNA-92b-3p In ESCC
In order to explore the potential functions of has-mir-92b, which was the only miRNA included in the brown module, Target Scan 7.2 was applied to predict the target genes of miR-92b-3p and miR-92b-5p. The results show that several genes that significantly inversely correlated with has-mir-92b were identified as potential target genes of miR-92b-3p, as follows: FCHO2, ESRP1, GRHL1, TOB1, KLF4, and DSC2 (Figure 6A). Meanwhile, the high negative correlation between the pathological grade and the expression of GRHL1, TOB1, KLF4, and DSC2 were confirmed by Spearman correlation coefficient and trend chart (Figure 6A). To further validate the relationship between ESCC and miR-93b-3p in patients, 30 ESCC and matched distal normal tissue samples were used to detect the gene expression of miR-92b-3p and potential target genes (KLF4 and DSC2). As shown in Figures 6B and C, the expression of miR-92b-3p was significantly up-regulated in ESCC tissue samples compared to the matched distant normal tissues, while immunohistochemistry showed that expression of DSC2 and KLF4 protein reduced in the ESCC tissues. Next, in order to explore the effect of up-regulated miR-92b-3p, we altered miR-92b-3p expression in esophageal cancer cell lines Eca109 by use of miR-92b-3p mimics. After transfection with mimics for 48 hours, flow cytometry was applied to analyze cell cycle distribution, the data show that miR-92b-3p overexpression shortened G0/G1 phase and fastened cell cycle progression (Figure 6D). Furthermore, as shown in Figures 6E and F, compared with the negative control, overexpression of miR-92b-3p significantly promoted migration and invasion of the Eca109 cell. Beyond that, the protein expression levels of KLF4 and DSC2 were observed dramatically down-regulated in miR-92b-3p overexpressing cells after transfection with miR-92b-3p mimic for 48 hours by confocal laser scanning microscope and Western blot (Figures 6G and H). Finally, luciferase reporter assay was performed to test whether KLF4 and DSC2 were direct target of miR-92b-3p. As a result, compared to the negative mimic control, miR-92b-3p mimics significantly decreased reporter gene luciferase activity of both DSC2 and KLF4. Meanwhile, mutations of the potential miR-92b-3p binding sites of KLF4 and DSC2 3′-UTRs could not alter luciferase activity, implying that miR-92b-3p target the KLF4 and DSC2 by binding the predicted site (Figure 6I).
 |
Figure 6 Expression and role of oncogenic miRNA-92b-3p in esophageal squamous cell carcinoma. (A) Upper panel: The correlation between pathological grade and the expression of potential target genes. Down panel: The correlation between expression of has-mir-92b and the expression of potential target genes. (B) The expression level of miR-92b-3p is significantly up-regulated in ECSS tumor tissue compared to normal adjacent tissue; ***p<0.001; (C) Representative images of positive staining of DSC2 and KLF4 in normal tissues (left) and negative staining of DSC2 and KLF4 in cancer tissues (right). (D) Cell cycle progression was assayed by flow cytometry after transfection with miR-92b mimic for 48h, *p<0.05. (E) The invasive ability of cell lines was performed by transwell assay. (F) Cell migratory ability as determined using wound healing assay. (G, H) immunofluorescence (G) and Western blot (H) analysis was performed for DSC2 and KLF4 expression in ECA-109 cells after transfection with miR-92b-3p mimic or negative control mimic. (I) relative luciferase activity of ECA-109 cells after co-transfection with wild type (wt) or mutant (mut) KLF4(left) and DSC2(right) 3′-UTR reporter genes and miR-92b-3p mimics, *p<0.05. |
Discussion
As a global health problem, ESCC is a highly invasive malignancy with early lymphatic and hematogenous metastasis.19 Although progress has been made in the diagnosis and treatment of ESCC, the prognosis is still poor. About 10% of patients are diagnosed at a later stage with tumors that have spread to other organs. As a result, patients do not have the chance to perform surgery.4,20 A large number of studies have shown that the occurrence and development of ESCC is the result of multiple factors, multiple steps, and multiple genes.21 Abnormal expression of tumor-related genes is one of the key mechanisms involved in the development of ESCC through the accumulation of genetic and epigenetic abnormalities.22 Therefore, the exploration of new genes involved in the development of ESCC has important clinical value to further understand the occurrence and development of ESCC.
In the present study, gene expression profiles of 233 ESCC patient’s samples and 182 normal controls were retrieved from the GEO dataset based on GPL570, GPL571 and GPL96 or GPL97 platforms used for DEGs. Meanwhile, 108 ESCC samples and 108 paired normal controls based on GPL16413 were used for analysis of DEMs. As a consequence, 4,023 DEGs and 328 DEMs were identified with cut-off criterion, particularly 821 genes were significantly altered expression base on all platforms. Moreover, enrichment analysis was also conducted to find ESCC-associated biological functions and pathways. The results of GO analysis showed that DEGs and DEMs were significantly enriched in the G1/S transition of mitotic cell cycle, cell division, and the collagen catabolic process. Extensive studies have critically reviewed the role of the G1/S transition of mitotic cell cycle in the occurrence and development of multiple tumor diseases,23,24 meanwhile cell division regulators are considered attractive targets in ESCC therapy.25,26 Furthermore, the enriched KEGG pathways of DEGs and DEMs in ESCC showed significantly enriched MicroRNAs in cancer, which imply that miRNAs play a very significant role in carcinogenesis, and the dysregulation of miRNAs is closely associated with ESCC progression. Identification of DEGs and DEMs provides various effective targets for future research into the biologic mechanisms and biomarkers.
It is generally believed that co-expressed genes were inclined to be co-regulated and have similar functions.27 Therefore, identification of co-expressed protein-coding genes and miRNAs can help determine the function of pathogenic genes and the relationship between mRNA and miRNA.28 However, few studies used it to investigate the mRNA and miRNA related to development of ESCC. The purpose of this study was to explore molecular insights into tumorigenesis and development of ESCC and better understand the relationship between genes expression data (included mRNA and miRNA), TNM stage, pathological grade, or any other clinic information. As a result, 11 genes modules with amounts ranging from 54 to 820 genes were obtained by use of WGCNA. As shown in Figure 4, the key finding of our study is that several modules were found to have a stronger correlation with clinic information, such as turquoise (p=0.041) and purple (p=0.027) modules, which are shown to be positively associated with tumor grade, while a significantly negative correlation was identified between the brown module and grade (p=0.0019); The green module was related to Pathological T stage (p=0.016) and there is a strong positive correlation between the red module and Pathological N stage. What’s more, the GO and pathway enrichment analysis indicated that genes in the turquoise and brown modules were mainly in Cell cycle, DNA replication, cell division, Metabolic pathways, cell-cell adhesion, and so on. These results are very consistent with previous multiple previous research suggesting the importance of these BP terms or pathways in the growth and spread of a variety of tumors.29,30
Since the turquoise and brown gene modules had the highest correlation with grade, the genes in these modules were chosen to analyze for hub genes with a cut-off of top 10% intramodular connectivity. It can be seen in Figures 5C and D that the trend of the expression of most hub genes are consistent and some of the hub genes have been reported to have functions consistent with the analysis results of GO and KEGG or a relationship between modules and clinic information. Taking the turquoise module as an example, which was significantly enriched in cell cycle, DNA replication, and cell division, some of the hub genes have also been reported to participate in a similar process, such as CDC6, which it has been reported can be used as a significant biomarker to predict malignant potential of low-grade cervical smears.31 Another hub gene, TPX2, is a microtubule-related protein and necessary for mitosis and spindle assembly. Previous studies have shown that TPX2 is up-regulated in a variety of human tumors and promotes tumor tumorigenesis.32,33 These observations further support the idea that the proposed function of unknown genes may be inferred from genetic similarity expressed under many biological conditions. Meanwhile, some unreported hub genes could also provide helpful information for possible biomarkers in further experiments owing to their significant dysregulation in the ESCC patients and share a high connectivity in grade-associated modules.
Since the GS and MM of the turquoise or brown modules exhibit a very significant correlation, the genes in these two modules tend to be highly correlated with grade. Finally, the only miRNA included in the brown module, has-mir-92b, were selected for further analysis. Previous studies have implicated that the mature form of has-mir-92b (miR-92b-3p or miR-92b-5p) are closely related with progression and metastasis of multiple tumors. For example, Lei et al34 found that expression of miR-92b was significantly up-regulated in human non-small cell lung cancer (NSCLC) and promoted NSCLC progression partially by targeting RECK. In human bladder cancer, miR-92b targets DAB2IP to promote cell migration and invasion of bladder cancer cells. In the present study, miR-92b has also been validated as a cancer-promoting gene by fastening cell cycle progression and promoting cell invasion and migration. In order to explore the regulating mechanism of miR-92b, further analysis reveals that KLF4 and DCS2 included in the brown module were predicted as potential targets of miR-92b-3p, and show a significantly inverse correlation with expression of has-mir-92b and pathology grade of patients. Consistent with our results, previous studies have shown that down-regulated KLF4 in ESCC was significantly related with poor differentiation, and inhibition of KLF4 prevented the inhibition of G1-S transition induced by sodium butyrate.35 A recent study by Chen et al36 showed that overexpression of KLF4 can enhance the sensitivity of cisplatin to ESCC cells by inducing apoptosis and cell cycle arrest. DSC2, also known as desmocollin 2 or ARVD11, is a member of the desmocollin protein subfamily and has been found to be reduced in several types of cancer.37 Previous research had shown down-regulated DSC2-2 promotes ESCC cell aggressiveness by a mechanism that controls cell–cell attachment and cytoskeleton rearrangement and activating beta-catenin signaling.38,39 Note that KLF4 and DCS2 also identified as one of co.DEGs or hub genes of the brown module as through the above analysis. Finally, in this study, we confirmed that miR-92-3p directly binds to 3′-UTR of the KLF4 and DCS2 transcript and prevented protein expression by Western blot and luciferase reporter assay. For the above, the present work explored that miR-92b-3p served as an oncogenic gene in development and progression of ESCC, partially by inhibiting KLF4 and DCS2.
In summary, through the analysis of the microarray data set in the GEO database, the protein coding genes and miRNAs with abnormal regulation in ESCC were clearly elucidated in the present work. Then we have presented a novel approach by use of WGCNA to detect the differentially expressed protein coding genes and miRNAs modules implicated in the ESCC process. As a consequence, has-mir-92b, the only miRNA in the brown module, has a good positive correlation with grade, while being significantly negative with the potential target gene in the same module (KFL4 and DCS2). Finally, experiments confirmed that the up-regulated miR-92b-3p can shorten the G0/G1 phase and promote migration and invasion of cells by directly targeting KLF4 and DSC2. In all of the above, WGCNA is an effective strategy to system biology. By this procedure, our work enhanced the understanding of the ESCC transcriptomics, which might inspire future research into occurrence and development of ESCC.
Acknowledgments
This work was supported by the National Natural Science Foundation of China (81600549), the Natural Science Research Project of Huai’an City (HAB201949, HAB201737), the Medical Scientific Research Project of Health and Family Planning Commission of Jiangsu Province (Z2018026), the Medical and Health Science and Technology Innovation Project of Fujian (2015-CXB-1) to Zheng J, and the project for Cultivating Young and Middle-aged Talents of Fujian (2018-ZQN-11) to Lin X.
Disclosure
The authors report no conflicts of interest in this work.
References
1. Ferlay J, Soerjomataram I, Dikshit R, et al. Cancer incidence and mortality worldwide: sources, methods and major patterns in GLOBOCAN 2012. Int J Cancer. 2015;136(5):E359–E386. doi:10.1002/ijc.29210
2. Kim KH, Chang JS, Cha JH, et al. Optimal adjuvant treatment for curatively resected thoracic esophageal squamous cell carcinoma: a radiotherapy perspective. Cancer Res Treat. 2017;49(1):168–177. doi:10.4143/crt.2016.142
3. Umar SB, Fleischer DE. Esophageal cancer: epidemiology, pathogenesis and prevention. Nat Clin Pract Gastroenterol Hepatol. 2008;5(9):517–526. doi:10.1038/ncpgasthep1223
4. Siegel R, Ma J, Zou Z, Jemal A. Cancer statistics, 2014. CA Cancer J Clin. 2014;64(1):9–29. doi:10.3322/caac.21208
5. Butter R, Lagarde SM, van Oijen MGH, et al. Treatment strategies in recurrent esophageal or junctional cancer. Dis Esophagus. 2017;30(9):1–9. doi:10.1093/dote/dox082
6. Fu HL, Wu DP, Wang XF, et al. Altered miRNA expression is associated with differentiation, invasion, and metastasis of esophageal squamous cell carcinoma (ESCC) in patients from Huaian, China. Cell Biochem Biophys. 2013;67(2):657–668. doi:10.1007/s12013-013-9554-3
7. Sakai N, Samia-Aly E, Barbera M, Fitzgerald R. A review of the current understanding and clinical utility of miRNAs in esophageal cancer. Semin Cancer Biol. 2013;23(6Pt B):512–521. doi:10.1016/j.semcancer.2013.08.005
8. Sang M, Gu L, Liu F, et al. Prognostic significance of MAGE-A11 in esophageal squamous cell carcinoma and identification of related genes based on DNA microarray. Arch Med Res. 2016;47(3):151–161. doi:10.1016/j.arcmed.2016.06.001
9. Chen B, Fang WK, Wu ZY, et al. The prognostic implications of microvascular density and lymphatic vessel density in esophageal squamous cell carcinoma: comparative analysis between the traditional whole sections and the tissue microarray. Acta Histochem. 2014;116(4):646–653. doi:10.1016/j.acthis.2013.12.003
10. Yao J, Huang JX, Lin M, et al. Microarray expression profile analysis of aberrant long non-coding RNAs in esophageal squamous cell carcinoma. Int J Oncol. 2016;48(6):2543–2557. doi:10.3892/ijo.2016.3457
11. Langfelder P, Horvath S. WGCNA: an R package for weighted correlation network analysis. BMC Bioinformatics. 2008;9:559. doi:10.1186/1471-2105-9-559
12. Mason MJ, Fan G, Plath K, Zhou Q, Horvath S. Signed weighted gene co-expression network analysis of transcriptional regulation in murine embryonic stem cells. BMC Genomics. 2009;10:327. doi:10.1186/1471-2164-10-327
13. Zhai X, Xue Q, Liu Q, Guo Y, Chen Z. Colon cancer recurrenceassociated genes revealed by WGCNA coexpression network analysis. Mol Med Rep. 2017;16(5):6499–6505. doi:10.3892/mmr.2017.7412
14. Yan L, Dong X, Gao J, et al. A novel rapid quantitative method reveals stathmin-1 as a promising marker for esophageal squamous cell carcinoma. Cancer Med. 2018;7(5):1802–1813. doi:10.1002/cam4.1449
15. Li Z, Wu X, Gu L, et al. Long non-coding RNA ATB promotes malignancy of esophageal squamous cell carcinoma by regulating miR-200b/Kindlin-2 axis. Cell Death Dis. 2017;8(6):e2888. doi:10.1038/cddis.2017.518
16. Zhang B, Horvath S. A general framework for weighted gene co-expression network analysis. Stat Appl Genet Mol Biol. 2005;4:Article17. doi:10.2202/1544-6115.1128
17. Yang Y, Han L, Yuan Y, Li J, Hei N, Liang H. Gene co-expression network analysis reveals common system-level properties of prognostic genes across cancer types. Nat Commun. 2014;5:3231. doi:10.1038/ncomms5972
18. Li S, Li B, Zheng Y, Li M, Shi L, Pu X. Exploring functions of long noncoding RNAs across multiple cancers through co-expression network. Sci Rep. 2017;7(1):754. doi:10.1038/s41598-017-00856-8
19. Ferlay J, Shin HR, Bray F, Forman D, Mathers C, Parkin DM. Estimates of worldwide burden of cancer in 2008: GLOBOCAN 2008. Int J Cancer. 2010;127(12):2893–2917. doi:10.1002/ijc.25516
20. Stoner GD, Wang LS. Chemoprevention of esophageal squamous cell carcinoma with berries. Top Curr Chem. 2013;329:1–20. doi:10.1007/128_2012_343
21. Hulscher JB, van Sandick JW, Tijssen JG, Obertop H, van Lanschot JJ. The recurrence pattern of esophageal carcinoma after transhiatal resection. J Am Coll Surg. 2000;191(2):143–148.
22. Chen G, Wang Z, Liu XY, Liu FY. Recurrence pattern of squamous cell carcinoma in the middle thoracic esophagus after modified Ivor-Lewis esophagectomy. World J Surg. 2007;31(5):1107–1114. doi:10.1007/s00268-006-0551-1
23. Shen Y, Sherman JW, Chen X, Wang R. Phosphorylation of CDC25C by AMP-activated protein kinase mediates a metabolic checkpoint during cell-cycle G2/M-phase transition. J Biol Chem. 2018;293(14):5185–5199. doi:10.1074/jbc.RA117.001379
24. Wang SA, Wang YC, Chuang YP, et al. EGF-mediated inhibition of ubiquitin-specific peptidase 24 expression has a crucial role in tumorigenesis. Oncogene. 2017;36(21):2930–2945. doi:10.1038/onc.2016.445
25. Gu ZD, Shen LY, Wang H, et al. HOXA13 promotes cancer cell growth and predicts poor survival of patients with esophageal squamous cell carcinoma. Cancer Res. 2009;69(12):4969–4973. doi:10.1158/0008-5472.CAN-08-4546
26. Liu J, Mao Y, Zhang D, et al. MiR-143 inhibits tumor cell proliferation and invasion by targeting STAT3 in esophageal squamous cell carcinoma. Cancer Lett. 2016;373(1):97–108. doi:10.1016/j.canlet.2016.01.023
27. Stuart JM, Segal E, Koller D, Kim SK. A gene-coexpression network for global discovery of conserved genetic modules. Science. 2003;302(5643):249–255. doi:10.1126/science.1087447
28. Signal B, Gloss BS, Dinger ME. Computational approaches for functional prediction and characterisation of long noncoding RNAs. Trends Genet. 2016;32(10):620–637. doi:10.1016/j.tig.2016.08.004
29. Tokuda E, Itoh T, Hasegawa J, et al. Phosphatidylinositol 4-phosphate in the Golgi apparatus regulates cell-cell adhesion and invasive cell migration in human breast cancer. Cancer Res. 2014;74(11):3054–3066. doi:10.1158/0008-5472.CAN-13-2441
30. Li C, Wang Q, Ma J, et al. Integrative pathway analysis of genes and metabolites reveals metabolism abnormal subpathway regions and modules in esophageal squamous cell carcinoma. Molecules. 2017;22:10. doi:10.3390/molecules22101599
31. Saritha VN, Veena VS, Jagathnath Krishna KM, Somanathan T, Sujathan K. Significance of DNA replication licensing proteins (MCM2, MCM5 and CDC6), p16 and p63 as markers of premalignant lesions of the uterine cervix: its usefulness to predict malignant potential. Asian Pac J Cancer Prev. 2018;19(1):141–148. doi:10.22034/APJCP.2018.19.1.141
32. Chu TLH, Connell M, Zhou L, et al. Cell Cycle-dependent tumor engraftment and migration are enabled by Aurora-A. Mol Cancer Res. 2018;16(1):16–31. doi:10.1158/1541-7786.MCR-17-0417
33. Ma S, Rong X, Gao F, Yang Y, Wei L. TPX2 promotes cell proliferation and migration via PLK1 in OC. Cancer Biomark. 2018. doi:10.3233/CBM-171056
34. Lei L, Huang Y, Gong W. Inhibition of miR-92b suppresses nonsmall cell lung cancer cells growth and motility by targeting RECK. Mol Cell Biochem. 2014;387(1–2):171–176. doi:10.1007/s11010-013-1882-5
35. He H, Li S, Hong Y, et al. Kruppel-like factor 4 promotes esophageal squamous cell carcinoma differentiation by up-regulating keratin 13 expression. J Biol Chem. 2015;290(21):13567–13577. doi:10.1074/jbc.M114.629717
36. Chen C, Ma Z, Zhang H, Liu X, Yu Z. Kruppel-like factor 4 enhances sensitivity of cisplatin to Esophageal Squamous Cell Carcinoma (ESCC) cells. Med Sci Monit. 2017;23:3353–3359. doi:10.12659/msm.902583
37. Kamekura R, Kolegraff KN, Nava P, et al. Loss of the desmosomal cadherin desmoglein-2 suppresses colon cancer cell proliferation through EGFR signaling. Oncogene. 2014;33(36):4531–4536. doi:10.1038/onc.2013.442
38. Fang WK, Liao LD, Zeng FM, et al. Desmocollin2 affects the adhesive strength and cytoskeletal arrangement in esophageal squamous cell carcinoma cells. Mol Med Rep. 2014;10(5):2358–2364. doi:10.3892/mmr.2014.2485
39. Fang WK, Liao LD, Li LY, et al. Down-regulated desmocollin-2 promotes cell aggressiveness through redistributing adherens junctions and activating beta-catenin signalling in oesophageal squamous cell carcinoma. J Pathol. 2013;231(2):257–270. doi:10.1002/path.4236
 © 2019 The Author(s). This work is published and licensed by Dove Medical Press Limited. The
full terms of this license are available at https://www.dovepress.com/terms
and incorporate the Creative Commons Attribution
- Non Commercial (unported, 3.0) License.
By accessing the work you hereby accept the Terms. Non-commercial uses of the work are permitted
without any further permission from Dove Medical Press Limited, provided the work is properly
attributed. For permission for commercial use of this work, please see paragraphs 4.2 and 5 of our Terms.
© 2019 The Author(s). This work is published and licensed by Dove Medical Press Limited. The
full terms of this license are available at https://www.dovepress.com/terms
and incorporate the Creative Commons Attribution
- Non Commercial (unported, 3.0) License.
By accessing the work you hereby accept the Terms. Non-commercial uses of the work are permitted
without any further permission from Dove Medical Press Limited, provided the work is properly
attributed. For permission for commercial use of this work, please see paragraphs 4.2 and 5 of our Terms.